Abstract
Due to the increase in pollution, the number of deaths caused by lung disease is rising rapidly. It is essential to predict the disease in earlier stages by means of high-level knowledge and acquaintance. Deep learning-based lung cancer prediction plays a vital role in assisting the medical practioners for diagnosing lung cancer in earlier stage. Computer-Aided diagnosis is considered to bring a boost to the field of medicine by tying it to automated systems. In this research paper, several models are experimented by using chest X-ray image or CT scan as an input to detect a particular disease. This research work is carried out to identify the best performing deep learning techniques for lung disease prediction. The performance of the method is evaluated using various performance metrics, such as precision, recall, accuracy and Jaccard index.
Keywords: Deep learning, Lung cancer detection, Neural networks, Transfer learning
Introduction
The present time of world deals with several polluting substances from all sides of the environment. The current lifestyle of the advancing world is the major factor that not just affects the body but affects the mind and mental peace too. As per World Health Organization (WHO) report, four out top ten deadliest diseases are related to the lungs (https://www.healthline.com/health/top-10-deadliest-diseases#Overview). Lower respiratory infections are the world’s most deadly communicable disease which has been ranked as one among the four for the causes of death. Even though the number of death in 2019 has decreased by about 46,000 in 2000, still the number of 2.6 million is alarming. Considering other lungs related diseases like lung cancer has got a upraise from 1.2 million to 1.8 million and is at peak of the world’s 6th most death-causing disease (https://www.who.int/en/news-room/fact-sheets/detail/the-top-10-causes-of-death). Many countries as deficient in providing sufficient medicines and instruments for all the people living in the country. Developing countries like India are still deficient in proper medical support. It is also noticed from the research that, there has been a significant number of death due to Chronic Obstructive Pulmonary Disease (COPD) and Lower respiratory diseases (https://www.who.int/en/news-room/fact-sheets/detail/the-top-10-causes-of-death; https://www.pharmatutor.org/pharma-news/doctors-population-in-india). Lung diseases are not common for all people and they may vary based on physical and environmental factors. One of the considerable factors of infection is due to travel. It has been seen that migrant workers who travel more often have some different symptoms which are based on the place of travel destination and the type of travel. The consideration of viruses with special concern with travel includes diseases like Middle East Respiratory Syndrome (MERS) and diseases caused by highly pathogenic avian influenza viruses (https://wwwnc.cdc.gov/travel/yellowbook/2020/travel-related-infectious-diseases/middle-east-respiratory-syndrome-mers).
Pneumonia is one of the most prevalent diseases which are caused by the lower respiratory tract. These infections can cause fever, dyspnea, chest pain, headache, cough, etc. (https://wwwnc.cdc.gov/travel/yellowbook/2020/travel-by-air-land-sea/deep-vein-thrombosis-and-pulmonary-embolism). Over time exposure to smoking is one of the major causes of the destruction of airways causing COPD which includes emphysema and chronic bronchitis. Acetone, Acetic acid, Ammonia, Arsenic, Benzene, Butane, Cadmium, Lead, and Nicotine are some highly toxic elements that are released while smoking (https://www.lung.org/quit-smoking/smoking-facts/whats-in-a-cigarette). The toxins in cigarettes can causes swelling in air tubes and destroying air sacs of lungs. These factors are contributing elements of COPD. Although most lung diseases are caused by physical factors, there are some diseases such as emphysema which is genetic in the person (https://www.lung.org/lung-health-diseases/lung-disease-lookup/copd/what-causes-copd).
The most familiar of these diseases are COPD, bronchial asthma, pneumonia, lung cancer and tuberculosis. Several flourishing machine learning (ML) techniques have been used in recent years to reduce the error rate. Although masterful systems are used in practice in clinical backdrops, machine learning systems are still used today for exploratory objectives. Machine learning algorithm uses mostly computer vision for the purpose of image identification. The model needs to be trained on a large number of dataset which generates the features of the particular class of disease and generates the model which is further used for the purpose of validation. Since the model preparation is completely based on data, the deep learning models performances are evaluated using various data set and the results are tabulated (Zheng et al. 2020; Tran et al. 2019).
Any deep learning-based model depends on the immense use of available data. The most challenging job to train a deep learning model is the phase of data collection. Considering the medical diagnosis model, this phase becomes even more difficult due to unavailability of data on internet. The medical data is kept confidential due to privacy policy and the misuse of data. The dataset to be used for the purpose of training must be from a trusted source, since it will affect the overall model accuracy and correctness of the model. The image collected for the purpose of training must be of high quality so that all the features of the image is captured properly by the model.
There are various models available for the purpose of training a deep learning model, choosing a model depends on the type of model architecture based on the task to be performed and the selection of correct hyper parameters for modelling. The model selection depends on the question of how well you know the data. If the data is sufficient, the model can be built from scratch by defining each layer of convolutional neural network.
The objective of the paper is to review the various deep learning models using various type of dataset. The first section is the study of the related works done in the field of lung disease detection. The next section provides the insights of various models used and the accuracy gained by the model. Finally this paper concludes an optimal model for the task to be performed.
Literature survey
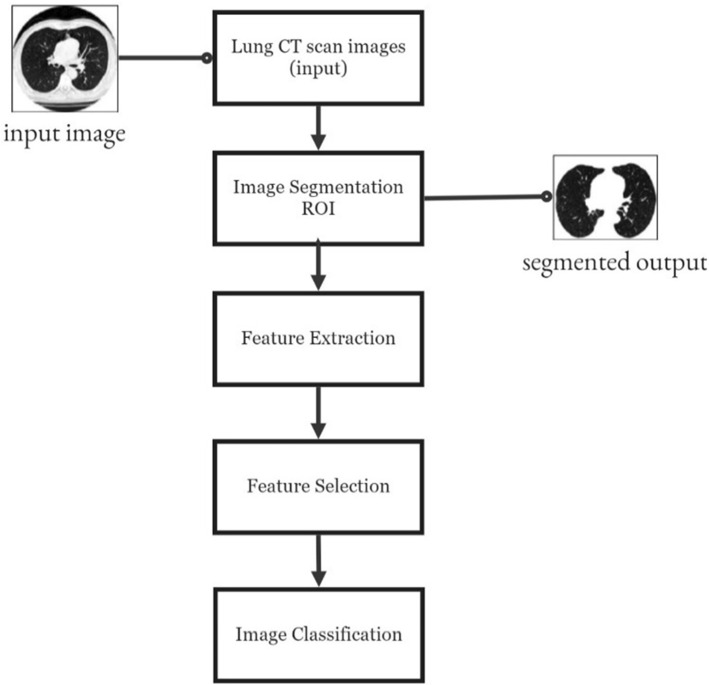
Gupta et al. (2019) discuss about the feature extraction algorithms and tested the algorithms on various models in the first part of the image processing the authors have used Region of Interest (ROI) as a key feature to extract the region affected by the disease. The entire process is represented in Fig. 1.
Fig. 1.
Process flow diagram for image classification
The steps followed for each is explained in following.
Dataset collection
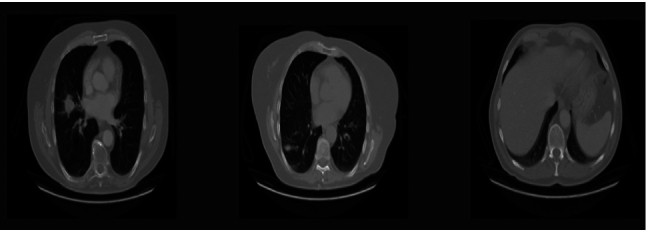
The machine learning model depends on datasets which must be from a trusted source with plenty of images. There are plenty of datasets available which can be used for purpose of lung disease detection. The datasets are sometimes collected self for a better accuracy. This research work is carried using C19RD and CXIP datasets proposed by Shimpy Goyal and Rajiv Goyal ( 2021). There are many other sources of dataset which are available on internet for free to use for educational and research purpose. Figure 2 shows the sample lung CT scan images used for experimental analysis.
Fig. 2.

Sample CT image
Image pre-processing and feature extraction
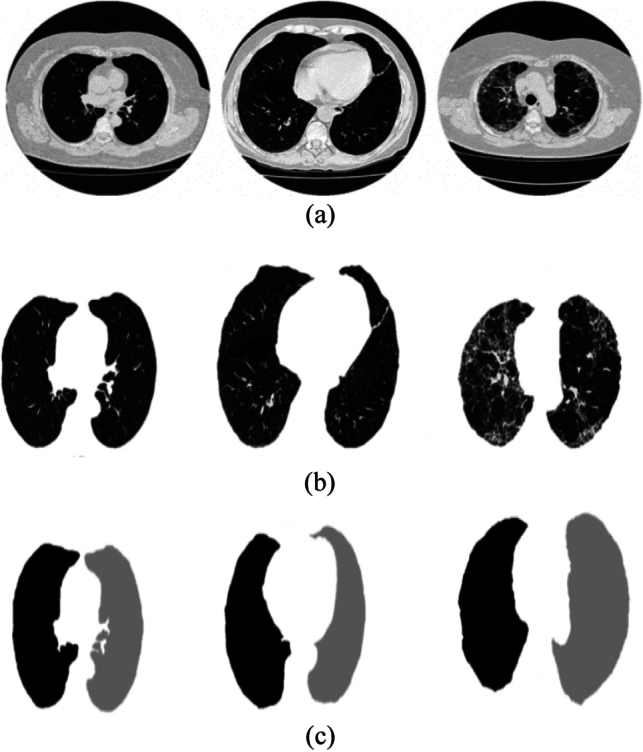
The general process of building a machine learning model follows a specific process which includes image pre-processing. Since the images in dataset may contain images of different sizes, different extension and also might contain noisy and blurry data. The images should be pre-processed before training by machine learning. Gaussian and Gabor filtering, Adaptive Gaussian Filtering, Wiener filtering and CLAHE are the various pro-processing techniques widely used for analysis (Fig. 3).
Fig. 3.

a Original images of healthy lungs, Lungs with COPD and Lungs with fibrosis respectively. b Segmented lung image of the corresponding original images. c Ground Truth images defining ROI of the corresponding original images
Experimental analysis
The performance of various classifiers is experimented with various feature extraction methods and the results are tabulated. The following performance metrics are used in this research work
| 1 |
| 2 |
| 3 |
The DSC measures the spatial overlap between two segmentations, A and B target regions, and is defined as
| 4 |
For a lower-tailed test, the p-value is equal to this probability;
| 5 |
For an upper-tailed test, the p-value is equal to one minus this probability;
| 6 |
The features extraction methods such as Improvised Grey Wolf (IGWA), Improvised Crow Search (ICSA) and Improvised Cuttle Fish techniques are experimented with K-Nearest Neighbour (KNN), Random Forest (RF), Support Vector Machine (SVM) and Decision Tree (DT) and results are tabulated in Table 1.
Table 1.
Comparison of accuracy of different classifier with different method of feature extraction
| Technique | Classifier | Accuracy (%) |
|---|---|---|
| Improvised Grey Wolf (IGWA) | K-NN | 99.4 |
| RF | 99.2 | |
| SVM | 99.0 | |
| Decision tree | 98.4 | |
| Improvised Crow Search (ICSA) | K-NN | 98.6 |
| RF | 99.0 | |
| SVM | 98.0 | |
| Decision tree | 97.0 | |
| Improvised Cuttle Fish (ICFA) | K-NN | 96.6 |
| RF | 97.3 | |
| SVM | 95.4 | |
| Decision tree | 94.0 |
For the purpose of training k value was set to 6 for the KNN, and ten-cross validation was used for verifying the results. From Table 1, it is observed that, the combined version of ICWA-KNN gives better results compared to other models considered for experimental analysis.
Table 2 represents the performance of ICWA-KNN with various datasets and the accuracy is recorded.
Table 2.
Comparison of SVM, kNN and GB
| Dataset | Accuracy | ||
|---|---|---|---|
| SVM | k-NN | GB | |
| Text data from sick or healthy | 75 | 95 | 98 |
| Audio MFCC features from sick or healthy | 88 | 92 | 91 |
| Text data and audio MFCC features from sick or healthy | 64 | 92 | 97 |
| Text data from 12 diseases | 73 | 67 | 58 |
| Audio MFCC features from 12 disease | 63 | 64 | 48 |
| text data and audio MFCC features from 12 disease | 70 | 66 | 58 |
Shimpy Goyal and Rajiv Goyal (2021) have proposed a new framework to detect and classify pneumonia and Covid-19 diseases using deep learning (DL) techniques. X-Ray images of the chest are used as data to train the model keeping pneumonia and Covid as two classes. The model was trained on two different datasets, C19RD dataset and CXIP dataset. The model was prepared using F-RRN-LSTM which uses the techniques Adaptive Intensity values adjustment, median filtering and histogram equalization. The following procedure is used in the research work,
The median filtering was used as the preprocessing techniques to remove noise in the contrast enhanced images.
The segmentation method aims for accurate ROI extraction with minimum computation time.
Conventional soft computing methods ANN, SVM, KNN and Ensemble for detection and classification.
The results concluded that, RNN using LSTM to form a novel model called “RNN-LSTM” which is used as efficient techniques to automatically detect the lung diseases. Table 3 shows the accuracy gained on both the mentioned datasets based on the RNN-LSTM algorithm. The paper also describes about the advantages of using RNN-LSTM model which achieved 95.04% accuracy on C19RD dataset and 94.31% accuracy on CXIP dataset.
Table 3.
Accuracy on C19RD and CXIP dataset on different classifier
| Dataset used | Classifier | Raw feature | Min–Max normalization | Robust normalization |
|---|---|---|---|---|
| C19RD | KNN | 81.54 | 82.98 | 85.72 |
| SVM | 81.94 | 84.27 | 87.88 | |
| ANN | 87.95 | 89.92 | 91.22 | |
| Ensemble | 85.95 | 87.74 | 87.93 | |
| F-RNN-LSTM | 89.36 | 93.55 | 95.04 | |
| CXIP | KNN | 79.44 | 82.76 | 83.08 |
| SVM | 79.69 | 81.76 | 86.73 | |
| ANN | 79.89 | 83.94 | 85.55 | |
| Ensemble | 80.01 | 82.58 | 84.18 | |
| F-RNN-LSTM | 87.82 | 92.16 | 94.31 |
Dorla et al. (2020) used IMRD UK EMR primary care database for the purpose of making new machine learning model. The authors revised a gradient boosting tree approach using bootstrap aggregation. The model can handle and capture nonlinear associations, interactions and missing data. The algorithm mainly works around the parameters of age, and the timing of symptoms (cough), treatments (macrolides and ICS) and lung function tests (LFTS). The model mainly focuses on nontuberculous mycobacterial lung disease (NTMLD).
The most common pre-existing diagnoses and treatments for NTMLD patients were COPD, asthma, penicillin, macrolides, inhaled corticosteroids. Compared to random testing, machine learning improved detection of patients with NTMLD by thousand-fold with AUC of 0.94. (Nageswaran, et al. 2022; Gould, et al. 2021; Nemlander et al. 2022). Murat Aykanat et al. (2020) have done comparison of various algorithms for classification of respiratory diseases with text and audio data. Dataset was collected using electronic stethoscope and its software used to record patient information and 17,930 lung sounds from total 1630 subjects. The authors have compared support vector machines (SVM), k-nearest neighbor (k-NN), and Gaussian Bayes (GB) algorithms in classification of respiratory diseases. Along with the text and audio, X-ray images of different regions of lungs were used to identify the affected regions. Eighteen classification methods were used to classify and analyse the results. The results of the work is given in Table 4.
Table 4.
Experimental comparison of various Deep Learning Techniques
| Lung disease classification method | Accuracy | Precision | Recall | Sensitivity |
|---|---|---|---|---|
| 12 classes using text data (SVM) | 73 | 73 | 91 | 91 |
| 12 classes using text data (k-NN) | 67 | 67 | 100 | 100 |
| 12 classes using text data (GB) | 58 | 58 | 64 | 64 |
| 12 classes using audio data (SVM) | 63 | 63 | 96 | 96 |
| 12 classes using audio data (k-NN) | 64 | 64 | 99 | 99 |
| 12 classes using audio data (GB) | 48 | 48 | 53 | 53 |
| 12 classes using text and audio data (SVM) | 70 | 70 | 99 | 99 |
| 12 classes using text and audio data (k-NN) | 66 | 66 | 100 | 100 |
| 12 classes using text and audio data (GB) | 58 | 58 | 69 | 69 |
| Healthy versus sick using text data (SVM) | 75 | 100 | 55 | 55 |
| Healthy versus sick using text data (k-NN) | 95 | 94 | 98 | 98 |
| Healthy versus sick using text data (GB) | 98 | 98 | 99 | 99 |
| Healthy versus sick using audio data (SVM) | 88 | 89 | 88 | 88 |
| Healthy versus sick using audio data (k-NN) | 92 | 94 | 94 | 92 |
| Healthy versus sick using audio data (GB) | 91 | 98 | 85 | 85 |
| Healthy versus sick using text and audio data (SVM) | 64 | 100 | 43 | 43 |
| Healthy versus sick using text and audio data (k-NN) | 92 | 90 | 96 | 96 |
| Healthy versus sick using text and audio data (GB) | 97 | 97 | 95 | 95 |
The SVM, k-NN and GB were run on 6 datasets and the accuracy for each was recorded. Table 5 shows the comparison of the accuracy gained on the six datasets.
Table 5.
Comparison of SVM, kNN and GB
| Classes | SVM | k-NN | GB |
|---|---|---|---|
| Sick or healthy with text data | 75 | 95 | 98 |
| Sick or healthy with audio MFCC features | 88 | 92 | 91 |
| Sick or healthy with the text data and audio MFCC features | 64 | 92 | 97 |
| 12 diseases with text data, | 73 | 67 | 58 |
| 12 disease with audio MFCC features | 63 | 64 | 48 |
| 12 diseases with the text data and audio MFCC features | 70 | 66 | 58 |
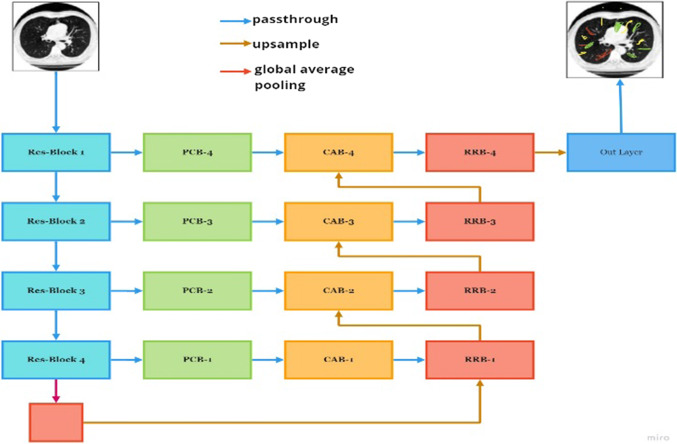
Zheng et al. (2020) used the dataset used by CT scan dataset collected by Affiliated Hospital located at Qingdao University. The dataset consists of CT scan images obtained from various patients infected by COVID-19. The age group of patients were in between 23 and 67. The proposed technique is experimented on PyTorch backend and used an algorithm called as MSD-NET. Figure 4 shows the overview of the proposed model.
Fig. 4.
Architecture of MSD-NET
A concept of Pyramid Convolutional Block (PCB), Channel Attention Block (CAB), and Residual refinement block (RRB) was used to modify the existing U-Net model as per the requirement. The images were resized to 512 × 512. Data augmentation technique is used to avoid overfitting problem caused due to limited amount of data. The dataset were randomly flipped and rotated. Adam optimizer was used with an initial learning rate 0.001.The learning rate was gradually decreased by 0.1 after every 100 epochs. The model was compared with various medical image segmentation models such as U-Net, U-Net++, U-Net + CBAM and Attention U-Net. The result analysis of which is depicted in Table 6 where Dice similarity coefficient (DSC), Sensitivity (Sen.), and Specificity (Spec) are metrics of evaluation (Kirienko et al. 2018; Shanthi and Rajkumar 2020; Ozdemir et al. 2019; Šarić et al. 2019).
Table 6.
Comparison of MSD-NET with the similar models
| Method | Infection type | DSC | Sen | Spec | P-value |
|---|---|---|---|---|---|
| U-Net | Ground-glass opacities | 0.6034 ± 0.073 | 0.72 31 ± 0.011 | 0.9775 ± 0.010 | 1.09 × 10⁻⁸ |
| Interstitial infiltrates | 0.6423 ± 0.081 | 0.7361 ± 0.025 | 0.9756 ± 0.008 | ||
| Consolidation | 0.7526 ± 0.036 | 0.8209 ± 0.026 | 0.9863 ± 0.005 | ||
| U-Net++ | Ground-glass opacities | 0.7160 ± 0.052 | 0.8017 ± 0.014 | 0.9675 ± 0.004 | 3.15 × 10⁻⁵ |
| Interstitial infiltrates | 0.6971 ± 0.034 | 0.7829 ± 0.018 | 0.9847 ± 0.008 | ||
| Consolidation | 0.8041 ± 0.042 | 0.8172 ± 0.009 | 0.9865 ± 0.003 | ||
| Attention U-Net | Ground-glass opacities | 0.7226 ± 0.026 | 0.8038 ± 0.019 | 0.9665 ± 0.012 | 1.56 × 10⁻⁴ |
| Interstitial Infiltrates | 0.7158 ± 0.024 | 0.7953 ± 0.011 | 0.9812 ± 0.007 | ||
| Consolidation | 0.8012 ± 0.041 | 0.8147 ± 0.015 | 0.9814 ± 0.008 | ||
| U-Net + CBAM | Ground-glass opacities | 0.7037 ± 0.039 | 0.8172 ± 0.013 | 0.9675 ± 0.005 | 7.22 × 10⁻⁴ |
| Interstitial infiltrates | 0.6824 ± 0.032 | 0.7975 ± 0.018 | 0.9431 ± 0.008 | ||
| Consolidation | 0.8005 ± 0.052 | 0.8727 ± 0.021 | 0.9827 ± 0.004 | ||
| MSD-NET | Ground-glass opacities | 0.7422 ± 0.038 | 0.8593 ± 0.018 | 0.9742 ± 0.005 | 8.25 × 10⁻⁴ |
| Interstitial infiltrates | 0.7384 ± 0.021 | 0.8268 ± 0.020 | 0.9869 ± 0.005 | ||
| Consolidation | 0.8769 ± 0.015 | 0.8645 ± 0.017 | 0.9889 ± 0.007 |
The model was tested and compared with the different implementation for the detection of COVID19 using CT scan images.
Conclusion
Deep learning-based lung cancer prediction plays a vital role in assisting the medical practioners for diagnosing lung cancer in earlier stage. Due to the increase in pollution, the number of deaths caused by lung disease is rising rapidly. Computer-aided diagnosis (CAD) is considered to bring a boost to the field of medicine by tying it to automated systems. In this research paper, several models out there which take the chest X-Ray image or CT scan as an input to detect a particular disease. This research work is carried out to identify the best performing deep learning techniques for lung disease prediction. The performance of the method is evaluated using various performance metrics, such as precision, recall, accuracy and Jaccard index. The result concluded that MSD-NET gives better results compared to other models considered for experimental analysis.
Author contributions
All authors are contributed equally.
Funding
No funding was received to assist with the preparation of this manuscript.
Data availability
All authors certify that they have no affiliations with or involvement in any organization or entity with any financial interest or non-financial interest in the subject matter or materials discussed in this manuscript.
Declarations
Conflict of interest
The authors declare that they have no conflict of interest.
Footnotes
This article has been retracted. Please see the retraction notice for more detail: https://doi.org/10.1007/s00500-024-10107-4
Publisher's Note
Springer Nature remains neutral with regard to jurisdictional claims in published maps and institutional affiliations.
Change history
8/27/2024
This article has been retracted. Please see the Retraction Notice for more detail: 10.1007/s00500-024-10107-4
References
- Aykanat M, Kilic O, Kurt B, Saryal S (2020) Lung disease classification using machine learning algorithms. Int J Appl Math Electron Comput 8:125–132. 10.18100/ijamec.799363 [Google Scholar]
- Doyle OM, van der Laan R, Obradovic M, McMahon P, Daniels F, Pitcher A, Loebinger MR (2020) Identification of potentially undiagnosed patients with nontuberculous mycobacterial lung disease using machine learning applied to primary care data in the UK. Eur Respir J 56(4):2000045. 10.1183/13993003.00045-2020 [DOI] [PubMed] [Google Scholar]
- Gould MK et al (2021) Machine learning for early lung cancer identification using routine clinical and laboratory data. Am J Respir Crit Care Med 204(4):445–453. 10.1164/rccm.202007-2791OC [DOI] [PubMed] [Google Scholar]
- Goyal S, Singh R (2021) Detection and classification of lung diseases for pneumonia and Covid-19 using machine and deep learning techniques. J Ambient Intell Humaniz Comput 18:1–21. 10.1007/s12652-021-03464-7 [Google Scholar]
- Gupta N, Gupta D, Khanna A, Rebouças Filho PP, de Albuquerque VHC (2019) Evolutionary algorithms for automatic lung disease detection. Measurement 140:590–608. 10.1016/j.measurement.2019.02.042 [Google Scholar]
- https://www.healthline.com/health/top-10-deadliest-diseases#Overview
- https://www.lung.org/lung-health-diseases/lung-disease-lookup/copd/what-causes-copd
- https://www.lung.org/quit-smoking/smoking-facts/whats-in-a-cigarette
- https://www.pharmatutor.org/pharma-news/doctors-population-in-india
- https://www.who.int/en/news-room/fact-sheets/detail/the-top-10-causes-of-death
- https://wwwnc.cdc.gov/travel/yellowbook/2020/travel-by-air-land-sea/deep-vein-thrombosis-and-pulmonary-embolism
- https://wwwnc.cdc.gov/travel/yellowbook/2020/travel-related-infectious-diseases/middle-east-respiratory-syndrome-mers
- Kirienko M, Sollini M, Silvestri G, Mognetti S, Voulaz E, Antunovic L, Rossi A, Antiga L, Chiti A (2018) Convolutional neural networks promising in lung cancer T-parameter assessment on baseline FDG-PET/CT. Contrast Media Mol Imaging
- Nageswaran S et al (2022) Lung cancer classification and prediction using machine learning and image processing. Biomed Res Int. 10.1155/2022/1755460 [Google Scholar]
- Nemlander E, Rosenblad A, Abedi E, Ekman S, Hasselström J, Eriksson LE et al (2022) Lung cancer prediction using machine learning on data from a symptom e-questionnaire for never smokers, formers smokers and current smokers. PLoS ONE 17(10):e0276703. 10.1371/journal.pone.0276703 [DOI] [PMC free article] [PubMed] [Google Scholar]
- Ozdemir O, Russell RL, Berlin AA (2019) A 3D probabilistic deep learning system for detection and diagnosis of lung cancer using low-dose CT scans. IEEE Trans Med Imaging 39(5):1419–1429 [DOI] [PubMed] [Google Scholar]
- Šarić M, Russo M, Stella MŠarić M, Russo M, Stella M, Sikora M (2019) CNN-based method for lung cancer detection in whole slide histopathology images. In: International conference on smart and sustainable technologies (SpliTech), pp 1–4
- Shanthi S, Rajkumar N (2020) Lung cancer prediction using stochastic diffusion search (SDS) based feature selection and machine learning methods. Neural Process Lett 53:2617–2630 [Google Scholar]
- Tran GS, Nghiem TP, Nguyen VT, Luong CM, Burie JC (2019) Improving accuracy of lung nodule classification using deep learning with focal loss. J Healthcare Eng
- Zheng B, Liu Y, Zhu Y, Yu F, Jiang T, Yang D, Xu T (2020) MSD-net: multi-scale discriminative network for COVID-19 lung infection segmentation on CT. IEEE Access 29(8):185786–185795. 10.1109/ACCESS.2020.3027738 [Google Scholar]
Associated Data
This section collects any data citations, data availability statements, or supplementary materials included in this article.
Data Availability Statement
All authors certify that they have no affiliations with or involvement in any organization or entity with any financial interest or non-financial interest in the subject matter or materials discussed in this manuscript.


