

In 2020-2021, the New York State workers’ compensation system provided a modest number of essential workers wage and medical benefits relative to a sizable workforce infected by COVID-19. Affording workers the presumption of work-relatedness is one of several steps needed to improve utilization of the program and distribution of benefits.
Keywords: COVID-19, workers' compensation, industry, occupational health, pandemic, health care, nursing homes
Objective
This study aimed to characterize the distribution and award status of COVID-19–related workers' compensation (WC) claims in New York State (NYS) for 2020 and 2021.
Methods
Characteristics and filing rates of COVID-19 claims were described by industry, time of illness, and award status. Nursing care facilities' claims were compared with the recorded nursing home staff COVID-19 infections and deaths reported by the Centers for Medicare & Medicaid Services (CMS) during the same period.
Results
Of 29,814 COVID-19 claims, 21.9% were awarded benefits, although 86.8% of the claimants worked in essential industries. Of the 46,505 CMS-recorded COVID-19 infections, 1.4% resulted in a claim and 7.2% of the 111 CMS-recorded deaths received death benefits.
Conclusions
The NYS WC program has provided very modest support to essential workers for the likely work-related burden of the pandemic in NYS.
LEARNING OUTCOMES
Characterize COVID-19–related workers' compensation claims filed in New York State for exposure or illnesses occurring in 2020 or 2021 by award status, industry type, essential worker status, and other claim characteristics.
Describe the proportion of recorded COVID-19 infections and fatalities among nursing home staff that resulted in a COVID-19 workers' compensation claim and death benefits.
Examine New York State findings in the context of other US states with a presumption regarding work relatedness of COVID-19 illness.
Work-related COVID-19 infections have been documented among workers across various job settings using multiple data sources in the United States.1–9 The full dimensions and impacts of occupational COVID-19 and its long-term sequalae, however, remain unclear. It is unclear, for example, whether the legions of nurses, prison guards, farm workers, bus drivers, and meat processors who contracted COVID-19 while performing their jobs have been compensated for any economic and medical consequences of their infections.1,4,10,11 Multiple barriers to accessing workers' compensation (WC) for work-related injuries and illnesses and underlying differences in claim filing behaviors across industries and occupations ensure that WC data provide an inadequate view of occupational risk of COVID-19.12–15 WC is nonetheless important because it constitutes the chief institutional mechanism through which workers can recoup wage loss and access medical care for occupational conditions.
The state-based WC insurance programs in the United States are designed to support workers in their recovery or disablement from occupational injuries and illnesses. Despite the long-standing recognition of weaknesses of WC programs,16,17 they continue to be criticized for increasingly restrictive coverage, failure to address recognition of occupational diseases and their indemnification, and mounting barriers to the filing and award of claims.12,18 Factors contributing to poor filing rates and a high number of claim denials include the following: unfamiliarity with WC eligibility, lack of recognition surrounding work relatedness, language barriers, fear of retaliation from an employer, long wait times for adjudication, displacement of medical expenses on to other sources (ie, public and private medical insurance and disability programs), and challenges in establishing proof of causation.12,13,19,20
Recognizing and demonstrating the work relatedness of a COVID-19 infection can be challenging. Selected states (eg, California, Illinois, Michigan, and New Jersey) passed legislation soon after the onset of the pandemic, establishing a presumption for health care workers and first responders that their exposure to, or contraction of, COVID-19 was work related.21,22 In other states, including New York, claimants bear the burden of proving that their COVID-19 infection was caused by a work-related severe acute respiratory syndrome coronavirus 2 (SARS-CoV-2) exposure. Limited access to testing, a lack of COVID-19 record-keeping or contact tracing, and work in environments with variable levels of public interaction make it hard for workers in many settings to recognize the work relatedness of an infection, let alone to gather evidence to substantiate such a claim in WC proceedings.
The estimated proportion of COVID-19 infections that were caused by a work-related SARS-CoV-2 exposure in the United States is unknown. Workplace outbreak-associated COVID-19 cases investigated in California, Ontario, and Wisconsin in 2020 to 2021 accounted for 7%, 12%, and 18% of the total number of reported COVID-19 cases during the period of the outbreak investigations, respectively.5,7,23 In addition, after excluding outbreaks in several “high-risk” settings (eg, health care, congregate living, and child-care settings), 5% and 12% of the total number of recorded COVID-19 infections in Seattle and King County, Washington, and in Utah in 2020, respectively, resulted from a work-related outbreak.8,24 Health care, agriculture, transportation, food manufacturing, construction, and retail sectors were responsible for some of the highest proportions of total outbreaks in comparison to other industries.5,7,8,23,24 In a population-based survey among Michigan residents with laboratory-confirmed COVID-19 before November 16, 2020, 30.4% of employed respondents self-reported “work” as the source of their exposure.25
In New York State (NYS), an early center of the pandemic in the United States, there were 2,721,926 COVID-19 infections, 93,867 COVID-19 hospitalization, and 6321 COVID-19 fatalities recorded among working-aged adults (18–64 years) in 2020 and 2021.26 Based on the estimates of occupational transmission cited previously, if even a modest 10% (272,193) of these infections were caused by a work-related SARS-CoV-2 exposure, a large number of COVID-19 WC claims in NYS might have been expected.
We examined WC claims filed in NYS for COVID-19–related health events (including exposure to, or contraction of, COVID-19) occurring in 2020 and 2021. Our specific objectives were to (1) describe overall COVID-19–related claim characteristics (ie, age, sex, insurance type, attorney representation, district, benefit status, essential industry status, and industry), by year (2020 and 2021), and by award status (awarded or not awarded); (2) examine changes in the number and rate of claims that were filed by industry sectors and groups over the 2-year study period; and (3) evaluate utilization of the WC system for COVID-19 among nursing home staff, a worker population with recorded numbers of COVID-19 infections, and fatalities reported by the Centers for Medicare & Medicaid Services (CMS).
METHODS
Sample
Our sample included COVID-19–related WC claims filed in NYS with a claimant-reported illness date between January 1, 2020, and December 31, 2021 (N = 31,366, or 6.6% of all NYS WC claims due to injuries and illnesses from 2020 and 2021). Data were obtained through the public NYS Workers' Compensation Board (WCB) Web site in July 2022 and were current through June 22, 2022.27,28 COVID-19–related claims were identified by a specific COVID-19 indicator that was included in the data set. After manually reviewing the “cause” and “nature” of the COVID-19 designated claims, we excluded 292 claims that did not arise from a COVID-19 exposure or infection (eg, adverse reaction to the COVID-19 vaccine) or were misclassified, 339 “canceled” claims, and 1228 claims with a missing industry sector. Our final analytic sample included 29,814 COVID-19–related claims from “injuries” occurring in 2020 (n = 18,747 [62.9%]) and 2021 (n = 11,067 [37.1%]).
Under NY Workers Compensation Law, all NYS employers with more than one employee are required to carry WC insurance that provides benefits to employees, including part-time workers and dependents.29,30 Notable exclusions are workers with insurance coverage from other systems (ie, federal employees, selected New York City employees [firefighters, uniformed police, uniformed sanitation workers, and public school teachers], clergy, and workers without specific employment relations [independent contractors, part-time domestic workers]).29 Workers in these categories are not represented in the WC claims data used in this analysis.
WC-covered workers who were exposed to or infected by the SARS-CoV-2 virus during employment may be awarded compensation for lost work time, health care costs, and death. Workers are entitled to a portion of their lost wages [2/3 × Average Weekly Wage (up to a current maximum of $1125.46/week) × % of Disability]31 if they were unable to work for more than 7 days because of their illness or a mandatory order of quarantine and have exhausted all other forms of paid leave, including employer-provided COVID-19 sick leave and NY Paid Family Leave and disability benefits.32 Health care awards cover medical treatment and expenses provided by a WCB authorized medical provider (except in the event of an emergency). In the event of death, survivor benefits include funeral expenses and cash awards that are equal to two-thirds of the deceased worker's average weekly wage over the previous 52 weeks.
In NYS, claims must be filed within 2 years of the illness. To file a claim, a worker must notify their employer within 30 days (or as soon as possible) of their illness, seek medical care from a WCB authorized provider, and file an employee claim form (“Form C-3”). The medical provider is required to submit a report to the insurance carrier and the WCB indicating whether work caused, or was a substantial contributing factor to, the illness and substantiating a COVID-19 diagnosis.33
Measures
Benefit Award Status
Claims were categorized as “awarded,” “not awarded,” and “claim in process.” Two variables, “Claim Injury Type” and “Current Claim Status,” were used to define the award status in this analysis. In brief, awarded claims included 3 categories of benefits: wage replacement (±medical costs for the period of lost time), medical only, and death. Not awarded claims received no benefits and had a status designating the claim had been decided or administratively closed as of June 2022. Claims in process were not yet awarded any benefits and had not received a final decision (eg, newly assembled claim, motion set, reopened administratively) as of June 2022.
Industry
Industry descriptions used in this analysis are based on the 2017 North American Industry Classification System (NAICS).34 NAICS uses a hierarchical coding scheme to designate sector (2-digit code), subsector (3-digit code), group (4-digit code), industry (5-digit code), and national industry (6-digit code, henceforth detailed industry). The publicly available NYS WCB claims data included 2-digit industry sector. Detailed industry designations (6-digit codes) were obtained for 91.4% (n = 27,247) of the claims in our analytic sample through a Freedom of Information Act request made to the WCB. Freedom of Information Act–requested industry data were matched to the existing data set by claim ID and injury date.
Essential Industry Status
We used the National Institute for Occupational Safety and Health “Essential Workers Code Set” to determine essential industry status (essential, nonessential, or mixed essential/nonessential) for all claimants associated with a detailed industry.35 The code set, which includes a list of 6-digit NAICS codes and their essential status, is based on the US Cybersecurity and Infrastructure Security Agency “Guidance on the Essential Critical Infrastructure Workforce” (version 4; August 18, 2020).36
Additional Demographic and Claim Characteristics
Demographic details of the claimants included age (18–34, 35–54, 55–64, 65+ years) and sex (male or female). Claim-related details included representation by an attorney or other advocate (yes/no), WC insurance type (ie, private, NYS insurance fund, self-insured public, and self-insured private), and regional WCB district where the claim was adjudicated (New York City, Hauppauge, Albany, Buffalo, Syracuse, Rochester, and Binghamton). We used the number of days between the claim's “Assembly date” and the “Accident, Notice and Causal Relationship” date (ie, the date on which a causal relationship between a work-related exposure and the resulting illness was established) to determine the length of time a claim was in the system before receiving notice of an award.
Nursing Home Data
We obtained “COVID-19 Nursing Home Data” from the CMS Web site for years 2020 and 2021.10 As of May 2020, the CMS implemented mandatory weekly reporting of confirmed and suspected COVID-19 infections (COVID-19 infections) and fatalities among staff with COVID-19 (COVID-19 deaths) in all long-term care facilities certified to provide Medicare skilled nursing or Medicaid nursing services.37 The CMS did not report on other types of senior or assisted living centers.38 Data were reported to the Centers for Disease Control and Prevention (CDC) National Healthcare Safety Network Long Term Care Facility COVID-19 Module and quality checked by the CDC and CMS.38 Infections and deaths that occurred between January 1, 2020, and May 17, 2020 (the first reporting deadline) were reported retrospectively by some facilities and may therefore be undercounted. Facilities that failed to meet the data quality assurance and validation checks were excluded. These data were used to calculate the proportion of reported COVID-19 infections that resulted in a claim and the proportion of COVID-19 fatalities that were awarded death benefits within the nursing care facilities (skilled nursing facilities) industry group (NAICS code: 6231) during the same time frame (January 1, 2020, and December 31, 2021).
Statistical Analysis
Descriptive statistics were generated for all measures and missing values. We examined differences in the distribution of age, sex, attorney or other representation, insurance type, district, benefit status, essential industry designation, and industry sector by year of illness (2020 and 2021) and claim award status (awarded and not awarded). We examined differences in the number of claims submitted over 6-month periods from January 1, 2020, to December 31, 2021, and in the type of benefits awarded by industry sector. Pearson χ2 tests were used to test differences between categorical variables. An α level of 0.05 was used to determine statistical significance. The rates of COVID-19 claims filed per 10,000 workers by industry group (4-digit NAICS code) in 2020, 2021, and for both years combined were calculated using NYS-specific denominator data from the US Bureau of Labor Statistics (BLS) Quarterly Census of Employment and Wages series.39 To calculate the denominator (the total number of employees by industry group), we summed the 12-month annual average employee counts in NY for private and federal, state, and local government establishments by industry group. NYS establishments with undisclosed employee counts (<1% of total) were excluded from the sum. For the cumulative 2020 and 2021 rate denominator, we used the mean of the 2020 and 2021 annual average employee counts. We used the number of staff COVID-19 infections and COVID-19 fatalities provided by the CMS as denominator data to calculate the proportion of reported staff COVID-19 infections and COVID-19 fatalities that resulted in a claim and that were awarded death benefits, respectively, within the nursing care facilities' industry group for years 2020, 2021, and 2020–2021 combined. Data management and analysis were performed using Stata (version 16.1; StataCorp, College Station, TX), and visualizations were made using R Studio (PBC, Boston, MA).
RESULTS
General WC Experience
Of the 29,814 total COVID-19–related claims submitted in NYS for injuries occurring in 2020 and 2021, the majority derived from cases incurred in 2020 (62.9%), and in workers between the ages of 35 and 54 years (45.7%); an equal proportion of women (48.0%) and men (50.1%) submitted claims (Table 1). A majority of claims originated from workers in essential industries (86.8%), were not accompanied by attorney or other representation (79.8%), were made to private insurance carriers (53.7%), and were filed in the NYC district (54.6%; Table 1). As of June 2022, only 1 in 5 (21.9%) claims from 2020 and 2021 injuries had received an award of any kind (Table 1). Just 5 industries accounted for nearly 9 in 10 (86.7%) COVID-19–related claims—health care and social assistance (39.8%; henceforth health care), Public administration (25.4%), transportation and warehousing (13.9%), and retail trades (7.6%; Table 1). There were 104 people awarded WC death benefits for COVID-19–related claims in 2020 to 2021.
TABLE 1.
Characteristics of COVID-19–Related Claims From Illnesses Occurring in 2020 and 2021, New York State, N = 29,814
| Total, n (%) | 2020, n (%) | 2021, n (%) | P a | |
|---|---|---|---|---|
| Total | 29,814 (100.0) | 18,747 (100.0) | 11,067 (100.0) | — |
| Age group (4 categories), yr | <0.001 | |||
| 18–34 | 9772 (32.8) | 5205 (27.8) | 4567 (41.3) | |
| 35–54 | 13,624 (45.7) | 8843 (47.2) | 4781 (43.2) | |
| 55–64 | 5112 (17.1) | 3763 (20.1) | 1349 (12.2) | |
| ≥65 | 1086 (3.6) | 792 (4.2) | 294 (2.7) | |
| Missing | 220 (0.7) | 144 (0.8) | 76 (0.7) | |
| Sex | <0.001 | |||
| Female | 14,303 (48.0) | 10,176 (54.3) | 4127 (37.3) | |
| Male | 14,933 (50.1) | 8265 (44.1) | 6668 (60.3) | |
| Missing | 578 (1.9) | 306 (1.6) | 272 (2.5) | |
| Representation from attorney or other | <0.001 | |||
| No | 23,778 (79.8) | 13,787 (73.5) | 9991 (90.3) | |
| Yes | 6036 (20.2) | 4960 (26.5) | 1076 (9.7) | |
| Type of primary insurance | <0.001 | |||
| Private | 16,008 (53.7) | 9106 (48.6) | 6902 (62.4) | |
| Public, self-insured | 6967 (23.4) | 4596 (24.5) | 2371 (21.4) | |
| NYS insurance fund | 5070 (17.0) | 3742 (20.0) | 1328 (12.0) | |
| Private, self-insured | 1751 (5.9) | 1292 (6.9) | 459 (4.1) | |
| Missing | 18 (0.1) | 11 (0.1) | 7 (0.1) | |
| Workers comp board districtb | <0.001 | |||
| New York City | 16,291 (54.6) | 10,987 (58.6) | 5304 (47.9) | |
| Hauppauge | 4962 (16.6) | 2932 (15.6) | 2030 (18.3) | |
| Albany | 3957 (13.3) | 2342 (12.5) | 1615 (14.6) | |
| Buffalo | 1838 (6.2) | 864 (4.6) | 974 (8.8) | |
| Syracuse | 1089 (3.7) | 612 (3.3) | 477 (4.3) | |
| Rochester | 1069 (3.6) | 644 (3.4) | 425 (3.8) | |
| Binghamtom | 608 (2.0) | 366 (2.0) | 242 (2.2) | |
| Benefit status | <0.001 | |||
| No benefits awardedc | 19,501 (65.4) | 11,446 (61.1) | 8055 (72.8) | |
| Wage replacement ± medicald | 4683 (15.7) | 3747 (20.0) | 936 (8.5) | |
| Medical onlye | 1745 (5.9) | 1352 (7.2) | 393 (3.6) | |
| Deathf | 104 (0.3) | 94 (0.5) | 10 (0.1) | |
| In-processg | 3781 (12.7) | 2108 (11.2) | 1673 (15.1) | |
| Essential worker designationh | <0.001 | |||
| Essential industry | 25,891 (86.8) | 16,814 (89.7) | 9077 (82.0) | |
| Nonessential industry | 1144 (3.8) | 475 (2.5) | 669 (6.0) | |
| Mixed essential and nonessential | 212 (0.7) | 56 (0.3) | 156 (1.4) | |
| Missing | 2567 (8.6) | 1402 (7.5) | 1165 (10.5) | |
| Industry sector (NAICS 2-digit) | <0.001 | |||
| Health care and social assistance | 11,862 (39.8) | 9747 (52.0) | 2115 (19.1) | |
| Public administration | 7577 (25.4) | 4509 (24.1) | 3068 (27.7) | |
| Transportation and warehousing | 4152 (13.9) | 1548 (8.3) | 2604 (23.5) | |
| Retail trade | 2260 (7.6) | 645 (3.4) | 1615 (14.6) | |
| Educational services | 731 (2.5) | 615 (3.3) | 116 (1.0) | |
| Administrative and support and waste | 645 (2.2) | 324 (1.7) | 321 (2.9) | |
| Accommodation and food services | 500 (1.7) | 296 (1.6) | 204 (1.8) | |
| Other services (except public administration) | 427 (1.4) | 278 (1.5) | 149 (1.3) | |
| Finance and insurance | 401 (1.3) | 181 (1.0) | 220 (2.0) | |
| Manufacturing | 294 (1.0) | 130 (0.7) | 164 (1.5) | |
| Arts, entertainment, and recreation | 250 (0.8) | 67 (0.4) | 183 (1.7) | |
| Professional, scientific, and technical services | 166 (0.6) | 73 (0.4) | 93 (0.8) | |
| Real estate and rental and leasing | 156 (0.5) | 93 (0.5) | 63 (0.6) | |
| Wholesale trade | 141 (0.5) | 96 (0.5) | 45 (0.4) | |
| Construction | 124 (0.4) | 77 (0.4) | 47 (0.4) | |
| Information | 98 (0.3) | 51 (0.3) | 47 (0.4) | |
| Other (industry sectors with <40 claims) | 30 (0.1) | 17 (0.1) | 13 (0.1) |
aP values, derived from Pearson χ2, were used to test whether the distribution of claim characteristics differed between 2020 and 2021.
bName of the workers' compensation board district office that oversees claims for that area of the state.
cClaims defined as having a “Claim Injury Type” as “Non-Comp: No indemnity benefits awarded for the claim” and a “Current Claim Status” as “Administratively Closed = Case is closed manually by claims staff” or “No Further Action = case does not require further action at the time of the decision.”
dClaims defined as having a “Claim Injury Type” as “Temporary—Claim is awarded temporary total or partial benefits for lost time.” These claims include both medical and indemnity benefits for the period of lost time.
eClaims defined as having a “Claim Injury Type” as “Med Only = Medical benefits only” (n = 1729) or a scheduled or unscheduled permanent partial loss of use disability benefits (n = 8).
fClaims defined as having a “Claim Injury Type” listed as “Death = Claim for death benefits filed under workers compensation law.”
gClaims defined as having a “Claim Injury Type” listed as “Non-Comp: No indemnity benefits awarded for the claim” and a “Current Claim Status” as “Newly Assembled,” “Motion set,” “Re-Opened administratively,” “Hearing set,” “Hearing unset,” Returned to examining,” or “Referee—reserved decision.”
hEssential industry status was defined for all claims with a 6-digit NAICS industry designation (n = 27,444) using the US Cybersecurity and Infrastructure Security Agency “Guidance on the Essential Critical Infrastructure Workforce” (version 4, August 2020).
Claims submitted in 2021 (vs 2020) tended to be from younger and more frequently male workers (Table 1). Claims from the health care industry dropped markedly from 2020 to 2021. Transportation and warehousing and retail trades together accounted for 40% of claims in 2021 compared with more than 1 in 10 claims in 2020 (Table 1). Fewer than 5% of the total 2020 and 2021 COVID-19–related WC claims were submitted by employees in nonessential industries, notwithstanding a slight uptick from 2020 to 2021. Overall, the percentage of claims that were awarded benefits dropped in half from 2020 to 2021: from 27.7% in 2021 to 12.2% of claims in 2021, even though greater than 80% of claims in 2021 were submitted from essential industries (Table 1). Similarly, fewer claims were accompanied by legal representation in 2021 in comparison to 2020 (Table 1). Supplemental Table 1, http://links.lww.com/JOM/B303, provides additional details regarding the proportion of claims from essential versus nonessential industries within each sector.
Only one-quarter (n = 6532) of the 26,033 claims on which a WCB decision was made (award vs no award) received an award (Table 2). Only 25.5% of claims from essential workers were awarded. Similarly, only one-quarter (27.2%) of health care claims were awarded. Among awarded claims, it took the WCB a median of 217 days (mean, 262 days; range, 11–763 days) to reach a determination of award. Claims differed significantly by award status across all measures other than sex (Tables 3). Claims to self-insured public entities had nearly 3 times the success rate of self-insured private entities: 47.6% versus 19.5%. Having legal representation was critical: 67.6% of claims with legal representation succeeded versus 13.3% of claims without such assistance.
TABLE 2.
Comparison of Claim Characteristics for Awarded (Wage Replacement ± Medical Costs, Medical Only, or Death) and Not Awarded COVID-19–Related Claims From 2020 to 2021, Illnesses Combined, New York State, n = 26,033
| Benefits Awarded, n (%) | No Benefits Awarded, n (%) | P a | |
|---|---|---|---|
| Total (N = 26,033)b | 6532 (25.1) | 19,501 (74.9) | — |
| Age group (4 categories), yr | |||
| 18–34 | 1404 (16.5) | 7105 (83.5) | <0.001 |
| 35–54 | 3352 (28.2) | 8544 (71.8) | |
| 55–64 | 1407 (31.6) | 3052 (68.4) | |
| ≥65 | 315 (32.6) | 650 (67.4) | |
| Sex | |||
| Female | 3217 (25.9) | 9188 (74.1) | 0.092 |
| Male | 3266 (24.8) | 9891 (75.2) | |
| Year of “injury” | |||
| 2020 | 5193 (31.2) | 11,446 (68.8) | <0.001 |
| 2021 | 1339 (14.3) | 8055 (85.7) | |
| Workers comp board district | |||
| New York City | 3606 (25.0) | 10,804 (75.0) | <0.001 |
| Hauppauge | 1443 (36.7) | 2486 (63.3) | |
| Albany | 927 (26.3) | 2593 (73.7) | |
| Buffalo | 263 (15.9) | 1387 (84.1) | |
| Syracuse | 114 (11.4) | 883 (88.6) | |
| Rochester | 92 (9.5) | 879 (90.5) | |
| Binghamtom | 87 (15.6) | 469 (84.4) | |
| Type of primary insurance | |||
| Private | 1839 (13.2) | 12,133 (86.8) | <0.001 |
| Self-insured public | 2761 (47.6) | 3037 (52.4) | |
| NYS insurance fund | 1620 (34.8) | 3036 (65.2) | |
| Self-insured private | 310 (19.5) | 1279 (80.5) | |
| Representation from attorney or other | |||
| No | 2684 (13.2) | 17,660 (86.8) | <0.001 |
| Yes | 3848 (67.6) | 1841 (32.4) | |
| Essential worker designationc | |||
| Essential industry | 5744 (25.5) | 16,765 (74.5) | <0.001 |
| Nonessential industry | 83 (8.2) | 928 (91.8) | |
| Mixed essential and nonessential | 28 (15.8) | 149 (84.2) | |
| Industry sectord | |||
| Health care and social assistance | 2762 (27.3) | 7338 (72.7) | <0.001 |
| Public administration | 2739 (43.4) | 3579 (56.6) | |
| Transportation and warehousing | 441 (11.4) | 3441 (88.6) | |
| Retail trade | 68 (3.2) | 2085 (96.8) | |
| Educational services | 141 (20.8) | 536 (79.2) | |
| Administrative and support and waste | 86 (15.6) | 465 (84.4) | |
| Accommodation and food services | 26 (5.7) | 434 (94.3) | |
| Other services (except public administration) | 102 (25.4) | 299 (74.6) | |
| Finance and insurance | 37 (10.1) | 329 (89.9) | |
| Manufacturing | 36 (13.1) | 239 (86.9) |
aP values, derived from Pearson χ2 test, were used to test whether the distribution of claim characteristics differed by award status.
bMissing values described in Table 1 are excluded from this table in addition to claims with a benefit status of “In-Process” (n = 3798).
cEssential industry status was defined for all claims with a 6-digit NAICS industry designation using the US Cybersecurity and Infrastructure Security Agency “Guidance on the Essential Critical Infrastructure Workforce” (version 4, August 2020).
dTable includes the top 10 industries by number of claims only representing 96.8% of total claims.
TABLE 3.
Number and Rate of COVID-19–Related Claims From Illnesses Occurring in 2020 and 2021 by Industry Group, New York State, n = 28,849
| Sectora | Groupb | No. Claims | Rate of Claims Per 10,000 Employees Per Yearc | ||||
|---|---|---|---|---|---|---|---|
| 2020–2021 | 2020 | 2021 | Cumulative 2020–2021 | 2020 | 2021 | ||
| Total (includes all industries) | 29,814 | 18,747 | 11,067 | 34.5 | 21.9 | 12.7 | |
| Total (includes top 10 industries only) | 28,849 | 18,273 | 10,576 | 44.2 | 28.3 | 16.0 | |
| NAICS 62 Health care and social assistance | 11,862 | 9747 | 2115 | 70.9 | 58.7 | 12.6 | |
| NAICS 6221 General medical and surgical hospitals | 7496 | 6400 | 1096 | 181.4 | 154.2 | 26.7 | |
| NAICS 6231 Nursing care facilities, skilled nursing | 629 | 546 | 83 | 58.4 | 48.5 | 8.1 | |
| NAICS 6216 Home health care services | 619 | 450 | 169 | 23.0 | 17.1 | 6.2 | |
| NAICS 6211 Offices of physicians | 462 | 417 | 45 | 29.5 | 27.4 | 2.8 | |
| NAICS 6233 Continuing care, assisted living facilities | 399 | 346 | 53 | 137.6 | 117.6 | 18.5 | |
| NAICS 6222 Psychiatric and substance abuse hospitals | 384 | 358 | 26 | 205.8 | 188.1 | 14.2 | |
| NAICS 6241 Individual and family services | 363 | 166 | 197 | 14.6 | 6.8 | 7.8 | |
| NAICS 6214 Outpatient care centers | 257 | 194 | 63 | 51.4 | 39.9 | 12.3 | |
| NAICS 6232 Residential mental health facilities | 254 | 182 | 72 | 27.4 | 19.2 | 7.9 | |
| NAICS 6219 Other ambulatory health care services | 243 | 170 | 73 | 152.8 | 106.6 | 46.0 | |
| NAICS 6239 Other residential care facilities | 139 | 100 | 39 | 88.4 | 61.0 | 25.9 | |
| NAICS 6215 Medical and diagnostic laboratories | 103 | 56 | 47 | 60.9 | 34.8 | 26.5 | |
| NAICS 6223 Other hospitals | 81 | 74 | 7 | 38.9 | 35.5 | 3.4 | |
| NAICS 6213 Offices of other health practitioners | 47 | 39 | 8 | 9.2 | 7.9 | 1.5 | |
| NAICS 6212 Offices of dentists | 33 | 25 | 8 | 6.6 | 5.4 | 1.5 | |
| NAICS 6242 Emergency and other relief services | 31 | 26 | 5 | 15.2 | 12.9 | 2.4 | |
| NAICS 6243 Vocational rehabilitation services | 30 | 15 | 15 | 15.5 | 7.5 | 8.0 | |
| NAICS 92 Public administration | 7577 | 4509 | 3068 | 145.3 | 85.3 | 59.6 | |
| NAICS 9211 Executive, legislative, and general government | 3355 | 2373 | 982 | 161.0 | 114.0 | 47.1 | |
| NAICS 9221 Justice, public order, and safety activities | 2480 | 1177 | 1303 | 152.6 | 71.0 | 81.8 | |
| NAICS 9231 Administration of human resource programs | 50 | 40 | 10 | 9.8 | 7.8 | 2.0 | |
| NAICS 9251 Community and housing program administration | 49 | 27 | 22 | 35.9 | 19.9 | 16.0 | |
| NAICS 48–49 Transportation and warehousing | 4152 | 1548 | 2604 | 116.6 | 44.3 | 71.8 | |
| NAICS 4922 Local messengers and local delivery | 2951 | 591 | 2360 | 2418.4 | 590.8 | 1638.8 | |
| NAICS 4851 Urban transit systems | 858 | 749 | 109 | 151.4 | 130.2 | 19.5 | |
| NAICS 4811 Scheduled air transportation | 67 | 54 | 13 | 24.3 | 19.1 | 4.8 | |
| NAICS 4853 Taxi and limousine service | 51 | 46 | 5 | 94.4 | 85.0 | 9.3 | |
| NAICS 4841 General freight trucking | 31 | 7 | 24 | 12.8 | 2.9 | 9.9 | |
| NAICS 44–45 Retail trade | 2260 | 645 | 1615 | 27.8 | 8.1 | 19.6 | |
| NAICS 4441 Building material and supplies dealers | 1557 | 320 | 1237 | 268.3 | 56.1 | 209.8 | |
| NAICS 4451 Grocery stores | 146 | 74 | 72 | 8.6 | 4.3 | 4.2 | |
| NAICS 4481 Clothing stores | 104 | 35 | 69 | 16.6 | 5.8 | 10.6 | |
| NAICS 4522 Department stores | 80 | 15 | 65 | 13.2 | 2.5 | 10.6 | |
| NAICS 4461 Health and personal care stores | 59 | 49 | 10 | 7.5 | 6.3 | 1.3 | |
| NAICS 4532 Office supplies, stationery, and gift stores | 50 | 7 | 43 | 45.6 | 6.6 | 37.8 | |
| NAICS 4413 Auto parts, accessories, and tire stores | 43 | 39 | 4 | 25.3 | 23.1 | 2.3 | |
| NAICS 4411 Automobile dealers | 37 | 23 | 14 | 7.3 | 4.7 | 2.7 | |
| NAICS 61 Educational services | 731 | 615 | 116 | 8.1 | 6.8 | 1.3 | |
| NAICS 6113 Colleges and universities | 570 | 503 | 67 | 22.1 | 19.3 | 2.6 | |
| NAICS 6117 Educational support services | 61 | 54 | 7 | 53.7 | 47.5 | 6.2 | |
| NAICS 6111 Elementary and secondary schools | 54 | 34 | 20 | 1.0 | 0.6 | 0.4 | |
| NAICS 56 Administrative and waste services | 645 | 324 | 321 | 13.8 | 7.1 | 6.7 | |
| NAICS 5613 Employment services | 401 | 155 | 246 | 27.8 | 11.4 | 16.2 | |
| NAICS 5617 Services to buildings and dwellings | 76 | 59 | 17 | 6.8 | 5.4 | 1.5 | |
| NAICS 5616 Investigation and security services | 57 | 42 | 15 | 6.9 | 5.1 | 1.8 | |
| NAICS 5611 Office administrative services | 42 | 24 | 18 | 10.6 | 6.1 | 4.5 | |
| NAICS 72 Accommodation and food services | 500 | 296 | 204 | 8.9 | 5.6 | 3.4 | |
| NAICS 7225 Restaurants and other eating places | 218 | 124 | 94 | 4.9 | 3.0 | 2.0 | |
| NAICS 7223 Special food services | 147 | 101 | 46 | 41.6 | 30.3 | 12.3 | |
| NAICS 7211 Traveler accommodation | 118 | 61 | 57 | 20.5 | 10.8 | 9.7 | |
| NAICS 81 Other services, except public administration | 427 | 278 | 149 | 13.6 | 9.1 | 4.7 | |
| NAICS 8133 Social advocacy organizations | 111 | 75 | 36 | 49.7 | 33.8 | 16.0 | |
| NAICS 8131 Religious organizations | 74 | 67 | 7 | 15.7 | 14.1 | 1.5 | |
| NAICS 8129 Other personal services | 46 | 15 | 31 | 21.2 | 7.1 | 14.0 | |
| NAICS 52 Finance and insurance | 401 | 181 | 220 | 7.8 | 3.5 | 4.3 | |
| NAICS 5242 Insurance agencies and brokerages | 202 | 63 | 139 | 31.4 | 9.7 | 21.8 | |
| NAICS 5241 Insurance carriers | 97 | 75 | 22 | 12.7 | 9.7 | 2.9 | |
| NAICS 31–33 Manufacturing | 294 | 130 | 164 | 7.3 | 3.3 | 4.0 | |
| NAICS 3118 Bakeries and tortilla manufacturing | 41 | 11 | 30 | 20.9 | 5.8 | 14.8 | |
aThis table includes the top 10 industry sectors by number of claims representing 96.8% of the data.
bIndustry groups (4-digit NAICS code) with fewer than 30 claims for 2020 and 2021 combined were not listed in this table; however, they still contributed to the sector totals.
cDenominator data (ie total number of employees by industry sector and group) were derived from the Quarterly Census of Employment and Wages (QCEW) series from the US Bureau of Labor Statistics (accessed on July 1, 2022, at https://www.bls.gov/cew/downloadable-data-files.htm). The 2020–2021 combined rate was calculated using the average of the 2020 and 20,201 annual employee counts.
A majority of awarded claims (n = 6532) were for wage replacement, with or without medical costs (71.8% [n = 4620]), followed by medical only (26.8% [n = 1723]) and death benefits (1.5% [n = 95]; Supplemental Table 2, http://links.lww.com/JOM/B303). There were significant differences in the type of award by industry sector (P < 0.001). For example, only 19.3% of health care sector awards were for medical only benefits in comparison to 41.2% of those awarded in the retail trades.
The evolution of the industry origin of claims over the 24 months of the first 2 years of the pandemic is demonstrated more closely in Figure 1. Among the 5 sectors with the most claims, health care, and educational services exhibited a marked decline in the number of claims over the 2-year period. Public administration claims initially peaked during the first 6 months and then rebounded during the last 6 months of 2021. Transportation and warehousing claims had over twice as many claims during the second 6 months of 2021 than during the other periods. Claims submitted among retail trades workers were considerably higher in 2021 than in 2020. Supplemental Table 3, http://links.lww.com/JOM/B303, provides similar data for all other industry sectors.
FIGURE 1.
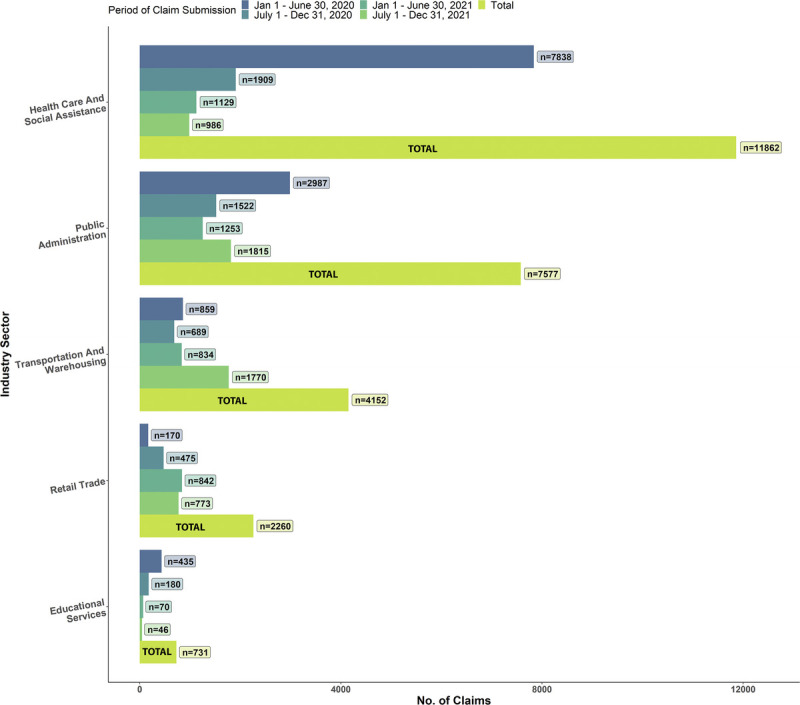
Number of COVID-19–related claims among the top 5 industry sectors by number of claims over time, n = 26,582. This figure shows the number of claims by industry sector (2-digit NAICS code) submitted over 6-month intervals between January 1, 2020, and December 31, 2021, and the combined 2020 and 2021 total. The figure includes the top 5 industries by number of claims representing 89.2% of total claims.
Within each broad industry sector (2-digit codes), 1 or 2 specific industry groups (4-digit codes) dominated claim submissions (Fig. 2). Notable groups included Medical and surgical hospitals (n = 7496 of 11,862 health care claims), executive, legislation and general government (n = 3355 of 7557 public administration claims), local messengers and local delivery (n = 2951 of 4152 transportation and warehousing claims), and building material and supplies dealers (n = 1557 of 2260 retail sector claims).
FIGURE 2.

Industry groups (4-digit NAICS) with more than 100 COVID-19 claims for 2020 and 2021 combined, New York State, n = 23,369. The plot includes the top 5 sectors by number of claims representing 89.2% of total claims. Industry groups with <100 claims assembled in 2020 and 2021 combined are not displayed.
The number and rate of claim submission (per 10,000 workers) by industry group for 2020 to 2021 are shown in Table 3. The overall 2020, 2021, and cumulative 2020–2021 rates of COVID-19–related claims for the top 10 industries with the greatest number of claims were 28.3, 16.0, and 44.2 per 10,000 employees, respectively. For nearly all specific industry groups within the health care sector, claim-filing rates decreased substantially from 2020 to 2021. Unexpectedly, the cumulative (2020–2021) rate of claims was higher among the estimated 12,202 local messengers and local delivery workers in NYS (2418.4) and the 58,026 building material and supplies dealers (268.3) than any industry group (ranging in size from 15,742 to 413,183 workers), within the health care sector (rate range, 6.6–205.8). In public administration, the average rates of claims for executive, legislative, and general government workers (n = 208,433), and justice, public order, and safety activity workers (n = 162,545) were 161.10 and 152.6 in 2020 and 2021 combined, which is higher than the corresponding rate of 58.4 among nursing care facilities (n = 107,746) and nearly as high as among the 413,183 general medical and surgical hospital workers (205.8) for the same period.
Nursing Home WC Experience
Table 4 shows an enormous contrast in the COVID-19 infection data on nursing home workers between CMS/CDC data and NYS WCB data. There were 46,505 COVID-19 infections and 111 COVID-19 fatalities among NYS nursing home staff reported to the CMS/CDC by 612 facilities (3 facilities failed to meet the data quality checks and were excluded). In the NYS WCB data, there were only 629 COVID-19–related claims and 8 deaths among workers in the nursing care facilities (skilled nursing facilities) industry group in 2020 to 2021. Thus, 1.4% of COVID-19 infections among nursing home staff resulted in a WC claim, and only 28.9% (or 182 claims) were awarded. Less than 1 in 10 nursing home staff fatalities recorded by the CMS/CDC (n = 111) resulted in a WC claim (n = 8).
TABLE 4.
Comparison Between Reported COVID-19 Infections and Deaths and Filed COVID-19–Related Claims Among Nursing Home Employees During 2020 and 2021 in New York State
| 2020a | 2021 | 2020–2021 | |
|---|---|---|---|
| CMS Nursing Home COVID-19 Datab,c | |||
| No. COVID-19 infections | 24,351 | 22,154 | 46,505 |
| No. COVID-19 deaths | 68 | 43 | 111 |
| NYS WC data for nursing care facilities (skilled nursing facilities)c | |||
| No. COVID-19 claims | 546 | 83 | 629 |
| No. awarded claims | 169 | 13 | 182 |
| Indemnity | 126 | 10 | 136 |
| Medical only | 36 | 2 | 38 |
| Death | 7 | 1 | 8 |
| Combined CMS and NYS WC data | |||
| % of CMS infections that resulted in a claim | 2.24% | 0.37% | 1.35% |
| % of CMS infections that led to claim awards | 0.69% | 0.06% | 0.39% |
| % of CMS deaths with WC award | 10.29% | 2.33% | 7.21% |
aThe first CMS reporting deadline for nursing facilities was May 17, 2020. Infections and deaths occurring between January 1, 2020, and May 17, 2020, were reported retrospectively by some facilities and may be an undercount.
bWeekly COVID-19 infections and deaths are reported to the CDC's National Healthcare Safety Network's “Long Term Care Facility COVID-19 Module: Surveillance Reporting Pathways and COVID-19 Vaccinations.” Data were accessed on July 20, 2022, through the CMS “Nursing Home COVID-19 Public File” located at https://data.cms.gov/resources/covid-19-nursing-home-methodology. Data from facilities that did not pass the CMS/CDC Data Quality Assurance and Validation checks (n = 3) were excluded from this analysis.
cWC data include COVID-19–related claims within the “nursing care facilities (skilled nursing facilities)” industry group (NAICS 6231).
DISCUSSION
During the first 2 years of the COVID-19 pandemic, approximately 30,000 workers filed a WC claim in NYS to recover lost wages or medical costs associated with a work-related COVID-19 exposure or infection. As of June 2022, 87.3% of WC claims had been decided and only 21.9% were awarded compensation of any kind, even though 86.8% of the claimants worked in an essential industry at the time of their illness. The health care, public administration, transportation and warehousing, and retail sector comprised 87.0% of all claims. In 2021, the number and rate of claims in health care and transportation and warehousing sectors exceeded those of health care. When compared with the COVID-19 infections and fatalities in NYS nursing staff reported to the CMS and CDC in 2020 and 2021, only a very small proportion of the infections (1.4% [n = 629]) and fatalities (7.2% [n = 8]) had resulted in a claim or received death benefits. Together, this evidence suggests that the WC system has provided very limited support to workers who have endured enormous challenges throughout the pandemic.
A key takeaway of this analysis is that the number of WC claims filed for COVID-19 in NYS for 2020 and 2021 illnesses (N = 31,366 before any exclusions) is likely a modest fraction of the true number of workers burdened by the economic and medical consequences of a work-related infection. To put the number of claims in some perspective, they account for only 1.2% of the total number of recorded COVID-19 infections among working-aged adults (2,721,926) in NYS in 2020 and 2021, although existing estimates suggest that 5% to 30% of total COVID-19 infections are caused by work-related SARS-CoV-2 exposures.5,7,8,23–25 A limited number of the potential COVID-19 wage replacement claims in NYS may have been absorbed by emergency COVID-19 quarantine leave legislation that was signed into law in March 2020 and permanent statewide leave policies enacted in January 2021.32,40 This finding is consistent with decades of research demonstrating low WC claim filing rates among eligible workers for a range of illnesses and injuries in the United States, particularly those with multiple work- and non–work-related sources of exposure.12,13,41 It also suggests that the costs of occupational COVID-19 infections are being absorbed by entities other than the WC program, including, for example, private medical insurers, disability benefits for off-the-job illnesses and injuries, and workers themselves.19,42
Between the first and second years of the COVID-19 pandemic, claim and claimant characteristics differed substantially. In 2021, there was a decrease in claims from female, health care sector workers and an increase in claims from non–health care workers especially to private insurance carriers. These changes coincided with a decrease in the number of awarded claims and claims that were assisted by attorneys or other forms of representation. The decrease in awarded claims cannot solely be explained by the decrease in claims from health care workers alone; the proportion of awarded claims in the Health Care sector also decreased by half between 2020 and 2021 (from 29.7% to 15.8%).
Who the insurer was and whether the claimant had legal assistance were very important determinants of success in WC claims. Claims submitted to public insurers and the NYS insurance fund, a not-for-profit insurer, were more likely to be awarded than claims to private insurers. The top 3 industries represented by private insurers, health care (51.7%), transportation and logistics (18.1%), and retail trades (12.6%), all had lower proportions of awarded claims (27.3%, 11.4%, and 3.2%, respectively) in comparison to health care (43.4%), which was almost entirely represented by a public (72.8%) or not-for-profit insurer (26.6%). Furthermore, claimants who had an attorney or other form of representation were 5 times as likely to have received compensation than those without any form of representation. In addition to helping a claimant maneuver the complexity of the WC system, representation can fulfill many of the functions that initial claim hearings in NYS once did (eg, identify language barriers, help obtain accurate information, and communicate key details of the law).13,43 Ever since the NYS WCB discontinued initial hearings in the 1990s, hearings are only scheduled for contested cases or under special request.43 At that point in time, the claimant may have already been discouraged from pursing the claim.43
As of January 2023, there have been nearly 1.5 million confirmed COVID-19 infections and 3000 COVID-19 deaths recorded among nursing home staff across the United States,10 making this industry among the most severely affected by the pandemic.10,44–47 However, we found that nursing home workers made little use of the WC system in NYS during the first 2 years of the pandemic: just 1.4% of their recorded infections and 7.2% of their recorded deaths resulted in WC claims. The actual discrepancy between nursing home staff COVID-19 infections and fatalities and WC claims may be even greater because a delay in the first CMS-required reporting (o/e., in May 2020) may have resulted in an undercount of such infections and death. Low WC utilization in the highly visible nursing home workforce that was (over time) afforded additional protections (eg, workplace testing, surveillance, vaccinations, and personal protective equipment access priority) raises the concern that less-visible worker populations with likely occupational SARS-CoV-2 exposure may be even less likely to receive compensation. It is also possible that nurses and other essential workers did not have an immediate need to file a COVID-19 WC claim, because they were able to access other forms of reimbursement for lost wages (eg, administrative leave and hazard pay) through their employers that we were unable to account for in these analyses.
Compounding the issue of low utilization by nursing home workers is the finding that less than one-third of submitted WC claims in this sector were successfully awarded. The reasons for these disparities are unclear and warrant further attention. Obtaining access to an attorney or other form of representation, a key claim characteristic associated with awarded claims, may not explain the low proportion of awarded claims among nursing home staff; the proportion of nursing care facilities' claimants with attorney or other forms of representation (43.2%) was similar to that among executive, legislative, and other general government support claimants (40.0%), the industry group with the highest proportion of awarded claims. In the United States, nursing care facilities' workers are disproportionately female and Black, and receive a low-wage, suggesting that the limited benefits received by this group may exacerbate existing social and health disparities.47,48
Several key findings emerged when we examined industry-specific COVID-19 claim filing rates together with award status. Foremost, the cumulative 2020 to 2021 rate of claims in the health care sector (70.9 per 10,000 workers) was surprisingly lower than in health care (145.3 per 10,000 workers) and transportation and warehousing (116.6 per 10,000 workers). Moreover, the proportion of awarded claims in the health care sector (27.3%), which is composed of occupations characterized as having the highest level of SARS-CoV-2 exposure risk according to the Occupational Safety and Health Administration, was lower than in health care (43.4%).
Within the health care sector, the rate of COVID-19 claims in 2020 among the executive, legislative, and general government (eg, “Other general government support”) industry group (114 per 10,000 workers, n = 4509 claims) was higher than the justice, public order, and safety activities group (71 per 10,000 workers, n = 1177 claims), which includes police protection and correctional institutions. This finding was also unexpected given the substantial number of COVID-19 staff and inmate outbreaks that were documented in correctional facilities (due in part to cramped and unsanitary conditions and a lack of testing) early in the pandemic in NYS and across the United States.11,49 The proportion of awarded claims in the executive, legislative, and general government group (62.1%) was also twice that of justice, public order, and safety activities (28.0%; data not shown).
The rate of claims in 2021 for local messengers and local delivery workers (1638 claims per 10,000 workers, n = 2360 claims) was exceptionally high in comparison to all other industry groups. This finding is consistent with existing evidence demonstrating an increased risk of COVID-19 infection, mortality, and claim filing rates among transportation workers.50–53 However, the rate may be an overestimate; the number of local messengers and delivery workers working in NYS in 2020 and 2021 may have been higher than what was estimated by the BLS. Regardless of the claim filing rates, award proportions were low: only 441 of the 3441 claims (11.4%) from transportation and logistics were awarded compensation of any kind. Our analysis notably did not replicate the findings in some other states that workers in the manufacturing, construction, and agriculture suffered COVID-19–associated outbreaks and deaths.3,5–9,51–53
COVID-19 WC presumptions are important. In California, a state with a rebuttable COVID-19 presumption for a broad range of essential industries, the proportion of claims that were “not denied” (64.2%) was approximately 30 percentage points higher than in NYS during the same period.54 This occurred despite the fact that the top 4 ranked industries by proportion of claims were comparable to NYS (health care [28.5%], health care [21.0%], retail trades [10.0%], and transportation and logistics [7.3%]).54 In Washington, 1 of 2 states with an infectious disease presumption for frontline workers during a declared public health emergency, nearly 90% (n = 17,792) of the 19,996 State Fund and self-insured COVID-19 claims submitted between February 2020 and August 2022 were accepted.55 In an analysis of Wisconsin's COVID-19 WC claim denial rates during (March–June 2020) and after (June–December 2020) a presumption period in Wisconsin, Modji et al50 found that the proportion of lost work time claims among first responders who were denied more than doubled from 18.4% to 43.8% when the presumption law was no longer in effect. Also, in an analysis of accepted COVID-19 claims from 11 states in the Midwest United States submitted to a large, private insurance carrier before August 31, 2020, Bernacki et al56 found that the likelihood of filing a COVID-19 WC claim in a presumption state was significantly higher than in a nonpresumption state. These results from multiple states demonstrate how a presumption of work relatedness can facilitate utilization of the WC program during the COVID-19 pandemic. NYS lacks such a presumption for COVID-19.
This study has limitations. Without individual-level data on occupation or race/ethnicity, we were unable to evaluate potential disparities in filing rates and award status across job status and race/ethnicity. These unanswered questions are important to address given mounting evidence that workers in low-status occupations and people of color may have a greater risk of both SARS-CoV-2 exposure at work and more severe health outcomes due to hiring practices, a higher prevalence of preexisting comorbidities, and less access to health insurance.57–60 To calculate industry-specific filing rates, we used the total number of employees within each industry as the denominator rather than the population of “at-risk” employees (eg, COVID-19 positive or in-person workers) for which data were not available. The BLS Survey of Occupational Injuries and Illnesses and the Census of Fatal Occupational Injuries, which rely on employer-based reporting, did not produce estimates for work-related COVID-19 infections or fatalities in 2020 or 2021. Moreover, there is substantial evidence to suggest that the Survey of Occupational Injuries and Illnesses numbers that were generated under nature code 3299, “Other diseases due to viruses, not elsewhere classified,” would be gross underestimates, particularly for 2020 when OSHA's infection and hospitalization record-keeping requirements underwent changes and reinterpretations.13,61–66 In addition, data from 2020 and 2021 on the proportion of workers within each industry that worked in-person were also lacking, which may have caused rates to be overestimated or underestimated. For most of the industries with a high number of claims that were described in this article, full-time remote workers would not have accounted for a substantial portion of the employee population. Finally, the results are not representative of worker groups not covered by WC insurance (eg, domestic workers, informal employees), some of which may be at higher risk of work-related SARS-CoV-2 exposure and less able to weather the economic or medical consequences of a COVID-19 infection without external support.67,68
Future research should investigate specific reasons why COVID-19 claims were not awarded, particularly among high-risk, essential worker groups, such as nursing home staff. The results may help generate more meaningful outreach and communication to workers on how to receive benefits. Also, it should address the need for improved access to medical treatment options afforded to claimants under WC insurance.69 Poor treatment options discourage filing and may pose even greater barriers to workers seeking treatment of a post-COVID condition or “long COVID,” because of the wide array of symptoms for which treatment may be needed. Given recent estimates that 16 million working-aged adults in the United States have long COVID, there is a need to better understand how the WC program is addressing the work relatedness of long-COVID claims and treatment needs.70
CONCLUSIONS
COVID-19 WC claims provide an important element of the full picture of the burden caused by occupational COVID-19, even though they cannot be used to provide a complete and accurate picture of occupational risk of COVID-19.13,17,64 At present, the NYS WC system provides modest wage and medical support to a likely sizable workforce exposed to or infected by COVID-19 on the job.
ACKNOWLEDGMENTS
The authors would like to acknowledge Robert Grey, Leslie Boden, Sherry Baron, John Meyer, and Michael Crane for their contribution through comments and suggestions.
Footnotes
Funding sources: Funding for this project was provided by the Barry Commoner Center for Health and the Environment.
Conflict of interest: The authors have no relationships/conditions/circumstances that present potential conflict of interest.
Financial relationships with entities as reported on the CTF form: S.M. receives compensation from law firms for expert medical/legal testimony and the insulators union. S.M. serves as a board member for Federal DOL (ABTSWH) and National Institute for Occupational Safety and Health WTC STAC (neither of which is compensated). Z.L. has no financial relationships to report.
Social media: Linkedin: www.linkedin.com/in/zoey-laskaris.
Supplemental digital contents are available for this article. Direct URL citation appears in the printed text and is provided in the HTML and PDF versions of this article on the journal’s Web site (www.joem.org).
REFERENCES
- 1.Waltenburg M Rose C Victoroff T, et al. Coronavirus disease among workers in food processing, food manufacturing, and agriculture workplaces. Emerg Infect Dis J 2021;27:243–249. [DOI] [PMC free article] [PubMed] [Google Scholar]
- 2.Dyal JW Grant MP Broadwater K, et al. COVID-19 among workers in meat and poultry processing facilities—19 states, April 2020. MMWR Morb Mortal Wkly Rep 2020;69. [DOI] [PubMed] [Google Scholar]
- 3.Cummings KJ Beckman J Frederick M, et al. Disparities in COVID-19 fatalities among working Californians. PLoS One 2022;17:e0266058. [DOI] [PMC free article] [PubMed] [Google Scholar]
- 4.Heinzerling A. COVID-19 outbreaks and mortality among public transportation workers—California, January 2020–May 2022. MMWR Morb Mortal Wkly Rep 2022;71:1052–1056. [DOI] [PMC free article] [PubMed] [Google Scholar]
- 5.Heinzerling A Nguyen A Frederick M, et al. Workplaces acovid-19 outbreaks in California, January 2020–August 2021. Am J Public Health 2022;112:1180–1190. [DOI] [PMC free article] [PubMed] [Google Scholar]
- 6.Murti M Achonu C Smith BT, et al. COVID-19 workplace outbreaks by industry sector and their associated household transmission, Ontario, Canada, January to June, 2020. J Occup Environ Med 2021;63:574–580. [DOI] [PMC free article] [PubMed] [Google Scholar]
- 7.Buchan SA Smith PM Warren C, et al. Incidence of outbreak-associated COVID-19 cases by industry in Ontario, Canada, 1 April 2020–31 March 2021. Occup Environ Med 2022;79:403–411. [DOI] [PubMed] [Google Scholar]
- 8.Bui DP McCaffrey K Friedrichs M, et al. Racial and ethnic disparities among COVID-19 cases in workplace outbreaks by industry sector—Utah, March 6–June 5, 2020. MMWR Morb Mortal Wkly Rep 2020;69:1133–1138. [DOI] [PMC free article] [PubMed] [Google Scholar]
- 9.Contreras Z Ngo V Pulido M, et al. Industry sectors highly affected by worksite outbreaks of coronavirus disease, Los Angeles County, California, USA, March 19–September 30, 2020. Emerg Infect Dis 2021;27:1769–1775. [DOI] [PMC free article] [PubMed] [Google Scholar]
- 10.Center for Medicare and Medicaid Services . COVID-19 Nursing Home Data. 2022. Available at: https://data.cms.gov/covid-19/covid-19-nursing-home-data. Accessed September 1, 2022.
- 11.Sims KM, Foltz J, Skidmore ME. Prisons and COVID-19 spread in the United States. Am J Public Health 2021;111:1534–1541. [DOI] [PMC free article] [PubMed] [Google Scholar]
- 12.Azaroff LS, Levenstein C, Wegman DH. Occupational injury and illness surveillance: conceptual filters explain underreporting. Am J Public Health 2002;92:1421–1429. [DOI] [PMC free article] [PubMed] [Google Scholar]
- 13.Spieler EA, Burton JF., Jr. The lack of correspondence between work-related disability and receipt of workers' compensation benefits. Am J Ind Med 2012;55:487–505. [DOI] [PubMed] [Google Scholar]
- 14.Mcinerney M. Examining differences by ethnicity in the propensity to file for workers' compensation insurance. The 2015 Department of Labor Scholars Program 2015;88. Available at: https://www.dol.gov/sites/dolgov/files/OASP/legacy/files/2015_DOL_Scholars_Paper_Series_McInerney_Report.pdf. Accessed December 1, 2022. [Google Scholar]
- 15.Morse T Dillon C Kenta-Bibi E, et al. Trends in work-related musculoskeletal disorder reports by year, type, and industrial sector: a capture-recapture analysis. Am J Ind Med 2005;48:40–49. [DOI] [PubMed] [Google Scholar]
- 16.Spieler EA. (Re) assessing the grand bargain: compensation for work injuries in the United States, 1900–2017. Rutgers UL Rev 2016;69:891. [Google Scholar]
- 17.Burton JF., Jr. Report of the National Commission on State Workmen's Compensation Laws. Workmens Comp L Rev 1974;1:361. [DOI] [PubMed] [Google Scholar]
- 18.Grabell M, Berkes H. The demolition of workers' comp. ProPublica and National Public Radio 2015. Available at: https://www.propublica.org/article/the-demolition-of-workers-compensation. Accessed December 1, 2022. [Google Scholar]
- 19.Groenewold MR, Baron SL. The proportion of work-related emergency department visits not expected to be paid by workers' compensation: implications for occupational health surveillance, research, policy, and health equity. Health Serv Res 2013;48(6 Pt 1):1939–1959. [DOI] [PMC free article] [PubMed] [Google Scholar]
- 20.Reville RT, Schoeni RF. The fraction of disability caused at work. Soc Secur Bull 2003;65:31–37. [PubMed] [Google Scholar]
- 21.National Council on Compensation Insurance . COVID-19 Workers Compensation Presumptions Update—Five Things You Need to Know. 2022. Available at: https://www.ncci.com/Articles/Pages/Insights-COVID-19-WorkersComp-Presumptions-Update-5-Things-to-Know.aspx. Accessed September 23, 2022.
- 22.Hyman MH, Talmage JB, Hegmann KT. Evaluating COVID-19 injury claims with a focus on workers' compensation. J Occup Environ Med 2020;62:692–699. [DOI] [PubMed] [Google Scholar]
- 23.Pray IW, Kocharian A, Mason J, Westergaard R, Meiman J. Trends in outbreak-associated cases of COVID-19—Wisconsin, March–November 2020. MMWR Morb Mortal Wkly Rep 2021;70:114–117. [DOI] [PMC free article] [PubMed] [Google Scholar]
- 24.Bonwitt J Deya RW Currie DW, et al. COVID-19 surveillance and investigations in workplaces—Seattle & King County, Washington, June 15–November 15, 2020. MMWR Morb Mortal Wkly Rep 2021;70:916–921. [DOI] [PMC free article] [PubMed] [Google Scholar]
- 25.Laskaris Z, Hirschtick JL, Xie Y, McKane P, Fleischer NL. COVID-19 in the workplace: self-reported source of exposure and availability of personal protective equipment by industry and occupation in Michigan. Am J Ind Med 2022;65:994–1005. [DOI] [PMC free article] [PubMed] [Google Scholar]
- 26.Center for Disease Control and Prevention . COVID-19 Case Surveillance Public Use Data With Geography. 2022. Available at: https://data.cdc.gov/Case-Surveillance/COVID-19-Case-Surveillance-Public-Use-Data-with-Ge/n8mc-b4w4. Accessed October 1, 2022.
- 27.New York State Workers' Compensation Board . Assembled Workers' Compensation Claims: Beginning 2000. 2022. Updated June 22, 2022. Available at: https://data.ny.gov/Government-Finance/Assembled-Workers-Compensation-Claims-Beginning-20/jshw-gkgu. Accessed July 1, 2022.
- 28.New York State Workers' Compensation Board . Assembled Workers Compensation Claims Data Dictionary. 2022. Available at: https://data.ny.gov/Government-Finance/Assembled-Workers-Compensation-Claims-Beginning-20/jshw-gkgu. Accessed July 1, 2022.
- 29.New York state Workers' Compensation Board . Workers' Compensation Information for Employers. 2022. Available at: http://www.wcb.ny.gov/content/main/Employers/lp_workers-compensation.jsp. Accessed August 1, 2022.
- 30.Workers' Compensation Law, §9–35.
- 31.New York state Workers' compensation board . Workers' Compensation Schedule of Maximum Weekly Benefit. 2022. Available at: http://www.wcb.ny.gov/content/main/Workers/ScheduleMaxWeeklyBenefit.jsp. Accessed October 1, 2022.
- 32.New York State Government . Paid Leave for COVID-19. 2020. Available at: https://paidfamilyleave.ny.gov/if-you-are-quarantined-yourself. Accessed August 1, 2022.
- 33.New York State Workers' Compensation Board . COVID-19 & Workers' Compensation Q&A. 2020. Available at: http://www.wcb.ny.gov/covid-19/information-workers.jsp#faqs. Accessed August 1, 2022.
- 34.U.S. Office of Management and Budget . North American Industry Classification System. 2017. Available at: https://www.census.gov/naics/reference_files_tools/2017_NAICS_Manual.pdf. Accessed January 20, 2021.
- 35.National Institute for Occupational Safety and Health . Essential Workers Code Set. 2021. Available at: https://www.cdc.gov/niosh/topics/coding/essentialworkers/default.html. Accessed February 1, 2022.
- 36.US Department of Homeland Security—Cybersecurity and Infrastructure Secruity Agency . Advisory memorandum on ensuring essential critical infrastructure workers ability to work during the COVID-19 response (Version 4.0). 2020. Available at: https://www.cisa.gov/sites/default/files/publications/ECIW_4.0_Guidance_on_Essential_Critical_Infrastructure_Workers_Final3_508_0.pdf. Accessed March 5, 2021.
- 37.Center for Medicare and Medicaid Services . Interim Final Rule Updating Requirements for Notification of Confirmed and Suspected COVID-19 Cases Among Residents and Staff in Nursing Homes. 2020. Available at: https://www.cms.gov/files/document/qso-20-29-nh.pdf. Accessed September 1, 2022.
- 38.Center for Medicare and Medicaid Services . COVID-19 Nursing Home Methodology. Available at: https://data.cms.gov/resources/covid-19-nursing-home-methodology. Accessed September 1, 2022.
- 39.U.S. Bureau of Labor Statistics. Quarterly Census of Employment and Wages . NAICS-Based Data Files: 2020 Annual Averages By Industry. Available at: https://www.bls.gov/cew/downloadable-data-files.htm. Accessed January 4, 2022.
- 40.New York State Government . New York Paid Sick Leave. 2021. Available at: https://www.ny.gov/new-york-paid-sick-leave/new-york-paid-sick-leave. Accessed September 1, 2022.
- 41.Rosenman KD Gardiner JC Wang J, et al. Why most workers with occupational repetitive trauma do not file for workers' compensation. J Occup Environ Med 2000;42:25–34. [DOI] [PubMed] [Google Scholar]
- 42.Leigh JP, Marcin JP. Workers' compensation benefits and shifting costs for occupational injury and illness. J Occup Environ Med 2012;54:445–450. [DOI] [PubMed] [Google Scholar]
- 43.Grey RE. System Failure: Essential Workers and COVID-19 in New York State. 2021. Available at: https://secureservercdn.net/166.62.114.250/cj0.ca9.myftpupload.com/wp-content/uploads/2021/04/System-Failure-Release.pdf?time=1619533803. Accessed November 1, 2022.
- 44.Ouslander JG, Grabowski DC. COVID-19 in nursing homes: calming the perfect storm. J Am Geriatr Soc 2020;68:2153–2162. [DOI] [PubMed] [Google Scholar]
- 45.Gibson DM, Greene J. State actions and shortages of personal protective equipment and staff in U.S. nursing homes. J Am Geriatr Soc 2020;68:2721–2726. [DOI] [PMC free article] [PubMed] [Google Scholar]
- 46.New York State Department of Health . Factors Associated With Nursing Home Infections and Fatalities in New York State During the COVID-19 Global Health Crisis. 2021. Available at: https://www.health.ny.gov/press/releases/2020/docs/nh_factors_report.pdf. Accessed September 23, 2022.
- 47.True S Cubanski J Garfield R, et al. COVID-19 and Workers at Risk: Examining the Long-Term Care Workforce. San Francisco, CA: Kaiser Family Foundation; 2020. [Google Scholar]
- 48.U.S. Bureau of Labor Statistics . Employed persons by detailed industry, sex, race, and Hispanic or Latino ethnicity. Labor Force Statistics from the Current Population Survey 2021. Available at: https://www.bls.gov/cps/cpsaat18.htm. Accessed December 1, 2022. [Google Scholar]
- 49.Toblin RL, Hagan LM. COVID-19 case and mortality rates in the federal bureau of prisons. Am J Prev Med 2021;61:120–123. [DOI] [PMC free article] [PubMed] [Google Scholar]
- 50.Modji KKS Morris CR Creswell PD, et al. Lost time: COVID-19 indemnity claim reporting and results in the Wisconsin workers' compensation system from March 12 to December 31, 2020. Am J Ind Med 2022;65:1006–1021. [DOI] [PMC free article] [PubMed] [Google Scholar]
- 51.Chen YH Glymour M Riley A, et al. Excess mortality associated with the COVID-19 pandemic among Californians 18–65 years of age, by occupational sector and occupation: March through November 2020. PLoS One 2021;16:e0252454. [DOI] [PMC free article] [PubMed] [Google Scholar]
- 52.Hawkins D, Davis L, Kriebel D. COVID-19 deaths by occupation, Massachusetts, March 1–July 31, 2020. Am J Ind Med 2021;64:238–244. [DOI] [PMC free article] [PubMed] [Google Scholar]
- 53.Billock RM, Steege AL, Miniño A. COVID-19 mortality by usual occupation and industry:46 States and New York City, United States, 2020. Natl Vital Stat Rep 2022;71:1–33. [PubMed] [Google Scholar]
- 54.California Workers' Compensation Institute . COVID-19 and NON-COVID Interactive App. 2022. Available at: https://www.cwci.org/CV19claims.html. Accessed August 1, 2022.
- 55.Safety & Health Assessment & Research for Prevention (SHARP) . Workers' Compensation Claims for Exposure to and Disease From COVID-19: Washington State Fund and Self-Insured Claims Established between Feb 26, 2020 and August 1, 2022. 2022. October 2022. Available at: https://lni.wa.gov/safety-health/safety-research/files/2022/64_47_2022_wcCOVID_Oct.pdf. Accessed October 1, 2022.
- 56.Bernacki EJ Hunt DL Yuspeh L, et al. What industrial categories are workers at excess risk of filing a COVID-19 workers' compensation claim? A study conducted in 11 Midwestern US States. J Occup Environ Med 2021;63:374–380. [DOI] [PMC free article] [PubMed] [Google Scholar]
- 57.Goldman N, Pebley AR, Lee K, Andrasfay T, Pratt B. Racial and ethnic differentials in COVID-19–related job exposures by occupational status in the US. PLoS One 2021;16:e0256085. [DOI] [PMC free article] [PubMed] [Google Scholar]
- 58.McClure ES, Vasudevan P, Bailey Z, Patel S, Robinson WR. Racial capitalism within public health-how occupational settings drive COVID-19 disparities. Am J Epidemiol 2020;189:1244–1253. [DOI] [PMC free article] [PubMed] [Google Scholar]
- 59.Carlsten C Gulati M Hines S, et al. COVID-19 as an occupational disease. Am J Ind Med 2021;64:227–237. [DOI] [PMC free article] [PubMed] [Google Scholar]
- 60.Himmelstein DU, Woolhandler S. Health insurance status and risk factors for poor outcomes With COVID-19 among U.S. health care workers: a cross-sectional study. Ann Intern Med 2020;173:410–412. [DOI] [PMC free article] [PubMed] [Google Scholar]
- 61.Bonauto DK Fan JZ Largo TW, et al. Proportion of workers who were work-injured and payment by workers' compensation systems—10 states, 2007. Morb Mortal Wkly Rep 2010;59:897–900. [PubMed] [Google Scholar]
- 62.Fan ZJ, Bonauto DK, Foley MP, Silverstein BA. Underreporting of work-related injury or illness to workers' compensation: individual and industry factors. J Occup Environ Med 2006;48:914–922. [DOI] [PubMed] [Google Scholar]
- 63.Boden LI, Ozonoff A. Capture–recapture estimates of nonfatal workplace injuries and illnesses. Ann Epidemiol 2008;18:500–506. [DOI] [PubMed] [Google Scholar]
- 64.Strategic Organizing Center . Hidden Pandemic: Amazon's Secrecy and Obstruction During the COVID-19 Crisis. 2021. Available at: https://thesoc.org/wp-content/uploads/2021/11/Hidden-Pandemic-Amazons-Secrecy-And-Obstruction-During-The-COVID-19-Crisis.pdf. Accessed October 1, 2022.
- 65.United States Department of Labor Occupational Safety and Health Administration . Revised Enforcement Guidance for Recording Cases of Coronavirus Disease 2019 (COVID-19). 2020. Available at: https://www.osha.gov/laws-regs/standardinterpretations/2020-05-19. Accessed July 1, 2022.
- 66.United States Department of Labor Occupational Safety and Health Administration . U.S. Department of Labor Issues Frequently Asked Questions and Answers About Reporting Work-Related Cases of the Coronavirus. 2020. Available at: https://www.osha.gov/news/newsreleases/national/09302020. Accessed September 1, 2022.
- 67.Matilla-Santander N Ahonen E Albin M, et al. COVID-19 and precarious employment: consequences of the evolving crisis. Int J Health Serv 2021;51:226–228. [DOI] [PMC free article] [PubMed] [Google Scholar]
- 68.Tsui EK Franzosa E Vignola EF, et al. Recognizing careworkers' contributions to improving the social determinants of health: a call for supporting healthy carework. New Solut 2021;32:9–18. [DOI] [PubMed] [Google Scholar]
- 69.Lax MB, Manetti FA. Access to medical care for individuals with workers' compensation claims. New Solut 2002;11:325–348. [DOI] [PubMed] [Google Scholar]
- 70.Bach K. New Data Shows Long COVID Is Keeping as Many as 4 Million People Out of Work. Washington, DC: Brookings Institution; 2022:24. [Google Scholar]