

Abstract
Cyclic adenosine monophosphate (cAMP) integrates information from diverse G protein-coupled receptors, such as neuromodulator receptors, to regulate pivotal biological processes in a cellular- and subcellular-specific manner. However, in vivo cellular-resolution imaging of cAMP dynamics in neurons has not been demonstrated. Here, we screen existing genetically-encoded cAMP sensors, and further develop the best performer to derive three improved variants, called cAMPFIREs. These sensors exhibit up to ten-fold increased sensitivity to cAMP and a corrected, cytosolic distribution. cAMPFIREs are compatible with both ratiometric and fluorescence lifetime imaging and can detect cAMP dynamics elicited by norepinephrine at physiologically-relevant, nanomolar concentrations. Imaging of cAMPFIREs in awake mice reveals tonic levels of cAMP in cortical neurons that are associated with wakefulness, modulated by opioids, and differentially regulated across subcellular compartments. Furthermore, enforced locomotion elicits neuron-specific, bidirectional cAMP dynamics. cAMPFIREs also function in Drosophila. Overall, cAMPFIREs may have broad applicability for studying intracellular signaling in vivo.
Introduction
Cyclic adenosine monophosphate (cAMP) is a ubiquitous second messenger found in nearly all organisms1,2. Three out of four major classes of G protein-coupled receptors (GPCRs) – those coupling to Gs, Gi and Gq proteins – function through cAMP, which regulate diverse neuronal and brain circuit functions3–5. In the mammalian brain, major neuromodulators, such as norepinephrine (NE), dopamine and acetylcholine, converge onto cAMP in a cell-specific manner3,5: the same neuromodulator may increase or decrease intracellular cAMP concentrations in different cells, depending on the differential expression of GPCR subtypes. Furthermore, cAMP dynamics may be subcellularly compartmentalized6,7.
Towards dissecting the spatiotemporal regulation of cAMP, over 50 genetically-encoded sensors have been developed8,9 and used to report cAMP activity in in vitro and ex vivo preparations (e.g., ref 10 and 11). However, imaging these sensors in vivo at cellular resolution remains difficult. Pink Flamindo has been imaged in non-neuronal cells in live mice12, but the signal remains low and this sensor best matures at a temperature below 37 °C13. Additionally, although a PKA activity sensor has also been used for in vivo imaging14, PKA phosphorylation is further downstream, may be regulated by phosphatases, and does not capture cAMP functions mediated by non-PKA effectors9. Therefore, direct in vivo cAMP imaging remains needed. To date, imaging of cAMP in neurons at cellular or subcellular resolution during behavior has not been achieved.
Herein, we compared existing cAMP sensors9,13,15–21, both Förster resonance energy transfer (FRET)-based and intensity-based, in human embryonic kidney (HEK)-293 cells. We identified the best performer, and further engineered three enhanced variants named cAMP Fluorescence Imaging Reporters based on Epac (cAMPFIREs). cAMPFIREs exhibit up to 10-fold increased sensitivity to cAMP and can detect cAMP dynamics elicited by physiologically-relevant, nanomolar concentrations of norepinephrine. These sensors exhibit an improved, even subcellular distribution and reduced protein aggregation. Importantly, cAMPFIREs are compatible with both ratiometric and fluorescence lifetime imaging microscopy (FLIM) approaches of FRET imaging. These sensors allowed for longitudinal in vivo imaging of bi-directional cAMP dynamics in mouse layer 2/3 (L23) cortical neurons with single-cell and subcellular resolutions. The results revealed a tonic level of cAMP in cortical neurons that was dependent on wakefulness, modulated by adrenergic receptors in a neuronal compartment-specific manner, and affected by morphine. Animal locomotion triggered cell-specific, up or down regulation of cAMP in different L23 neurons. In situ live cAMP imaging in neurons of Drosophila larvae was also demonstrated.
Results
Screening existing cAMP sensors
Learning from recent sensor developments14,22,23, we first compared promising current cAMP sensors under identical conditions in HEK cells. Eight sensors9,13,15–21, including both FRET-based and intensity-based ones, were assessed for both their responses to a physiological ligand, norepinephrine (1 μM), and their maximal dynamic ranges, as elicited by the adenylyl cyclase agonist forskolin (25 μM) and phosphodiesterase inhibitor IBMX (50 μM) (Figs. 1a and 1b). To compare across imaging modalities, the responses were normalized to their respective baselines (i.e., ΔRatio/Ratio0 or ΔF/F0) (Figs. 1c–1e).
Fig. 1. Screening of existing cAMP sensors.
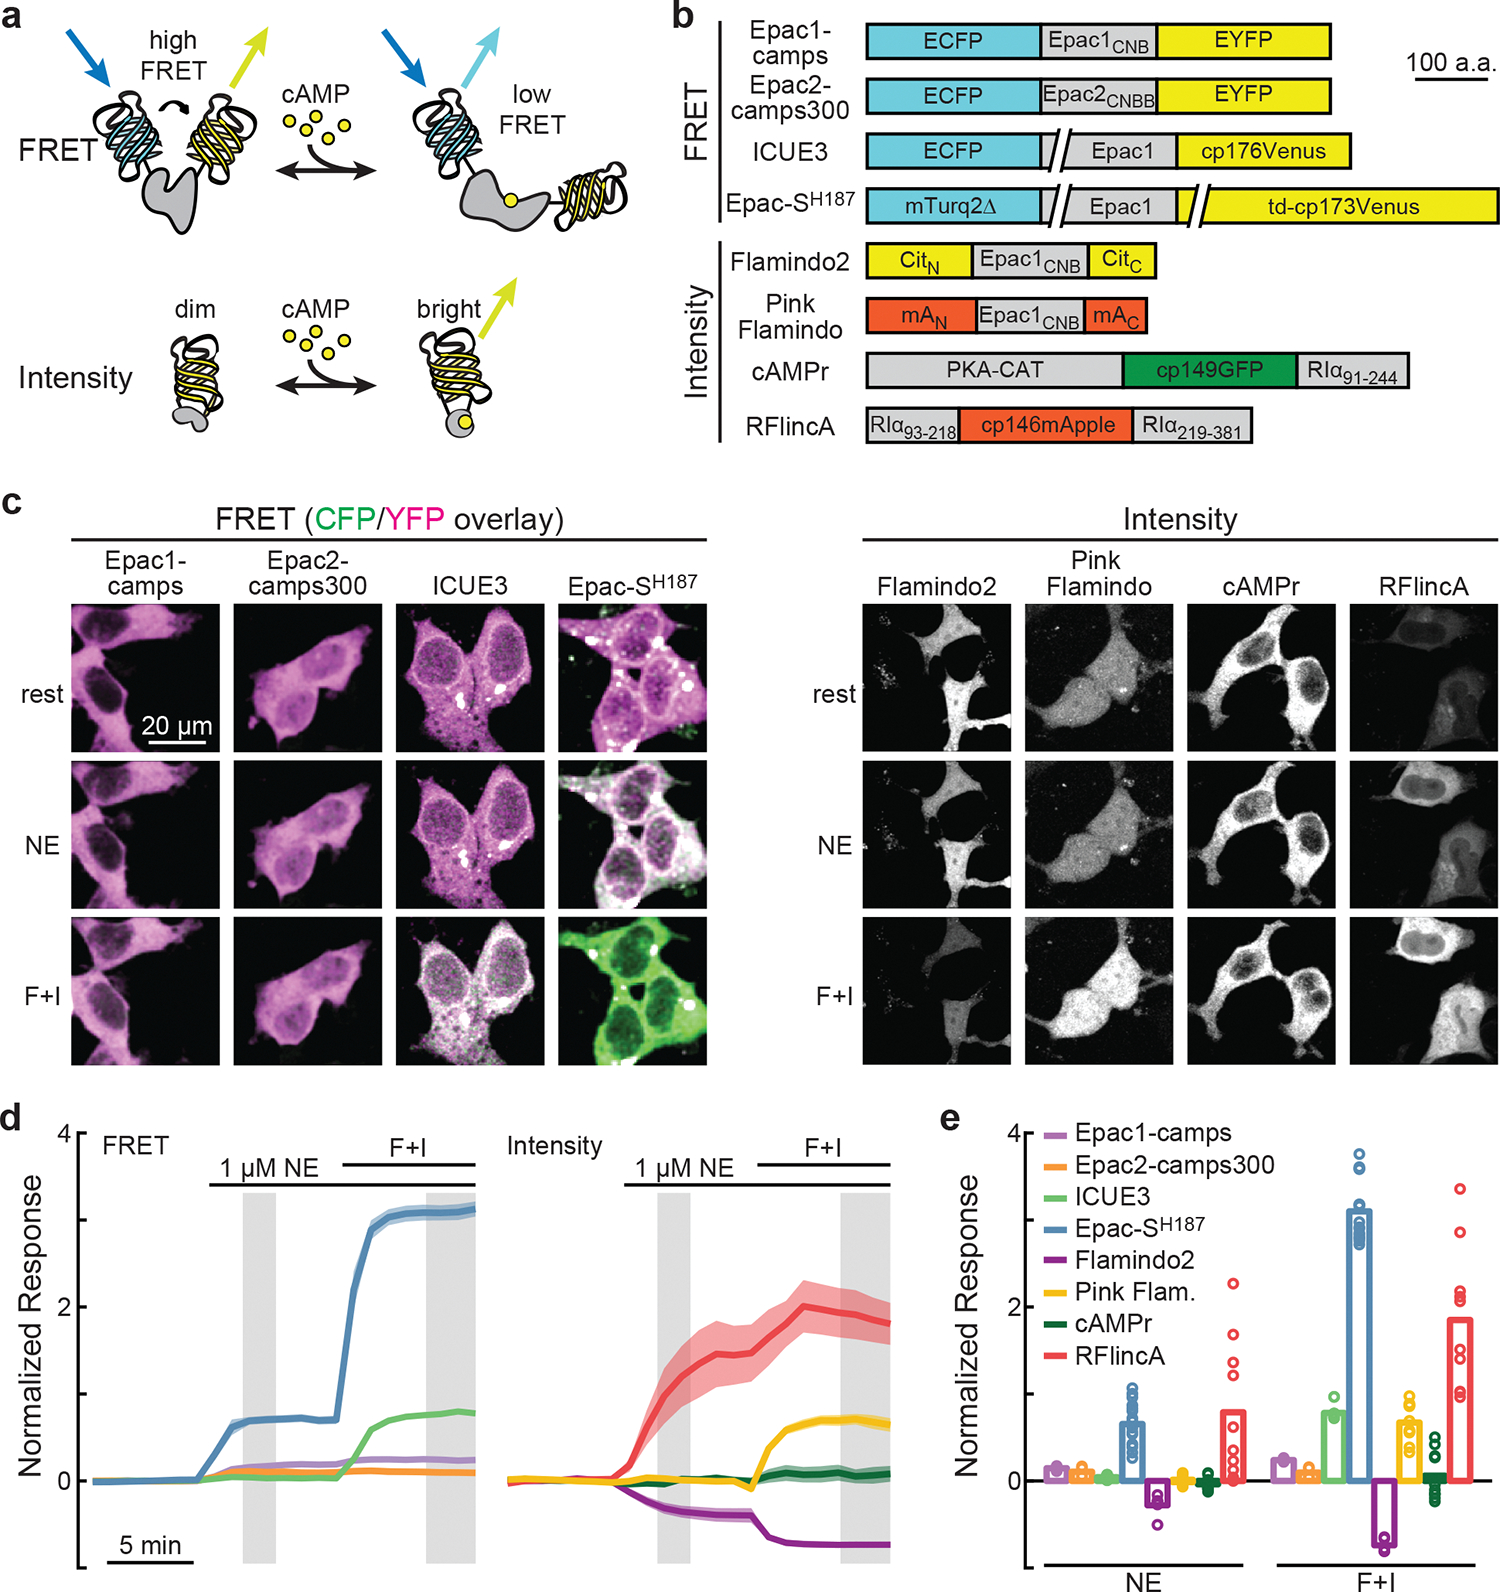
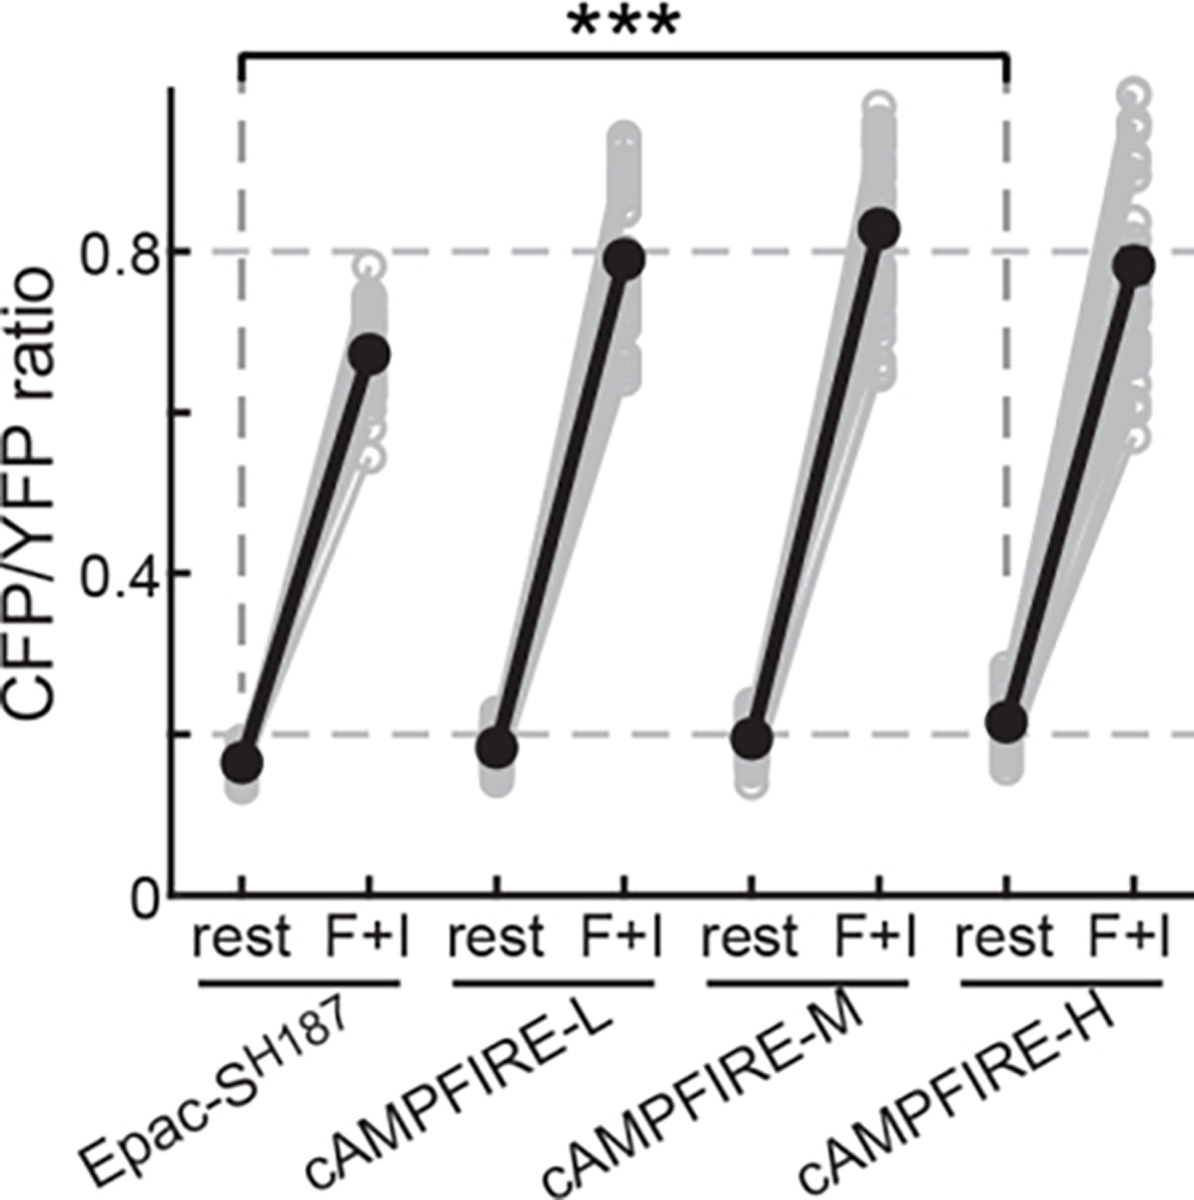
a, General schematic of FRET-based and intensity-based cAMP sensors. b, Schematics of the cAMP sensors tested. Epac1CNB and Epac2CNBB: CNB-B domain of Epac1 and Epac2, respectively; CitN and CitC: residue 1–144 and 146–238 of Citrine, respectively; mAN and mAC: residues 1–150 and 151–236 of mApple, respectively; PKA-CAT: PKA catalytic subunit α; RIα91–244, RIα93–218, and RIα219–381: residues 91–244, 93–218, and 219–381, respectively, of PKA regulatory subunit Iα; cp: circularly permutated. c, Representative images of the tested sensors at rest, after stimulation with NE (1 μM), and followed by 25 μM forskolin and 50 μM IBMX (F + I). CFP and YFP ratiometric images are shown as a pseudocolored green (CFP) and magenta (YFP) overlay. To compare across cells, for ratiometric images, the same ratio of intensity setting was used for image display across sensors; whereas intensity images were adjusted according to the brightest state. d & e, Averaged response (ΔR/R0, or ΔF/F0) traces (d) and quantifications at the grayed time window in panel d (e) of each sensor. From left to right, n (cells) = 5, 4, 6, 16, 5, 10, 10, 10. Dark line and shaded area indicate average and s.e.m. respectively. Bars indicate mean.
Epac-SH187 (Fig. 1b; ref 19) stood out for three reasons. First, it exhibited the largest dynamic range and second-largest response to norepinephrine (Figs. 1d and 1e). Second, compared to others, Epac-SH187 exhibited fast and consistent responses across experiments (Figs. 1d and 1e). Third, it uses mTurquoise2 as the FRET donor, which exhibits a single-exponential fluorescence lifetime24. This makes the sensor suitable for FLIM imaging, which has advantages in brain tissue and for slow signaling dynamics (≥ seconds)9,25,26. However, Epac-SH187 exhibited two limitations. First, its response to norepinephrine was only 22% of its dynamic range, suggesting a moderate sensitivity (Figs. 1d and 1e). Second, the sensor adopted an uneven, perinuclear distribution in cells27,28 and exhibited a high tendency to form aggregates (Extended Data Figs. 1 and 2).
Correcting the uneven subcellular distribution
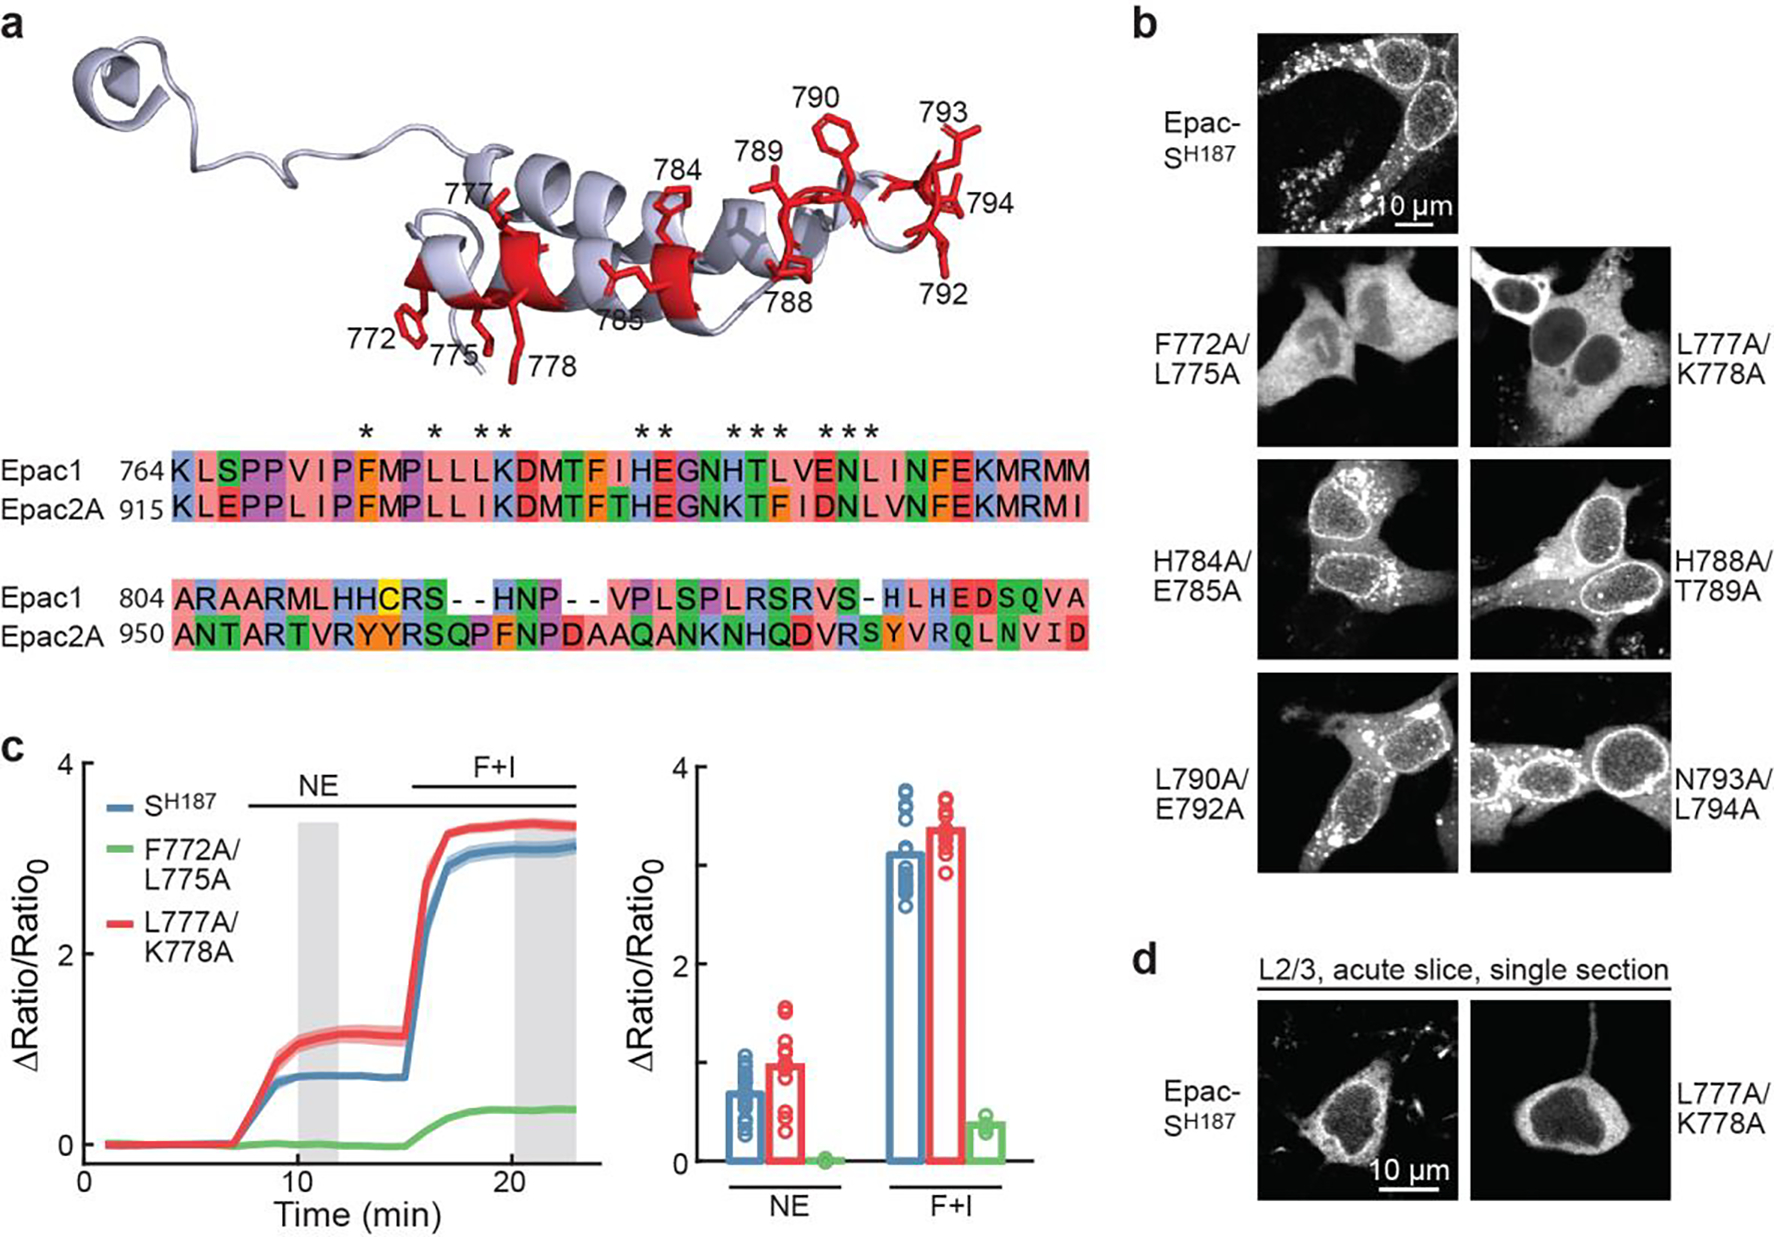
We first corrected the uneven subcellular distribution of Epac-SH187. Its parental protein, Epac1, is localized to the membrane via a Dishevelled, Egl-10, and Pleckstrin (DEP) domain and to the perinuclear structure via a nuclear pore localization (NPL) sequence (Fig. 2a)27–29. In Epac-SH187, the DEP domain has been removed19; however, the NPL sequence remains (Figs. 2a and 2b), resulting in perinuclear localizations (Figs. 2c and 2d, and Extended Data Fig. 1b). This is not only undesirable for a sensor, but may also impact cellular function: the sensor’s occupancy at the location of endogenous Epac could potentially cause dominant-negative effects.
Fig. 2. Developing cAMPFIREs.
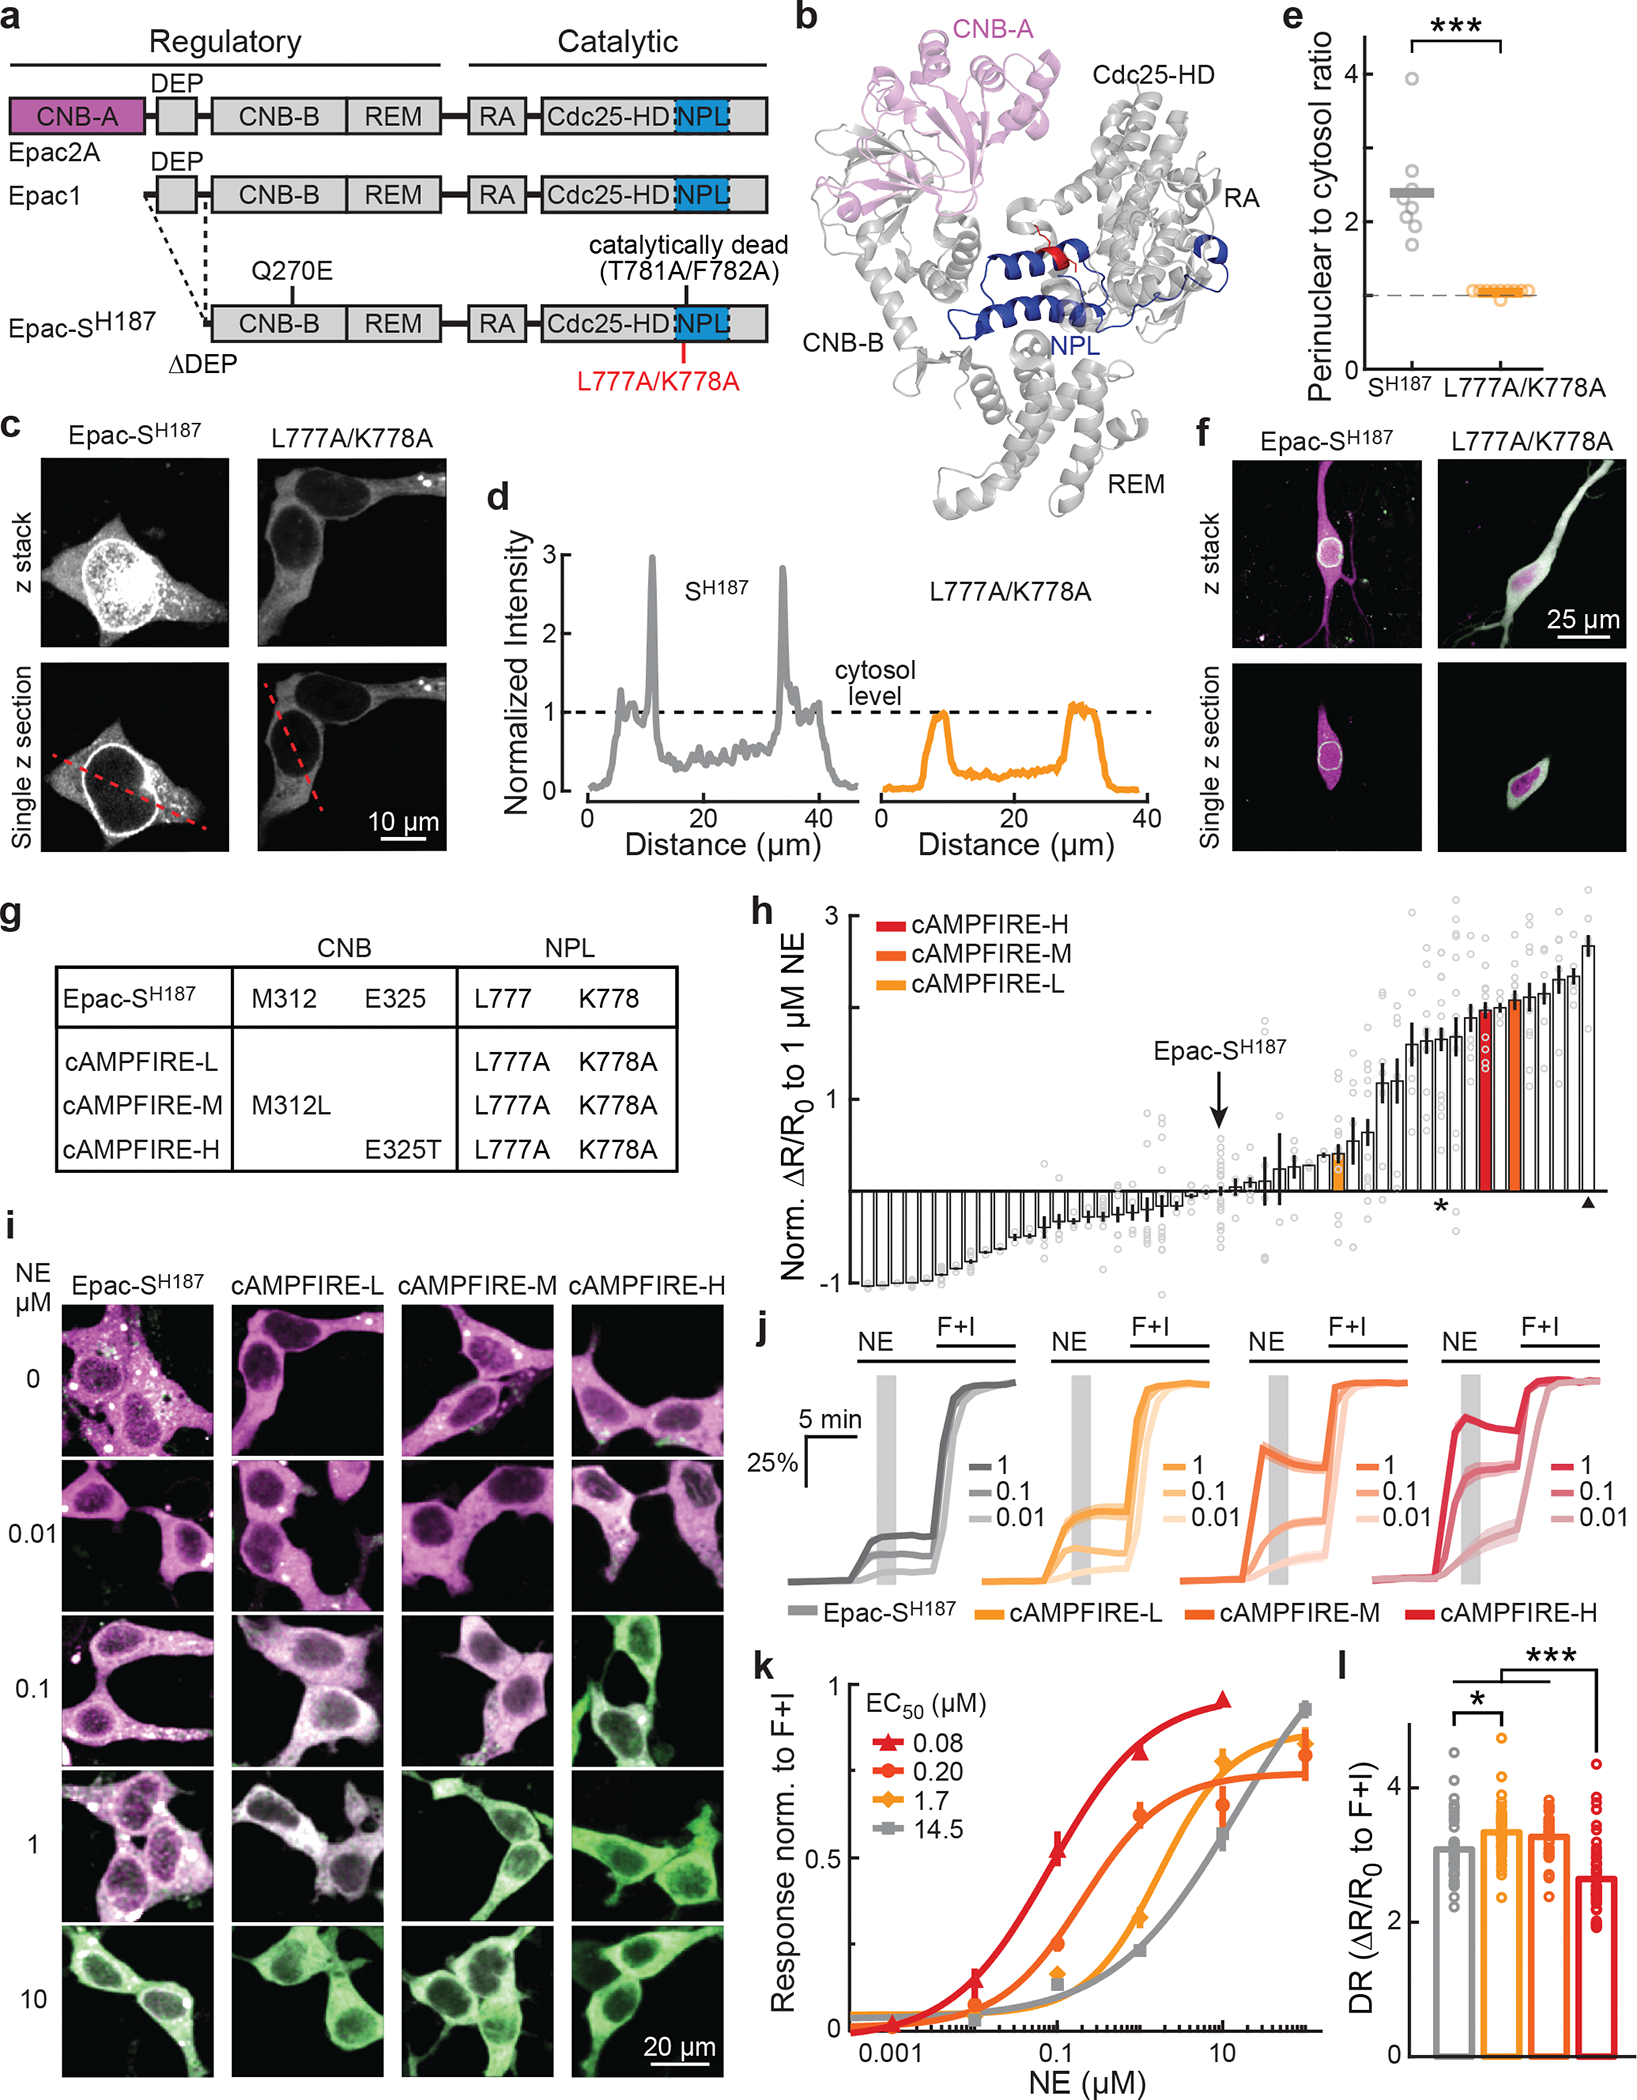
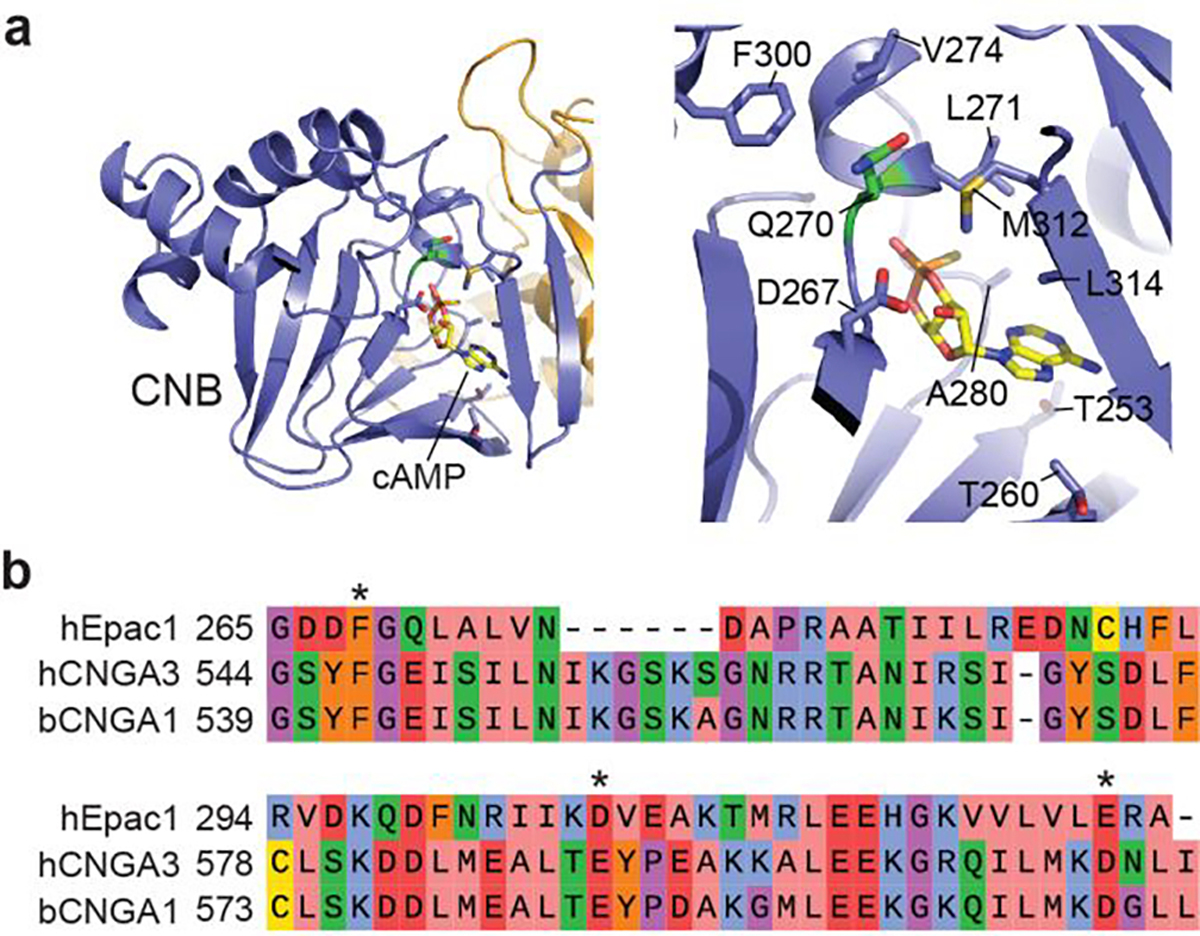
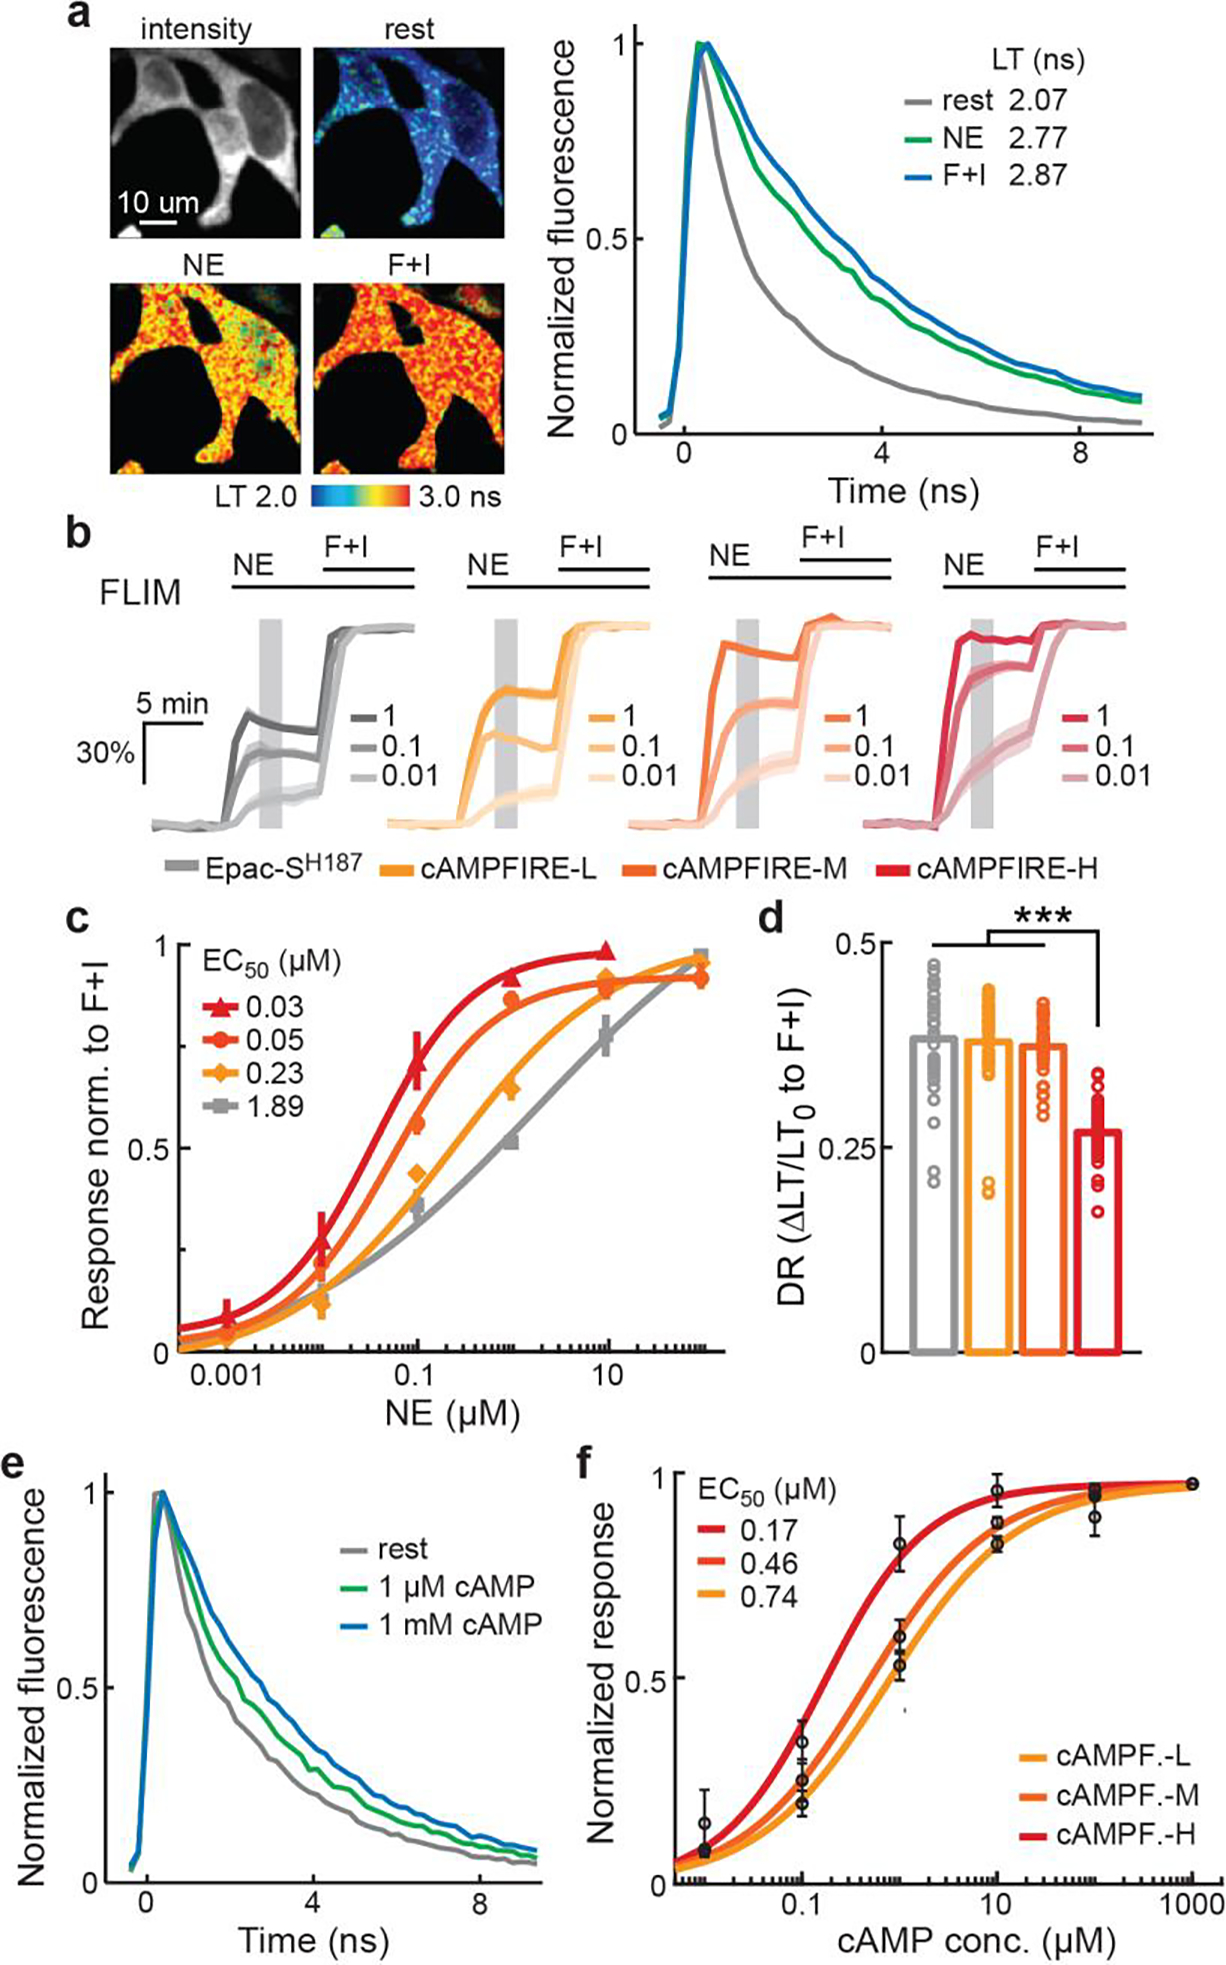
a, Schematic domain organization of Epac2A, Epac1, and Epac-SH187. CNB, cyclic nucleotide binding domain; DEP, Dishevelled, Egl-10, Pleckstrin and domain; REM, Ras-exchange motif; RA, ras-association domain; CDC25-HD, CDC25 homology domain; NPL, nuclear pore localization sequence. b, The crystal structure of Epac2A in the cAMP-unbound conformation (Protein data bank #2byv). c, Representative images of Epac-SH187 and the L777A/K778A mutant in HEK cells. d, Fluorescence intensity along the dashed line in panel c, normalized to cytosolic average. e, Collective tendency of perinuclear localization, as assayed by dividing the peak intensity near nucleus to the respective cytosol intensity. n = 8 for Epac-SH187, and 10 for L777A/K778A. ***: p < 0.001 (5.8×10⁻⁴), dF = 7.1, two-tailed Welch test. f, Representative two-photon images of Epac-SH187 and the L777A/K778A mutant (green) contrast with a red cytosolic marker mRuby3 (magenta) expressed in CA1 neurons of cultured hippocampal slices (representative of 26 and 29 neurons, respectively). g, Table illustrating the mutations in each cAMPFIRE variant as compared to the parental sensor. h, The fold changes in the response of screened variants to 1 μM norepinephrine relative to Epac-SH187. n = 2–20 cells each (see Supplementary Notes 1 for exact numbers). Bars and error bars indicate mean and s.e.m, respectively. i–k, Representative ratiometric images (i), response traces normalized to the corresponding responses elicited by forskolin and IBMX (j), and concentration-response curves to norepinephrine fitted by the Hill equation (k) in HEK cells. Hill coefficients = 0.58, 0.99, 0.89, and 0.73, respectively, for Epac-SH187 and cAMPFIRE-L, -M, and -H. n = 4–14 cells for each sensor and concentration data point (see Supplementary Notes 2 for exact numbers). In panel j, dark lines and shaded areas, and in panel k, points and error bars indicate mean and s.e.m respectively. l, Response amplitudes elicited by forskolin and IBMX. DR: dynamic range. From left to right, n (cells) = 52, 45, 41, and 55. Bars represent mean. ***: p < 0.001 (0 for all three comparisons) and *: p < 0.05 (0.03), dF = 3, one-way ANOVA (p = 2×10⁻¹⁴), Tukey-Kramer post-hoc test.
The NPL sequence has been located to a 74-residue sequence on Epac1 (blue in Figs. 2a and 2b)28. It was also reported that, although the homologous protein Epac2 contains a NPL sequence, the cyclic nucleotide-binding A (CNB-A) domain (magenta in Figs. 2a and 2b) present only in Epac2 sterically blocked the function of this NPL sequence28,30. We therefore hypothesized that the perinuclear localization was mediated by exposed NPL residues spatially facing the CNB-A domain. An analysis of the atomic structure of Epac230 identified 12 candidate residues that were conserved in Epac1 (Extended Data Fig. 1a). Systematic mutagenesis resulted in two sets of mutations that disrupted the perinuclear localization (Figs. 2c–2e, and Extended Data Fig. 1b). While the F772A/L775A mutant largely lost its sensor responses, the L777A/K778A mutant exhibited increased responses to norepinephrine (41% increase; Extended Data Fig. 1c). This variant also exhibited an even, cytosolic distribution when expressed in different neuronal types (Fig. 2f and Extended Data Fig. 1d).
Epac-SH187 exhibited a tendency to aggregate, although this tendency was already lowered compared to a variant that used only a single cpVenus as the acceptor (Extended Data Fig. 2)31. The L777A/K778A mutation greatly reduced the number of aggregates (~5 fold; Extended Data Fig. 2), suggesting that the aggregation is related to the perinuclear localization.
Increasing the response sensitivity
We next addressed the insufficient sensitivity. Epac-SH187 exhibited a cAMP EC50 of ~3.8 μM19, which is several folds higher than the physiological cAMP concentration range in cells (~1 μM) and the cAMP-binding affinity of protein kinase A (PKA)32–34. We tried two approaches. First, we examined the structure of the Epac2 CNB-B domain35, which is equivalent to the only CNB domain in Epac1 (Fig. 2a and Extended Data Fig. 3a). Ten candidate residues at or near the cAMP-binding pocket were identified (Extended Data Fig. 3a). A first-round mutagenesis found one mutation (M312F) that abolished the sensor response, suggesting a critical role of M312. Further random mutagenesis at this position identified several mutants with increased norepinephrine response, with M312L exhibiting a response 165 ± 15% larger than Epac-SH187 (asterisk in Fig. 2h). Second, we tested mutations known to enhance ligand affinities in cyclic nucleotide-gated (CNG) channels. Three candidate positions36,37 were aligned to the Epac1 CNB domain (Extended Data Fig. 3b). Among them, several mutations of E325 increased the response to norepinephrine, with E325T exhibiting the largest response (267 ± 13%; triangle in Fig. 2h).
We combined the “delocalization” mutations (L777A/K778A) either without or with M312L or E325T to derive three improved sensors (Fig. 2g). Because Epac-SH187 was named using a construct number internal to the developer’s lab, we renamed our variants cAMPFIRE-L, -M, and -H for low, medium and high affinity, respectively (Figs. 2g and 2h). To better quantify the sensitivity to norepinephrine, we determined the concentration-response curves. Only one dose of norepinephrine was given in each experiment to minimize potential adaptation, and the response was normalized to the corresponding maximal response elicited by forskolin/IBMX (Figs. 2i and 2j). Norepinephrine can trigger physiological responses at 10-nanomolar concentrations14. However, Epac-SH187 exhibited an EC50 of 7.8 ± 3.0 μM (fitted value ± 95% confidence interval; Fig. 2i–2k), two orders of magnitude higher. cAMPFIRE-L, -M, and -H showed 9, 72, and 177-fold increased sensitivity, respectively (Fig. 2k). Responses triggered by as low as 10 nM norepinephrine could be detected. The dynamic ranges of cAMPFIREs, as elicited by forskolin/IBMX, only changed moderately (Fig. 2l). The somewhat decreased dynamic range of cAMPFIRE-H was likely because its much-increased sensitivity elevated the baseline (Extended Data Fig. 4).
Characterizing the specificity and properties
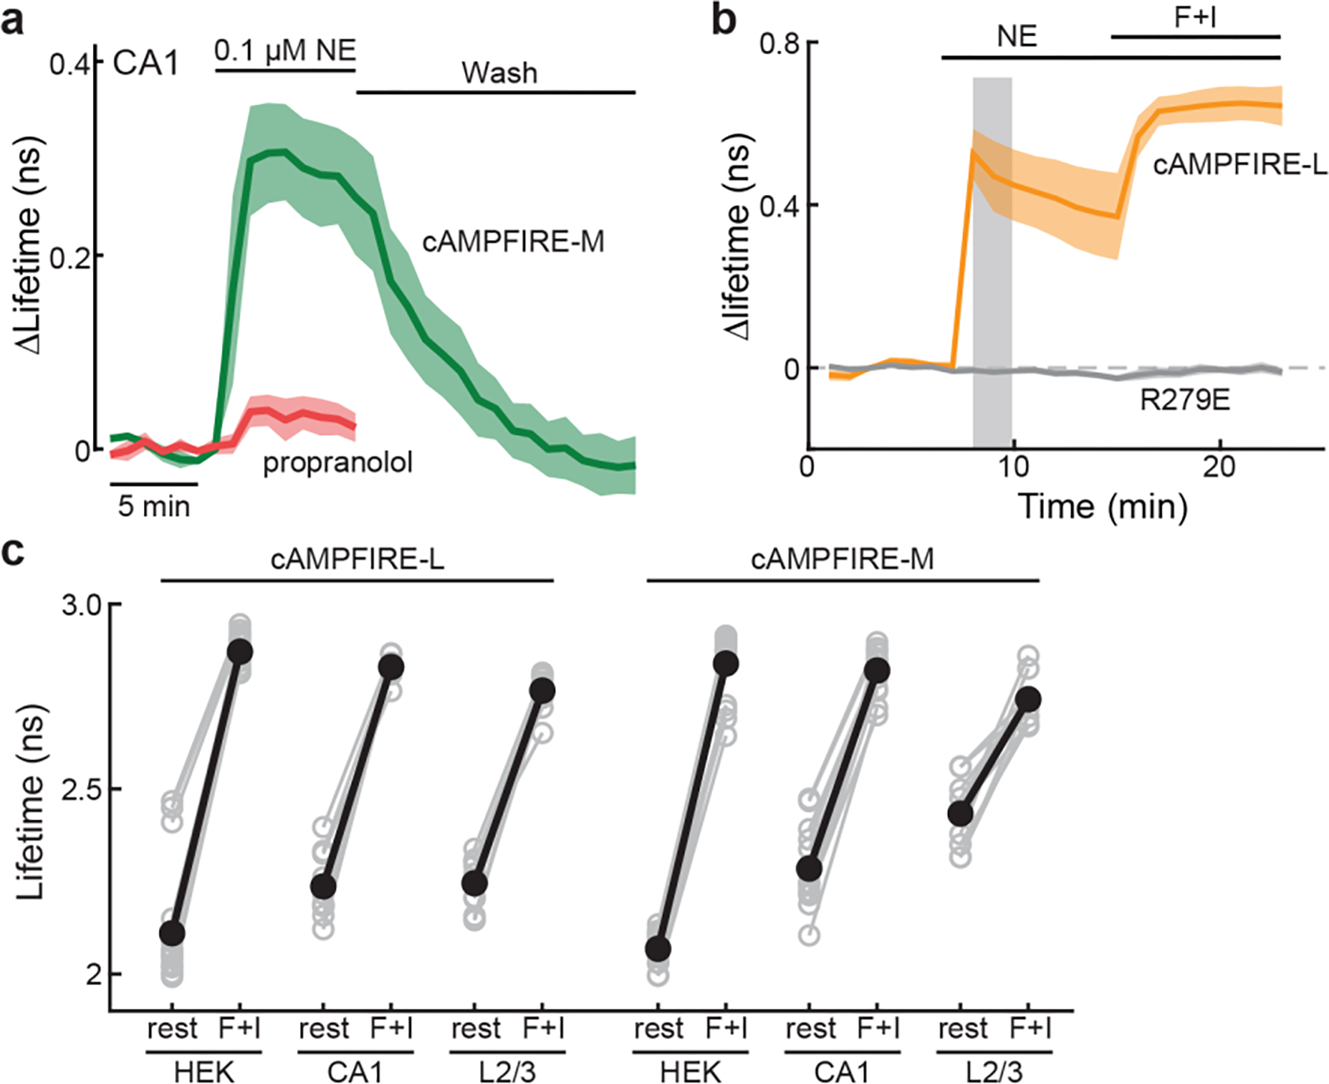
We systematically characterized the properties of cAMPFIREs, first in HEK cells. The response of cAMPFIRE-L was abolished when a residue essential for cAMP binding was mutated (R279E; Fig. 3a)38. The response was reversible (Fig. 3b) and was blocked by the β-adrenergic receptor antagonist propranolol (1 μM) (Fig. 3b). To determine achievable kinetics, we expressed cAMPFIRE-L in HEK cells and delivered short puffs (10 s) of norepinephrine. We observed temperature-dependent on- and off-kinetics with temperature coefficients (Q10) of 2.2 and 1.6, respectively (Figs. 3c and 3d). By extrapolation, on- and off-kinetics were estimated to be 6.2 and 13.8 seconds, respectively, at 37 °C. These kinetics are faster than those of a physiological property, slow afterhyperpolarization (sAHP), in its response to cAMP and PKA in CA1 neurons14.
Fig. 3. Characterization of cAMPFIREs in HEK cells and as purified proteins.
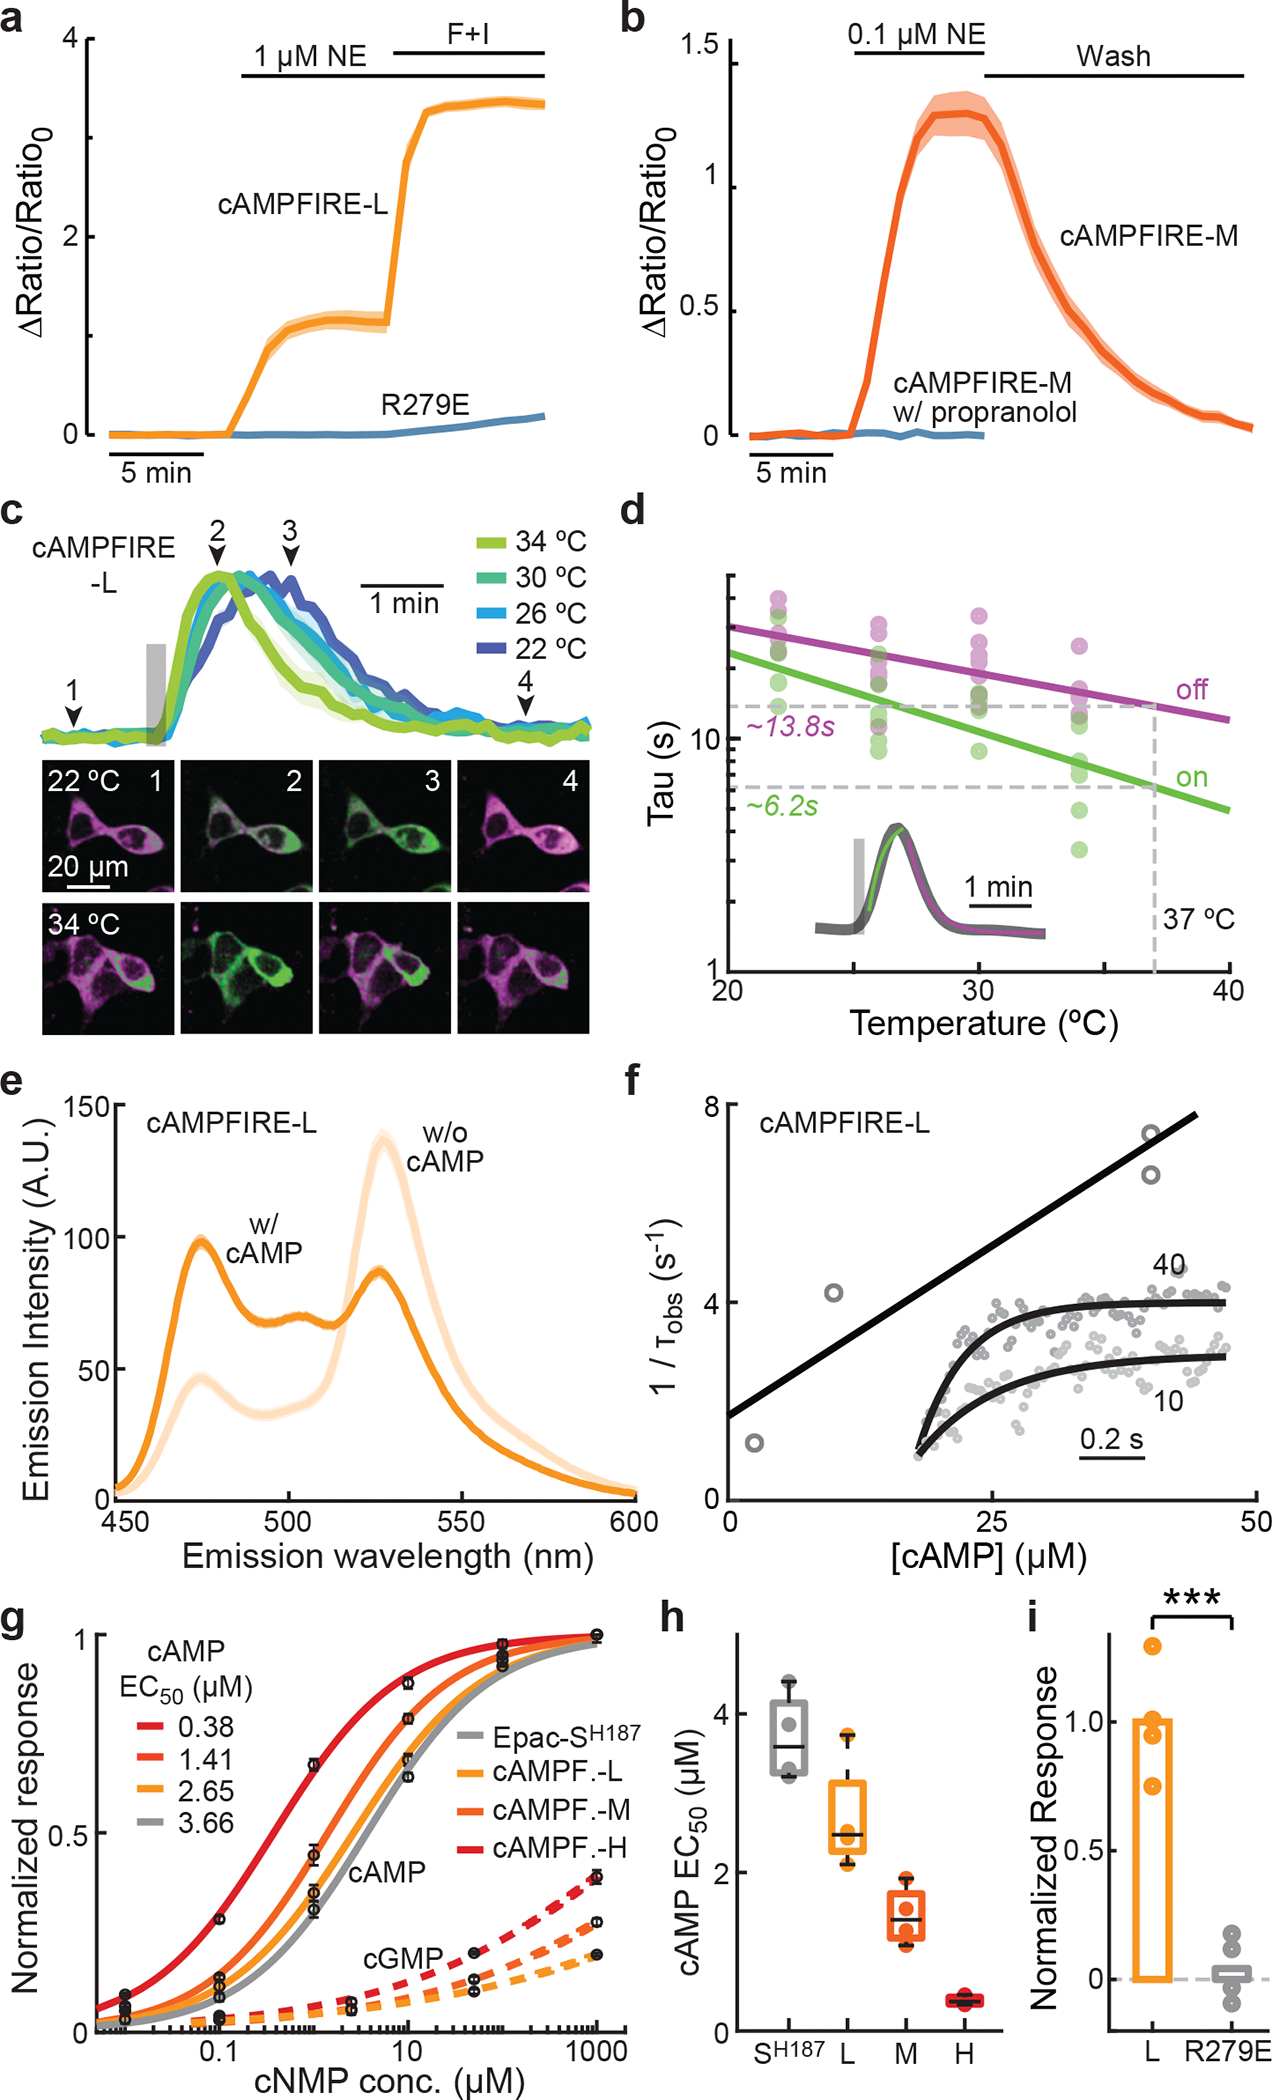
a, Response traces of cAMPFIRE-L and its cAMP-binding mutant (R279E) to the indicated stimulus. Dark lines and shaded areas indicate mean and s.e.m, respectively. n (cells) = 8 and 11 for cAMPFIRE-L and R279E, respectively. b, Response traces of cAMPFIRE-M to 0.1 μM norepinephrine followed by wash, in the absence or presence of propranolol. Dark lines and shaded areas indicate mean and s.e.m., respectively. n (cells) = 8 for both. c & d, Representative traces and images (c), and collective results with fitting (d) of the on and off kinetics of cAMPFIRE-L in HEK cells in response to a short pulse (10 s) of norepinephrine puff (gray bar). n = 5–6 for each condition. Inset in panel d shows a representative response trace with fits overlaid on top. e, Emission spectrum of purified cAMPFIRE-L protein in the presence or absence of cAMP (1 mM). Average of 3. Excitation at 430 nm. f, Example kinetic traces of purified cAMPFIRE-L responding to 10 and 40 μM cAMP (inset) and fit of the apparent time constant (τobs) for determining kon and koff. g & h, Concentration-response curves to cAMP and cGMP (g), and cAMP EC50 values (h) of the cAMPFIRE sensors compared to the parental sensor. n = 4 beads each. In panel g, points and error bars indicated mean and s.e.m., respectively. For the fit, Hill coefficients = 0.61, 0.63, 0.67, and 0.64, respectively, for Epac-SH187, and cAMPFIRE-L, -M, and -H. In panel h, boxes indicate 25th and 75th percentile, with black lines indicating median and whiskers indicating total range of data. i, Comparison of response to 10 μM cAMP of cAMPFIRE-L and its R279E mutation normalized to that of cAMPFIRE-L. n = 4 beads each. ***: p < 0.001 (3.1×10⁻⁴), dF = 7.4, two-tailed Welch test.
We next examined the properties of the sensor protein. We purified recombinant cAMPFIRE-L expressed in insect cells and determined its emission spectrum in the absence and presence of 1 mM cAMP (Fig. 3e). Using a stopped-flowed device, the purified protein exhibited a kon of 0.14 μM·s−1 and a koff of 1.7 s−1 for cAMP (Fig. 3f). For 2 μM cAMP, this corresponds to a half-binding time ton of 2.5 s and a toff of 0.4 s (see Methods). The sensor signal was affected moderately at acidic pH (Extended Data Fig. 5), although it appeared to be more stable than several other cAMP sensors13,18,21. To determine the cAMP affinity and specificity, we immunoprecipitated and immobilized HEK cell-expressed sensors to agarose beads via a C-terminal Myc tag with a 21-residue linker. We used this approach because it might better represent the sensor performance in mammalian cells and allowed for measurements using the same microscope for imaging when the beads were anchored by a suction pipet. The parental sensor exhibited a cAMP affinity of 3.7 ± 0.3 μM, consistent with the literature19. cAMPFIRE-L, -M, and -H exhibited up to 10-fold increased sensitivity to cAMP (EC50 = 2.7 ± 0.4, 1.45 ± 0.18, and 0.38 ± 0.03, respectively; Figs. 3g and 3h). These sensors exhibited a Hill coefficient below 1 (see the legend of Fig. 3g), which was consistent with the cAMP binding of Epac139 and possibly reflected additional conformation changes downstream of cAMP binding. Notably, the cAMP response was abolished by the cAMP-binding mutation (Fig. 3i). cAMPFIREs exhibited little response to cGMP (Fig. 3g): at 1000 μM of cGMP, all sensors responded below 50% of their respective maximal responses. Forced fitting of the partial curve gave cGMP EC50 values of 56,000 ± 16,000, 30,100 ± 19,000, and 5,000 ± 550 μM for cAMPFIRE-L, M, and H, respectively, all over 10,000-fold higher than the corresponding affinity for cAMP. Overall, cAMPFIREs specifically detect cAMP with up to submicromolar sensitivity and kinetics on the order of seconds.
Detecting of cAMP dynamics in neurons in brain tissue
With the goal of in vivo imaging in the brain, we asked whether cAMPFIREs could detect cAMP dynamics in neurons within brain tissue. For these and later in vivo imaging experiments, we used two-photon FLIM (2pFLIM) to measure FRET because 2pFLIM offers advantages in brain tissue9,25,26. Under 2pFLIM, cAMPFIREs exhibited significantly increased sensitivity in HEK cells under 2pFLIM (Extended Data Fig. 6a–6d), similar to ratiometric imaging. The exact EC50 values were different between the imaging modalities, both in HEK cells and in beads (cf. Figs. 2k and 3g with Extended Data Fig. 6), likely because the two readouts are differentially related to the “binding percentage” of FRET fluorophores25.
We imaged cAMPFIREs in the apical dendrites of CA1 neurons in cultured hippocampal slices, as transfected using the biolistic method, and in L23 pyramidal neurons in acute brain slices of mouse somatosensory cortices, as transfected using in utero electroporation (Extended Data Fig. 7a). cAMPFIREs exhibited substantially increased response amplitudes compared to Epac-SH187 in CA1 neurons (for all cAMPFIREs, p < 0.01, cf. Epac-SH187) (Figs. 4a and 4b). These responses were reversible and could be blocked by the β antagonist propranolol or by abolishing cAMP binding (Extended Data Figs. 8a and 8b). Similarly, in L23 pyramidal neurons, cAMPFIRE-L and -M responded robustly to norepinephrine at concentrations as low as 10 nM (Fig. 4c and 4d). These responses were ~3-fold as large as those of the parental sensor (336 ± 71% and 290 ± 77% for cAMPFIRE-L and -M, respectively). When comparing across cell types, the basal lifetime of cAMPFIRE-M increased from HEK cells to CA1 neurons and further to L23 neurons, resulting in reduced dynamic range (Extended Data Fig. 8c). This suggests that L23 neurons exhibit a resting level of cAMP sufficient to mildly activate cAMPFIRE-M (see also ref 22, 33). The most sensitive cAMPFIRE-H was therefore not tested in these neurons. Overall, these data indicate that cAMPFIREs enable sensitive detection of cAMP in neurons.
Fig. 4. Characterization of cAMPFIREs in neurons from brain slices.
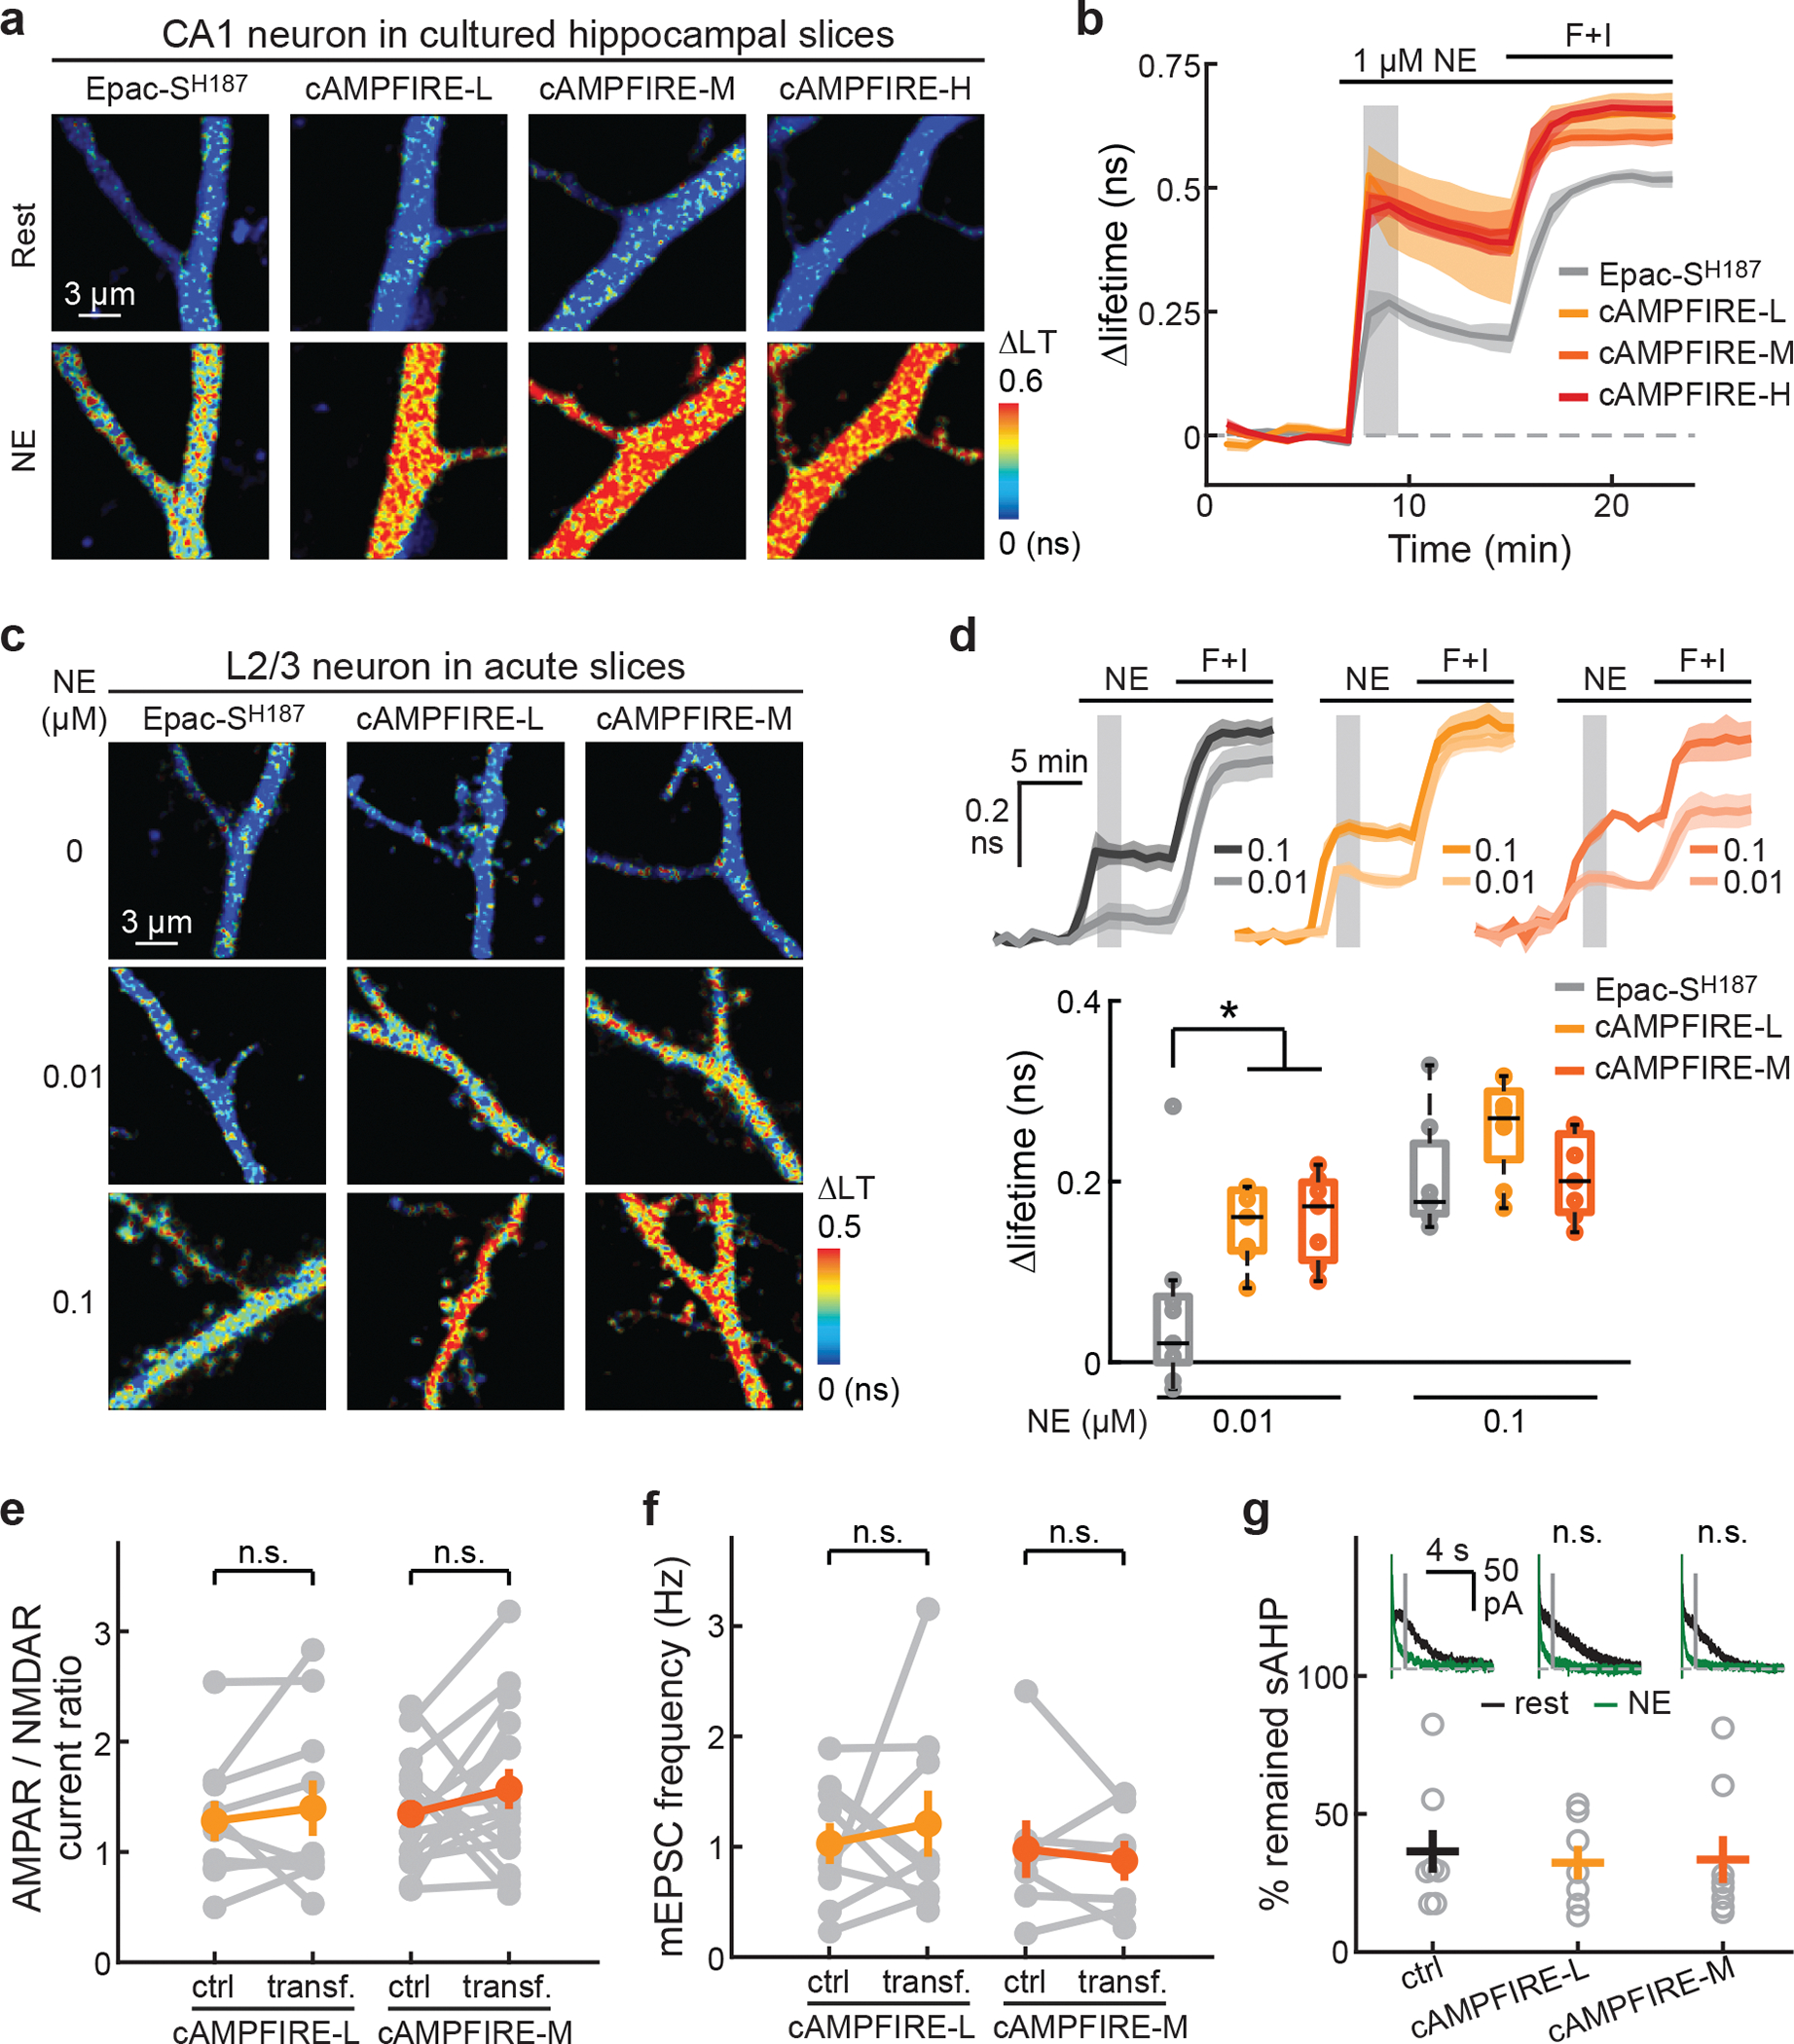
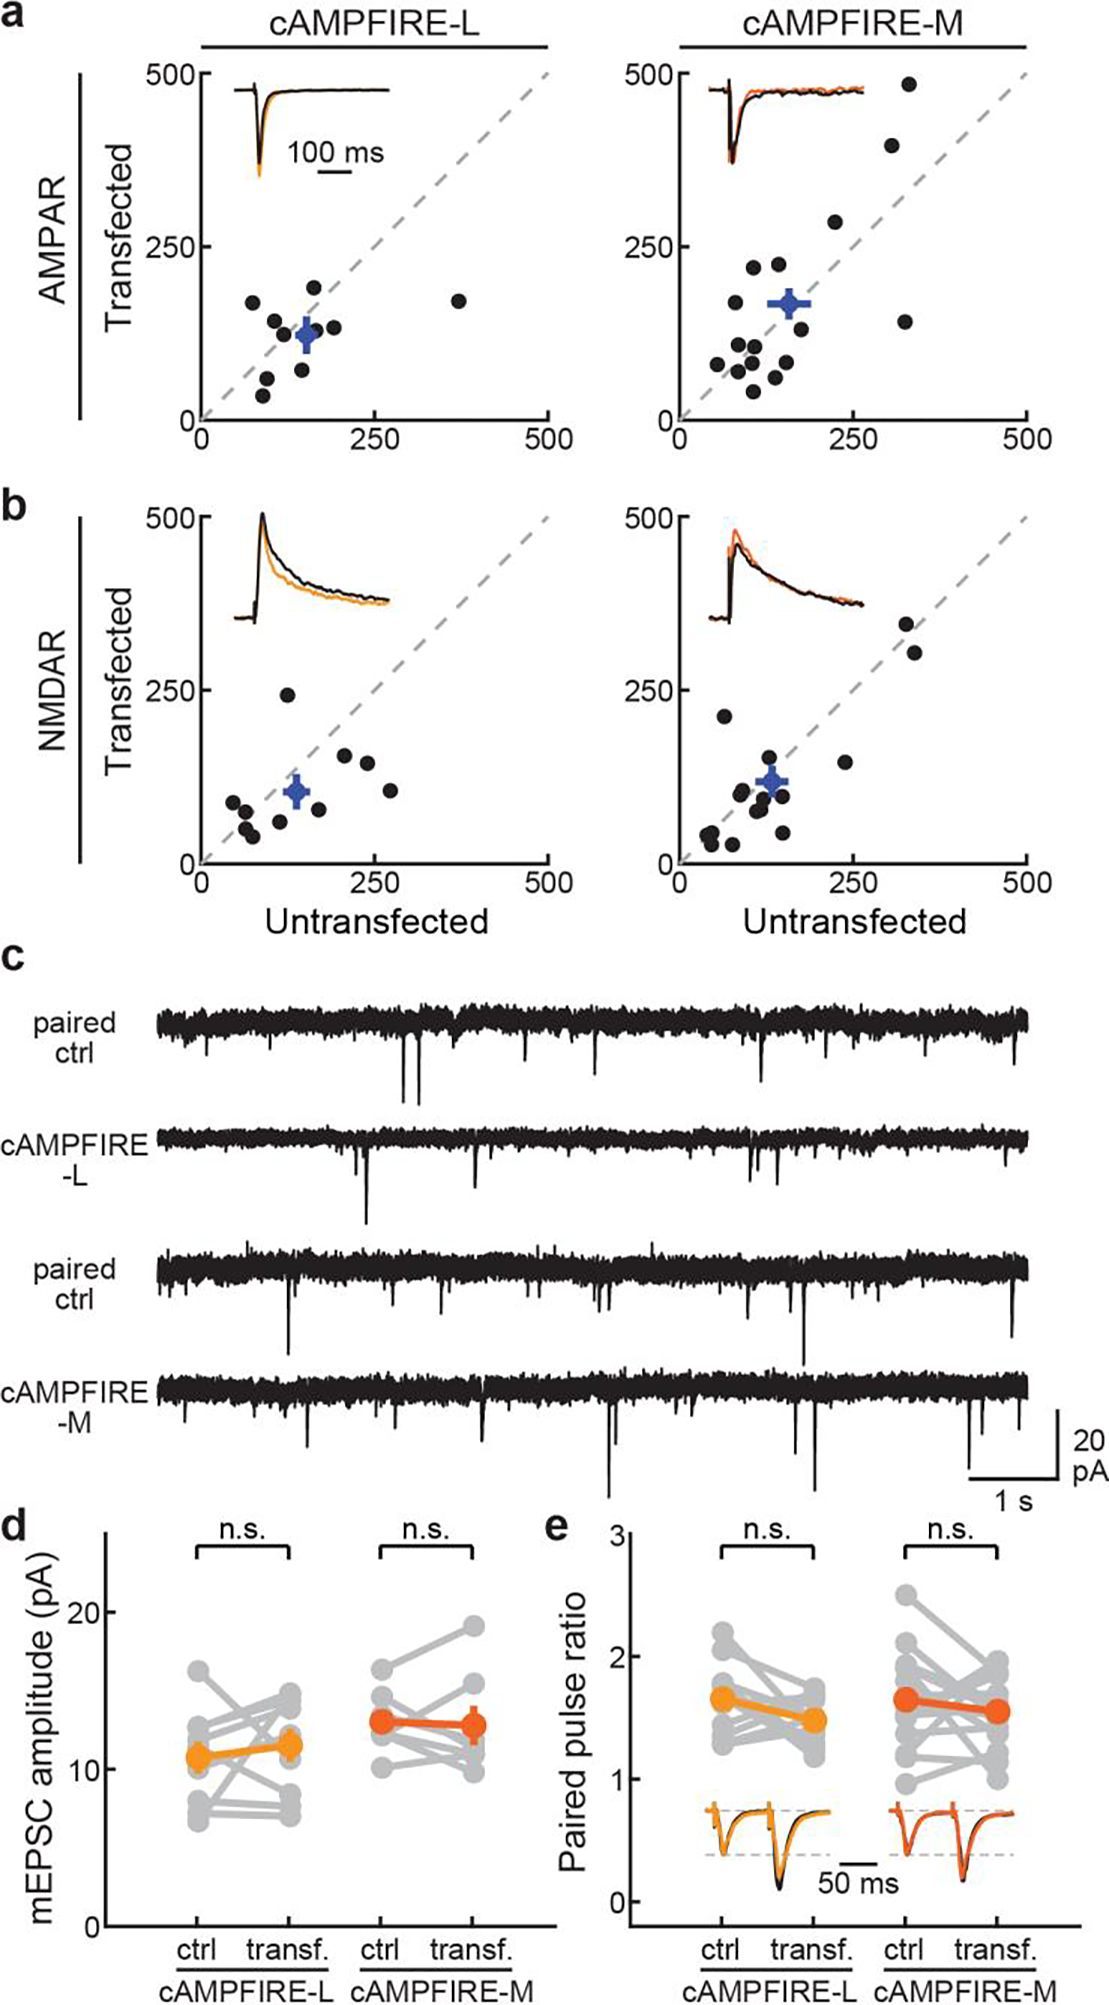
A & b, Representative 2pFLIM images (a) and response traces (b) of cAMPFIREs and their parental sensor to the indicated stimuli. N (neurons) = 5, 3, 8, and 5 for Epac-SH187, cAMPFIRE-L, -M, and -H, respectively. Dark lines and shaded areas indicate mean and s.e.m, respectively. Compared to Epac-SH187, p < 0.01 (p = 0.009 and 0.0013, dF = 6 and 11, respectively) for cAMPFIRE-L and -M and p < 0.001 (p = 4.2×10⁻⁴, dF = 8) for cAMPFIRE-H at shaded time points, two-tailed unpaired Student’s t-test. LT: lifetime. c & d, Representative 2pFLIM images (c), and response traces and quantifications (d) of the indicated sensors to the indicated stimulus. From left to right on the lower plot, n (neurons) = 9, 7, 7, 7, 8, and 7. *: p < 0.05 (0.03 and 0.02, respectively), dF = 14 for both, two-tailed unpaired Student’s t-test. Dark lines and shaded area in the upper plot indicate mean and s.e.m., respectively. In lower plot, boxes indicate 25th and 75th percentile, with black lines indicating mean and whiskers indicating total range of data, excluding outliers. e & f, Quantification of the AMPAR/NMDAR current ratio (e; n = 10 for cAMPFIRE-L and 16 for cAMPFIRE-M) and mEPSC frequency (f) of CA1 neurons transfected with cAMPFIRE-L and cAMPFIRE-M compared to adjacent untransfected control neurons. From left to right, n (neurons) = 10, 16, 9 and 7; p = 0.49, 0.28, 0.61, and 0.60; dF = 9, 15, 8, and 6. n.s.: not significant, paired two-tailed Student’s t-test. Colored points and error bars indicate mean and s.e.m., respectively. g, Representative traces (insets) and collective results of remaining sAHP current of CA1 neurons, untransfected (ctrl) or transfected as indicated, in response to 30 nM norepinephrine. The averaged data were presented as mean ± s.e.m. From left to right, n = 8, 7, 8. n.s.: not significant, cf. ctrl; p = 0.69 and 0.80, and dF = 13 and 14 for cAMPFIRE-L and -M, respectively; two-tailed Student’s t-test.
To examine whether cAMPFIREs may affect neuronal function, we performed whole-cell recording of CA1 neurons in cultured hippocampal slices (Figs. 4e–4g, and Extended Data Fig. 9). cAMP and PKA have been implicated in many neuronal functions, such as synaptic AMPA receptor contents, synapse density, and sAHP40–42. We found that the expression of cAMPFIRE-L or -M, when compared to adjacent untransfected neurons, did not alter evoked AMPA and NMDA receptor currents (Extended Data Figs. 9a and 9b), AMPAR/NMDAR current ratios (Fig. 4e), the amplitude and frequency of miniature excitatory postsynaptic currents (Fig. 4f and Extended Data Figs. 9c and 9d), or paired-pulsed ratios (Extended Data Fig. 9e). Importantly, norepinephrine regulation of sAHP, a process known to be mediated by cAMP and PKA41, was not changed (Fig. 4g). Thus, the expression of cAMPFIREs did not appear to alter neuronal function under our conditions.
cAMPFIREs also function well in Drosophila larval neurons (Extended Data Fig. 10 and Supplementary Table 1), where the growth temperature (25 °C) is different from that in mammals, suggesting that cAMPFIREs will be useful across biological systems.
Longitudinal and subcellular imaging of cAMP in awake mice
To test in vivo imaging of cAMPFIREs, we used in utero electroporation to express cAMPFIRE-L or -M in L23 pyramidal neurons in the somatosensory cortex (Extended Data Fig. 7), and performed 2pFLIM through a craniotomy-implanted optical window in awake, head-fixed mice43. Individual neurons can be clearly resolved and repeatedly imaged over months (Fig. 5a). The basal lifetimes of individual neurons across weeks were correlated (Fig. 5b). Interestingly, compared to acute slices, where neuromodulators have been washed away, both cAMPFIRE-L and cAMPFIRE-M exhibited higher basal lifetime in vivo, suggesting the presence of an additional tonic level of cAMP (Fig. 5c). Neuronal dendrites could also be resolved, and exhibited higher lifetime compared to their corresponding somas (Fig. 5d), indicating that tonic cAMP levels are specific to individual subcellular compartments.
Fig. 5. cAMPFIREs enable longitudinal in vivo imaging.
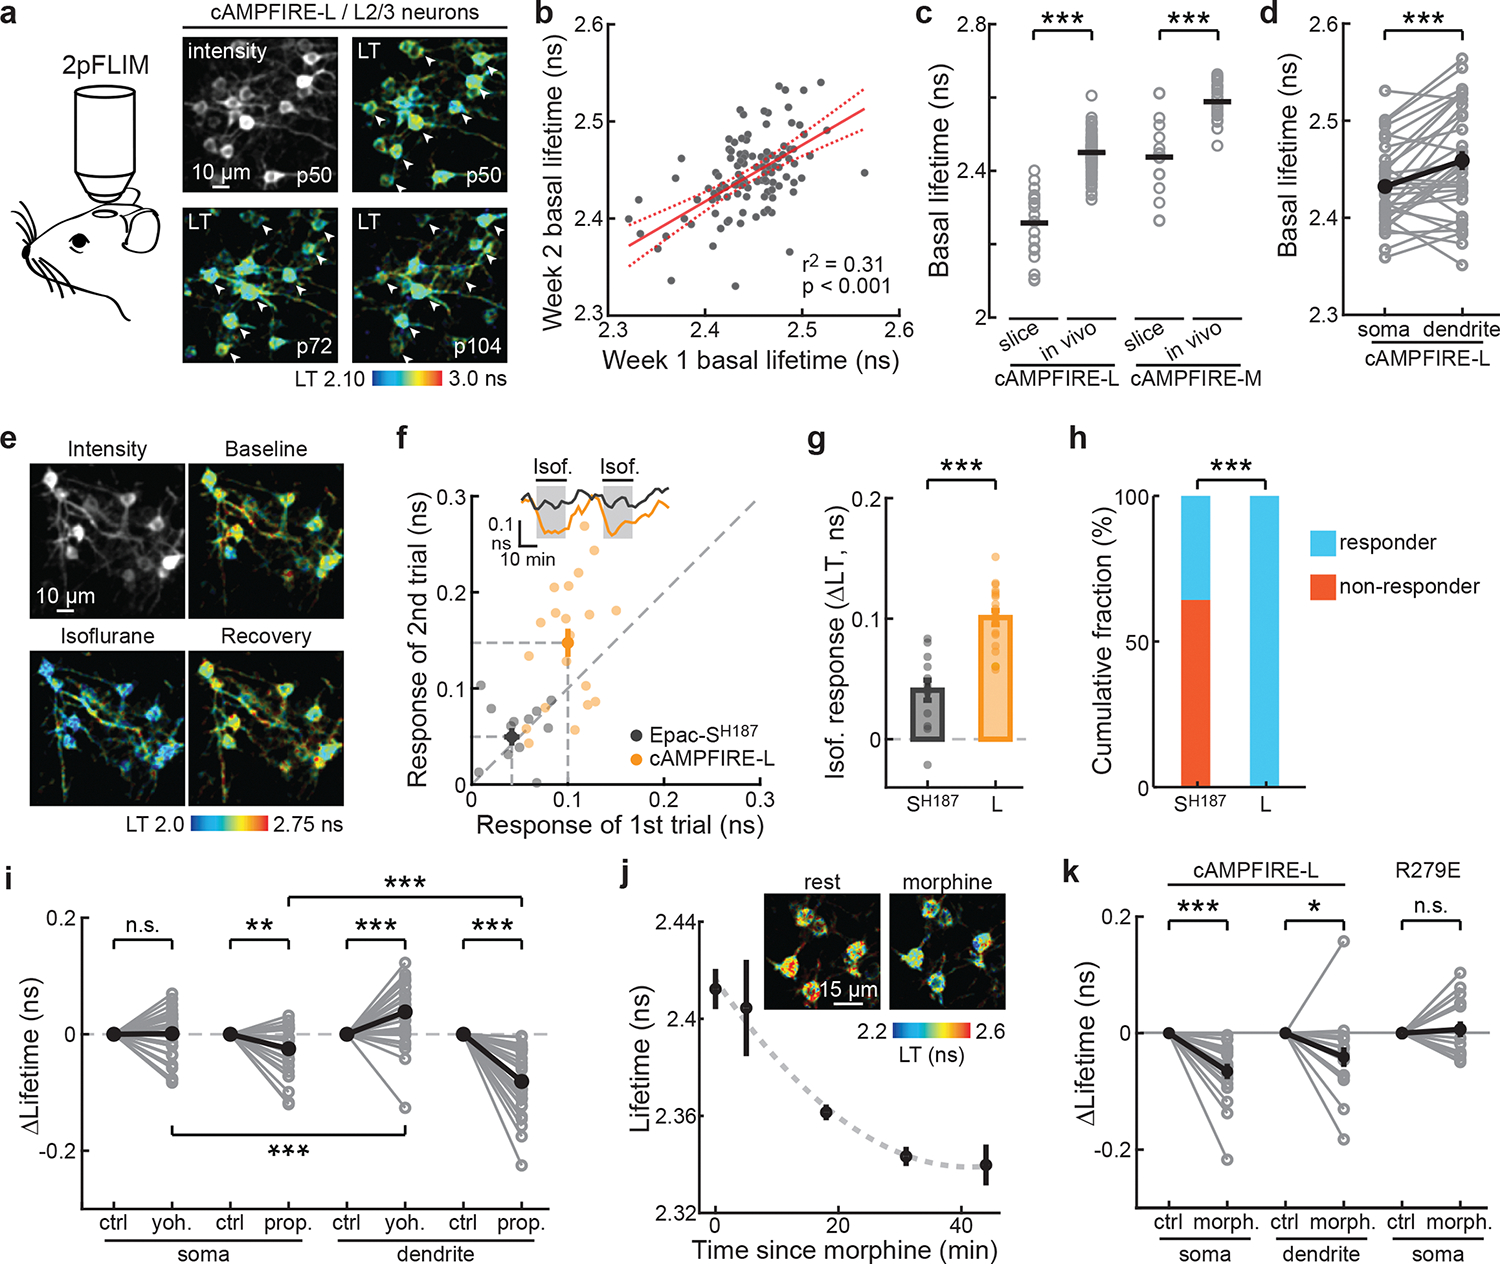
a, Schematic 2pFLIM imaging in awake mice, and representative images (representative of 14 fields of view from 5 mice). LT: lifetime. Arrowheads: the same cells across images. b, Correlation of cellular basal lifetimes imaged 5–8 days apart. n (cells) = 113. The linear fit (solid line) and its 95% confidence intervals (dashed lines) are shown. c, Basal lifetimes of cAMPFIRE-L and M in vivo and in acute slices. From left to right, n (cells) = 20, 151, 10, and 25. Horizontal lines indicate mean. ***: p < 0.001 (4.6×10⁻⁴ and 3.7×10⁻⁴), two-tailed Welch test, dF = 11.7 and 11.2 for cAMPFIRE-L and -M, respectively. d, Basal lifetimes of somas versus dendrites. n (cells/mice) = 34/9. Black points and error bars indicate mean and s.e.m. respectively. ***: p < 0.001 (3.3×10⁻⁴), dF = 33, paired two-tailed Student’s t-test. e, Representative in vivo images (representative of 3 mice) of cAMPFIRE-L responding to isoflurane administration. f–h, Example traces (inset) and correlation (f), and collective amplitudes (g) and percentage responders (h) of the first trial of Epac-SH187 and cAMPFIRE-L in L23 neurons responding to isoflurane. n (cells/mice) = 13/3 for Epac-SH187, and 20/3 for cAMPFIRE-L. Bars and error bars indicate mean and s.e.m., respectively. ***: p < 0.001. For g, p = 8.2×10⁻⁷, dF = 31, two-tailed unpaired Student’s t-test; for h, p = 5.0×10⁻⁹, two-tailed binominal test. i, Soma and dendrite-specific cAMPFIRE-L response to yohimbine (yoh.) and propranolol (prop.). n (cells/mice) = 31/7 for yohimbine, and 32/6 for propranolol. Black points indicate mean. **: p < 0.01, ***: p < 0.001, paired, two-tailed Student’s t-test. For comparison with respective controls, from left to right, p = 0.88, 0.0012, 2.5×10⁻⁴, and 1.1×10⁻⁹; dF = 30, 31, 30, and 31. For comparison between somas and dendrites, p = 4.8×10⁻⁴ (dF = 30) and 1.8×10⁻⁶ (dF = 31) for yohimbine and propranolol, respectively. j & k, Representative images (inset in j), onset time course (j), and lifetime changes in soma and dendrites (k) of morphine administration. Averaged data are presented as mean ± s.e.m. n (cells/mice) = 17/4 for cAMPFIRE-L and 15/2 for R279E. *: p < 0.05, ***: p < 0.001, paired, two-tailed Student’s t-test; from left to right, p = 1.4×10⁻⁴, 0.03 and 0.6, dF = 16, 16, and 14.
Animal wakefulness is associated with elevated levels of neuromodulators, such as norepinephrine, in the cortex14,44. We asked whether wakefulness may affect tonic cAMP using light anesthesia14,45. Isoflurane exposure (1.5%) significantly reduced cAMP levels as measured using cAMPFIRE-L in neuronal somas (Figs. 5e and 5f). This response was reversible and repeatable (Fig. 5f). Notably, the response amplitudes of cAMPFIRE-L were significantly larger than those detected by Epac-SH187 (150 ± 56% larger; Figs. 5f and 5g). Using a threshold of 1.5x standard deviation of the baseline, all of cAMPFIRE-L expressing cells exhibited detectible response, while only 38% of Epac-SH187 expressing neurons were responsive (Fig. 5h). These results illustrate that cAMPFIREs enable the detection of previously undiscernible cAMP dynamics.
To test whether the basal cAMP tone is mediated by norepinephrine, we injected mice intraperitoneally with the α2 adrenergic antagonist yohimbine (5 mg/kg) or the β antagonist propranolol (25 mg/kg) in separate experiments. Both types of receptors are expressed in the rodent cortex46,47. Interestingly, yohimbine resulted in increased cAMP concentrations in neuronal dendrites, but with little effect on neuronal somas (Fig. 5i). In contrast, propranolol decreased cAMP in both somas and dendrites, although the effect at dendrites were larger (Fig. 5i). To test cAMP regulation elicited by other neuromodulatory pathways, we administered morphine (25 mg/kg) to activate the mu opioid receptor, which is expressed in cortical L23 neurons48. Morphine injection resulted in decreased cAMP activity that plateaued at ~40 minutes post administration (Fig. 5j and 5k). As a control, the cAMP-binding mutant exhibited little responses under these conditions (Fig. 5k).
Cell-specific cAMP dynamics during mouse locomotion
To evaluate whether cAMPFIREs can detect cAMP dynamics elicited by behaviors, we used the mouse head-fixed locomotion paradigm (Fig. 6a)43,49. We found that individual L23 neurons, sometimes in the same field of view, exhibited cell-specific cAMP dynamics: some with positive responses, some with negative responses, and others with small responses (Figs. 6b and 6c). The responses were reversible and repeatable for the same cell (Fig. 6c). As a result, the responses were more correlated across trials within a cell than across cells (Fig. 6d). Consistent with the empirical observation, three distinct clusters were revealed when averaged responses of individual cell were analyzed using an unbiased hierarchical cluster analysis (Figs. 6e and 6f). As a control, the cAMP-binding mutant exhibited little response in all cells (Fig. 6f).
Fig. 6. cAMPFIRE-L detects heterogeneous cAMP response to enforced running.
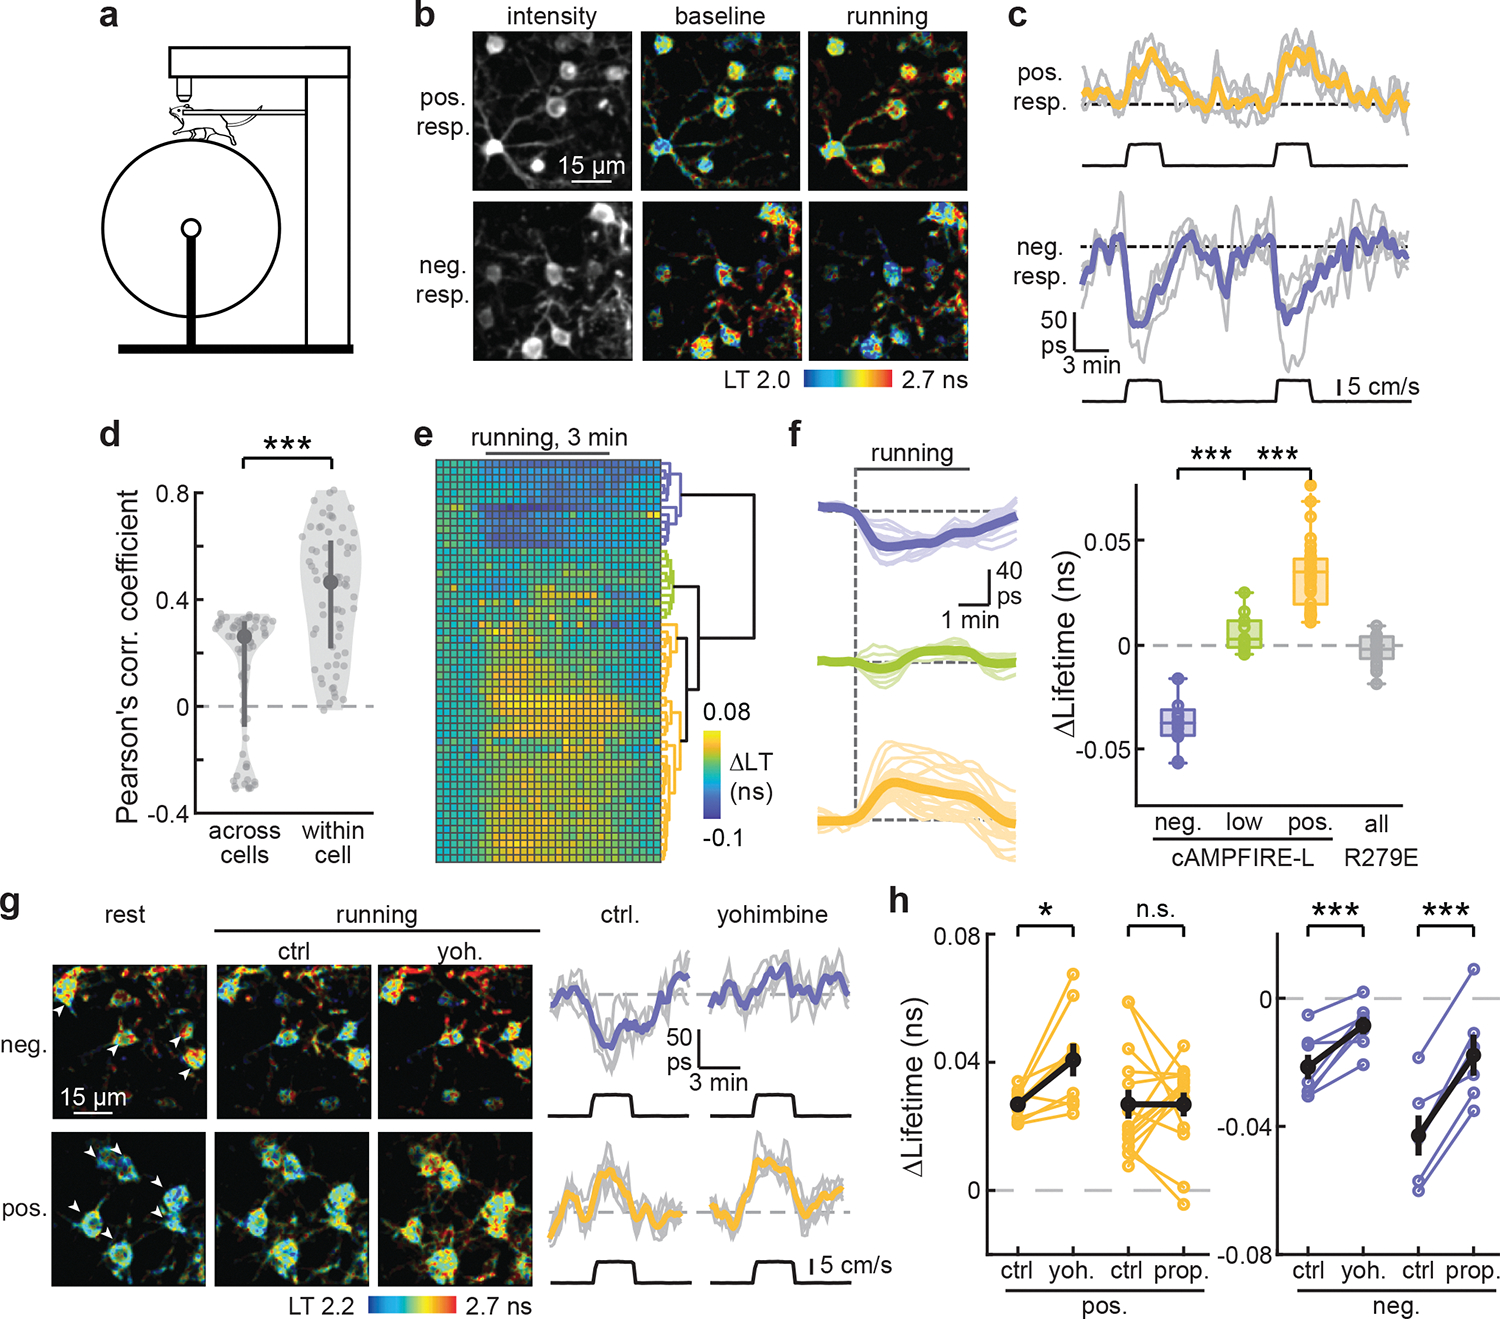
a, Schematic of the enforced running behavioral paradigm. b & c, Representative images (b) and example response traces and their averages (c) of cAMPFIRE-L in positively and negatively responding L23 cells in response to enforced running. Colored lines indicate average response. Black lines indicate running speed. d, Quantification of between-cell and within-cell correlation of cAMPFIRE-L responses to enforced running. n (cells/mice) = 60/7. Dark gray points indicate median and vertical lines indicate 25th and 75th percentile. Shaded area reflects distribution of data. ***: p < 0.001 (3.4×10⁻¹²), dF = 116, Mann Whitney U test. e, Hierarchical clustering of cell-specific responses to 3-min running bouts. f, The average (bold lines) and individual (thin lines) traces and quantifications of response amplitudes from cells within each cluster in panel e. The collective response amplitudes of R279E mutant are also shown. From left to right, n (cells/mice) = 12/6, 10/4, 33/4 and 21/3. Boxes indicate 25th and 75th percentile, middle line indicates median and whiskers indicate range of data excluding outliers. **: p < 0.01 and ***: p < 0.001, dF = 3, one-way ANOVA (p = 1.6×10⁻²²) with Tukey Kramer post-hoc test (p = 0 for the indicated comparisons). g, Representative images, and the average and individual traces (individual traces corresponding to arrowheads in the image) of running induced response in positively and negatively responding cells before and after the administration of yohimbine. h, Changes of enforced running-elicited cAMP responses to intraperitoneal injection of the indicated drugs. Yoh.: yohimbine; and prop.: propranolol. From left to right, p = 0.013, 0.99, 0.0075, and 6.8×10⁻⁴, paired two-tailed t-test, n (cells/mice) = 9/3, 14/3, 7/3, and 6/2, and dF = 8, 13, 6, and 5. Black points indicated mean and error bars indicate s.e.m. *: p < 0.05, ***: p < 0.001.
We tested whether the cell-specific cAMP dynamics may be affected by adrenergic signaling. Yohimbine significantly attenuated the negative responses (Figs. 6g and 6h), suggesting a potential role of Gi-coupled α2 adrenergic receptors. Interestingly, propranolol also reduced the negative response (Fig. 6h). Given that β adrenergic receptors couple to the Gs protein, which activates cAMP, this is likely because of the “flooring effect”: the basal cAMP activity is reduced by propranolol (Fig. 6i), leaving less room for further decreases. In contrast, yohimbine increased the positive responses while propranolol did not affect these responses (Fig. 6h), suggesting that a neuromodulator other than norepinephrine is responsible for driving these positive cAMP dynamics. Overall, these results reveal cell-specific neuromodulation of L23 pyramidal neurons in the mouse cortex during locomotion.
Discussion
We report three cAMPFIRE variants with different sensitivities. In awake mice, we found that cAMPFIRE-M exhibited an elevated baseline in neurons, possibly due to its sensitivity to tonic cAMP. Therefore, the majority of in vivo experiments employed cAMPFIRE-L. Nevertheless, the sensitivity improvement from the parental sensor to cAMPFIRE-L is critical (e.g., Figs. 5g and 5h). Different cell types may exhibit different levels of cAMP dynamics (e.g., Extended Data Fig. 8c). In other cells or other brain regions with lower basal cAMP levels, the higher sensitivity versions of cAMPFIREs may be advantageous. In addition, FPs and sensors may be sensitive to pH, ionic strength, or other factors. cAMPFIRE-L is indeed moderately affected by pH (Extended Data Fig. 5). It is important to include controls, such as using the cAMP-binding mutant to detect potential non-cAMP influences (e.g., Figs. 5k and 6f).
Our results point to a tonic level of cAMP in vivo, in part mediated by norepinephrine (Fig. 5i), that is associated with animal wakefulness. Such tonic cAMP may contribute to the functional differences between sleep and wakefulness. Interestingly, neuronal somas and dendrites exhibited different basal cAMP levels and different sensitivity to pharmacological manipulations, suggesting distinct signaling regulatory mechanisms across neuronal compartments. In addition, we found cell-specific up- or down-regulation of cAMP levels in L23 neurons during animal locomotion, suggestive of a type of previously-undescribed functional heterogeneity. Furthermore, we showed that opioid receptor activation reduced tonic cAMP in L23 neurons. Although all opioid receptors are Gi-coupled, the net opioid action requires experimental verification because they may work to inhibit upstream inhibitory neurons (e.g., ref 50). Notably, for this experiment, stable measurement of baseline cAMP level is required. Lifetime measurements are advantageous for measuring slow effects (Fig. 5j), as they are insensitive to drifting, bleaching, and light scattering. Overall, these results argue for the need for in vivo cAMP imaging. Given the important roles of cAMP, the exact dynamics of cAMP may have profound implications in neuronal circuit function and animal behavior.
cAMP imaging can also be used to infer the functional dynamics of upstream GPCRs and neuromodulators. Although sensors for detecting several GPCR activators have emerged51, probes for the majority of GPCRs and their ligands are not available. It is also not practical to develop a sensor for every GPCR or for low-abundance ligands because of the enormous amount of work in optimizing each sensor, potential buffering effects, and the theoretically low signal of low-abundance molecules (each molecule activates only one sensor). cAMP imaging, combined with pharmacological or genetic manipulations, may provide an alternative for studying the upstream GPCRs and extracellular ligands, analogous to using calcium imaging to infer neuronal electrical activities. cAMP imaging has the additional advantage in that it is vastly amplified from GPCR activation, thereby easing detection and reducing the effect of potential buffering. Indeed, the expression of cAMPFIREs does not affect neuronal function (Figs. 4e–4g, and Extended Data Fig. 9), suggesting that the buffering of endogenous cAMP, if any, is moderate.
Overall, cAMPFIREs represent an updated basis for the application and development of cAMP sensors that will likely have broad applications in both basic and clinical research. At the same time, cAMPFIREs may benefit from further improvements. We likely have reached the limit of useful sensitivity for intracellular imaging, given that the baseline starts to increase in cAMPFIRE-H even in HEK cells. However, a larger dynamic range may reduce the demand on photon budget, thereby allowing for prolonged imaging or more challenging experiments, such as imaging in deep brain regions, visualization of smaller cAMP events, and events in small neuronal compartments.
Methods
All animal works were performed in accordance with the Guide for the Care and Use of Laboratory Animals, written by the National Research Council (US) Institute for Laboratory Animal Research, and were approved by the Institutional Animal Care and Use Committee (IACUC) of the Oregon Health and Science University (#IP00002274).
Plasmid Constructs.
Constructs were made using standard mutagenesis and subcloning methods, or by gene synthesis (Genewiz). All previously unpublished constructs and their sequences will be deposited to Addgene.
Cell culture and transfection.
HEK-293 cells (ATCC # CRL-1573) were maintained in 100-mm cell culture dishes (Fisher Scientific, #FB012924) at 37°C with 5% CO2 in minimal essential medium (ThermoFisher #11095-080) plus 10% fetal bovine serum and penicillin-streptomycin. All cells from ATCC have been authenticated by morphology, karyotyping, and PCR based approaches and tested for mycoplasma. Cell aliquots were kept frozen in liquid nitrogen until use, and were further authenticated based on their morphology. Once thawed, each aliquot of cells was passed and used for no more than 4 months. To image transfected HEK cells under our microscope, cells were subcultured onto glass coverslips (hand-cut to ~5 × 5 mm) coated with 0.1 mg/mL Poly-D-Lysine (Millipore-Sigma, #27964-99-4) in 35-mm cell culture dishes (Corning, #CLS430165). Sensors in mammalian expression plasmids (0.5–3 μg/35-mm dish) were transiently transfected using Lipofectamine-2000 (ThermoFisher, #11668030) according to the manufacturer’s instructions except that half of the recommended amount of Lipofectamine (5 μl) was used. Imaging was performed at two days post-transfection in a chamber perfused with carbogen (95% O2 / 5% CO2) gassed artificial cerebral spinal fluid (aCSF) containing (in mM) 127 NaCl, 25 NaHCO3, 25 D-glucose, 2.5 KCl, 1.25 NaH2PO4, 2 CaCl2, and 1 MgCl2.
Recombinant protein purification and measurements.
Recombinant cAMPFIRE-L was purified from Sf9 insect cells (ThermoFisher #11496015) grown in suspension in Sf900 media. Sf9 cells (~3.0×10⁶ cell/mL) were infected with baculovirus encoding cAMPFIRE-L-8xHis to 5% (v/v) and allowed to express protein for 72 hours at 27°C before being spun down at 1000g for 20 minutes, snap-frozen in liquid nitrogen, and stored at −80°C until purification. The cell pellet was resuspended in 2.5 mL/g of Buffer A containing 50 mM HEPES pH 7.5, 150 mM NaCl, 25 units/mL nuclease cocktail (ThermoScientific # 88702), 1 tablet/50 mL protease inhibitor cocktail (Pierce #A32965), and Dounce homogenized. The cells were lysed by sonication (10 s-on, 30 s-off, a total of 3 min on time, intensity 7; Misonix Sonicator 3000), and centrifuged at 100,000g (1h, 4°C). Supernatant was combined with Talon resin (0.175 mL packed resin per gram of cells; Clontech) that had been pre-equilibrated in MilliQ water and then in Buffer B (25 mM HEPES pH 7.5, 150 mM NaCl). Imidazole was added to 5 mM and the mixture incubated for 1 hr at 4°C under gentle rotation. The resin was pelleted (1250g x 5 min) and transferred to a glass column. Using a peristaltic pump at 4°C, the column was washed with 5 column volumes (CVs) of Buffer B with addition of 5 mM imidazole, 5 CVs of Buffer B with 20 mM imidazole, and then 2 CVs of Buffer B with 40 mM imidazole. Protein was eluted with 5 CVs of Buffer B with 200 mM imidazole, and fractions of 1 CV were collected. Fractions were assessed for protein content using the absorbance at 280 nm, and fractions with highest protein content were pooled. The sample was concentrated using a 100K MWCO concentrator (Millipore), and further purified using a Superose 6 Increase 10/300 gel filtration column (GE Healthcare) in the gel filtration buffer (25 mM HEPES pH 7.5, 150 mM NaCl, and 1 mM TCEP). Fractions containing cAMPFIRE-L were pooled and concentrated.
The emission spectrum was determined using a Shimadzu RF-53-1PC spectrofluorphometer using a 1000-μL cuvette at a concentration of 300 nM in elution buffer (from ~ 6 μM). cAMPFIRE-L was excited at 430 nm and the emission spectrum (450–600 nm) was measured with a 5-nm slit in the presence or absence of 1 mM cAMP. The pH sensitivity of cAMPFIRE-L was determined by diluting purified cAMPFIRE-L in elution buffer with the pH adjusted to 6, 6.5, 7, 7.3, or 8 to 150 nM in the presence or absence of 100 μM cAMP. Kinetics were measured by 1:1 mixing of 300 nM cAMPFIRE-L in elution buffer with cAMP dissolved in elution buffer using a stopped flow attachment (Applied Photophysics RX2000) with a Cary Eclipse Fluroescence Spectrophotometer (Agilent) at an emission of 523 ± 5 nm and at room temperature. The apparent time constant (τobs) was determined using single exponential fit. kon and koff were further determined by fitting the equation: 1/τobs = kon·[cAMP] + koff. The half time for association and dissociation (ton and toff, respectively) were calculated as ln[2/(kon·[cAMP])] and ln(2/koff), respectively.
Immunoprecipitation.
HEK-293 cell culture and transfection were performed as above, except that 100-mm dishes were used. Two days post-transfection, cells were washed 1x with PBS and lysed with Triton-Immuno Precipitation Buffer (IPB) containing 1x PBS, 3 mM EDTA, 0.1 mM PMSF, 1x Aprotinin, 2% BSA, and 1% Triton X100. The lysate was spun down at >100,000 g for 10 minutes. The supernatant was combined with protein-A agarose beads (ThermoFisher #20333) and a mouse monoclonal anti-Myc antibody (9E10; 7.8 μg/reaction), and rotated at 4°C overnight. Beads were then spun down, and washed 2x with Triton-IPB and then 2x with IPB (Triton-IPB without the addition of Triton X100), with a 3–5-min rotation and spin-down between each wash. Washed beads were resuspended in IPB and stored at 4°C. Notably, the addition of 1–2% BSA was empirically found critical to maintain the dynamic range of the precipitated sensors. For imaging, a bead was held via negative pressure to a borosilicate glass pipette (tip diameter ~20–60 μm) in a chamber perfused with carbogen gassed aCSF with 25 mM HEPES, 1 mM ascorbic acid, and 2 mM (final concentration) Mg2+.
Hippocampal slice culture and transfection.
Hippocampi were dissected from P6–7 rat pups of both sexes. Sections (400 μm) were prepared using a chopper in dissection medium containing (in mM) 1 CaCl2, 5 MgCl2, 10 glucose, 4 KCl, 26 NaHCO3, and 248 sucrose, with the addition of 0.00025% phenol red. The slices were seeded onto a membrane (Millipore, #PICM0RG50) and cultured at 35°C with 5% CO2 in 7.4 g/L MEM (ThermoFisher, #11700-077) plus (in mM unless labeled otherwise): 16.2 NaCl, 2.5 L-Glutamax, 0.58 CaCl2, 2 MgSO4, 12.9 D-glucose, 5.2 NaHCO3, 30 HEPES, 0.075% ascorbic acid, 1 mg/mL insulin, and 20% heat-inactivated horse serum. Slice media was refreshed every 2–3 days by replacing ~60% of the media.
Transfection of cultured slices was accomplished by the biolistic method (Bio-Rad Helios gene gun) 10–20 days in vitro (DIV) using 1.6 μm gold particles (Bio-Rad, #165-2262; ~1 μg DNA/mg gold) coated with plasmids expressing the appropriate constructs. Cultured slices were imaged at 2–3 days post-transfection in carbogen gassed aCSF containing 4 mM CaCl2 and 4 mM MgCl2.
In utero electroporation.
To express sensors in the somatosensory cortex, in utero electroporation was performed on C57BL/6 mouse embryos (Charles River, within 2-generation of breeding) at E15.5 by injecting plasmid (1 μL/embryo, ~2–3 μg/μL, mixed with a 0.2% fast green) into the lateral ventricle of mouse embryos. The embryos were then electroporated with five 100-ms pulses (35V, 1 Hz) using an electroporator (BEX #CUY21), with the positive terminal positioned above the right parietal field.
Patch-clamp electrophysiology.
Whole-cell patch-clamp was performed in CA1 pyramidal neurons from organotypic cultured slices at 12–24 DIV at room temperature perfused with gassed aCSF containing 4mM CaCl2 and 4 mM MgCl2. Sequential recordings were done in transfected neurons and in adjacent untransfected neurons (control) within 50 μm in the same slice. Voltage-clamp recordings were performed using a MultiClamp 700B amplifier (Molecular Devices) controlled with custom software written in MATLAB. Electrophysiological signals were filtered at 2 kHz and digitized at 20 kHz. Recording pipettes (3–5 MΩ), were pulled from borosilicate glass (G150F-3; Warner Instruments) using a Sutter P-1000 puller. Series resistance was 10–25 MΩ. The internal solution contained (in mM): 126 Cs-gluconate, 10 CsCl, 10 HEPES, 5 Na-phosphocreatine, 0.5 Na-GTP, 4 Mg-ATP, 10 TEA-Cl, 5 EGTA and 4 QX-314 bromide with an osmolarity of 295–300 mOsmol/kg and pH ~7.2 adjusted with CsOH. Voltages were not corrected for the liquid junction potentials, which was estimated to be −14 mV using JCal from the Clampex software (Molecular Devices).
AMPA/NMDA responses were evoked by extracellular stimulation of the Schaffer collaterals using a theta-glass (20–50 μm tip) filled with aCSF and positioned at 150 μm lateral from somas. Short stimulation pulses (0.1 ms) were applied using an A365 stimulus isolator (World Precision Instruments). GABAA currents were blocked by bath-applied 100 μM picrotoxin. To prevent recurrent activities, connections between CA1 and CA3/subiculum were cut and 4 μM 2-chloroadenosine was included. Cells were held first at a holding potential (VH) of +55 mV to record the NMDA component and then at −60 mV for the AMPA component. 10 trials with an interstimulus interval of 10 s were recorded under each condition. AMPA/NMDA ratio were determined as the ratio between peak amplitude at −60 mV over the mean current at 140–160 ms after stimulation at +55 mV. Paired-pulse ratios were calculated as the ratio between peaks (2nd peak/1st peak) from two stimulations separated by 70 ms at −70 mV. For mEPSCs recordings, 1 μM tetrodotoxin (TTX), 10 μM CPP, and 100 μM Picrotoxin were included to block action potentials, NMDA and GABAA receptors. mEPSCs events were detected from 5-min recorded traces using the template-matching feature in Clampfit (Molecular devices).
Slow afterhyperpolarization (sAHP) currents were recorded under voltage clamp in the presence of 1 μM TTX. Recording pipettes (5–10 MΩ) were filled with an internal solution containing (in mM): 140 KMeSO4, 10 KCl, 10 HEPES, 10 Tris-phosphocreatine, 2 Mg-ATP, and 0.4 Na-GTP with an osmolarity adjusted to 300 mOsmol/kg and pH ~7.2 adjusted with KOH. The junction potential (−11 mV) was not corrected. The series resistance was maintained to be 30–60 MΩ to reduce washout of the cell by moving the recording pipet slightly backward, and by adjusting the pipet pressure. Under this condition, sAHP recording was stable for over 30 min. The cells were held at −70 mV and sAHP currents were elicited by a voltage jump to +20 mV for 500 ms and then down to −50 mV for 14 s. sAHP currents were measured as the baseline-subtracted current at 1.6–1.7 s after the offset of stimulation.
Acute slice preparation.
Mice of both sexes (P17–25) with neurons transfected via in utero electroporation were transcardially perfused with ice-cold, gassed aCSF containing 2 mM CaCl2 and 1 mM MgCl2. The brain was then dissected and coronally sliced using a vibratome (Leica VT1200s) in an ice-cold, gassed choline-cutting solution containing (in mM): 110 choline chloride, 25 NaHCO3, 25 D-glucose, 2.5 KCl, 7 MgCl2, 0.5 CaCl2, 1.25 NaH2PO4, 11.5 sodium ascorbate, and 3 sodium pyruvate. The slices were then incubated in gassed aCSF at 35°C for 30 minutes and subsequently kept at room temperature for up to 8 hours.
Cranial window surgeries.
For in vivo imaging, a glass window was installed on the skull of mice of both sexes (P30–60) under inhaled isoflurane anesthesia (4% to induce, ~1.5–2% to maintain). The skull was exposed and cleaned using a Q-tip, and all connective tissue was cleared. Next, a circular ~3.5 mm craniotomy was made above the somatosensory cortex, using an air-powered high-speed dental handpiece (Maxima Pro 2) and a ¼ inch carbide burr (Henry Schein #5701072). The window was implanted into the craniotomy site and adhered to the skull with dental acrylic. Last, a steel plate was adhered to the skull (for head fixation) using dental acrylic. Mice were allowed to recover for two weeks prior to imaging and were treated with pre-operative dexamethasone (4 mg/mL) and post-operative carprofen (0.5 mg/mL) to reduce inflammation. Window-implanted mice may be used up to P200.
Two-photon and 2pFLIM imaging.
The in vitro two-photon microscope was built as previously described52 and the in vivo two-photon microscope was built based on the open-access design of the Modular In vivo Multiphoton Microscopy System (MIMMS) from Howard Hughes Medical Institute Janelia Research Campus (https://www.janelia.org/open-science/mimms). Both two-photon microscopes were controlled by the ScanImage software52 (Vidrio). Fluorophores were excited with a 80 MHz pulsed Titanium-Sapphire laser at the following wavelengths: (850 nm for Epac1-camps, Epac2-camps300, ICUE3, Epac-SH187, and all cAMPFIRE variants; 960 nm for Flamindo2 and cAMPr; and 990 nm for Pink Flamindo and R-FlincA). The fluorescence emission was unmixed using a dichroic mirror and band-pass filters. Specifically, Semrock FF511-Di01, Semrock FF01-483/32 and Semrock FF01-550/49 were used for Epac1-camps, Epac2-camps300, ICUE3, Epac-SH187, and all cAMPFIRE variants. The Chroma 565DCXR dichroic was used for Flamindo2, Pink Flamindo, cAMPr, and R-FlincA, with a Semrock FF01-630/92 barrier filter used for Pink Flamindo and R-FlincA, and a Chroma HQ510/70 barrier filter for cAMPr and Flamindo2.
2pFLIM was carried out as recently described14,43. Briefly, four hardware components were integrated into the two-photon setup, including a photodiode (Thorlabs FDS010), a fast, cooled photomultiplier tube (Hamamatsu H7422PA-40 or H10769PA-40), a TCSPC-730 or SPC-150 (Becker and Hickl) time-correlated single photon counting board, and, where needed, a frequency to analog converter (Becker and Hickl HPM-CON-02). Data acquisitions were controlled by FLIMimage14,43, which functions as an integrated add-on to ScanImage.
For in vitro and ex vivo imaging, pharmacological reagents were bath applied except that, in the puffing experiment, a glass electrode pipette filled with 1M norepinephrine was placed close to HEK cells to deliver drug under the control of a Picospritzer III apparatus (10 s puffs at 20 psi). For the puffing experiment, ratiometric images at a single plane were acquired once every five seconds.
For in vivo imaging experiments, animals were head-fixed and placed on a treadmill which, except during locomotion-related experiments, was fixed. Where appropriate, the treadmill angular velocity was measured using a rotary encoder (MA3-A10-250-N) and digitized using a National Instrument DAQ board (PCIe-6259) and the MATLAB DAQ toolbox. Isoflurane (1.5%) was delivered via inhalation through a nose cone. All other pharmacological reagents were administered via intraperitoneal injection.
Image analysis.
Two-photon image analyses and 2pFLIM analyses were carried out using previously described software suites called synScore53 and FLIMview14, respectively, both written in MATLAB. Plots, curve fittings, and clustering analyses were carried out using MATLAB or Prism. Where appropriate, regions of interest were drawn to isolate HEK cell, somatic or dendritic signals from contamination by background photons or adjacent cells/structures. For ratiometric imaging, individual channels were background subtracted based on a nearby background ROI before calculating the ratio. Fluorescence lifetime was approximated by the mean photon emission time (τ):
with t being the emission time of individual photons and t0 reflecting the timing of laser pulses within the measurement window. t0 is a fixed property and is measured separately under ideal imaging conditions.
Analysis of in vivo data.
Quantification of fluorescence lifetime under control and pharmacologically manipulated conditions was conducted by averaging typically ≥ 3 representative time points. The data from a subset of cells exhibiting systematic drift in baseline conditions, presumably due to bleaching, were corrected using a fit from the baseline data. For Fig. 6d, Pearson’s correlation coefficient was calculated between repeated trials from a single cell or from average response across trials between different cells. For Fig. 6e, the hierarchical clustering was performed on the average of responsive bouts for each cell. Euclidean distance and the Ward linkage metric were used after comparing multiple linkage metrics and clustering algorithms. Output clusters were similar between hierarchical and non-hierarchical (K-mean) clustering algorithms. The hierarchical method was chosen to reduce bias from predetermining the cluster number. Cells with data from five or fewer running bouts were excluded from clustering as were cells with no response to running. A bout was deemed responsive if the average response in a 100-s window surrounding the peak surpassed the baseline plus the baseline standard deviation. The averaged baseline standard deviation across all cells was 0.021 ns. Plotted lifetime traces were smoothed using a three-point moving average.
Generation of fly transgenic lines.
cDNAs were amplified from mammalian plasmids by PCR and cloned into the pUASTattB plasmid via In-Fusion® HD cloning (Takara Bio USA) or into the HindIII and XbaI restriction sites. The resulting constructs were individually microinjected (250 ng/μL, Eppendorf FemtoJet) into embryos of yv nos-phiC31; P{CaryP}attP40 (BL# 25709) flies to generate stable transgenic lines (Supplementary Table 1). Drosophila lines will be deposited to the Bloomington Drosophila Stock Center.
Live Imaging of flies.
Drosophila strains were raised under standard conditions at 25°C with a 12-hr:12-hr light-dark cycle. Embryos were collected for 6–7 hr at 25 °C on molasses-based cornmeal food and grown at 25 °C until late 3rd instar. Larvae of both sexes were then dissected and imaged in hemolymph-like 3 (HL3) saline with 10 mM glutamate to suppress muscle movement (in mM: 70 NaCl, 5 KCl, 1.5 CaCl2, 20 MgCl2, 5 trehalose, 115 sucrose, 5 HEPES, 10 glutamate). To expose the central nervous system (CNS) for imaging, larvae were immobilized by insect pins, cut along the dorsal midline, and splayed open to expose internal tissues. Internal tissues were carefully removed from the anterior half of the larvae, taking care not to touch the CNS and keeping the larvae as intact as possible. Live imaging was performed using a Leica SP5 confocal system equipped with an acousto-optical beam splitter and an HC Fluotar L 25x/0.95 W VISR immersion objective with the pinhole set to three Airy units (Leica). For Extended Data Figs. 10b and 10c, fluorescence was excited by a 405 nm laser and collected by two photomultiplier tubes set to 440–500nm (mTurquoise2) and 575–700 nm (td-cpVenus signal), respectively. Image stacks were acquired every 10 seconds at a scan speed of 1400 Hz with 2x line averaging using LAS AF 2.7.3 (Leica). For Extended Data Figs. 10d and 10e, 458-nm excitation and collection at 460–500 nm (mTurquoise2) and 520–600 nm (td-cpVenus) were used, with image stacks acquired every 5 seconds and 3x line averaging.
Analysis of fly imaging data.
All images were analyzed in ImageJ (NIH). Drift correction was performed using the Correct 3D Drift plugin with multi time scale computation. Background for each channel was estimated as the mean fluorescence during the first 20 time points within an ROI drawn over a background region of the image and was then subtracted before calculating a maximum intensity projection. An ROI containing the cell body was defined based on the first image using automatic thresholding and the binary Fill Holes and Erode commands in ImageJ. The mean fluorescence intensity of the ROI was calculated for each timepoint. The FRET ratio was then calculated as mTurquoise/td-cpVenus and normalized to the initial ratio. Plotted traces were smoothed using a 5-point moving average.
Data presentation and statistical analysis.
Quantification and statistical tests were performed using custom software written in MATLAB. In box plots, lower and upper box lines indicate 25th and 75th percentile, respectively, with middle line indicating median and whiskers indicating total range of data, not including outliers. All measurements were taken from different cells. “n” refers to the number of cells unless noted. In HEK cell experiments, two – four (most typically two) cells were measured simultaneously per coverslip. In slice experiments, all neurons came from different slices. All experiments were repeated for at least two, typically more, independent transfections (in vitro) or mice (in vivo). Unless otherwise noted, the Bartlett test was used to determine if variances were equal, and the Shapiro Wilk test was used to determine if data were normally distributed. When the assumptions of normality and homoscedasticity were met, a two-tailed Student’s t-test or one-way ANOVA followed by a Tukey-Kramer post-hoc test were used. When neither the assumption was met, the Mann-Whitney U test was used.
Extended Data
Extended Data Figure 1. Correcting the perinuclear localization of the Epac-SH187 sensor.
a, Crystal structure of the NPL sequence in Epac2A (top) and the alignment of NPL sequences between Epac1 with Epac2. The positions tested are highlighted in the structure (red) and at the alignment (asterisks). b, Representative images of the indicated mutants compared to Epac-SH187 in HEK cells. From left to right starting from the top, n (cells/coverslips) = 69/29, 50/5, 59/29, 18/3, 12/2, 12/2, 37/4. c, Response time course (left) and quantification of the response of indicated constructs to the indicated stimuli in HEK cells. From left to right, n = 20, 13, and 11. Dark lines and bars indicate mean. Shaded area indicates s.e.m. d, Representative images of the indicated mutant compared to Epac-SH187 in L2/3 pyramidal neurons. Single two-photon optical sections are shown. n (cells/mice) = 18/5 and 20/8 for Epac-SH187 and L777A/K778A, respectively.
Extended Data Figure 2. Localization-correcting mutations reduce the tendency of the sensor to aggregate.
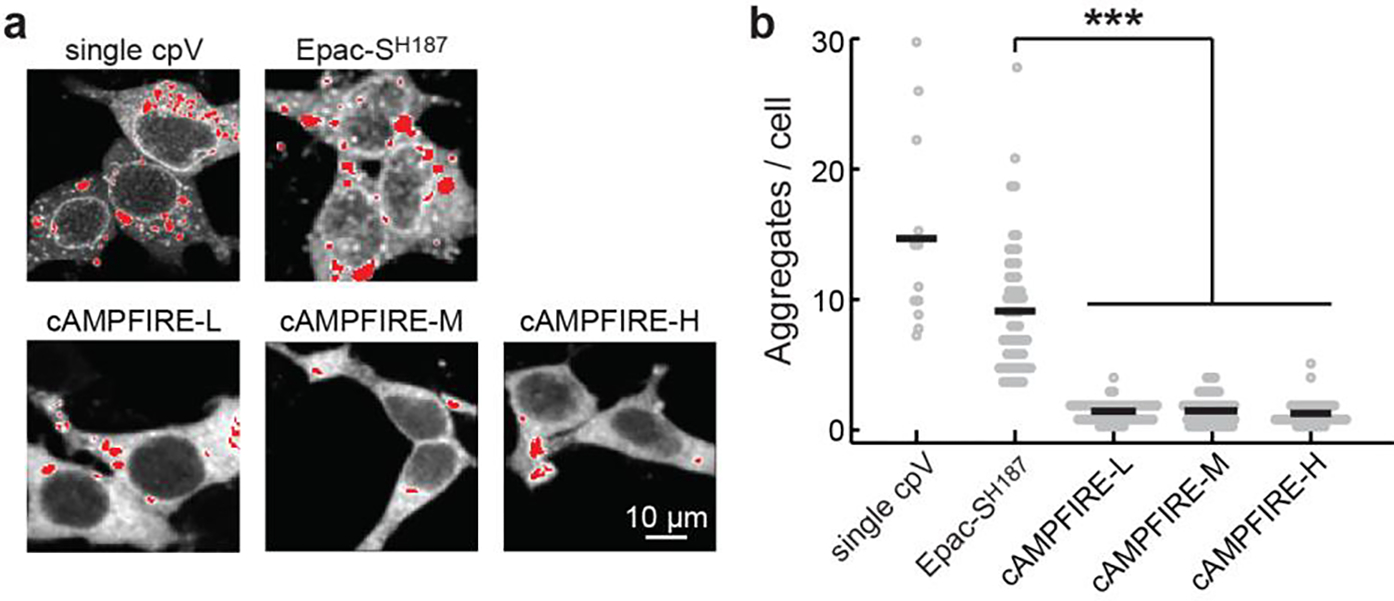
a & b, Representative images (a) and quantifications (b) of the number of aggregates per cell resulting from the indicated constructs. To ease the visualization of aggregates, saturated pixels (for display only) are showed in red. Single cpV: a sensor variant that is the same as Epac-SH187 with the exception that it only has a single cpVenus as the FRET acceptor. From left to right, n (cells) = 12, 58, 53, 48, and 41. Lines indicate mean. ***: p < 0.001 (from left to right, p = 3.3×10⁻¹⁰, 5.2×10⁻¹⁰ and 1.7×10⁻¹⁰) for all comparisons, two-tailed Welch test.
Extended Data Figure 3. Candidate residues for tuning the affinity of cAMP binding.
a, Crystal structure analyses of the cAMP binding site of Epac2A suggests 10 positions that potentially affect the cAMP binding affinity. b, Alignment of a portion of the CNB domain of Epac1 with those of the CNG channel CNGA2 and CNGA3. Known positions at which mutations affect the affinity of the CNG channels to their ligand are shown (asterisks).
Extended Data Figure 4. Responses of cAMPFIREs in absolute CFP/YFP ratios.
From left to right, n (cells) = 65, 53, 49, and 55. Black points indicate mean. The resting CFP/YFP ratios were (mean ± s.e.m): 0.164 ± 0.002 for Epac-SH187, and 0.222 ± 0.004 for cAMPFIRE-H; ***: p = 1.6×10⁻¹⁹, two-tailed Welch test.
Extended Data Figure 5. pH dependence of cAMPFIRE responses.
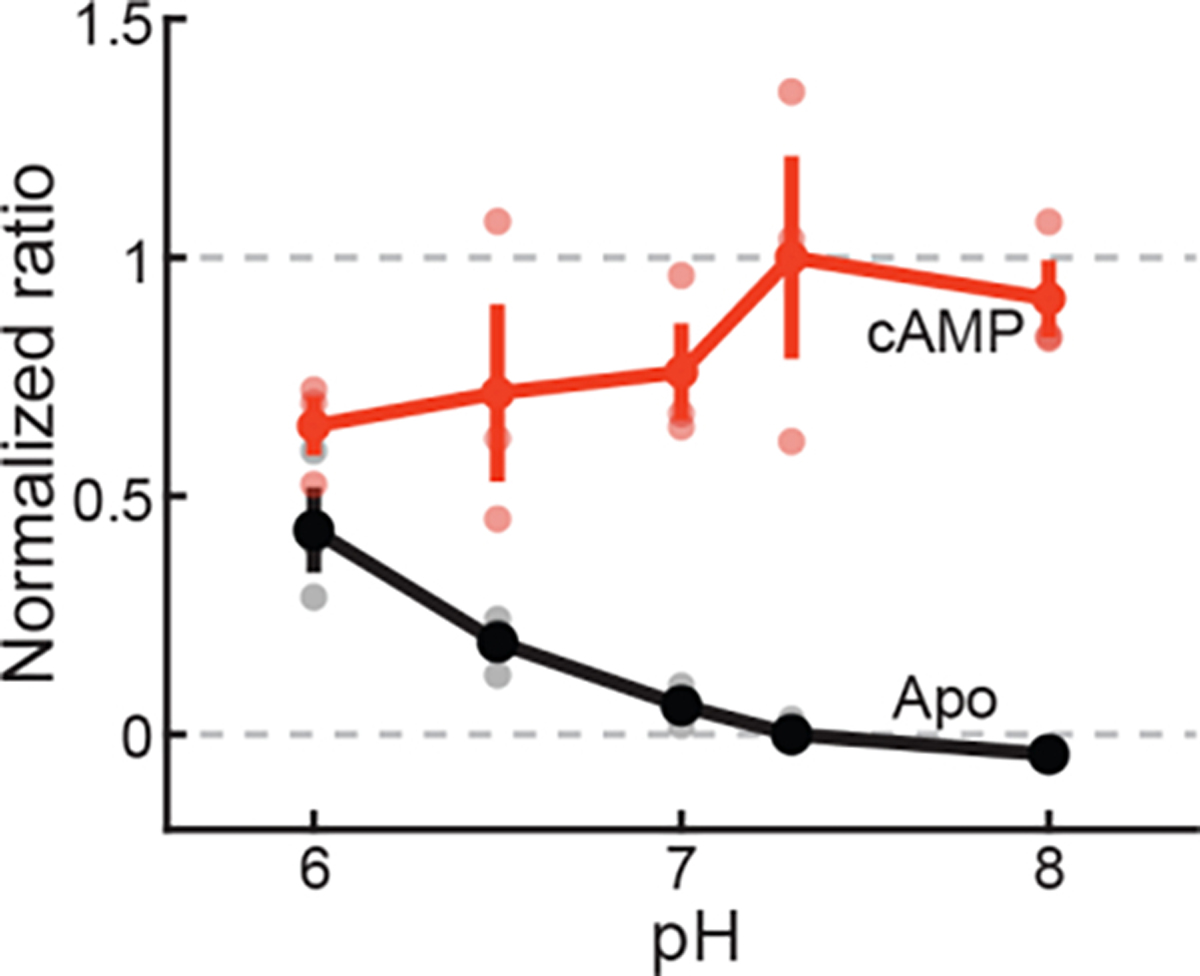
Sensor signal (fluorescence ratio) in the absence (black; Apo) or presence (red) of 100 μM cAMP normalized to the dynamic range of the sensor at pH 7.3 under the same measurement conditions. Averaged data are presented as mean ± s.e.m. n = 3 measurements, each from a different protein aliquot, for each condition.
Extended Data Figure 6. 2pFLIM characterizations of cAMPFIREs in HEK cells and as immunoprecipitated proteins.
a, Representative images and lifetime decay curves of cAMPFIRE-M in HEK cells in the presence of the indicated stimuli. Representative of 10 cells from 4 coverslips. b & c, 2pFLIM response traces (b), and NE concentration-response curves in HEK cells fitted by the Hill equation (c), of Epac-SH187 and cAMPFIRE-L, M, and H in HEK cells. Hill coefficients = 0.32, 0.51, 0.79, and 0.84, respectively, for Epac-SH187 and cAMPFIRE-L, M, and H. From low to high concentrations, the n (cells) is: for cAMPFIRE-L, 8, 8, 8, 13, 8, and 8; for cAMPFIRE-M, 6, 8, 8, 10, 9, and 8; for cAMPFIRE-H, 8, 14, 7, 11, and 8; and for Epac-SH187, 9, 8, 11, 4, and 8. Dark lines and shaded areas in panel b, and points and error bars in panel c indicate mean and s.e.m., respectively. d, 2pFLIM response amplitudes of each sensor in HEK cells elicited by 25 μM forskolin and 50 μM IBMX. From left to right, n (cells) = 32, 45, 41, and 48. Bars indicate mean. ***: p < 0.001 for all comparisons, from left to right, p = 1.7×10⁻¹⁸, 1.1×10⁻²⁸, and 8.2×10−39, dF = 35, 53, and 60, two-tailed Welch test. e, Representative lifetime decay curves of cAMPFIRE-L immunoprecipitated onto Protein A agarose beads in the presence of the indicated cAMP concentrations. Representative of 3 beads. f, 2pFLIM concentration-response curves of cAMPFIRE proteins immunoprecipitated onto Protein A agarose beads in response to cAMP. Points and error bars indicated mean and s.e.m., respectively. For cAMPFIRE-L, -M, and -H, respectively, n = 3, 4 and 4 beads; Hill coefficients = 0.65, 0.68, and 0.82.
Extended Data Figure 7. Transfection and imaging of L2/3 neurons in the somatosensory cortex.
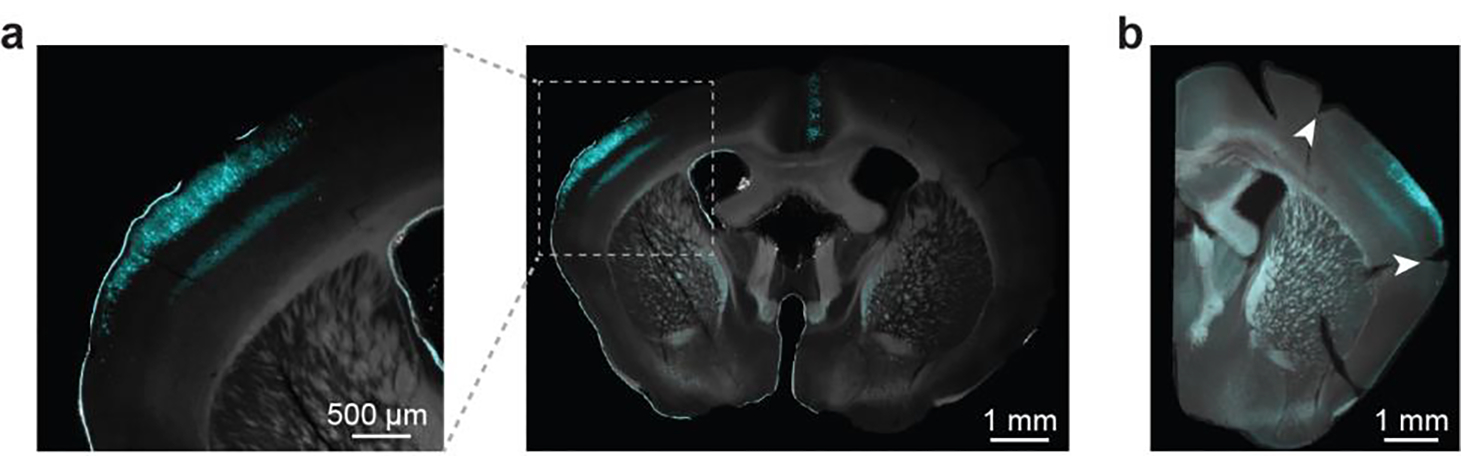
a, Example brain slice images (representative of 21 mice) from a mouse transfected with cAMPFIRE-L via in utero electroporation. The sensor-transfected neurons are shown in cyan. b, A post hoc coronal section from an experimental mouse (representative of 7 mice) showing the edge of cranial window (arrowheads), which was marked during perfusion and dissection of the brain. The window was implemented on comparable coordinates for all experimental mice.
Extended Data Figure 8. Characterizations of cAMPFIRE responses in neurons.
a, Response traces of cAMPFIRE-M in CA1 neurons in cultured hippocampal slices to 0.1 μM norepinephrine in the absence or presence of 1 μM propranolol, followed by wash. n (cells) = 4 for both. Dark lines indicate mean and shaded areas indicate s.e.m. b, Response traces of cAMPFIRE-L and its R279E mutant in CA1 neurons in cultured hippocampal slices to 1 μM norepinephrine. cAMPFIRE-L data are the same as those in Fig. 5b. n (cells) = 5 for R279E mutant. Dark lines indicate mean and shaded areas indicate s.e.m. c, 2pFLIM responses in absolute values of cAMPFIRE-L and cAMPFIRE-M to forskolin and IBMX in different cell types, indicating that different cell types exhibit different baseline and dynamic ranges. From left to right, n (cells) = 21, 10, 12, 18, 16, and 10. Black points indicate mean.
Extended Data Figure 9. Additional electrophysiological characterizations of cAMPFIREs in CA1 neurons.
a & b, Quantification of the elicited AMPAR and NMDAR currents (in pA) of CA1 neurons transfected with cAMPFIRE-L or cAMPFIRE-M compared to adjacent untransfected control neurons. For both, n = 10 neuronal pairs for cAMPFIRE-L and 16 for cAMPFIRE-M. Blue points and error bars indicate mean and s.e.m., respectively. c & d, example traces (c), and amplitudes (d) of mEPSCs (n = 9 for -L and 7 for -M) of CA1 neurons transfected with cAMPFIRE-L and cAMPFIRE-M compared to adjacent untransfected control neurons. e, Quantification of the paired pulsed ratio (n = 11 for -L and 15 for -M) of CA1 neurons transfected with cAMPFIRE-L and cAMPFIRE-M compared to adjacent untransfected control neurons. n.s.: not significant, paired two-tailed Student’s t-test. Colored points and error bars indicate mean and s.e.m., respectively. For panels d and e from left to right, p = 0.55, 0.87, 0.12, and 0.42, dF = 8, 6, 10 and 14.
Extended Data Figure 10. cAMPFIREs detect cAMP responses in Drosophila larvae.
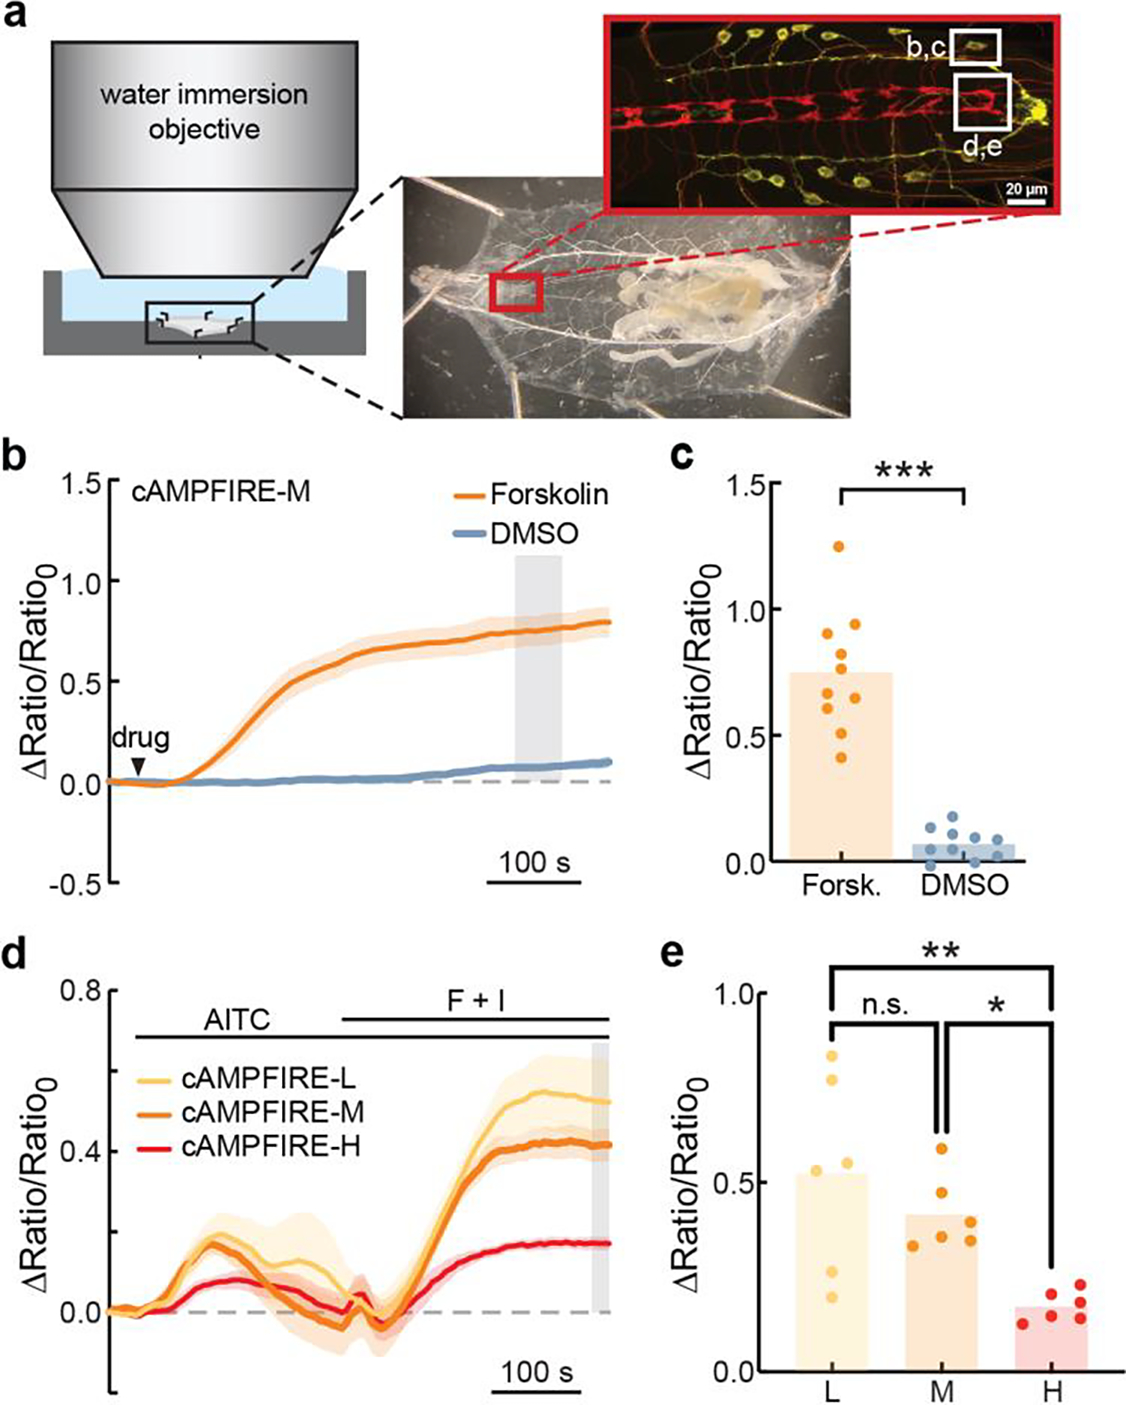
. a, Schematic showing experimental setup. Larvae were dissected to expose the intact central nervous system (boxed region) and imaged with a water immersion objective. b & c, Average traces (b) and collective responses measured from the gray shaded area in panel b (c) of abdominal leucokinin neuronal somas expressing cAMPFIRE-M following application of forskolin (40 μM) or DMSO-only control. In panel b, Dark lines indicate mean and shaded areas indicate s.e.m. Arrowhead indicates time of bath application. Bars indicate mean. ***: p = 1.1×10⁻⁵, two-tailed Wilcoxon Rank-Sum test. n = 10 larvae per condition. d & e, Average traces (d) and collective responses measured from gray shaded area in panel d (e) of fly larval nociceptive axon terminals in response to bath application of AITC (allyl isothiocyanate; 2.5 mM) followed by forskolin (40 μM) and IBMX (100 μM). AITC is a stimulant for larval nociceptors. Dark lines indicate mean and shaded areas indicate s.e.m. Bars indicate mean. n.s.: not significant (p = 0.49), *: p = 0.049, **: p = 0.0048, two-tailed one-way ANOVA with Tukey’s multiple comparisons. n = 6 larvae per condition.
Supplementary Material
Acknowledgements
We thank Dr. Ryohei Yasuda (Max Planck Florida) for 2pFLIM acquisition software; Dr. Jin Zhang (University of California, San Diego) for ICUE3 cDNA; Dr. Kees Jalink (Netherlands Cancer Institute) for Epac-SH187 cDNA; Drs. Laurinda Jaffe (University of Connecticut) and Viacheslav Nikolaev (University of Hamburg) for Epac1-camps and Epac2-camps300 cDNA; Drs. Lei Ma and Vivek Unni and Ms. Sydney Boutros at Oregon Health & Science University and Josh Melander at Stanford University for training and advice on in vivo surgery; Dr. Kevin Wright (Vollum Institute) for immunoprecipitation reagents; Ms. Caitlynn De Preter for contributing to in vitro data collection; Ms. Makayla Freitas for assistance in spectrophotometer measurements; the OHSU Shared Resources Biophysics Core for use of the stopped flow device. Drs. Bart Jongbloets, Michael Muniak, and Lei Ma, Ms. Yang Chen, and the entire Zhong lab and Mao lab at Oregon Health and Science University for helpful comments and discussions. Fly stocks from the Bloomington Drosophila Stock Center (NIH P40OD018537) were used. This work was supported by two NIH BRAIN Initiative awards R01NS104944 (H.Z. and T.M.) and RF1MH120119 (H.Z. and T.M.), an NINDS R01 grant R01NS081071 (T.M.), and an NIGMS R01 grant R01GM138862 (I.B.). The study on Drosophila was supported by an NIH R01 grant R01NS104299 (B.Y.).
Footnotes
Competing interests
The authors declare no competing interests.
Data availability
cAMPFIRE constructs and their corresponding sequences have been deposited to Addgene (https://www.addgene.org/browse/article/28224671/). cAMPFIRE DNA sequences have been deposited to GenBank (Access Number ON986214, ON986215, ON986216, ON986217 for cAMPFIRE-L, cAMPFIRE-M, cAMPFIRE-H, and cAMPFIRE-L-R279E, respectively).
References
- 1.Berman HM et al. The cAMP binding domain: An ancient signaling module. Proc. Natl. Acad. Sci. U. S. A. 102, 45–50 (2005). [DOI] [PMC free article] [PubMed] [Google Scholar]
- 2.Dunn TA & Feller MB Imaging second messenger dynamics in developing neural circuits. Developmental Neurobiology vol. 68 835–844 (2008). [DOI] [PMC free article] [PubMed] [Google Scholar]
- 3.Greengard P The neurobiology of slow synaptic transmission. Science vol. 294 (2001). [DOI] [PubMed] [Google Scholar]
- 4.Beavo JA & Brunton LL Cyclic nucleotide research — still expanding after half a century. Nat. Rev. Mol. Cell Biol. 3, 710–717 (2002). [DOI] [PubMed] [Google Scholar]
- 5.Chen Y et al. Endogenous Gαq-Coupled Neuromodulator Receptors Activate Protein Kinase A. Neuron 96, 1070–1083.e5 (2017). [DOI] [PMC free article] [PubMed] [Google Scholar]
- 6.Buxton ILO & Brunton LL Compartments of cyclic AMP and protein kinase in mammalian cardiomyocytes. J. Biol. Chem. 258, 10233–10239 (1983). [PubMed] [Google Scholar]
- 7.Scott JD & Pawson T Cell signaling in space and time: Where proteins come together and when they’re apart. Science vol. 326 1220–1224 (2009). [DOI] [PMC free article] [PubMed] [Google Scholar]
- 8.Adams SR, Harootunian AT, Buechler YJ, Taylor SS & Tsien RY Fluorescence ratio imaging of cyclic AMP in single cells. Nature 349, 694–697 (1991). [DOI] [PubMed] [Google Scholar]
- 9.Massengill CI, Day-Cooney J, Mao T & Zhong H Genetically encoded sensors towards imaging cAMP and PKA activity in vivo. Journal of Neuroscience Methods vol. 362 (2021). [DOI] [PMC free article] [PubMed] [Google Scholar]
- 10.Shafer OT et al. Widespread Receptivity to Neuropeptide PDF throughout the Neuronal Circadian Clock Network of Drosophila Revealed by Real-Time Cyclic AMP Imaging. Neuron 58, 223–237 (2008). [DOI] [PMC free article] [PubMed] [Google Scholar]
- 11.Muntean BS et al. Interrogating the Spatiotemporal Landscape of Neuromodulatory GPCR Signaling by Real-Time Imaging of cAMP in Intact Neurons and Circuits. Cell Rep. 22, 255–268 (2018). [DOI] [PMC free article] [PubMed] [Google Scholar]
- 12.Oe Y et al. Distinct temporal integration of noradrenaline signaling by astrocytic second messengers during vigilance. Nat. Commun. 11, 1–15 (2020). [DOI] [PMC free article] [PubMed] [Google Scholar]
- 13.Harada K et al. Red fluorescent protein-based cAMP indicator applicable to optogenetics and in vivo imaging. Sci. Rep. 7, 1–9 (2017). [DOI] [PMC free article] [PubMed] [Google Scholar]
- 14.Ma L et al. A Highly Sensitive A-Kinase Activity Reporter for Imaging Neuromodulatory Events in Awake Mice. Neuron (2018) doi: 10.1016/j.neuron.2018.07.020. [DOI] [PMC free article] [PubMed] [Google Scholar]
- 15.Nikolaev VO, Bünemann M, Hein L, Hannawacker A & Lohse MJ Novel single chain cAMP sensors for receptor-induced signal propagation. J. Biol. Chem. 279, 37215–8 (2004). [DOI] [PubMed] [Google Scholar]
- 16.Norris RP et al. Cyclic GMP from the surrounding somatic cells regulates cyclic AMP and meiosis in the mouse oocyte. Development 136, 1869–1878 (2009). [DOI] [PMC free article] [PubMed] [Google Scholar]
- 17.DiPilato LM & Zhang J The role of membrane microdomains in shaping β2-adrenergic receptor-mediated cAMP dynamics. Mol. Biosyst. 5, 832 (2009). [DOI] [PubMed] [Google Scholar]
- 18.Odaka H, Arai S, Inoue T & Kitaguchi T Genetically-encoded yellow fluorescent cAMP indicator with an expanded dynamic range for dual-color imaging. PLoS One 9, (2014). [DOI] [PMC free article] [PubMed] [Google Scholar]
- 19.Klarenbeek J, Goedhart J, van Batenburg A, Groenewald D & Jalink K Fourth-Generation Epac-Based FRET Sensors for cAMP Feature Exceptional Brightness, Photostability and Dynamic Range: Characterization of Dedicated Sensors for FLIM, for Ratiometry and with High Affinity. PLoS One 10, e0122513 (2015). [DOI] [PMC free article] [PubMed] [Google Scholar]
- 20.Hackley CR, Mazzoni EO & Blau J cAMPr: A single-wavelength fluorescent sensor for cyclic AMP. Sci. Signal. 11, (2018). [DOI] [PMC free article] [PubMed] [Google Scholar]
- 21.Ohta Y, Furuta T, Nagai T & Horikawa K Red fluorescent cAMP indicator with increased affinity and expanded dynamic range. Sci. Rep. 8, 1866 (2018). [DOI] [PMC free article] [PubMed] [Google Scholar]
- 22.Mao T, O’Connor DH, Scheuss V, Nakai J & Svoboda K Characterization and subcellular targeting of GCaMP-type genetically-encoded calcium indicators. PLoS One 3, (2008). [DOI] [PMC free article] [PubMed] [Google Scholar]
- 23.Tian L et al. Imaging neural activity in worms, flies and mice with improved GCaMP calcium indicators. Nat. Methods 6, (2009). [DOI] [PMC free article] [PubMed] [Google Scholar]
- 24.Goedhart J et al. Structure-guided evolution of cyan fluorescent proteins towards a quantum yield of 93%. Nat. Commun. 3, (2012). [DOI] [PMC free article] [PubMed] [Google Scholar]
- 25.Yasuda R Imaging spatiotemporal dynamics of neuronal signaling using fluorescence resonance energy transfer and fluorescence lifetime imaging microscopy. Current Opinion in Neurobiology vol. 16 (2006). [DOI] [PubMed] [Google Scholar]
- 26.Yellen G & Mongeon R Quantitative two-photon imaging of fluorescent biosensors. Current Opinion in Chemical Biology vol. 27 24–30 (2015). [DOI] [PMC free article] [PubMed] [Google Scholar]
- 27.Qiao J, Mei FC, Popov VL, Vergara LA & Cheng X Cell cycle-dependent subcellular localization of exchange factor directly activated by cAMP. J. Biol. Chem. 277, (2002). [DOI] [PubMed] [Google Scholar]
- 28.Parnell E, Smith BO & Yarwood SJ The cAMP sensors, EPAC1 and EPAC2, display distinct subcellular distributions despite sharing a common nuclear pore localisation signal. Cell. Signal. 27, (2015). [DOI] [PMC free article] [PubMed] [Google Scholar]
- 29.Ponsioen B et al. Direct Spatial Control of Epac1 by Cyclic AMP. Mol. Cell. Biol. 29, (2009). [DOI] [PMC free article] [PubMed] [Google Scholar]
- 30.Rehmann H, Das J, Knipscheer P, Wittinghofer A & Bos JL Structure of the cyclic-AMP-responsive exchange factor Epac2 in its auto-inhibited state. Nature 439, 625–628 (2006). [DOI] [PubMed] [Google Scholar]
- 31.van der Krogt GNM, Ogink J, Ponsioen B & Jalink K A Comparison of Donor-Acceptor Pairs for Genetically Encoded FRET Sensors: Application to the Epac cAMP Sensor as an Example. PLoS One 3, e1916 (2008). [DOI] [PMC free article] [PubMed] [Google Scholar]
- 32.Francis SH & Corbin JD Structure and Function of Cyclic Nucleotide-Dependent Protein Kinases. Annu. Rev. Physiol. (1994) doi: 10.1146/annurev.ph.56.030194.001321. [DOI] [PubMed] [Google Scholar]
- 33.Castro LRV, Guiot E, Polito M, Paupardin-Tritsch D & Vincent P Decoding spatial and temporal features of neuronal cAMP/PKA signaling with FRET biosensors. Biotechnology Journal vol. 9 (2014). [DOI] [PubMed] [Google Scholar]
- 34.Koschinski A & Zaccolo M Activation of PKA in cell requires higher concentration of cAMP than in vitro: Implications for compartmentalization of cAMP signalling. Sci. Rep. 7, 1–12 (2017). [DOI] [PMC free article] [PubMed] [Google Scholar]
- 35.Rehmann H et al. Structure of Epac2 in complex with a cyclic AMP analogue and RAP1B. Nature 455, 124–127 (2008). [DOI] [PubMed] [Google Scholar]
- 36.Reuter P et al. Mutations in CNGA3 impair trafficking or function of cone cyclic nucleotide-gated channels, resulting in achromatopsia. Hum. Mutat. 29, 1228–1236 (2008). [DOI] [PubMed] [Google Scholar]
- 37.Varnum MD, Black KD & Zagotta WN Molecular mechanism for ligand discrimination of cyclic nucleotide-gated channels. Neuron 15, (1995). [DOI] [PubMed] [Google Scholar]
- 38.Bubis J, Neitzel JJ, Saraswat LD & Taylor SS A point mutation abolishes binding of cAMP to site A in the regulatory subunit of cAMP-dependent protein kinase. J. Biol. Chem. 263, (1988). [PubMed] [Google Scholar]
- 39.Dao KK et al. Epac1 and cAMP-dependent protein kinase holoenzyme have similar cAMP affinity, but their cAMP domains have distinct structural features and cyclic nucleotide recognition. J. Biol. Chem. 281, 21500–11 (2006). [DOI] [PubMed] [Google Scholar]
- 40.Tillo SE et al. Liberated PKA Catalytic Subunits Associate with the Membrane via Myristoylation to Preferentially Phosphorylate Membrane Substrates. Cell Rep. (2017) doi: 10.1016/j.celrep.2017.03.070. [DOI] [PMC free article] [PubMed] [Google Scholar]
- 41.Madison DV & Nicoll RA Cyclic adenosine 3’,5’-monophosphate mediates beta-receptor actions of noradrenaline in rat hippocampal pyramidal cells. J. Physiol. 372, (1986). [DOI] [PMC free article] [PubMed] [Google Scholar]
- 42.Sando R, Ho ML, Liu X & Südhof TC Engineered synaptic tools reveal localized cAMP signaling in synapse assembly. J. Cell Biol. 221, (2022). [DOI] [PMC free article] [PubMed] [Google Scholar]
- 43.Jongbloets BC, Ma L, Mao T & Zhong H Visualizing protein kinase A activity in head-fixed behaving mice using in vivo two-photon fluorescence lifetime imaging microscopy. J. Vis. Exp. 2019, (2019). [DOI] [PMC free article] [PubMed] [Google Scholar]
- 44.Brown RE, Basheer R, McKenna JT, Strecker RE & McCarley RW Control of sleep and wakefulness. Physiological Reviews vol. 92 (2012). [DOI] [PMC free article] [PubMed] [Google Scholar]
- 45.Constantinople CM & Bruno RM Effects and mechanisms of wakefulness on local cortical networks. Neuron 69, (2011). [DOI] [PMC free article] [PubMed] [Google Scholar]
- 46.Aoki C, Joh TH & Pickel VM Ultrastructural localization of β-adrenergic receptor-like immunoreactivity in the cortex and neostriatum of rat brain. Brain Res. 437, (1987). [DOI] [PubMed] [Google Scholar]
- 47.Scheinin M et al. Distribution of α2-adrenergic receptor subtype gene expression in rat brain. Mol. Brain Res. 21, (1994). [DOI] [PubMed] [Google Scholar]
- 48.Le Merrer J, Becker JAJ, Befort K & Kieffer BL Reward processing by the opioid system in the brain. Physiological Reviews vol. 89 (2009). [DOI] [PMC free article] [PubMed] [Google Scholar]
- 49.Polack PO, Friedman J & Golshani P Cellular mechanisms of brain state-dependent gain modulation in visual cortex. Nat. Neurosci. 16, (2013). [DOI] [PMC free article] [PubMed] [Google Scholar]
- 50.Birdsong WT et al. Synapse-specific opioid modulation of thalamo-cortico-striatal circuits. Elife 8, (2019). [DOI] [PMC free article] [PubMed] [Google Scholar]
- 51.Sabatini BL & Tian L Imaging Neurotransmitter and Neuromodulator Dynamics In Vivo with Genetically Encoded Indicators. Neuron vol. 108 (2020). [DOI] [PubMed] [Google Scholar]
- 52.Pologruto TA, Sabatini BL & Svoboda K ScanImage: Flexible software for operating laser scanning microscopes. Biomed. Eng. Online (2003) doi: 10.1186/1475-925X-2-13. [DOI] [PMC free article] [PubMed] [Google Scholar]
- 53.Melander JB et al. Distinct in vivo dynamics of excitatory synapses onto cortical pyramidal neurons and parvalbumin-positive interneurons. Cell Rep. 37, 109972 (2021). [DOI] [PMC free article] [PubMed] [Google Scholar]
Associated Data
This section collects any data citations, data availability statements, or supplementary materials included in this article.
Supplementary Materials
Data Availability Statement
cAMPFIRE constructs and their corresponding sequences have been deposited to Addgene (https://www.addgene.org/browse/article/28224671/). cAMPFIRE DNA sequences have been deposited to GenBank (Access Number ON986214, ON986215, ON986216, ON986217 for cAMPFIRE-L, cAMPFIRE-M, cAMPFIRE-H, and cAMPFIRE-L-R279E, respectively).