

Abstract
Cerebral blood flow (CBF) is critical for brain metabolism and function. Age‐related changes in CBF are associated with increased risk of neurocognitive disorders and vascular events such as stroke. Identifying correlates and positive modifiers of age‐related changes in CBF before the emergence of incipient clinical decline may inform public health advice and clinical practice. Former research has been inconclusive regarding the association between regular physical activity and CBF, and there is a lack of studies on the association between level of everyday activities and CBF, in older adults. To investigate these relationships, 118 healthy community‐dwelling adults (65–89 years) underwent pseudo‐continuous arterial spin labeling (ASL) MRI, neurocognitive, physical, and activity assessments at baseline. Eighty‐six participants completed a follow‐up ASL MRI, on average 506 (SD = 113) days after the baseline scan. Cross‐sectional analysis revealed credible evidence for positive associations between time spent on low intensity physical activity and CBF in multiple cortical and subcortical regions, time spent on moderate to vigorous intensity physical activity and accumbens CBF, participation in social activity and CBF in multiple cortical regions, and between reading and thalamic CBF, indicating higher regional CBF in more active adults. Longitudinal analysis revealed anecdotal evidence for an interaction between time and baseline level of gardening on occipital and parietal CBF, and baseline reading on pallidum CBF, indicating more change in CBF in adults with lower level of activity. The findings support that malleable lifestyle factors contribute to healthy brain aging, with relevance for public health guidelines.
Keywords: accelerometer, ASL, CBF, everyday activities, MRI, neuroimaging, physical activity
The present study is one of the first studies of the association between both level of physical activity and frequency of everyday activities and cortical and subcortical CBF in older adults. The main findings from the analyses supported that more physical activity, particular LPA, and higher frequency of everyday activities, particular social participation, were associated with higher CBF in multiple cortical and subcortical regions. Anecdotal evidence also supported associations between baseline everyday activities, including gardening and reading, and longitudinal change in CBF in specific regions.
Abbreviations
- ASL
arterial spin labeling
- CBF
cerebral blood flow
- LPA
low intensive physical activity
- MRI
magnetic resonance imaging
- MVPA
moderate‐ to vigorous intensity physical activity
1. INTRODUCTION
The world population aged 60 years and older is rapidly increasing and will account for 22% of the total population by 2050, up from 12% in 2015 (World Health Organization, 2018). Aging increases the risk of a multitude of conditions, including dementia and cardiovascular diseases, with potential severe impact on cognitive functions (Jaul & Barron, 2017) and independence (Carpenter et al., 2006; Sturm et al., 2002). Providing public health advice and interventions aimed at delaying or preventing age‐related diseases are important aims for the clinical neurosciences (Gorelick et al., 2011). Lifestyle factors such as physical activity and social participation are gaining increasing attention as indicators of successful cognitive aging and candidate targets for interventions (Chiuve et al., 2008; Forbes et al., 2013; Haeger et al., 2019; Hersi et al., 2017; Sarikaya et al., 2015).
A healthy vascular system is critical for sustaining the substantial metabolic demands of the brain (Attwell et al., 2010). Age‐related cerebrovascular changes include arterial stiffness and thickening (Holland et al., 2017), arteriosclerosis (Wang & Bennett, 2012) and reduced cerebral blood flow (CBF) (Alisch et al., 2021), which represent risk factors for cognitive impairments (Brown & Thore, 2011), stroke (Bangen et al., 2009) and dementia (Gorelick et al., 2011; Kelleher & Soiza, 2013). A better understanding of the associations between malleable lifestyle factors and cerebrovascular function can contribute to the development of targeted interventions and public health advice (Joris et al., 2018).
CBF can be measured non‐invasively using magnetic resonance imaging (MRI) arterial spin labeling (ASL) (Detre & Alsop, 1999; Williams et al., 1992). ASL has revealed decreased cortical and subcortical CBF in older adults (Alisch et al., 2021; Chen et al., 2011; Stoquart‐ElSankari et al., 2007; Zhang et al., 2017), which has been associated with regular exercise, fitness and intensity of daily physical activity, albeit with inconclusive results. An intervention study including patients with Alzheimer's disease (AD) showed no effect of moderate‐to‐vigorous aerobic training for 16 weeks on global or regional CBF (van der Kleij et al., 2018). Studies on healthy participants have suggested that cardiovascular fitness (Dougherty et al., 2020; Zimmerman et al., 2014) and aerobic training (Kleinloog et al., 2019) mitigate age‐related reduction in CBF. However, only one previous cross‐sectional study including 52 cognitive healthy adults aged 65–82 years has shown an association between accelerometer‐measured physical activity, including sedentary behavior, and CBF in frontal and medial temporal regions (Zlatar et al., 2019). Previous studies have also demonstrated beneficial effects of exercise (Hillman et al., 2008; Kramer & Colcombe, 2018), and higher cardiorespiratory fitness level (Sokołowski et al., 2021) on various cognitive functions in older adults. Importantly, the evidence of beneficial effects of high intensity exercise remains unclear, and a recent 5‐year randomized controlled trial revealed no additional effects of exercise with higher intensity compared to following national physical activity guidelines on brain volume (Pani et al., 2021) or cognition (Sokołowski et al., 2021) after the age of 70. To date, there is a need to strengthen the understanding of how regular physical activity of various intensities can serve as an indicator for, or even delay, age‐related neurovascular changes. In addition, although associations between participation in everyday activities and various cognitive functions in older adults have been established (Chan et al., 2018; Fratiglioni et al., 2004; Gow et al., 2017), there is a lack of cross‐sectional and longitudinal studies investigating the association between late life CBF and engagement in specific everyday activities, encompassing housework, work, social participation, and leisure activities. The associations between the brain vascular system and both physical activity and specific everyday activities are of particular interest due to the possibilities of low‐threshold interventions in various settings aiming at promoting brain health in the aging population.
With the objective to test for associations between baseline activity level and CBF at baseline and follow‐up, 118 community‐dwelling adults aged 65–89 years were assessed using multimodal brain MRI and accelerometer measured minutes of physical activity and completed questionnaires addressing frequency of specific everyday activities, including home maintenance, housework, work, social activities, and various leisure activities. Follow‐up MRI (n = 86) was performed on average 506 (SD = 113) days after the initial assessment, allowing for longitudinal CBF assessment. Based on previous work indicating lower cortical and subcortical CBF as a risk‐factor for age related diseases (Bangen et al., 2009; Kelleher & Soiza, 2013) and potential sensitivity to physical activity level (Zlatar et al., 2019), we hypothesized that participants with higher activity level at baseline would show higher cortical and subcortical CBF at both baseline and follow‐up compared to participants with lower activity level. Furthermore, based on its role as a putative protective factor we hypothesized that overall higher activity level at baseline would be associated with reduced longitudinal decline in cortical and subcortical CBF.
2. MATERIALS AND METHODS
2.1. Participants
The initial sample consisted of 341 participants from the StrokeMRI project, which aims to investigate lifestyle predictors of brain and cognitive health, including aging and stroke. Enrolment criteria and recruitment procedures have previously been described (Richard et al., 2018; Sanders et al., 2021). In brief, participants were healthy volunteers aged 18–94 years at enrolment, without history of neurological or psychiatric diseases, or current drug and/or alcohol abuse, and no MRI contraindications (e.g., pacemaker, ferrous implants, pregnancy, claustrophobia). Among the total sample, 131 participants aged 65–89 years underwent an expanded protocol including different measures of activity level. Five participants did not complete the MRI ASL protocol, six were excluded due to insufficient MRI data quality, one did not complete both Frenchay Activities Index (FAI) and accelerometer measured minutes of physical activity, and one was identified as an outlier and potential influential case on all baseline analysis, and excluded from the analysis. Accordingly, we included 118 participants at baseline. In addition, one participant did not complete the FAI questionnaire, making the total number of participants 117 for analysis including FAI at baseline. All individuals were considered to have normal cognitive function at baseline, with a mini‐mental state exam (MMSE) score above 24 (Folstein et al., 1975). A follow‐up MRI scan was completed, on average, 506 (SD = 113) days after the baseline scan, including 86 of the 118 participants.
The Regional Committees for Medical and Health Research Ethics for the South‐Eastern Norway approved the study (REK approvals 2014/694, 2015/1282). Each participant gave written informed consent at enrolment, in agreement with the Declaration of Helsinki.
2.2. Measures of frequency of everyday activities
To measure the frequency of engagement in specific activities relevant for an aging population, subscores from the standardized FAI questionnaire (Holbrook & Skilbeck, 1983) was applied. FAI consists of a 15‐item scale, capturing the regularity of various functional activities the last 3 or 6 months, for example, domestic work as washing up after meals, gardening, household maintenance, working, and active participation in social activities. Each activity is scored on a Likert scale, ranging from 0 (never/none) to 3 (weekly/most days etc.). The scale has been psychometrically evaluated for elderly populations (Imam & Miller, 2012; McPhail et al., 2009), including construct validity (Turnbull et al., 2000).
2.3. Accelerometer based assessment of physical activity
Participants used an ankle‐worn step activity measure (The Modus StepWatchTM3 Activity Monitor) for a median duration of seven consecutive days, ranging from 3 to 9 days. The protocol has been described elsewhere (Sanders et al., 2021). Briefly, the step activity measure recorded the stride count for every 1‐min period for the whole test duration, and the recorded numbers were doubled to capture strides from both legs. Participants wore the StepWatch for minimum 600 min per day (mean = 859 min, SD = 67), omitting hours with zero counting for more than 90 consecutive minutes, with the possible exception of 2 min interruption. The 30 min before and after this interruption were required to be zero count. Mean total steps per day was analyzed together with metrics representing duration of low intensity (LPA) (>0 steps/min to <100 steps/min) and moderate‐to‐vigorous intensity (MVPA) (≥100 steps/min) physical activity, based on a study linking oxygen consumption while walking with pedometer‐based measures (Marshall et al., 2009). The results were averaged across all valid days of usage.
2.4. MRI acquisition
MRI was completed on a 3 T MR 750 Discovery™ MRI scanner (GE healthcare, Milwaukee, USA) with a 32‐channel head coil at the Oslo University Hospital, Oslo, Norway.
We applied a Pseudo‐Continuous ASL (PCASL) sequence with images obtained with an interleaved 3D spiral fast spin echo (FSE) readout module. Scan time was 4:55 min, with the following parameters: 512 sampling points on eight spirals, spatial resolution = 4 × 4 × 3 mm, default reconstructed spatial resolution = 2 × 2 × 3 mm, TR = 5025, TE = 11,072 ms, labeling duration = 1450 ms, post‐labeling delay = 2025 ms, slice thickness = 3 mm, number of slices = 104, number of excitations = 3, and FOV = 256 mm. Care was taken when placing the lower edge of the 3D slab just below the cerebellum, which ensured that the distance to the labeling plane was approximately 9 cm below the anterior commissure to posterior commissure (AC‐PC) line, in head to feet direction (Aslan et al., 2010).
Structural T1‐weighted MRI were acquired using an inversion recovery‐fast spoiled gradient echo (BRAVO) sequence with 188 sagittal slices. Scan time was 4:43 min, TE = 3.18 ms, TR = 8.16 ms, T1 = 450 ms, field of view (FOV) = 256 mm, acquisition matrix = 256 × 256, 1 mm3 isotropic voxels, flip angle (FA) = 12°.
2.5. MRI processing and analysis
ASL data were processed using FMRIB Software Library (FSL) (Jenkinson et al., 2012). Briefly, CBF maps were computed using Bayesian Inference for ASL MRI (BASIL) (Chappell et al., 2009), with the following parameters: tissue T1 = 1.2 s, arterial T1 = 1.6 s, labeling efficiency = 0.6, bolus arrival time = 1.45 s, bolus duration = 1.45 s, inversion time TI = 3.475 s, and blood–brain barrier coefficient 0.98 mL/g. A proton‐density weighted calibration scan (M0) with equal readout as ASL and acquired in the same scan (the 40 last seconds), was used to voxel‐wise estimate equilibrium blood magnetization. To improve the accuracy of CBF estimation, partial volume error correction was completed (Chappell et al., 2011). Furthermore, spatial smoothing of the CBF map was done utilizing an adaptive filter (Groves et al., 2009).
T1‐weighted data were processed using FreeSurfer 5.3 (http://surfer.nmr.mgh.harvard.edu, Fischl, 2012), including automated segmentation and parcellation (Dale et al., 1999; Fischl et al., 2002). A visual quality control of all the reconstructed images was performed to exclude images with artefacts.
Using a previously described pipeline (Rokicki et al., 2021), individual CBF maps were co‐registered to the reconstructed T1‐weighted structural volumes using bbregister (Greve & Fischl, 2009). Individual Freesurfer‐derived cortical and subcortical anatomical regions of interest (ROIs) were used to extract mean CBF from the accumbens area, amygdala, caudate, cerebellum cortex, hippocampus, pallidum, putamen, and thalamus, in addition to the cortical lobes (occipital, frontal, temporal, parietal, cingulate, and insula). Due to lack of previous studies on the association between everyday activities and CBF, we remain agnostic about the specific areas involved, and performed analysis including CBF in multiple cortical and subcortical regions. To decrease the number of comparisons, mean bilateral CBF for each ROI was included in the further analysis. As a measure of reliability, we calculated the intra‐class correlation (ICC) using 2‐way mixed effects model with absolute agreement definition (Koo & Li, 2016) for each regional CBF measure based on the participants with longitudinal CBF data (n = 86).
2.6. Activity decomposition
Prior studies have suggested that FAI captures three underlying dimensions: domestic, work/leisure, and outdoor activities (Bond et al., 1992; Cockburn et al., 1990). Accordingly, we performed an exploratory factor analysis based on polychoric correlation to reduce the amount of data for further analysis. Due to low variability, the items “Walking outside for >15 min”, “Driving car/going on bus”, “Local shopping” and “Washing up after meals” were excluded from further analysis. The items “Gainful work” and “Actively pursuing hobby” were dichotomized to “yes” or “no” and “never to less than weekly” or “at least weekly”, respectively, and excluded from the factor analysis. Three additional items were also excluded from the factor analysis due to low correlation with the rest of the items (“Gardening”), and a factor loading of <0.5 (“Reading books” and “Household maintenance”). The correlation structure among the remaining six items confirmed commonalities (Figure S1). Principal axis factor analysis was conducted with orthogonal rotation (oblimin). Two factors were considered, as suggested by parallel analysis. Factor 1, named “Domestic work” comprised four items explaining 50% of the variance with factor loadings from 0.74 to 0.89, and factor 2, named “Social activities” comprised two items explaining 13% of the variance with factor loadings from 0.56 to 0.79 (see Table S1 for additional information).
2.7. Statistical analysis
Statistical analyses were performed using R, version 3.6.2 (R Core Team, 2019). For descriptive purposes, steps per day, including number of steps taken at different intensities (low and moderate‐to‐vigorous), and body mass index (BMI) are reported. Correlations between the activity measures, the CBF measures, and age were analyzed using Kendall τ or Pearson's r, as appropriate. Estimated yearly change in regional CBF were calculated as ([CBF timepoint 2‐CBF timepoint 1]/days between scanning)*365.
We addressed the main hypotheses of associations between baseline and follow‐up CBF and various activity measures using Bayesian multilevel linear models using Stan (Stan Development Team, 2020) and the brms packages in R (Bürkner, 2017). The association between baseline CBF and activity level was assessed by applying the CBF measures as dependent variables with each measure of activity level independently used together with age and sex as independent variables (CBF ~ activity level + age + sex), due to previous studies suggesting an association with CBF (Alisch et al., 2021). Since several models revealed moderate to strong evidence of an association between sex and CBF, explorative analyses were completed including an interaction term between sex and activity measures (CBF ~ activity level × sex + age). The item “hobby” was excluded from this analysis due to too low variability to analyze by sex (see Figure 2). Analyzing the association between CBF and FAI data, one case was considered an outlier (Cook's distance greater than three times the mean), and removed from further baseline analysis concerning FAI. Analyzing the interaction effect of sex on the association between baseline MVPA and CBF suggested evidence of an interaction effect mainly driven by six females, all considered outliers with MVPA‐level of more than two standard deviations above mean (approximately 1 h MVPA daily). No males reported this high level of average daily minutes of MVPA. Regression diagnostics for influential cases suggested a Cook's distance greater than three times the mean, on multiple of the baseline analysis including MVPA, for five of the six cases. As a consequence, and to promote generalizability, the six cases were removed from baseline analysis considering MVPA (Figure S2).
FIGURE 2.
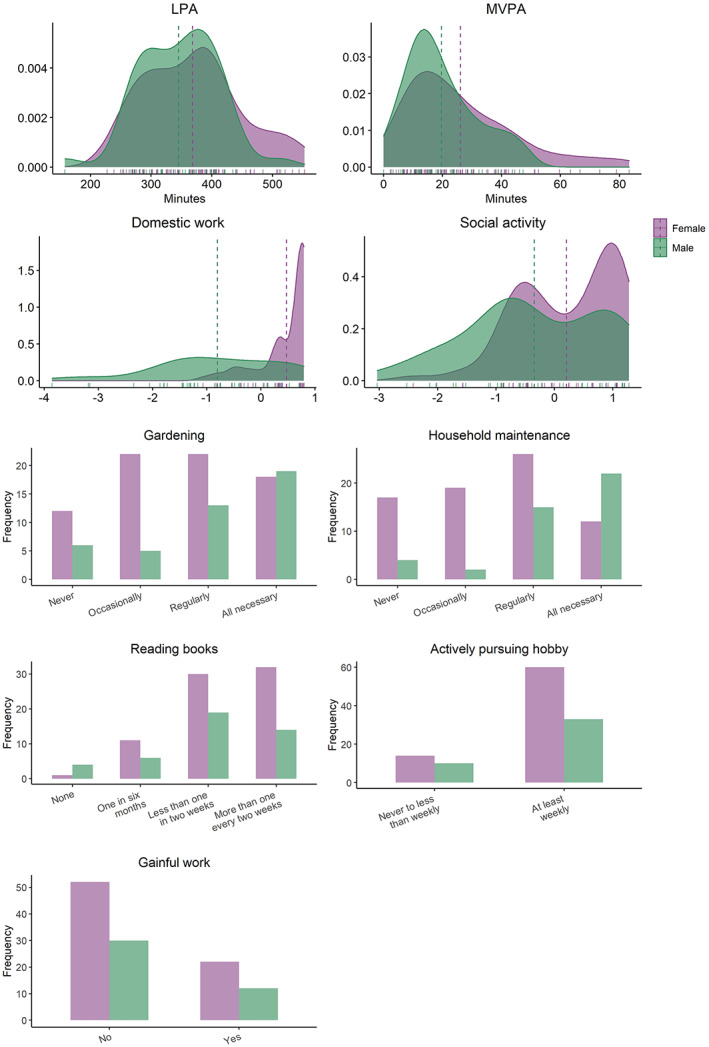
Distribution of baseline activity measures (N = 118) split by sex. Density plot with vertical lines depict mean values for each sex. LPA: Average daily minutes with low intensity physical activity (<100 steps per minute), MVPA: Average daily minutes with moderate to vigorous intensity physical activity (≥100 steps/min).
Using Bayesian mixed effects modelling, we assessed the hypothesis that higher activity score at baseline was associated with less decline in CBF between the two assessments. Data from the two timepoints of each CBF region was used as dependent variables in the models, and separate models were run for each activity measure. Random intercepts for each subject were entered into the models as random effects (CBF ~ activity measure × timepoint + age + sex + [1|subject]). Prior probability distributions were set to zero with a standard deviation of 0.5 for all parameters. All continuous variables in the models were scaled to have a mean of zero, and a standard deviation of one, prior to running the analysis. Due to low variability in the 86 participants completing the follow‐up scan, the item “hobby” was not included in the longitudinal analysis (16 participants scoring 0 = “never to less than weekly”, and 70 participants scoring 1 = “at least weekly”). Results were presented with mean estimated coefficient, 95% credible interval using highest density interval (HDI) method, and Bayes Factor (BF). BF was calculated as evidence for the null or alternative hypothesis with the use of Savage‐Dickey method (Wagenmakers et al., 2010). For a full overview of the evidence categories, see Figure S3. Briefly, BF >1 indicates evidence of the null hypothesis, BF <1 indicates evidence of the alternative hypothesis, and BF = 1 indicates no evidence in any directions.
3. RESULTS
3.1. Sample characteristics
Table 1 and Figure 1 summarize sample characteristics, Figure 2 shows distributions of the baseline activity measures, and Figure 3 shows the pairwise correlation matrix among the activity and CBF measures, respectively, as well as age and BMI. At baseline, 48% were considered active according to physical activity definitions of 150 min of MVPA per week (World Health Organization, 2020), here pragmatically operationalized as >20 min per day. The participants completed on average 12,084 (SD = 3643) steps per day, of which an average of 78% were defined as low‐intensity and 22% moderate‐to‐vigorous intensity steps. Participants were on average active for 384 min (SD = 79) per day, including 94% in the low‐intensity range and 6% in the moderate‐to‐high intensity range. Domestic work, social activities, maintenance, and different leisure activities were reported as regular activities. 71% of the participants were not working, and 21% were pursuing leisure activities and hobbies less than weekly. In general, the associations between the different activities, including BMI, were low, with exception of gardening and maintenance (τ = 0.44, p < .001), and domestic work and social activity (τ = 0.34, p < .001).
TABLE 1.
Demographics and clinical characteristics.
| Characteristic | All | Females | Males |
|---|---|---|---|
| Baseline (N = 118) | |||
| Age (years) [mean (± SD)] | 71.1 (4.3) | 70.2 (3.7) | 72.7 (4.7) |
| n (%) | 118 | 74 (62.7) | 44 (37.3) |
| Education (years) [mean (± SD)] | 15.8 (3.4) | 15.5 (3.2) | 16.3 (3.8) |
| MMSE [mean (± SD)] | 28.8 (1.4) | 28.6 (1.5) | 29.1 (1.0) |
| BMI [mean (± SD)] | 25.0 (3.4) | 24.8 (3.7) | 25.4 (2.9) |
| Meeting physical activity guidelines a [n (%)] | |||
| 20 min of moderate‐ to‐ vigorous activity/day | 57 (48.3) | 40 (54.1) | 17 (38.6) |
| Physical activity metrics | |||
| Duration (minutes) | |||
| LPA [mean (± SD)] | 360 (75) | 369 (79) | 345 (65) |
| MVPA [median (IQR)] | 19 (19) | 21 (25) | 16 (14) |
| Amount (steps/day) | |||
| Total steps/day [mean (± SD)] | 12,084 (3643) | 12,439 (3706) | 11,486 (3493) |
| LPA [mean (± SD)] | 9408 (2726) | 9457 (2727) | 9325 (2754) |
| MVPA [median (IQR)] | 2145 (2248) | 2318 (2828) | 1851 (1533) |
| Daily activity level (FAI) | |||
| Domestic work, FS [median (IQR)] | 0.4 (1.3) | 0.5 (0.5) | −0.8 (1.6) |
| Social activity, FS [median (IQR)] | 0.04 (1.7) | 0.2 (1.5) | −0.5 (1.7) |
| Gardening [median (IQR)] | 2.0 (2.0) | 2.0 (1.0) | 2.0 (1.5) |
| Maintenance [median (IQR)] | 2.0 (2.0) | 2.0 (1.0) | 3 (1.0) |
| Reading [median (IQR)] | 2.0 (1.0) | 2.0 (1.0) | 2.0 (1.0) |
| Hobby < weekly [n (%)] | 24.0 (21.4) | 14.0 (19.0) | 10.0 (22.7) |
| Not working [n (%)] | 82.0 (70.7) | 52.0 (70.3) | 30.0 (71.4) |
| Follow‐up (n = 86) | |||
| Age (years) [mean (± SD)] | 72.8 (4.6) | 71.6 (3.9) | 75.0 (5.1) |
| n (%) | 86 | 55 (64.0) | 31 (36.0) |
Note: LPA, Low intensity physical activity, defined as walking at <100 steps/min. MVPA, Moderate‐to‐vigorous physical activity, defined as walking at ≥100 steps/min. FAI, Frenchay Activities Index. MMSE, Mini Mental State Examination. BMI, Body Mass Index. FS, factor score.
Minimum 150 min/week/average 20 min/day, with MVPA.
FIGURE 1.

Age distribution for all participants and all available data where purple points denote a scan acquisition included in the analysis at baseline (N = 118) and green points denote age at follow‐up (n = 86). Two scans of the same participant are denoted by the line connecting the dots. The participants are sorted by age at baseline and the y‐axis represents the individual participants.
FIGURE 3.
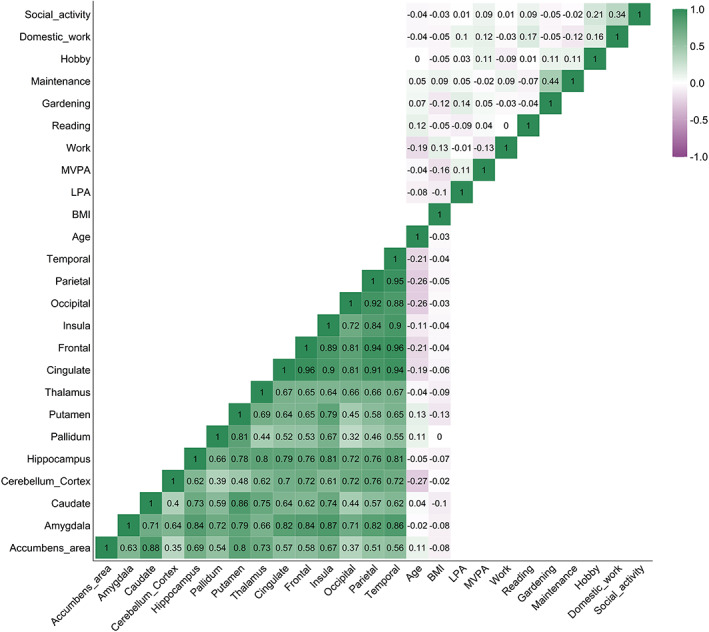
Correlation matrix of baseline activity measures (Kendall τ), regional cerebral blood flow (Pearson's r), BMI, and age. BMI, body mass index; LPA, average daily minutes with low intensity physical activity (<100 steps per minute); MVPA, average daily minutes with moderate to vigorous intensity physical activity (≥100 steps/min).
There were several strong positive associations among the baseline regional CBF measures, and moderate negative associations between age and cortical lobe CBF and cerebellar cortical CBF, while the remaining associations, including between CBF and BMI, were small.
Table 2 summarizes descriptive data on CBF, Figure 4 presents plots of mean regional CBF for the two timepoints and association between estimated yearly change in CBF and age, and Figure S4 shows the pairwise correlation matrix on estimated yearly change in CBF. For the 86 participants with both baseline and longitudinal CBF, mean (min‐max) ICC for all the CBF measures was 0.50 (0.35–0.59), indicating moderate reliability between the two timepoints. Median estimated yearly change in CBF ranged between −0.2 (SD = 5.5) mL/100 g/min for caudate to −1.4 (SD = 7.0) mL/100 g/min for cerebellum cortex. Estimated yearly change for CBF accumbens was negatively correlated with age (τ = −0.17, p = .019), indicating larger reduction in CBF among the oldest participants. For the remaining ROIs, the associations between annual CBF change and age were low. Inter‐regional correlations between estimated yearly change in CBF ranged from r = 0.20 (CBF pallidum and occipital lobe) to r = 0.94 (CBF cingulate and frontal lobe).
TABLE 2.
Descriptive data on CBF.
| Correlation between age and baseline CBF (r [p]) | EYC in CBF (median [IQR]) | Correlation between age and EYC CBF (τ [p]) | Main effect of time on CBF (β/HDI/BF) a | ICC (CI/F/p) | |
|---|---|---|---|---|---|
| Accumbens area | 0.11 (.222) | −1.0 (7.0) | −0.17 (.019)* | −0.03/−0.28, 0.21/7.73 | 0.35 (0.15, 0.53/2.08/< .001*) |
| Amygdala | −0.02 (.794) | −0.5 (4.6) | −0.04 (.591) | −0.08/−0.3, 0.13/6.94 | 0.51 (0.33, 0.65/3.07/< .001*) |
| Caudate | 0.04 (.641) | −0.2 (5.5) | −0.10 (.184) | 0.0/−0.23, 0.23/8.72 | 0.45 (0.27, 0.61/2.64/< .001*) |
| Cerebellum cortex | −0.27 (.003)* | −1.4 (7.0) | −0.06 (.438) | −0.14/−0.36, 0.06/3.82 | 0.53 (0.36, 0.67/3.27/< .001*) |
| Hippocampus | −0.05 (.588) | −0.4 (5.8) | −0.13 (.085) | −0.07/−0.29, 0.15/7.42 | 0.47 (0.29, 0.62/2.79/< .001*) |
| Pallidum | 0.11 (.251) | −0.2 (5.3) | −0.05 (.536) | −0.03/−0.23, 0.19/9.26 | 0.52 (0.35, 0.66/3.17/< .001*) |
| Putamen | 0.13 (.170) | −0.2 (5.3) | −0.14 (.059) | 0.04/−0.16, 0.25/8.60 | 0.54 (0.37, 0.68/3.34/ < .001*) |
| Thalamus | −0.04 (.631) | −0.6 (6.5) | −0.13 (.066) | −0.17/−0.4, 0.08/2.99 | 0.40 (0.21, 0.56/2.36/< .001*) |
| Cingulate | −0.19 (.036)* | −1.2 (5.6) | −0.11 (.123) | −0.08/−0.30, 0.15/6.88 | 0.46 (0.27, 0.61/2.67/< .001*) |
| Frontal lobe | −0.21 (.020)* | −0.6 (5.7) | −0.08 (.251) | −0.09/−0.30, 0.13/6.49 | 0.47/0.29, 0.62/2.79/< .001*) |
| Insula | −0.11 (.235) | −1.1 (5.0) | −0.04 (.541) | −0.05/−0.27, 0.16/8.36 | 0.50 (0.32, 0.64/2.97/< .001*) |
| Occipital lobe | −0.26 (.005)* | −1.7 (5.7) | −0.10 (.161) | −0.20/−0.39, −0.01/1.38 | 0.58 (0.42, 0.70/3.86/< .001*) |
| Parietal lobe | −0.26 (.005)* | −1.1 (6.5) | −0.10 (.175) | −0.12/−0.32, 0.07/4.71 | 0.59 (0.43, 0.71/3.85/< .001*) |
| Temporal lobe | −0.21 (.021)* | −1.2 (5.3) | −0.07 (.318) | −0.11/−0.31, 0.09/5.33 | 0.57 (0.41, 0.70/3.70/< .001*) |
Note: *p < .05.
Abbreviations: BF, Bayes factor; CI, confidence interval; EYC, estimated yearly change; F, F‐test; HDI, highest density interval; ICC, intraclass correlation coefficient; IQR, inter quartile range; β, estimate.
Bayes mixed effect model: CBF ~ Age + Sex + (1|Subject).
FIGURE 4.
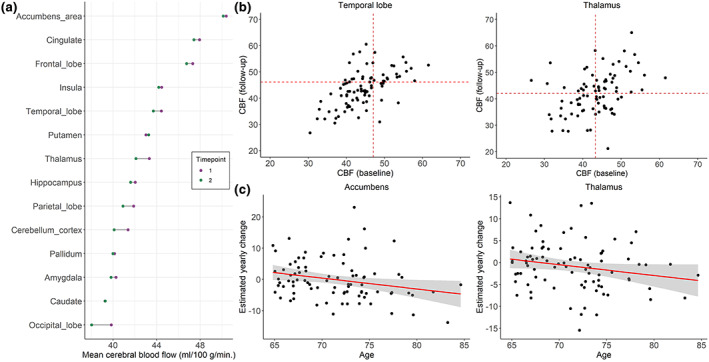
(a) Mean cerebral blood flow (CBF) from the longitudinal sample (n = 86) where purple points denote mean CBF at baseline and green points denote mean CBF at follow‐up. Two scans of the same structure are denoted by connecting line. (b) Scatter plots of CBF from the longitudinal sample (n = 86) at baseline and follow‐up for temporal lobe and thalamus, (c) and examples of association with fit line between estimated yearly change (EYC) in CBF and age at baseline (n = 86).
3.2. Associations between CBF and frequency of activities
Figure 5 summarizes mean parameter estimates and credible intervals for the associations between baseline CBF and activity level. Figure S5 presents evidence ratios for the same associations, and Table S3 presents summary statistics. The analysis revealed multiple associations between both physical activity level and participation in specific daily activities with CBF in various areas. Anecdotal evidence was suggested for positive associations between LPA and accumbens CBF (β = 0.18, HDI = −0.01, 0.35, BF = 0.94), LPA and cingulate CBF (β = 0.19, HDI = 0.02, 0.36, BF = 0.61), and between LPA and putamen CBF (β = 0.20, HDI = 0.03, 0.38, BF = 0.45). Moderate evidence was suggested for positive associations between LPA and insula CBF (β = 0.23, HDI = 0.05, 0.41, BF = 0.21), and between LPA and pallidum CBF (β = 0.24, HDI = 0.06, 0.41, BF = 0.17). Moderate evidence also supported a positive association between MVPA and accumbens CBF (β = 0.24, HDI = 0.06, 0.42, BF = 0.18). Furthermore, anecdotal evidence was suggested for positive associations between social activities and parietal CBF (β = 0.17, HDI = −0.01, 0.34, BF = 0.79), social activities and temporal CBF (β = 0.17, HDI = 0.00, 0.35, BF = 0.91), and reading and thalamic CBF (β = 0.25, HDI = 0.04, 0.47, BF = 0.36). Anecdotal evidence was also suggested for negative associations between work and accumbens CBF (β = −0.35, HDI = −0.73, 0.02, BF = 0.50), maintenance and amygdala CBF (β = −0.19, HDI = −0.37, −0.01, BF = 0.70), and maintenance and putamen CBF (β = −0.20, HDI = −0.38, −0.03, BF = 0.46). In addition, analysis revealed moderate evidence for a negative association between maintenance and thalamic CBF (β = −0.25, HDI = −0.42, −0.08, BF = 0.13). Figure 6 shows scatter plots of the models with evidence suggesting an association between CBF and activity level.
FIGURE 5.
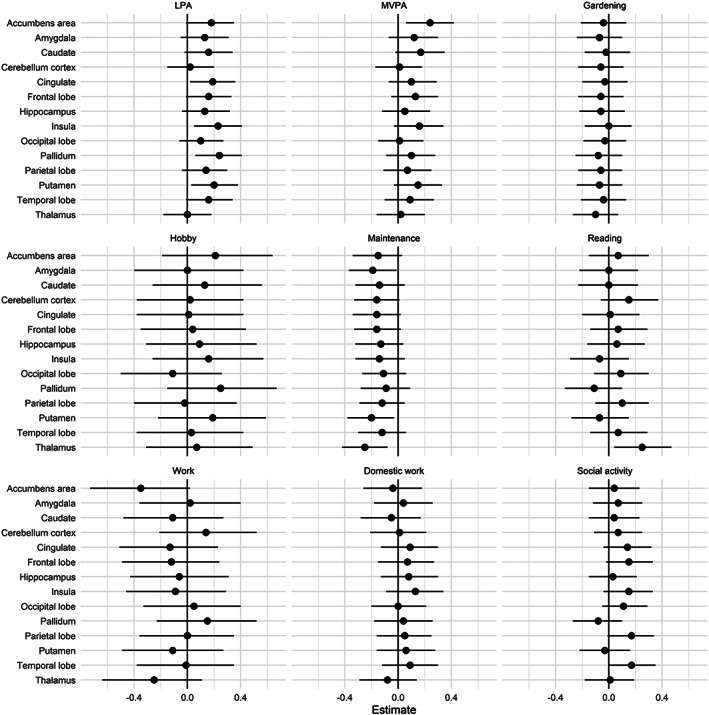
Parameter estimates for the association between baseline CBF and measures of activity level with 95% credible interval. LPA, average daily minutes with low intensity physical activity (<100 steps per minute); MVPA, average daily minutes with moderate to vigorous intensity physical activity (≥100 steps/min).
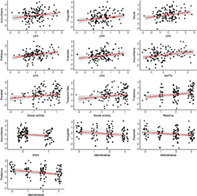
FIGURE 6.
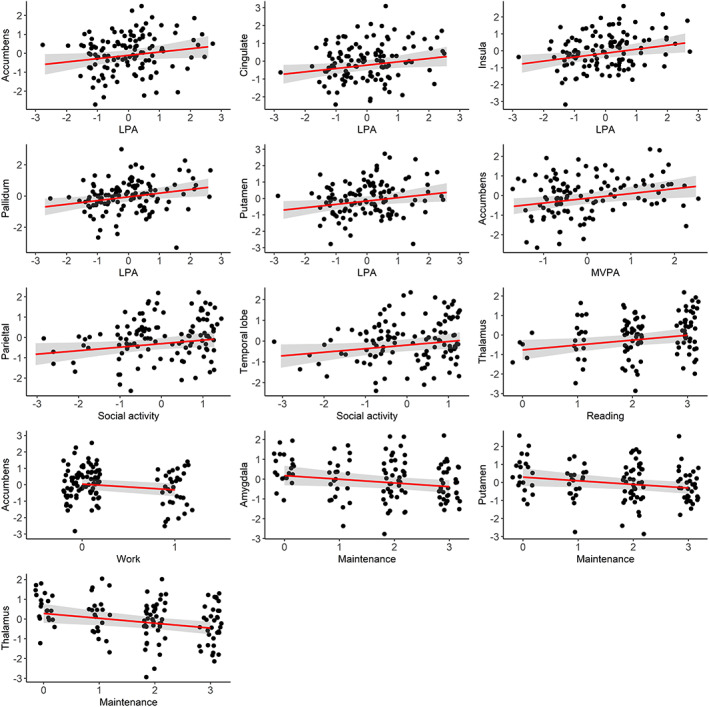
Associations between regional CBF and activity level. Points represent observed data. Regression lines represent estimated slopes and grey band represents 95% credible interval (uncertainty). The numeric data has been scaled before analysis. LPA, average daily minutes with low intensity physical activity (<100 steps per minute); MVPA, average daily minutes with moderate to vigorous physical activity (≥100 steps/minute).
Moderate to strong evidence of a main effect of sex on CBF were found across several models, with higher CBF among females compared to males (Table S4). Secondary analyses suggested anecdotal evidence of an interaction effect between sex and frequency of gardening for occipital CBF (β = −0.22, HDI = −0.48, 0.06, BF = 0.92). For all other analysis, there were no evidence of an interaction effect between sex and activity measures on regional CBF (Figures S6 and S7, Table S5). When including the interaction between sex and activity measures, anecdotal evidence was suggested for positive associations between social activity and cingulate CBF (β = 0.26, HDI = 0.01, 0.51, BF = 0.49), and social activity and frontal CBF (β = 0.25, HDI = 0.01, 0.50, BF = 0.50), in addition to several of the same associations as in the main analysis (Table S6).
3.3. Interaction effects between time and frequency of activities on CBF
Figure 7 summarizes parameter estimates and corresponding credible intervals for the associations between longitudinal changes in CBF and activity level. For evidence ratios and summary statistics, please refer to Figures S8 and S9 and Tables S7 and S8. Anecdotal evidence supported an interaction with time and gardening on occipital CBF (β = −0.20, HDI = −0.38, −0.04, BF = 0.36) and parietal CBF (β = −0.18, HDI = −0.34, 0.0, BF = 0.75), and with time and reading on pallidum CBF (β = −0.19, HDI = −0.39, 0.01, BF = 0.89).
FIGURE 7.
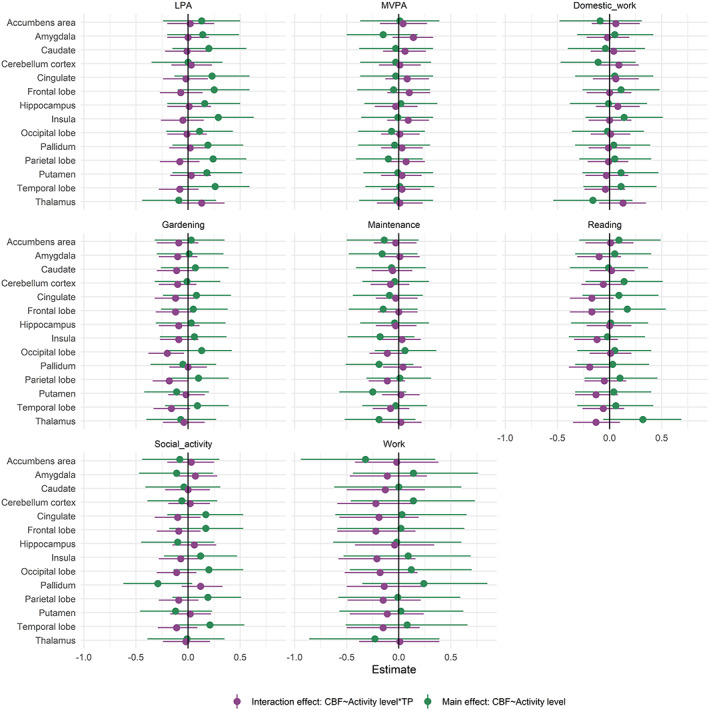
Parameter estimates reflecting the interaction effect between timepoint and frequency of activities on CBF (purple) and the association between regional CBF and activity level (green) with 95% credible interval. Model: CBF ~ activity measure × timepoint + age + sex + (1|subject). LPA, average daily minutes with low intensity physical activity (<100 steps per minute); MVPA, average daily minutes with moderate to vigorous intensity physical activity (≥100 steps/min).
When including an interaction term between timepoint and activity level, anecdotal evidence supported positive associations across time points between LPA and frontal CBF (β = 0.25, HDI = −0.1, 0.59, BF = 0.99), LPA and insula CBF (β = 0.29, HDI = −0.06, 0.63, BF = 0.74), and between LPA and temporal CBF (β = 0.26, HDI = −0.07, 0.59, BF = 0.94). In addition, anecdotal evidence supported a positive association across time points between reading and thalamic CBF (β = 0.32, HDI = −0.06, 0.69, BF = 0.67). Anecdotal evidence supported negative associations across time points between work and accumbens CBF (β = −0.32, HDI = −0.94, 0.35, BF = 0.96), pallidum CBF and social participation (β = −0.29, HDI = −0.62, 0.04, BF = 0.76), and putamen CBF and maintenance (β = −0.25, HDI = −0.57, 0.07, BF = 0.96).
4. DISCUSSION
Intact cerebrovascular function is an important constituent of healthy cognitive and brain aging. Identifying correlates and putative modifiers of age‐related changes in cerebral blood flow before the emergence of incipient clinical decline may inform public health advice and clinical practice. The present study is one of the first studies of the association between both level of physical activity and frequency of everyday activities and cortical and subcortical CBF in older adults, including both cross‐sectional and longitudinal assessments. The main findings from the Bayesian analyses supported that more physical activity, particular LPA, and higher frequency of everyday activities, particular social participation, are associated with higher CBF in multiple cortical and subcortical regions in an aging population. Anecdotal evidence also supported associations between baseline everyday activities, including gardening and reading, and longitudinal change in CBF in specific regions.
Prior studies examining the importance of cortical and subcortical CBF for maintaining cognitive functions in aging have showed higher CBF in multiple regions in younger compared to older healthy individuals (Chen et al., 2011; Stoquart‐ElSankari et al., 2007; Zhang et al., 2017). Lower CBF is a risk factor for age‐related neurocognitive disorders including dementia (de la Torre, 2012), and protecting the brain against age‐related changes in CBF is beneficial for future cognitive functioning and outcome. In the present study, we show that more time spent on LPA is associated with higher CBF in the accumbens, putamen, and pallidum. These basal ganglia regions are all vulnerable to the adverse effects of small vessel disease (Pantoni, 2010), which is associated with age‐related cognitive impairments, dementia and stroke (Shibuya et al., 2017). The current results also show that more time spent in LPA is associated with cortical CBF including insula and cingulate regions, both shown to be sensitive to age‐related changes (Chen et al., 2011). The results expand prior cross‐sectional work reporting associations between objectively measured low intensity physical activity and CBF in frontal regions among 52 cognitive healthy older adults (Zlatar et al., 2019). While causal interpretations should be made with caution, these cross‐sectional findings collectively support the assumption that higher level of low intensive physical activity, may counteract age‐related neurovascular changes.
Previous intervention studies have reported associations between exercise and regional CBF (Chapman et al., 2013; Kleinloog et al., 2019). The results of the current study showed moderate evidence supporting an association between more time spent in MVPA and accumbens CBF. In sum, the positive associations between both low and moderate‐to‐intensive physical activity and CBF in vulnerable structures, corroborate previous converging evidence suggesting cognitive and other health‐related benefits of maintaining physical activity throughout adulthood, including higher quality of life, physical and cognitive function, fewer depressive symptoms (Buchman et al., 2019; Stubbs et al., 2017; Varma et al., 2014), and also increased functional connectivity in higher‐level cognitive brain networks, independent of post‐mortem brain pathology and intensity of the daily activity (Voss et al., 2010).
The positive association between time spent on both LPA and MVPA with CBF may be explained by different mechanisms, but studies are scarce, and mostly comprise animal studies and exercise or MVPA (Davenport et al., 2012; Zimmerman et al., 2014). Both intensities of daily physical activity can be considered among activities that accumulate daily energy expenditure and maintain a certain muscular strength. Physical activity of different intensities have also been shown as a candidate to prevent the development of frailty (Oliveira et al., 2020), which is an increasingly recognized risk factor for adverse brain health outcomes in older adults (Gallucci et al., 2022). Based on this, it can be expected that some of the same mechanisms explaining the positive effect of exercise/MVPA on CBF may also apply for LPA. It has been shown that increased blood flow in response to physical exercise increases vascular shear stress, which in turn might lead to an upregulation of endothelial nitric oxide (NO) synthase expression, important for NO dependent vasodilation, and further an increase in basal CBF (Endres et al., 2003). Age‐related reduction in CBF may also directly influence energy and metabolic supply by hindering important nutrients to reach areas with metabolic demands, and contribute to neurodegenerative changes (Davenport et al., 2012). Furthermore, an upregulation of CBF may have a neuroprotective effect. Multiple neurotropic factors have been suggested upregulated with exercise, contributing to both angiogenesis and neurogenesis, and includes vascular endothelial growth factor (VEGF), insulin‐like growth factor 1 (IGF‐1) and brain‐derived neurotrophic factor (BDNF), with potential neuroprotective effect and contributors to neurogenesis (Bjørnebekk et al., 2005; Cotman et al., 2007). Animal studies have provided knowledge on the effect of physical exercise on both neurogenesis (van Praag et al., 1999; Voss et al., 2013) and angiogenesis (Davenport et al., 2012; Swain et al., 2003). However, the molecular mechanisms are still uncertain. A recent animal study revealed an upregulation of 68 proteins in blood plasma levels in response to a running intervention compared to sedentary controls, and suggested that the effect of increasing neurogenesis in the hippocampus in relation to exercise is particularly supported by the release of antioxidant selenium transport protein (Leiter et al., 2022). Increase in oxidative stress and endothelial dysfunction in older adults has been suggested to reduce cerebrovascular reactivity to hypercapnia, with increase in antioxidants as an important contributor protecting the vasculature from damage (Davenport et al., 2012).
Animal studies demonstrating neuroprotective effects of a running intervention found similar results when the mice were exposed to an enriched living standard, including social participation, opportunities for learning, larger environments and in general more physical activity (van Praag et al., 1999), indicating overall positive effects of an enriched physical and social environment on the brain. The current analysis corroborated this, revealing anecdotal evidence of a positive association between social participation and cortical CBF in parietal, temporal, frontal, and cingulate regions, which are all sensitive to age‐related changes in CBF (Chen et al., 2011). More social activities have been associated with more cognitive challenges and physical movement (Wang et al., 2013), possibly explaining the current results. Supporting the relevance of enriched intellectual activities, our analysis revealed anecdotal evidence for an association between reading and CBF in the thalamus, which has been shown to be vulnerable to the adverse effects of small vessel disease (Pantoni, 2010). With more cognitive demanding activities, including social activities and reading, there would potentially be higher demand on both neural processing, synaptic organization, and efficient and plastic neurological processes (Park & Bischof, 2013). As reviewed above, it is possible that neurogenesis increases the metabolic requirements and potentially promotes angiogenesis (Davenport et al., 2012; Swain et al., 2003), explaining the current cross‐sectional associations between CBF and engaging in more cognitively demanding activities. The results of the current study, indicating that more regular participation in easily accessible activities is associated with higher CBF in vulnerable regions, are encouraging. However, there were also multiple activities with no association with CBF. A previous longitudinal study demonstrated that while the use of computer for >1 hour daily was associated with better cognitive function with advancing age, watching television was not (Kesse‐Guyot et al., 2012). This is consistent with our findings, indicating that some everyday activities may indicate or be beneficial for brain health in older adults, but not necessarily all types of activity. The current results also support an association between higher frequency of maintenance and work with lower CBF in multiple subcortical regions. While the participation in home maintenance was higher for male than female participants, the analysis revealed no interaction effect with sex, suggesting similar associations among females and males. It is possible that participants spending more time on work or maintenance work did less of other health promoting behavior. The results highlight the complexity of exploring the health benefits of everyday activity participation and calls for further research.
In addition to our cross‐sectional results supporting the importance of social and cognitive stimulation, our longitudinal analysis revealed anecdotal evidence of an association between baseline frequency of leisure activities such as gardening and reading and rate of change in occipital, parietal and pallidum CBF respectively. The results supported that more gardening and reading at baseline were associated with less change in CBF. Underpinning this, a previous longitudinal study including 1463 participants aged >65 years showed decreased risk of cognitive decline with higher participation in leisure activities across a 2.4 years interval. Higher frequency of physical activity, including gardening, were associated with less decline in memory and language, and more mental activities, including reading, were associated with global cognition, language and executive function (Wang et al., 2013). Our analysis revealed only anecdotal or week evidence of an association between baseline activity level and longitudinal change in cortical or subcortical CBF. With regard to the lack of association between daily physical activity level and rate of change in CBF, this complements the results from a randomized controlled trial, showing little effect of 5‐year physical activity intervention on brain structure (Pani et al., 2021). The participants in the present study can be considered highly active, with an average of >12,000 steps per day as measured using the accelerometer, and with an average of 48% fulfilling the current criteria for adults over the age of 65 of more than 150 min of moderate‐to‐vigorous activity per week (World Health Organization, 2020). None of the included participants were considered sedentary as defined by walking <5000 steps/day (Tudor‐Locke et al., 2013). In addition to the overall high activity level, the relative short follow‐up period might have concealed possible associations, and a longer follow‐up period can also be suggested for future studies.
Several limitations should be considered when interpreting the current findings. The generalizability of the results is influenced by the sample consisting of many active, healthy, well‐educated, older adults. Future studies recruiting a greater span of individuals, including people with cerebrovascular diseases as well as associated comorbidities such as type‐2 diabetes, obesity and ischemic heart disease, might contribute to increasing the generalizability of the findings. While the use of a reliable sensor to measure minutes of daily physical activity (Foster et al., 2005) is eminent at capturing steps, the accelerometer does not capture movements of the upper extremity, known to be an important part in physical activity, or discriminate between individual activity types. Furthermore, potential seasonal variation in physical activity (Aspvik et al., 2018) was not controlled for in the current analysis. By including the FAI, encompassing an array of activities, such as domestic work, gardening, and hobbies, we ensured a wider examination of the concept of everyday activity level. While it is difficult to assess free‐living activity level using a randomized controlled design (Buchman et al., 2019), the current observational study design does not allow for causal inference. Also, with only baseline measure of activity level, the positive associations between CBF and various everyday activities may result both from present activity level and from the accumulated effects across several years or even a lifespan. Intake of alcohol, caffeine, and certain food types may give an acute effect on CBF. However, the long‐term effects are less clear (Clement et al., 2018; Joris et al., 2018). Future studies may be able to integrate detailed measures of risk and health‐related behaviors, such as smoking, alcohol, and drug use, as well as social measures such as loneliness, with activity measures.
5. CONCLUSION
In conclusion, the current study expands the body of literature on the modifiers of the aging brain, providing observational evidence for an association between the frequency of activities, including both LPA, MVPA, social participation, reading, and gardening, and CBF in age‐ and neurovascular disease‐sensitive regions of the brain. In addition to the relevance for prioritizing targets for public health guidelines, our findings contribute to disclose parts of the intricate connection between brain metabolism and everyday activities in aging. The results of the study may point to candidate targets for interventions in future clinical trials.
CONFLICT OF INTEREST STATEMENT
None.
PATIENT CONSENT STATEMENT
Each participant gave written informed consent at enrolment, in agreement with the declaration of Helsinki.
Supporting information
Appendix S1. Supplementary Information.
ACKNOWLEDGMENTS
We are very thankful to those who participated in the StrokeMRI study. The study was funded by the Research Council of Norway [249795, 248238, 276082], the South‐Eastern Norway Regional Health Authority [2014097, 2015044, 2015073, 2018037, 2018076, 2019107, 2020086], the Norwegian ExtraFoundation for Health and Rehabilitation [2015/FO5146], the European Research Council under the European Union's Horizon 2020 research and Innovation program [ERC StG Grant 802998], Sunnaas Rehabilitation Hospital HT, and the Department of Psychology, University of Oslo.
Sanders, A.‐M. , Richard, G. , Kolskår, K. , Ulrichsen, K. M. , Alnæs, D. , Beck, D. , Dørum, E. S. , Engvig, A. , Lund, M. J. , Nordhøy, W. , Pedersen, M. L. , Rokicki, J. , Nordvik, J. E. , & Westlye, L. T. (2023). Associations between everyday activities and arterial spin labeling‐derived cerebral blood flow: A longitudinal study in community‐dwelling elderly volunteers. Human Brain Mapping, 44(8), 3377–3393. 10.1002/hbm.26287
Contributor Information
Anne‐Marthe Sanders, Email: annemms@psykologi.uio.no, Email: anne-marthe.sanders@sunnaas.no.
Lars T. Westlye, Email: l.t.westlye@psykologi.uio.no.
DATA AVAILABILITY STATEMENT
Raw imaging data and sensitive information cannot be openly shared due to privacy issues. Non‐sensitive data can be made available upon reasonable request to the authors.
REFERENCES
- Alisch, J. S. R. , Khattar, N. , Kim, R. W. , Cortina, L. E. , Rejimon, A. C. , Qian, W. , Ferrucci, L. , Resnick, S. M. , Spencer, R. G. , & Bouhrara, M. (2021). Sex and age‐related differences in cerebral blood flow investigated using pseudo‐continuous arterial spin labeling magnetic resonance imaging. Aging, 13(4), 4911–4925. 10.18632/aging.202673 [DOI] [PMC free article] [PubMed] [Google Scholar]
- Aslan, S. , Xu, F. , Wang, P. L. , Uh, J. , Yezhuvath, U. S. , van Osch, M. , & Lu, H. (2010). Estimation of labeling efficiency in pseudocontinuous arterial spin labeling. Magnetic Resonance in Medicine, 63(3), 765–771. 10.1002/mrm.22245 [DOI] [PMC free article] [PubMed] [Google Scholar]
- Aspvik, N. P. , Viken, H. , Ingebrigtsen, J. E. , Zisko, N. , Mehus, I. , Wisløff, U. , & Stensvold, D. (2018). Do weather changes influence physical activity level among older adults? The generation 100 study. PLoS One, 13(7), e0199463. 10.1371/journal.pone.0199463 [DOI] [PMC free article] [PubMed] [Google Scholar]
- Attwell, D. , Buchan, A. M. , Charpak, S. , Lauritzen, M. , Macvicar, B. A. , & Newman, E. A. (2010). Glial and neuronal control of brain blood flow. Nature, 468(7321), 232–243. 10.1038/nature09613 [DOI] [PMC free article] [PubMed] [Google Scholar]
- Bangen, K. J. , Restom, K. , Liu, T. T. , Jak, A. J. , Wierenga, C. E. , Salmon, D. P. , & Bondi, M. W. (2009). Differential age effects on cerebral blood flow and BOLD response to encoding: Associations with cognition and stroke risk. Neurobiology of Aging, 30(8), 1276–1287. 10.1016/j.neurobiolaging.2007.11.012 [DOI] [PMC free article] [PubMed] [Google Scholar]
- Bjørnebekk, A. , Mathé, A. A. , & Brené, S. (2005). The antidepressant effect of running is associated with increased hippocampal cell proliferation. The International Journal of Neuropsychopharmacology, 8(3), 357–368. 10.1017/s1461145705005122 [DOI] [PubMed] [Google Scholar]
- Bond, M. J. , Harris, R. D. , Smith, D. S. , & Clark, M. S. (1992). An examination of the factor structure of the Frenchay activities index. Disability and Rehabilitation, 14(1), 27–29. 10.3109/09638289209166423 [DOI] [PubMed] [Google Scholar]
- Brown, W. R. , & Thore, C. R. (2011). Review: Cerebral microvascular pathology in ageing and neurodegeneration. Neuropathology and Applied Neurobiology, 37(1), 56–74. 10.1111/j.1365-2990.2010.01139.x [DOI] [PMC free article] [PubMed] [Google Scholar]
- Buchman, A. S. , Yu, L. , Wilson, R. S. , Lim, A. , Dawe, R. J. , Gaiteri, C. , Leurgans, S. E. , Schneider, J. A. , Bennett, D. A. , & Bennett, D. A. (2019). Physical activity, common brain pathologies, and cognition in community‐dwelling older adults. Neurology, 92(8), e811–e822. 10.1212/WNL.0000000000006954 [DOI] [PMC free article] [PubMed] [Google Scholar]
- Bürkner, P.‐C. (2017). Brms: An R package for Bayesian multilevel models using Stan. Journal of Statistical Software, 80(1), 1–28. 10.18637/jss.v080.i01 [DOI] [Google Scholar]
- Carpenter, G. I. , Hastie, C. L. , Morris, J. N. , Fries, B. E. , & Ankri, J. (2006). Measuring change in activities of daily living in nursing home residents with moderate to severe cognitive impairment. BMC Geriatrics, 6, 7. 10.1186/1471-2318-6-7 [DOI] [PMC free article] [PubMed] [Google Scholar]
- Chan, D. , Shafto, M. , Kievit, R. , Matthews, F. , Spink, M. , Valenzuela, M. , & Henson, R. N. (2018). Lifestyle activities in mid‐life contribute to cognitive reserve in late‐life, independent of education, occupation, and late‐life activities. Neurobiology of Aging, 70, 180–183. 10.1016/j.neurobiolaging.2018.06.012 [DOI] [PMC free article] [PubMed] [Google Scholar]
- Chapman, S. , Aslan, S. , Spence, J. , DeFina, L. , Keebler, M. , Didehbani, N. , & Lu, H. (2013). Shorter term aerobic exercise improves brain, cognition, and cardiovascular fitness in aging. Frontiers in Aging Neuroscience, 5, 75. 10.3389/fnagi.2013.00075 [DOI] [PMC free article] [PubMed] [Google Scholar]
- Chappell, M. A. , Groves, A. R. , MacIntosh, B. J. , Donahue, M. J. , Jezzard, P. , & Woolrich, M. W. (2011). Partial volume correction of multiple inversion time arterial spin labeling MRI data. Magnetic Resonance in Medicine, 65(4), 1173–1183. 10.1002/mrm.22641 [DOI] [PubMed] [Google Scholar]
- Chappell, M. A. , Groves, A. R. , Whitcher, B. , & Woolrich, M. W. (2009). Variational Bayesian inference for a nonlinear forward model. IEEE Transactions on Signal Processing, 57(1), 223–236. 10.1109/TSP.2008.2005752 [DOI] [Google Scholar]
- Chen, J. J. , Rosas, H. D. , & Salat, D. H. (2011). Age‐associated reductions in cerebral blood flow are independent from regional atrophy. NeuroImage, 55(2), 468–478. 10.1016/j.neuroimage.2010.12.032 [DOI] [PMC free article] [PubMed] [Google Scholar]
- Chiuve, S. E. , Rexrode, K. M. , Spiegelman, D. , Logroscino, G. , Manson, J. E. , & Rimm, E. B. (2008). Primary prevention of stroke by healthy lifestyle. Circulation, 118(9), 947–954. 10.1161/circulationaha.108.781062 [DOI] [PMC free article] [PubMed] [Google Scholar]
- Clement, P. , Mutsaerts, H.‐J. , Václavů, L. , Ghariq, E. , Pizzini, F. B. , Smits, M. , Acou, M. , Jovicich, J. , Vanninen, R. , Kononen, M. , Wiest, R. , Rostrup, E. , Bastos‐Leite, A. J. , Larsson, E.‐M. , & Achten, E. (2018). Variability of physiological brain perfusion in healthy subjects – A systematic review of modifiers. Considerations for multi‐center ASL studies. Journal of Cerebral Blood Flow & Metabolism, 38(9), 1418–1437. 10.1177/0271678x17702156 [DOI] [PMC free article] [PubMed] [Google Scholar]
- Cockburn, J. , Smith, P. T. , & Wade, D. T. (1990). Influence of cognitive function on social, domestic, and leisure activities of community‐dwelling older people. International Disability Studies, 12(4), 169–172. 10.3109/03790799009166611 [DOI] [PubMed] [Google Scholar]
- Cotman, C. W. , Berchtold, N. C. , & Christie, L. A. (2007). Exercise builds brain health: Key roles of growth factor cascades and inflammation. Trends in Neurosciences, 30(9), 464–472. 10.1016/j.tins.2007.06.011 [DOI] [PubMed] [Google Scholar]
- Dale, A. M. , Fischl, B. , & Sereno, M. I. (1999). Cortical surface‐based analysis. I. Segmentation and surface reconstruction. Neuroimage, 9(2), 179–194. 10.1006/nimg.1998.0395 [DOI] [PubMed] [Google Scholar]
- Davenport, M. H. , Hogan, D. B. , Eskes, G. A. , Longman, R. S. , & Poulin, M. J. (2012). Cerebrovascular reserve: The link between fitness and cognitive function? Exercise and Sport Sciences Reviews, 40(3), 153–158. 10.1097/JES.0b013e3182553430 [DOI] [PubMed] [Google Scholar]
- de la Torre, J. C. (2012). Cardiovascular risk factors promote brain hypoperfusion leading to cognitive decline and dementia. Cardiovascular Psychiatry and Neurology, 2012, 367516. 10.1155/2012/367516 [DOI] [PMC free article] [PubMed] [Google Scholar]
- Detre, J. A. , & Alsop, D. C. (1999). Perfusion magnetic resonance imaging with continuous arterial spin labeling: Methods and clinical applications in the central nervous system. European Journal of Radiology, 30(2), 115–124. 10.1016/s0720-048x(99)00050-9 [DOI] [PubMed] [Google Scholar]
- Dougherty, R. J. , Boots, E. A. , Lindheimer, J. B. , Stegner, A. J. , Van Riper, S. , Edwards, D. F. , Gallagher, C. L. , Carlsson, C. M. , Rowley, H. A. , Bendlin, B. B. , Asthana, S. , Hermann, B. P. , Sager, M. A. , Johnson, S. C. , Okonkwo, O. C. , & Cook, D. B. (2020). Fitness, independent of physical activity is associated with cerebral blood flow in adults at risk for Alzheimer's disease. Brain Imaging and Behavior, 14(4), 1154–1163. 10.1007/s11682-019-00068-w [DOI] [PMC free article] [PubMed] [Google Scholar]
- Endres, M. , Gertz, K. , Lindauer, U. , Katchanov, J. , Schultze, J. , Schröck, H. , Nickenig, G. , Kuschinsky, W. , Dirnagl, U. , & Laufs, U. (2003). Mechanisms of stroke protection by physical activity. Annals of Neurology, 54(5), 582–590. 10.1002/ana.10722 [DOI] [PubMed] [Google Scholar]
- Fischl, B. (2012). FreeSurfer. Neuroimage, 62(2), 774–781. 10.1016/j.neuroimage.2012.01.021 [DOI] [PMC free article] [PubMed] [Google Scholar]
- Fischl, B. , Salat, D. H. , Busa, E. , Albert, M. , Dieterich, M. , Haselgrove, C. , van der Kouwe, A. , Killiany, R. , Kennedy, D. , Klaveness, S. , Montillo, A. , Makris, N. , Rosen, B. , & Dale, A. M. (2002). Whole brain segmentation: Automated labeling of neuroanatomical structures in the human brain. Neuron, 33(3), 341–355. 10.1016/s0896-6273(02)00569-x [DOI] [PubMed] [Google Scholar]
- Folstein, M. F. , Folstein, S. E. , & McHugh, P. R. (1975). “Mini‐mental state”: A practical method for grading the cognitive state of patients for the clinician. Journal of Psychiatric Research, 12(3), 189–198. 10.1016/0022-3956(75)90026-6 [DOI] [PubMed] [Google Scholar]
- Forbes, D. , Thiessen, E. J. , Blake, C. M. , Forbes, S. C. , & Forbes, S. (2013). Exercise programs for people with dementia. Cochrane Database Syst Rev, (12), Cd006489. 10.1002/14651858.CD006489.pub3 [DOI] [PubMed] [Google Scholar]
- Foster, R. C. , Lanningham‐Foster, L. M. , Manohar, C. , McCrady, S. K. , Nysse, L. J. , Kaufman, K. R. , Padgett, D. J. , & Levine, J. A. (2005). Precision and accuracy of an ankle‐worn accelerometer‐based pedometer in step counting and energy expenditure. Preventive Medicine, 41(3–4), 778–783. 10.1016/j.ypmed.2005.07.006 [DOI] [PubMed] [Google Scholar]
- Fratiglioni, L. , Paillard‐Borg, S. , & Winblad, B. (2004). An active and socially integrated lifestyle in late life might protect against dementia. Lancet Neurology, 3(6), 343–353. 10.1016/s1474-4422(04)00767-7 [DOI] [PubMed] [Google Scholar]
- Gallucci, M. , Grassi, A. , Focella, L. , Grassivaro, F. , Da Ronch, C. , Gallucci, M. , & Marzetti, E. (2022). Association between the frailty index and vascular brain damage: The Treviso dementia (TREDEM) registry. Experimental Gerontology, 167, 111894. 10.1016/j.exger.2022.111894 [DOI] [PubMed] [Google Scholar]
- Gorelick, P. B. , Scuteri, A. , Black, S. E. , Decarli, C. , Greenberg, S. M. , Iadecola, C. , Launer, L. J. , Laurent, S. , Lopez, O. L. , Nyenhuis, D. , Petersen, R. C. , Schneider, J. A. , Tzourio, C. , Arnett, D. K. , Bennett, D. A. , Chui, H. C. , Higashida, R. T. , Lindquist, R. , Nilsson, P. M. , … Seshadri, S. (2011). Vascular contributions to cognitive impairment and dementia: A statement for healthcare professionals from the american heart association/american stroke association. Stroke, 42(9), 2672–2713. 10.1161/STR.0b013e3182299496 [DOI] [PMC free article] [PubMed] [Google Scholar]
- Gow, A. J. , Pattie, A. , & Deary, I. J. (2017). Lifecourse activity participation from early, mid, and later adulthood as determinants of cognitive aging: The Lothian birth cohort 1921. The Journals of Gerontology. Series B, Psychological Sciences and Social Sciences, 72(1), 25–37. 10.1093/geronb/gbw124 [DOI] [PMC free article] [PubMed] [Google Scholar]
- Greve, D. N. , & Fischl, B. (2009). Accurate and robust brain image alignment using boundary‐based registration. NeuroImage, 48(1), 63–72. 10.1016/j.neuroimage.2009.06.060 [DOI] [PMC free article] [PubMed] [Google Scholar]
- Groves, A. R. , Chappell, M. A. , & Woolrich, M. W. (2009). Combined spatial and non‐spatial prior for inference on MRI time‐series. NeuroImage, 45(3), 795–809. 10.1016/j.neuroimage.2008.12.027 [DOI] [PubMed] [Google Scholar]
- Haeger, A. , Costa, A. S. , Schulz, J. B. , & Reetz, K. (2019). Cerebral changes improved by physical activity during cognitive decline: A systematic review on MRI studies. Neuroimage Clinical, 23, 101933. 10.1016/j.nicl.2019.101933 [DOI] [PMC free article] [PubMed] [Google Scholar]
- Hersi, M. , Irvine, B. , Gupta, P. , Gomes, J. , Birkett, N. , & Krewski, D. (2017). Risk factors associated with the onset and progression of Alzheimer's disease: A systematic review of the evidence. Neurotoxicology, 61, 143–187. 10.1016/j.neuro.2017.03.006 [DOI] [PubMed] [Google Scholar]
- Hillman, C. H. , Erickson, K. I. , & Kramer, A. F. (2008). Be smart, exercise your heart: Exercise effects on brain and cognition. Nature Reviews. Neuroscience, 9(1), 58–65. 10.1038/nrn2298 [DOI] [PubMed] [Google Scholar]
- Holbrook, M. , & Skilbeck, C. E. (1983). An activities index for use with stroke patients. Age and Ageing, 12(2), 166–170. 10.1093/ageing/12.2.166 [DOI] [PubMed] [Google Scholar]
- Holland, A. M. , Martin, J. S. , Mattson, C. D. , Lohse, K. R. , Finn, P. R. , & Stager, J. M. (2017). A cross‐sectional study of physical activity and arterial compliance: The effects of age and artery size. Journal of the American Society of Hypertension, 11(2), 92–100. 10.1016/j.jash.2016.12.005 [DOI] [PubMed] [Google Scholar]
- Imam, B. , & Miller, W. C. (2012). Reliability and validity of scores of a Chinese version of the Frenchay activities index. Archives of Physical Medicine and Rehabilitation, 93(3), 520–526. 10.1016/j.apmr.2011.07.197 [DOI] [PMC free article] [PubMed] [Google Scholar]
- Jaul, E. , & Barron, J. (2017). Age‐related diseases and clinical and public health implications for the 85 years old and over population. Frontiers in Public Health, 5, 335. 10.3389/fpubh.2017.00335 [DOI] [PMC free article] [PubMed] [Google Scholar]
- Jenkinson, M. , Beckmann, C. F. , Behrens, T. E. , Woolrich, M. W. , & Smith, S. M. (2012). FSL. Neuroimage, 62(2), 782–790. 10.1016/j.neuroimage.2011.09.015 [DOI] [PubMed] [Google Scholar]
- Joris, P. J. , Mensink, R. P. , Adam, T. C. , & Liu, T. T. (2018). Cerebral blood flow measurements in adults: A review on the effects of dietary factors and exercise. Nutrients, 10(5), 530. 10.3390/nu10050530 [DOI] [PMC free article] [PubMed] [Google Scholar]
- Kelleher, R. J. , & Soiza, R. L. (2013). Evidence of endothelial dysfunction in the development of Alzheimer's disease: Is Alzheimer's a vascular disorder? American Journal of Cardiovascular Disease, 3(4), 197–226. [PMC free article] [PubMed] [Google Scholar]
- Kesse‐Guyot, E. , Charreire, H. , Andreeva, V. A. , Touvier, M. , Hercberg, S. , Galan, P. , & Oppert, J. M. (2012). Cross‐sectional and longitudinal associations of different sedentary behaviors with cognitive performance in older adults. PLoS One, 7(10), e47831. 10.1371/journal.pone.0047831 [DOI] [PMC free article] [PubMed] [Google Scholar]
- Kleinloog, J. P. D. , Mensink, R. P. , Ivanov, D. , Adam, J. J. , Uludağ, K. , & Joris, P. J. (2019). Aerobic exercise training improves cerebral blood flow and executive function: A randomized, controlled cross‐over trial in sedentary older men. Frontiers in Aging Neuroscience, 11, 333. 10.3389/fnagi.2019.00333 [DOI] [PMC free article] [PubMed] [Google Scholar]
- Koo, T. K. , & Li, M. Y. (2016). A guideline of selecting and reporting intraclass correlation coefficients for reliability research. Journal of Chiropractic Medicine, 15(2), 155–163. 10.1016/j.jcm.2016.02.012 [DOI] [PMC free article] [PubMed] [Google Scholar]
- Kramer, A. F. , & Colcombe, S. (2018). Fitness effects on the cognitive function of older adults: A meta‐analytic study‐revisited. Perspectives on Psychological Science, 13(2), 213–217. 10.1177/1745691617707316 [DOI] [PubMed] [Google Scholar]
- Leiter, O. , Zhuo, Z. , Rust, R. , Wasielewska, J. M. , Grönnert, L. , Kowal, S. , Overall, R. W. , Adusumilli, V. S. , Blackmore, D. G. , Southon, A. , Ganio, K. , McDevitt, C. A. , Rund, N. , Brici, D. , Mudiyan, I. A. , Sykes, A. M. , Rünker, A. E. , Zocher, S. , Ayton, S. , … Walker, T. L. (2022). Selenium mediates exercise‐induced adult neurogenesis and reverses learning deficits induced by hippocampal injury and aging. Cell Metabolism, 34(3), 408–423.e408. 10.1016/j.cmet.2022.01.005 [DOI] [PubMed] [Google Scholar]
- Marshall, S. J. , Levy, S. S. , Tudor‐Locke, C. E. , Kolkhorst, F. W. , Wooten, K. M. , Ji, M. , Macera, C. A. , & Ainsworth, B. E. (2009). Translating physical activity recommendations into a pedometer‐based step goal: 3000 steps in 30 minutes. American Journal of Preventive Medicine, 36(5), 410–415. 10.1016/j.amepre.2009.01.021 [DOI] [PubMed] [Google Scholar]
- McPhail, S. , Lane, P. , Russell, T. , Brauer, S. G. , Urry, S. , Jasiewicz, J. , Condie, P. , & Haines, T. (2009). Telephone reliability of the Frenchay activity index and EQ‐5D amongst older adults. Health and Quality of Life Outcomes, 7, 48. 10.1186/1477-7525-7-48 [DOI] [PMC free article] [PubMed] [Google Scholar]
- Oliveira, J. S. , Pinheiro, M. B. , Fairhall, N. , Walsh, S. , Chesterfield Franks, T. , Kwok, W. , Bauman, A. , & Sherrington, C. (2020). Evidence on physical activity and the prevention of frailty and sarcopenia among older people: A systematic review to inform the World Health Organization physical activity guidelines. Journal of Physical Activity & Health, 17(12), 1247–1258. 10.1123/jpah.2020-0323 [DOI] [PubMed] [Google Scholar]
- Pani, J. , Reitlo, L. S. , Evensmoen, H. R. , Lydersen, S. , Wisløff, U. , Stensvold, D. , & Håberg, A. K. (2021). Effect of 5 years of exercise intervention at different intensities on brain structure in older adults from the general population: A generation 100 substudy. Clinical Interventions in Aging, 16, 1485–1501. 10.2147/cia.S318679 [DOI] [PMC free article] [PubMed] [Google Scholar]
- Pantoni, L. (2010). Cerebral small vessel disease: From pathogenesis and clinical characteristics to therapeutic challenges. Lancet Neurology, 9(7), 689–701. 10.1016/s1474-4422(10)70104-6 [DOI] [PubMed] [Google Scholar]
- Park, D. C. , & Bischof, G. N. (2013). The aging mind: Neuroplasticity in response to cognitive training. Dialogues in Clinical Neuroscience, 15(1), 109–119. 10.31887/DCNS.2013.15.1/dpark [DOI] [PMC free article] [PubMed] [Google Scholar]
- R Core Team . (2019). R: A language and environment for statistical computing. R Foundation for Statistical Computing. https://www.R-project.org/ [Google Scholar]
- Richard, G. , Kolskår, K. , Sanders, A.‐M. , Kaufmann, T. , Petersen, A. , Doan, N. T. , Sánchez, J. M. , Alnæs, D. , Ulrichsen, K. M. , Dørum, E. S. , Andreassen, O. A. , Nordvik, J. E. , & Westlye, L. T. (2018). Assessing distinct patterns of cognitive aging using tissue‐specific brain age prediction based on diffusion tensor imaging and brain morphometry. PeerJ, 6, e5908. 10.7717/peerj.5908 [DOI] [PMC free article] [PubMed] [Google Scholar]
- Rokicki, J. , Wolfers, T. , Nordhøy, W. , Tesli, N. , Quintana, D. S. , Alnaes, D. , Richard, G. , de Lange, A.‐M. G. , Lund, M. J. , Norbom, L. , Agartz, I. , Melle, I. , Naerland, T. , Selbaek, C. , Persson, K. , Nordvik, J. E. , Schwarz, E. , Andreassen, O. A. , Kaufmann, T. , & Westlye, L. T. (2021). Multimodal imaging improves brain age prediction and reveals distinct abnormalities in patients with psychiatric and neurological disorders. Human Brain Mapping, 42(6), 1714–1726. 10.1002/hbm.25323 [DOI] [PMC free article] [PubMed] [Google Scholar]
- Sanders, A. M. , Richard, G. , Kolskår, K. , Ulrichsen, K. M. , Kaufmann, T. , Alnæs, D. , Beck, D. , Dørum, E. S. , de Lange, A.‐M. G. , Nordvik, J. E. , & Westlye, L. T. (2021). Linking objective measures of physical activity and capability with brain structure in healthy community dwelling older adults. Neuroimage Clinical, 31, 102767. 10.1016/j.nicl.2021.102767 [DOI] [PMC free article] [PubMed] [Google Scholar]
- Sarikaya, H. , Ferro, J. , & Arnold, M. (2015). Stroke prevention–medical and lifestyle measures. European Neurology, 73(3–4), 150–157. 10.1159/000367652 [DOI] [PubMed] [Google Scholar]
- Shibuya, M. , Leite, C. D. C. , & Lucato, L. T. (2017). Neuroimaging in cerebral small vessel disease: Update and new concepts. Dement Neuropsychologia, 11(4), 336–342. 10.1590/1980-57642016dn11-040002 [DOI] [PMC free article] [PubMed] [Google Scholar]
- Sokołowski, D. R. , Hansen, T. I. , Rise, H. H. , Reitlo, L. S. , Wisløff, U. , Stensvold, D. , & Håberg, A. K. (2021). 5 years of exercise intervention did not benefit cognition compared to the physical activity guidelines in older adults, but higher cardiorespiratory fitness did. A generation 100 substudy. Frontiers in Aging Neuroscience, 13, 742587. 10.3389/fnagi.2021.742587 [DOI] [PMC free article] [PubMed] [Google Scholar]
- Stan Development Team . (2020). RStan: the R interface to Stan. R package version 2.21.2. http://mc-stan.org/
- Stoquart‐ElSankari, S. , Balédent, O. , Gondry‐Jouet, C. , Makki, M. , Godefroy, O. , & Meyer, M. E. (2007). Aging effects on cerebral blood and cerebrospinal fluid flows. Journal of Cerebral Blood Flow and Metabolism, 27(9), 1563–1572. 10.1038/sj.jcbfm.9600462 [DOI] [PubMed] [Google Scholar]
- Stubbs, B. , Chen, L. J. , Chang, C. Y. , Sun, W. J. , & Ku, P. W. (2017). Accelerometer‐assessed light physical activity is protective of future cognitive ability: A longitudinal study among community dwelling older adults. Experimental Gerontology, 91, 104–109. 10.1016/j.exger.2017.03.003 [DOI] [PubMed] [Google Scholar]
- Sturm, J. W. , Dewey, H. M. , Donnan, G. A. , Macdonell, R. A. , McNeil, J. J. , & Thrift, A. G. (2002). Handicap after stroke: How does it relate to disability, perception of recovery, and stroke subtype?: The north north East Melbourne stroke incidence study (NEMESIS). Stroke, 33(3), 762–768. 10.1161/hs0302.103815 [DOI] [PubMed] [Google Scholar]
- Swain, R. A. , Harris, A. B. , Wiener, E. C. , Dutka, M. V. , Morris, H. D. , Theien, B. E. , Konda, S. , Engberg, K. , Lauterbur, P. C. , & Greenough, W. T. (2003). Prolonged exercise induces angiogenesis and increases cerebral blood volume in primary motor cortex of the rat. Neuroscience, 117(4), 1037–1046. 10.1016/s0306-4522(02)00664-4 [DOI] [PubMed] [Google Scholar]
- Tudor‐Locke, C. , Craig, C. L. , Thyfault, J. P. , & Spence, J. C. (2013). A step‐defined sedentary lifestyle index: <5000 steps/day. Applied Physiology, Nutrition, and Metabolism, 38(2), 100–114. 10.1139/apnm-2012-0235 [DOI] [PubMed] [Google Scholar]
- Turnbull, J. C. , Kersten, P. , Habib, M. , McLellan, L. , Mullee, M. A. , & George, S. (2000). Validation of the Frenchay activities index in a general population aged 16 years and older. Archives of Physical Medicine and Rehabilitation, 81(8), 1034–1038. 10.1053/apmr.2000.7162 [DOI] [PubMed] [Google Scholar]
- van der Kleij, L. A. , Petersen, E. T. , Siebner, H. R. , Hendrikse, J. , Frederiksen, K. S. , Sobol, N. A. , Konda, S. , Engberg, K. , Lauterbur, P. C. , & Garde, E. (2018). The effect of physical exercise on cerebral blood flow in Alzheimer's disease. Neuroimage Clinical, 20, 650–654. 10.1016/j.nicl.2018.09.003 [DOI] [PMC free article] [PubMed] [Google Scholar]
- van Praag, H. , Kempermann, G. , & Gage, F. H. (1999). Running increases cell proliferation and neurogenesis in the adult mouse dentate gyrus. Nature Neuroscience, 2(3), 266–270. 10.1038/6368 [DOI] [PubMed] [Google Scholar]
- Varma, V. R. , Tan, E. J. , Wang, T. , Xue, Q. L. , Fried, L. P. , Seplaki, C. L. , King, A. C. , Seeman, T. E. , Rebok, G. W. , & Carlson, M. C. (2014). Low‐intensity walking activity is associated with better health. Journal of Applied Gerontology, 33(7), 870–887. 10.1177/0733464813512896 [DOI] [PMC free article] [PubMed] [Google Scholar]
- Voss, M. W. , Prakash, R. S. , Erickson, K. I. , Basak, C. , Chaddock, L. , Kim, J. S. , Alves, H. , Heo, S. , Szabo, A. N. , White, S. M. , Wójcicki, T. R. , Mailey, E. L. , Gothe, N. , Olson, E. A. , McAuley, E. , & White, S. M. (2010). Plasticity of brain networks in a randomized intervention trial of exercise training in older adults. Frontiers in Aging Neuroscience, 2, 32. 10.3389/fnagi.2010.00032 [DOI] [PMC free article] [PubMed] [Google Scholar]
- Voss, M. W. , Vivar, C. , Kramer, A. F. , & van Praag, H. (2013). Bridging animal and human models of exercise‐induced brain plasticity. Trends in Cognitive Sciences, 17(10), 525–544. 10.1016/j.tics.2013.08.001 [DOI] [PMC free article] [PubMed] [Google Scholar]
- Wagenmakers, E. J. , Lodewyckx, T. , Kuriyal, H. , & Grasman, R. (2010). Bayesian hypothesis testing for psychologists: A tutorial on the savage‐dickey method. Cognitive Psychology, 60(3), 158–189. 10.1016/j.cogpsych.2009.12.001 [DOI] [PubMed] [Google Scholar]
- Wang, H. X. , Jin, Y. , Hendrie, H. C. , Liang, C. , Yang, L. , Cheng, Y. , Unverzagt, F. W. , Ma, F. , Hall, K. S. , Murrell, J. R. , Li, P. , Bian, J. , Pei, J.‐J. , & Gao, S. (2013). Late life leisure activities and risk of cognitive decline. The Journals of Gerontology. Series A, Biological Sciences and Medical Sciences, 68(2), 205–213. 10.1093/gerona/gls153 [DOI] [PMC free article] [PubMed] [Google Scholar]
- Wang, J. C. , & Bennett, M. (2012). Aging and atherosclerosis: Mechanisms, functional consequences, and potential therapeutics for cellular senescence. Circulation Research, 111(2), 245–259. 10.1161/circresaha.111.261388 [DOI] [PubMed] [Google Scholar]
- Williams, D. S. , Detre, J. A. , Leigh, J. S. , & Koretsky, A. P. (1992). Magnetic resonance imaging of perfusion using spin inversion of arterial water. Proceedings of the National Academy of Sciences of the United States of America, 89(1), 212–216. 10.1073/pnas.89.1.212 [DOI] [PMC free article] [PubMed] [Google Scholar]
- World Health Organization . (2018). Ageing and health. https://www.who.int/news-room/fact-sheets/detail/ageing-and-health
- World Health Organization . (2020). Guidelines for physical activity and sedentary behaviour. World Health Organization. [Google Scholar]
- Zhang, N. , Gordon, M. L. , & Goldberg, T. E. (2017). Cerebral blood flow measured by arterial spin labeling MRI at resting state in normal aging and Alzheimer's disease. Neuroscience and Biobehavioral Reviews, 72, 168–175. 10.1016/j.neubiorev.2016.11.023 [DOI] [PubMed] [Google Scholar]
- Zimmerman, B. , Sutton, B. P. , Low, K. A. , Fletcher, M. A. , Tan, C. H. , Schneider‐Garces, N. , Li, Y. , Ouyang, C. , Maclin, E. L. , Gratton, G. , & Fabiani, M. (2014). Cardiorespiratory fitness mediates the effects of aging on cerebral blood flow. Frontiers in Aging Neuroscience, 6, 59. 10.3389/fnagi.2014.00059 [DOI] [PMC free article] [PubMed] [Google Scholar]
- Zlatar, Z. Z. , Hays, C. C. , Mestre, Z. , Campbell, L. M. , Meloy, M. J. , Bangen, K. J. , Liu, T. T. , Kerr, J. , & Wierenga, C. E. (2019). Dose‐dependent association of accelerometer‐measured physical activity and sedentary time with brain perfusion in aging. Experimental Gerontology, 125, 110679. 10.1016/j.exger.2019.110679 [DOI] [PMC free article] [PubMed] [Google Scholar]
Associated Data
This section collects any data citations, data availability statements, or supplementary materials included in this article.
Supplementary Materials
Appendix S1. Supplementary Information.
Data Availability Statement
Raw imaging data and sensitive information cannot be openly shared due to privacy issues. Non‐sensitive data can be made available upon reasonable request to the authors.