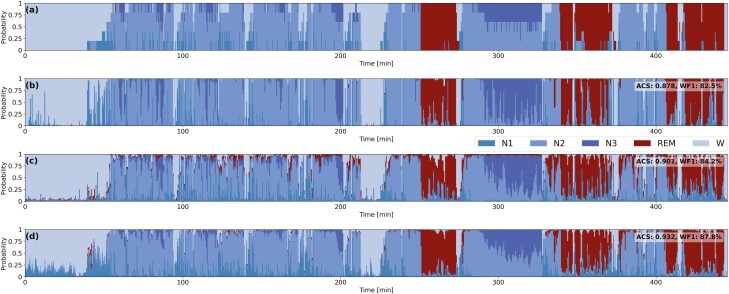
Figure 4.
Hypnodensity-graphs from the scorers labels and from the predicted probabilities from the experimented models. Example of hypnodensity-graphs for a subject from the DOD-O. (a) Soft-consensus computed from the scorers labels; (b) DSN-L base model; (c) DSN-L base+LSU; (d) DSN-L base+LSSC. We also report the ACS value computed between the hypodensity-graph associated to soft-consensus and the ones generated from the predicted probabilities of each model. We reach a higher ACS value with the proposed base+LSSC model with the soft-consensus distribution (d), compared to the baseline (b) and the base+LSU model with the standard uniform distribution (c).

