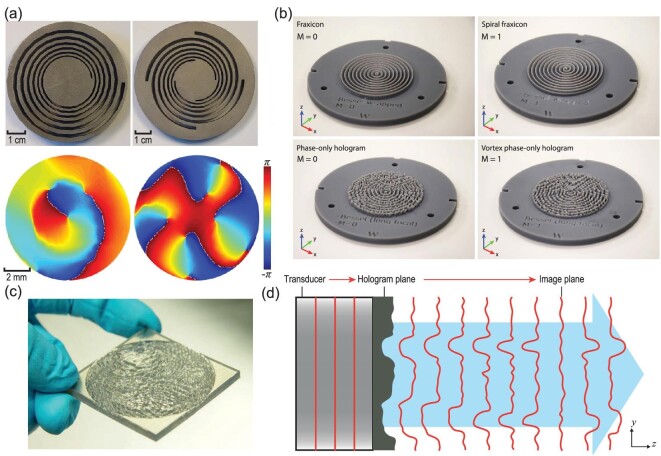
Figure 7.
Actual images of the one- and four-armed MACS samples. The right side of (a) reveals the schematic of the experimental setup. The left bottom portion of (a) details the 425 kHz phase distribution measurements of the one- and four-armed MACSs at the cross section z = 2.5λ. (b) Fraxicon for the zeroth-order Bessel beam corresponding to M = 0, spiral fraxicon (M = 0 and M = 1) (vortex) and phase-only holographic lenses for flat-intensity Bessel beams (M = 0 and M = 1) (vortex). (c) Three-dimensional printed hologram. For every pixel, its phase delay is in proportion to its thickness. (d) The schematic represents the conversion of the emitted wavefront from a transducer to the desired phase distribution through an encoded topography of an acoustic hologram surface. Panel (a) was modified with permission from Jiang et al., Appl Phys Lett 108, 203501 (2016). Copyright 2016, AIP Publishing. Panel (b) was modified based on permission from Jiménez-Gambín et al. [92], Sci Rep 9, 1–13 (2019). Copyright 2019, Macmillan Publishers Ltd. Panel (c) and (d) were modified with permission from Melde et al., Nature 537, 518–22 (2016). Copyright 2016, Macmillan Publishers Ltd.

