Abstract
We describe a simple but efficient approach to make fluorescent probes A and B based on rhodol dyes incorporated with salicyaldehyde moiety for monitoring pH changes in mitochondria under oxidative stresses and hypoxia conditions, and for tracking mitophagy processes. Probes A and B possess pKa values (pKa ≈ 6.41 and 6.83 respectively) near physiological pH and exhibit decent mitochondria-targeted capabilities, low cytotoxicity, and useful ratiometric and reversible pH responses, which make the probes appropriate for monitoring pH fluctuations of mitochondria in living cells with built-in calibration feature for quantitative analysis. The probes have been effectively useful for the ratiometric determination of pH variations of mitochondria under the stimuli of carbonyl cyanide-4(trifluoro-methoxy)phenylhydrazone (FCCP), hydrogen peroxide (H2O2), and N-acetyl cysteine (NAC), and during mitophagy triggered by cell nutrient deprivation, and under hypoxia conditions with cobalt chloride (CoCl2) treatment in living cells. In addition, probe A was efficient in visualizing pH changes in the larvae of fruit flies.
1. Introduction
The pH level within a cell exerts a crucial role in the cell’s functions and pathological processes including cell metabolism, homeostasis, apoptosis, proliferation, enzyme activity, ion transport, drug resistance, and endocytosis.1-4 The cells maintain appropriate pH values inside different organelles for their functions and normal physiology.1-4 Abnormal intracellular pH is often associated with pathophysiologic states and can result in cell dysfunction, and diseased states including cancer, neurodegenerative and cardiopulmonary diseases.1-4 Accurate and precise determination of intracellular pH fluctuations with self-calibration capability will offer an insightful understanding of the physiological and pathological developments closely associated with intracellular pH variations.4-14
Rhodol dyes have gained a lot of attention in fluorescence sensing and imaging applications due to excellent and distinctive photophysical properties including excellent photostability, high quantum yields, high molar absorption coefficient, solubility in a variety of solvents, and good pH sensitivity.1-3,15-19 Several rhodol dyes have been synthesized using different strategies such as replacing the central oxygen atom with a C, N, B, Si, S, P, Se, or Te atom, the introduction of electron donating groups to the N atom, and enhancement of π-conjugation by introducing different moieties to the xanthene core for near-infrared emission to prevent photodamage to cells and tissues.1,3,15-19 Although a variety of rhodol-based probes have been reported, many of them are based on a single wavelength, and often encounter systematic bias due to excitation wavelength fluctuations and the concentration variations of the intensity-based probes in live cells.1-3,17-19 Ratiometric near-infrared fluorescent probes offer special benefits such as quantitative and comparative analyses with self-calibration capability to prevent systematic errors with intensity-based fluorescent probes, combining near-infrared imaging advantages including deep tissue penetration, reduced photodamage, and less autofluorescence from the biological samples.1-3,8-11,13,14,20-23 The syntheses of ratiometric fluorescent probes are often based on donor and acceptor chromophores which responded ratiometrically through a through-bond energy transfer (TBET) or Förster Resonance Energy Transfer (FRET), or twisted intramolecular charge transfer (TICT) from donor to acceptor fluorophore moieties.2,3,8,11,13,18,19 Many ratiometric fluorescent probes have been synthesized using spiropyran and spirolactam molecular switches because they can reversibly respond to the chemical stimuli through chemical structural changes.1-3,8,10,11,13,18,19,21-23 Only a few rhodol-based ratiometric fluorescent probes have been reported recently.1-3,18,19,22
In this paper, we developed a simple and effective approach to synthesize two ratiometric pH-sensitive rhodol dyes (probes A and B) by incorporating salicylaldehyde moiety to xanthene cores to tune the dye emissions to longer wavelengths through π-conjugation enhancement of rhodol dyes and to accomplish pH ratiometric responses at the same time. Reversible proportional fluorescence signals of the probes to pH variations were realized through changes in π-conjugation of the dyes modulated by pH-responsive spirolactone switches. Under a basic condition, probes A and B show fluorescence peaks around 523 nm and 506 nm with closed spirolactone switches, respectively while under acidic conditions, the probes undergo red shifts and show new additional fluorescence peaks at 638 nm in the near-infrared region and 580 nm in the visible region respectively, because of acid-activated spirolactone ring opening (Scheme 1). Probes A and B possess idyllic respective pKa values of 6.41 and 6.83 near physiological pH levels and exhibit reversible responses to pH with high selectivity and excellent biocompatible features and mitochondrial specificity. They were used to detect pH variance in mitochondria under oxidative stresses, and hypoxia conditions, and track the mitophagy process caused by cell starvations. Additionally, probe A was applied to monitor pH changes in D. melanogaster first-instar larvae.
Scheme 1.
Chemical structure changes of fluorescent probes A and B to pH variations.
2. Experimental
2.1. Instrumentation
13C (125 MHz) and 1H NMR (500 MHz) spectra were obtained using a Bruker NMR spectrometer (Ascend 500) or a Varian Unity Inova NMR spectrometer at 400 MHz 1H (100 MHz 13C) in CDCl3 (2.0 × 10⁻² M). The absorption spectra of the probes were obtained on a PerkinElmer Lambda 35 UV/vis spectrometer and the fluorescence spectra on a Jobin Yvon Fluoromax-4 spectrofluorometer. Methods for the theoretical calculations are listed in ESI.†
2.2. Reagents
All reagents including metal ions, thiols, H2O2, other chemicals, and cyanine dye (IR-780) were purchased from commercial suppliers and utilized as is.
2.3. General procedure for pH detection
Stock solutions (1.5 mM) of probes A and B were made in DMSO (3.0 mL). 0.1 M citrate–phosphate buffers were employed for pH ranges from 4.0 to 7.0 and 0.2 M carbonate–bicarbonate buffers containing 10% ethanol were utilized for pH ranges from 7.0 to 10.3 to study spectrochemical responses of the probes to changes in pH, and probe selectivity. For the measurement of absorbance and emission spectra, 20 μL of the stock solutions of the probes were mixed in 3.0 mL of the phosphate buffer with 10% ethanol. The mixtures were transferred to 1 cm quartz cuvettes to measure absorbance and fluorescence spectra.
2.4. Cell cytotoxicity and culture evaluation
A549 cells were grown in modified Eagle’s (Gibco) medium accompanied with 10% fetal bovine serum (Fisher Scientific) at 37 °C under a 5% CO2 moistened air environment and then further cultured until an 80% confluence was reached.8,10,11,13,21-27 A cytotoxicity evaluation was conducted employing a standard MTT assay with A549 cells. The A549 cells were planted in a 96-well plate with a density of about 6000 cells in each well, cultivated for 24 hours, and then further grown for 48 hours after the addition of one of 0, 5, 10, 20, to 50 μM concentrations of probe A or B in fresh culture medium to the cells. After 500 μg mL−1 of tetrazolium salt (3-(4,5-dimethylthiazol-2-yl)-2,5-diphenyl tetrazolium bromide) were placed with the cells, the cells were further nurtured for 4 hours, forming an insoluble purple formazan in aqueous solutions through reduction of tetrazolium salt by dehydrogenases and reductases in live active cells. Purple formazan crystals were added to dimethyl sulfoxide (DMSO) to determine the active cell rate by measuring the absorbance at 490 nm. The viability rate of the cells was analyzed by Vrate = (A − AB)/(AC − AB) × 100%, where A stands for the absorbance of the investigational group, AC is the absorbance of the cell medium as the control, and AB is the absorbance of the blank group in the absence of cells.
2.5. Fluorescence cellular imaging
A549 cells were planted with a density of 1 × 10⁵ cells per dish in 35 mm confocal glass-bottom dishes (MatTek) and grown for 24 hours before collection of cellular imaging.28 For the colocalization experiment, A549 cells were established in 10 μM cyanine dye (IR-780) and 10 μM of either probe A or B for 1 hour, and washed twice with PBS buffer before the collection of cellular imaging. To visualize intracellular pH changes, we situated A549 cells and 10 μM of either probe A or B in the cell medium for 2 hours, twice cleaned the cells with medium, and then placed the cells in different pH buffers containing nigericin (10 μg mL−1) for 30 min to accomplish the extracellular and intercellular pH equilibration. Cellular fluorescence images were obtained using an Olympus IX 81 confocal fluorescence microscope (Olympus America Inc.). A 60× objective lens was used for the colocalization experiments while a 40× objective lens was utilized for the other cellular imaging experiments. Two different channels were employed to obtain the probe’s visible fluorescence from 500 nm to 550 nm (green channel) and the probe’s near-infrared fluorescence from 625 nm to 675 nm (red channel) under 488 nm excitation, respectively. The near-infrared fluorescence of the mitochondria-specific cyanine dye (IR-780) in the co-localization experiment was collected in the magenta channel from 750 nm to 800 nm under an excitation of 635 nm. The images were further administered with Image Pro6 software under an Olympus FV10-ASW 3.1 viewer, and Photoshop 6.0.
3. Results and discussion
3.1. Probe synthesis and characterization
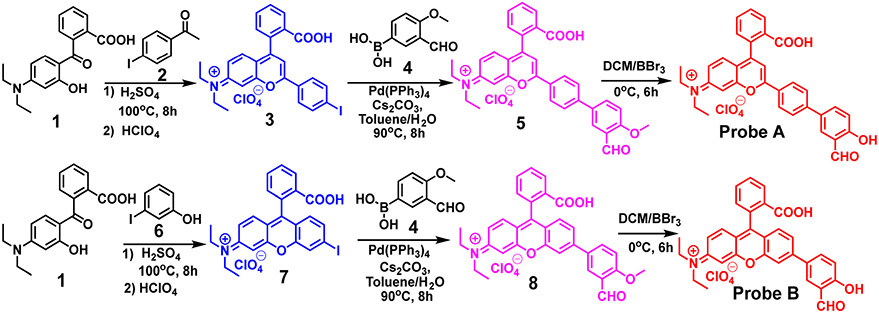
The procedure to make the probes is shown in Scheme 2. For probe A, we first synthesized compound 3 by reacting 2-(4-(diethylamino)-2-hydroxybenzoyl)benzoic acid (1) with 1-(4-iodophenyl)ethan-1-one (2). Compound 3 was further reacted with 3-formyl-4-methoxyphenyl)boronic acid (4) via a palladium-catalyzed Suzuki reaction to give rhodol dye derivative (5) which was treated with boron tribromide (BBr3) to deprotect methyl group, affording probe A. Similarly probe B was synthesized from compound 7 which was obtained by reacting of 2-(4-(diethylamino)-2-hydroxybenzoyl) benzoic acid (1) with 3-iodophenol (6). Compound 7 was further reacted with 3-formyl-4-methoxyphenyl)boronic acid via the palladium-catalyzed Suzuki reaction yielding the rhodol dye derivative (8) which was then treated with boron tribromide (BBr3) to deprotect methyl group, resulting in probe B. Probes A and B were characterized by mass, 1H and 13C NMR spectrometries presented as ESI.†
Scheme 2.
Synthetic procedure for the probes.
3.2. Probe optical properties in different pH buffers
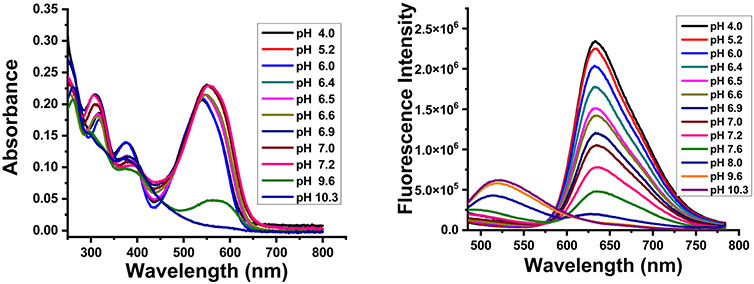
We investigated the effect of varying the pH on the optical properties of the probes in different buffer solutions containing 10% ethanol. Probe A showed a main strong absorption band at 550 nm and a higher energy absorption band at 380 nm at acidic pH (4.0) in a buffer containing 10% EtOH (Fig. 1). Gradual pH increases from 4.0 to 10.3 resulted in gradual decreases of the main absorption peak at 550 nm (Fig. 1). Upon excitation at 465 nm, probe A showed an emission band at 523 nm at pH 10.3 with a closed spirolactone switch, which corresponds to intramolecular charge transfer from a hydroxyl group through the benzene ring to a formyl group. Upon gradual decreases in pH from 10.3 to 4.0, the fluorescence peak at 523 nm of probe A completely disappeared and a new strong peak was observed at 638 nm as a result of acid-activated spirolactone ring opening (Fig. 1, right). Similarly, upon 465 nm excitation, probe B showed a fluorescence band at 506 nm at pH 10.3, which corresponds to intramolecular charge transfer of a hydroxyl group through the benzene ring to the formyl group and disappears completely upon gradual pH decrease from 10.3 to 4.5. A new strong fluorescence peak at 582 nm together with a shoulder at 620 nm of probe B was observed due to the opening of the spirolactone ring under acidic conditions (Fig. S9, ESI†). Probes A and B possess pKa values of 6.41 and 6.83 related to the opening of spirolactone switches, respectively (Scheme 1 and Fig. S10, ESI†). Therefore, these probes demonstrate ratiometric fluorescence responses to pH variations by the probe π-conjugated changes through acid-activated spirolactone ring openings.
Fig. 1.
Absorption (left) and fluorescence (right) spectra of probe A (10 μM) in different pH buffers containing 10% ethanol at 465 nm excitation.
3.3. Theoretical calculations
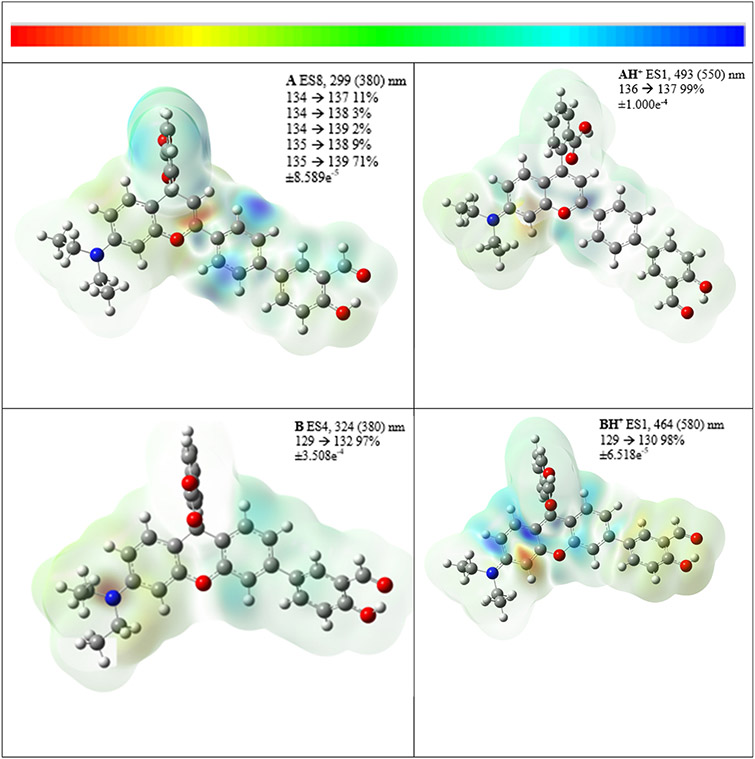
Details for these calculations, which were conducted to evaluate geometrical and absorption attributes in the probes and their protonated forms, are presented as ESI.† There is a reduction in the interplanar angles between the benzoic acid moiety involved in the spirolactone ring and the pseudo rhodol moiety in probe A (Fig. S11, ESI†) at 87.65° compared to AH+ (Fig. S14, ESI†) at 74.15°. There is less reduction in the equivalent angles in B (Fig. S17, ESI†) at 89.84° compared to BH+ (Fig. S20, ESI†) at 81.98° presumably due to the steric rigidity in the larger rhodol entity in B. The current density drawings in Fig. 2 for probes A and AH+ illustrate a more delocalized nature in AH+ which results in a shift in the absorption from the UV into the visible range. This is evident in the decrease in the interplanar angle between the benzene fragment attached to the pseudo rhodol entity from 23.78° in A to 8.04° in AH+. Several excitations are possible from 325–400 nm for probe A but these do not have significant oscillator strengths, see Table S2 (ESI†). The current density drawing for A in Fig. 2 is from excitation 8 which is mostly localized on the right section of the molecule as shown in Fig. 2 with significant density transferred to the benzoic acid moiety, Fig. S13 (ESI†). In contrast, the absorption for probe AH+ is from the HOMO to the LUMO and occurs with large oscillator strength, Table S4 (ESI†). This involves a transition of electron current density from the 2-hydroxy benzaldehyde section onto the pseudo rhodol moiety, Fig. S16 (ESI†).
Fig. 2.
Current density difference sketches as isosurfaces of the probes. The number of excited states (ES), the calculated (and investigational) wavelengths, and the transitions jointly with contributions as percentages are outlined. Values for the color scale on the top of the figure are also listed. Additional diagrams on the numbered LCMOs are presented in ESI.†
In contrast, probes B and BH+ with the more extended rhodol arrangement do not show significant changes in the interplanar angle between the 2-hydroxybenzaldehyde and rhodol moieties from 37.24° to 36.10° respectively. Probe B is calculated to have an absorption at 324 nm (for excited state 4, Table S6, ESI†) which originates from the diethylamino section onto the right section (i.e., the rhodol and the 2-hydroxy benzaldehyde moiety) in the form of a HOMO to LUMO+2 transition, Table S6 and Fig. S19 (ESI†). With B, the LUMO is localized on the 2-hydroxy benzaldehyde moiety and LUMO+1 is on the benzoic acid moiety. The main absorption in BH+ calculated to occur at 464.62 nm arises from a HOMO to LUMO transition with significant oscillator strength, Table S8 (ESI†) and Fig. 2. Similar to the absorption with AH+, this transition also originates from the 2-hydroxy benzaldehyde moiety (i.e., now the more electron-rich side of the molecule) onto the rhodol group, Fig. S22 (ESI†), as the lone pair of electrons on the diethylamino group is delocalized into the rhodol ring.
3.4. Probe selectivity towards pH over cation ions, anions, and amino acids
To evaluate the effect of other biological molecules on the pH measurement of probes A and B, the fluorescence spectra were assimilated with possible essential ions such as Na+, K+, Mg2+, Ca2+, Sn2+, Cs+, Co2+, and Fe3+ at physiological pH (i.e., 7.4) and under acidic pH (i.e., 4.0) conditions at 37 °C, respectively. Fig. S23 and S24 in ESI† showed that insignificant changes in the emission spectra with fluorescence peak at 523 and 638 nm for probe A and with fluorescence peak at 506 and 582 nm for probe B were observed in the presence of these essential ions under 465 nm excitation, respectively. Similarly, to understand the affinity of probes A and B for different classes of anions such as HCO3−, SO42−, NO2−, PO43−, CO32−, SO32−, CH3COO− and Cl− ions, the emission spectra were acquired under physiological and acidic conditions (pH 7.4 and 4.0, 37 °C), respectively. Notably, probes A and B showed insignificant spectroscopic changes toward the tested anions which revealed that probes are highly selective towards pH over the tested anions (Fig. S23 and S24, ESI†). In order to further understand the affinity of probes A and B with a different class of amino acids such as dl-His, l-ala, l-Asp, GSH, l-Glu, l-Lys, and l-Cys, emission spectra were acquired under similar conditions (Fig. S25, ESI†). The probes showed irrelevant interactions toward the tested amino acids. In addition, the probes show no interference to reactive oxygen and nitrogen species such as NO, ClO−, and H2O2 (Fig. S25, ESI†). These results suggested that probes A and B have selectivity towards H+, display potential as pH-sensitive probes to explore pH-related biological activities, and are not affected by the ions present in the biological background.
3.5. Probe photostability and reversibility
The probe photostability was also examined through emission spectra (Fig. S26, ESI†). We monitored the emission intensities of probe A at 523 nm and probe B at 506 nm under 465 nm excitation over each duration of 20 min and found that these probes showed virtuous photostability throughout 2 hours without any considerable loss in relative fluorescence intensity. In addition, the probe’s reversible fluorescence responses to pH changes were also examined in the range of pH changes between 10.0 and 4.0 (Fig. S27, ESI†). Both probes showed it could be repeated for about eight cycles and found that the emission behavior of the probes persisted consistently without any substantial loss in relative fluorescence intensity.
3.6. The probe cytotoxicity
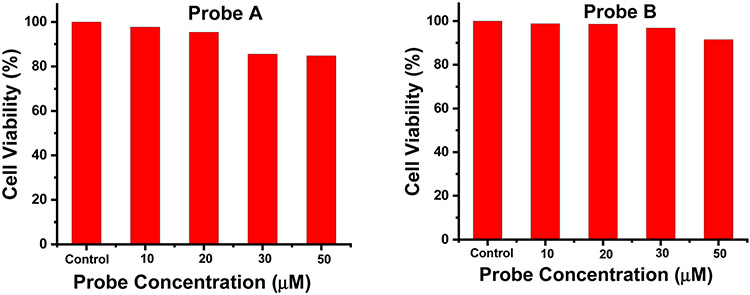
The cytotoxicity of probes A and B were evaluated in A549 cells by employing a standard MTT assay. After 24 hours of incubation of the probes in A549 cells, the probes display biocompatibility to the cells with low cytotoxicity since the cell viability is much greater than 80% even under 50 μM probe concentrations (Fig. 3).
Fig. 3.
Cell viability versus different concentrations of the probes by a standard MTT assay.
3.7. Cellular imaging of the probes
We hypothesized that the probes could be used to exclusively target mitochondria via electrostatic interactions between the positively charged probes and the negative potentials within mitochondria. To test our hypothesis, we performed co-localization tests by co-incubating the probes with mitochondria-specific near-infrared cyanine dye (IR-780) in A549 cells by collecting fluorescence of probe A or B in two channels (I and II) at 488 nm excitation, and near-infrared fluorescence of cyanine dye (IR-780) in channel III under 635 nm excitation (Fig. 4). The fluorescence images in channel I of both probes A and B were overlayed very accurately with the fluorescence image in channel III of cyanine dye. Pearson correlation coefficients of the probes and cyanine dye IR-780 were calculated to be 0.957 for probe A and 0.965 for probe B, indicating that probe A, probe B, and cyanine dye (IR-780) localized in the same intracellular compartment. This suggests that the probes can unambiguously target mitochondria within live cells (Fig. 4).
Fig. 4.
Fluorescence images of A549 cells that were mixed for 2 hours with 10 μM of cyanine dye (IR-780) and 10 μM probe A (left) or B (right). The green channel I was used to monitor the visible fluorescence of probe A or B from 500 nm to 550 nm while red channel II was utilized to collect near-infrared fluorescence from 625 nm to 675 of probe A or red fluorescence from 575 nm to 650 nm of probe B at 488 nm excitation. Magenta channel III was employed to obtain the NIR fluorescence from 750 nm to 800 nm of mitochondria-specific cyanine dye (IR-780) at 635 nm excitation with scale bars at 20 μm.
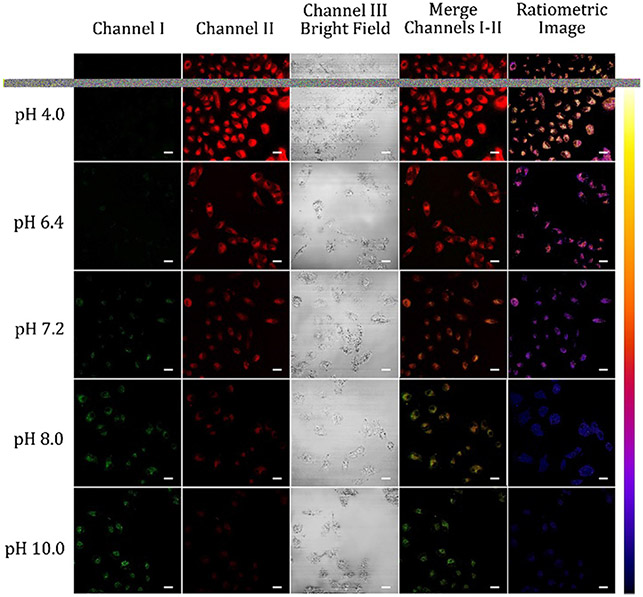
The live cell imaging experiments were carried out in A549 cells to evaluate if the probes were useful for pH determination inside living cells. The cells were placed in pH buffers varying from pH values of 4.0 to 10.0 containing 10 μM nigericin and 10 μM of either probe. Nigericin was employed to achieve the extracellular and intercellular pH equilibration (Fig. 5).8,10,11,13,21-23,29 As intracellular pH value decreased, the emission intensities of both probes A and B in channel I decreased gradually while the fluorescence in channel II increased gradually (Fig. 5 and S28, ESI†), which are consistent with ratiometric fluorescence responses of the probes in different pH buffers (Fig. 1). Both probes showed strong near-infrared and red fluorescence in channel II and weak visible fluorescence in channel I as intracellular pH decreased to acidic pH 4.0 from pH 10.0. The merged images of the cells containing the probes also show significant color changes from red to green upon intracellular pH changes from 4.0 to 10.0 (Fig. 5, and S28, ESI†). The ratiometric images (channel II/channel I, pseudo color generated by ImageJ software) revealed a pH-dependent characteristic with dramatic color differences from yellowish red to reddish blue or blue due to intracellular pH variations from 4.0 to 10.0. This result illustrated both probes are sensitive to pH variance and able to detect intracellular pH variations in live cells.
Fig. 5.
Fluorescence images of A549 cells incubated with 10 μM probe A in different pH buffers containing 10 μM nigericin. The green channel I was used to obtain visible fluorescence of the probe from 500 nm to 550 nm while red channel II was utilized to collect near-infrared fluorescence from 625 nm to 675 of probe A at 488 nm excitation with scale bars at 50 μm.
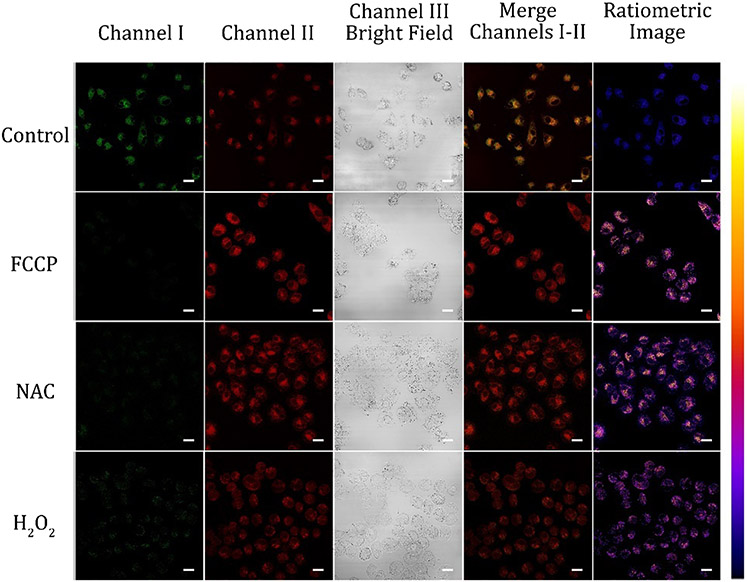
Further, we monitored the intracellular pH fluctuations influenced by oxidative stress. The different chemicals can distress the mitochondrial pH in live cells expressively. To evaluate the possibility of monitoring the pH variation with the probes, A549 cells were stained with probes A and B and then different redox substances, such as FCCP (carbonyl cyanide 4-(trifluoromethoxy)phenylhydrazone), a typical protonophoric uncoupling agent to disrupt oxidative phosphorylation in mitochondria, NAC (N-acetylcysteine, a GSH precursor), and reactive oxygen species (hydrogen peroxide) were employed to treat A549 cells and then cellular images were carried out with these chemical-treated cells, respectively (Fig. 6 and Fig. S29, ESI†). Confocal fluorescence images were acquired for probes A and B incubated in normal growth medium for 2 hours and then incubated with PBS containing FCCP (10 μM), NAC (1 mM), and H2O2 (500 μM) for 20 minutes, respectively under excitation at 488 nm. Fig. 6 showed that 20 min treatment of the cells with 10 μM FCCP results in intracellular pH decrease with dramatic fluorescence intensity increased significantly in channel II and fluorescence decrease in channel I. These results validate that FCCP makes the mitochondrial membrane potential unbalanced and leads to the obvious acidification of mitochondria by transferring protons through the mitochondrial inner membrane.30 The NAC treatment with A549 cells produced the acidification of mitochondria (Fig. 6, and Fig. S28, ESI,† NAC) with fluorescence decrease in Channel I and fluorescence increase in Channel II, which is consistent with reported results of NAC-activated cell acidification.31-33 Further, H2O2 treatment of the cells caused a dramatic increase of fluorescence intensity in Channel II with fluorescence decrease in Channel I, indicating that the intracellular pH was also acidified by hydrogen peroxide treatment because hydrogen peroxide can redistribute H+ to other organelles from acidified organelles by damaging the vacuolar proton pump (V-ATPase), which can hydrolyze the ATP, leading to acidification of mitochondria.34,35 In addition, hydrogen peroxide can generate hydroxyl radicals which can further produce acidic substances including phosphoric acid, resulting in intracellular acidosis.14,34
Fig. 6.
Fluorescence images A549 cells incubated with 10 μM of probe A in normal medium after 20 min treatment of FCCP (10 μM), NAC (1 mM), or H2O2 (500 μM). The green channel I was used to collect the probe’s visible fluorescence from 500 nm to 550 nm while red channel II was utilized to obtain the probe’s near-infrared fluorescence from 625 nm to 675 at 488 nm excitation. Scale bars of all images are at 50 μm.
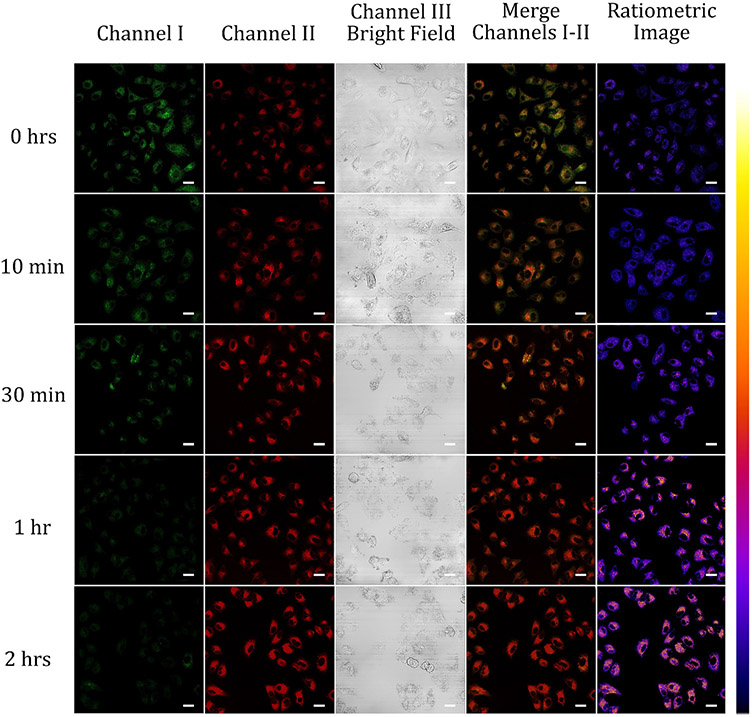
Mitophagy is an autophagy that selectively degrades dysfunctional mitochondria and exerts a very important role in conserving cellular physiology and metabolism.22,36-38 Mitophagy is induced by starvation, so we examined the application of probes A and B to monitor the mitophagy process by monitoring changes in pH levels in mitochondria. 22,36-38 During the mitophagy, lysosomes engulf malfunctioning mitochondria, generating acidic autolysosomes, resulting in lower pH values within mitochondria.22,36-38 For the starvation stimulation, A549 cells were grown with 10 μM of probe A or B in a glucose-free medium from 10 min to 2 hours. The cellular imaging results showed gradual decreases of the observable fluorescence intensity in the green channel I whereas gradual increases of the red or near-infrared fluorescence intensity in red channel II under the excitation at 488 nm (Fig. 8 and Fig. S30, ESI†). A substantial color change was observed in combined images of channels I and II going from a deep green to a brown color, and ratiometric images also underwent dramatic color differences from slightly reddish blue to bluish red with 2 hours of nutrient starvation (Fig. 7 and Fig. S30, ESI†), suggesting that the changes in probe fluorescence in both channels may be ascribed to mitophagy produced by starvation of nutrients.22
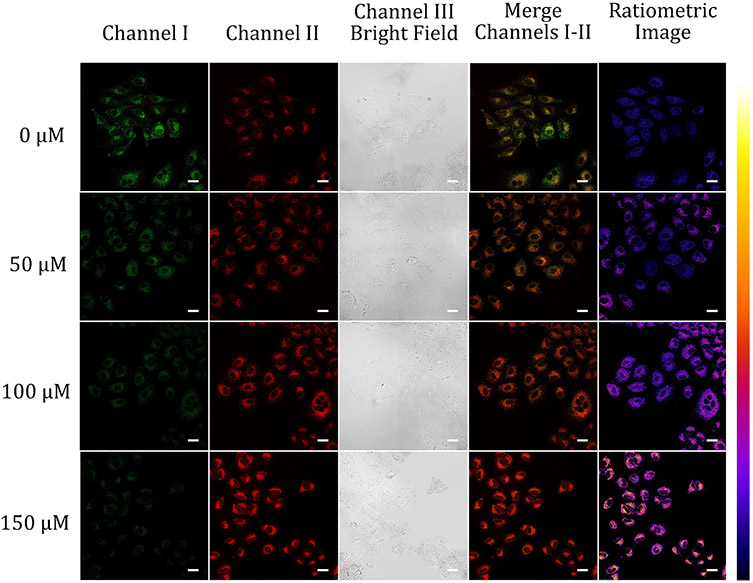
Fig. 8.
Confocal fluorescence microscopy images of A549 cells grown with 10 μM probe A under different hypoxia conditions in the absence and presence of 50, 100, and 150 μM CoCl2. The green channel I was used to obtain the visible fluorescence of probe A from 500 nm to 550 nm while red channel II was utilized to collect near-infrared fluorescence from 625 nm to 675 of probe A at 488 nm excitation. Scale bars of all images above are at 50 μm.
Fig. 7.
Fluorescence imaging of A549 cells including 10 μM of probe A in serum-free medium for different periods. The green channel I was used to collect the probe’s visible fluorescence from 500 nm to 550 nm while red channel II was utilized to obtain the probe’s near-infrared fluorescence from 625 nm to 675 of probe A at 488 nm excitation. Scale bars of all images above are at 50 μm.
Hypoxia with lower-than-normal oxygen levels is a pathogenic feature of solid tumors.39 Myocardial hypoxia occurs with a lack of blood flow to the human heart and leads to an insufficient supply of myocardial oxygen.38 We used our probe to track how pH changes under hypoxia conditions by chemically inducing cell hypoxia through the treatment of A549 cells with different concentrations of cobalt chloride (CoCl2) (Fig. 8 and Fig. S31, ESI†).28,40,41 The cytotoxic effect of cobalt chloride on A549 cells may arise from its induction of oxidative stress. Increases in CoCl2 concentrations were used to aggravate the hypoxia degree of the cells. Merged images of the cells change drastically from greenish brown color to deep red color when the concentration of CoCl2 gradually increases from 0 μM to 150 μM. Ratiometric images of the cells also display noticeable changes in color from reddish blue to bluish yellow upon CoCl2 contraction changes from 0 μM to 150 μM (Fig. 8). This indicates that intracellular pH has become acidified under hypoxia conditions.
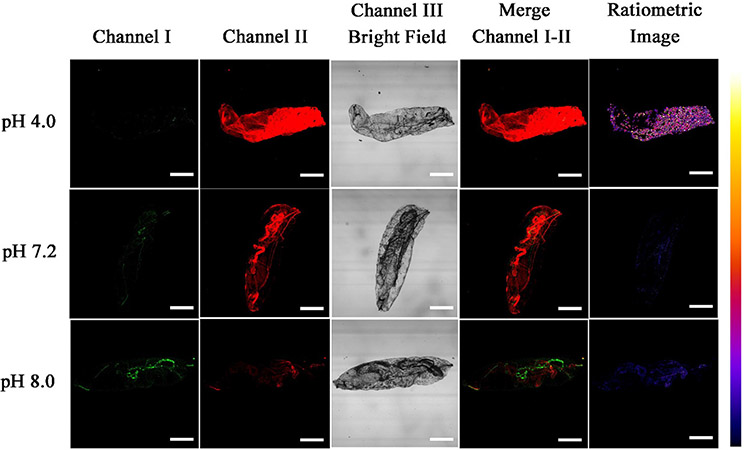
Because of its outstanding imaging performance, we further employed probe A to visualize the pH variations in D. melanogaster first-instar larvae. The larvae were incubated with probe A in different buffer solutions at three different pH values for six hours and then imaged with fluorescent confocal microscopy (Fig. 9). The larvae at pH 4.0 PBS buffer showed strong near-infrared fluorescence signal in channel II and a weaker one in channel I while the larvae kept at pH 8.0 PBS buffer showed strong visible fluorescence in channel I and a weak near-infrared fluorescence in channel II, which is consistent with intracellular pH changes in live cells as observed in Fig. 5. These results suggest that probe A is an excellent and powerful pH imaging indicator for the study of different biological and pathological processes.
Fig. 9.
Fluorescence images of D. melanogaster first-instar larvae incubated with 10 μM probe A in different pH buffers for 6 h. The green channel I was used to collect the probe’s visible fluorescence from 500 nm to 550 nm while red channel II was utilized to obtain the probe’s near-infrared fluorescence from 625 nm to 675 of probe A at 488 nm excitation. Scale bars of all images above are at 200 μm.
In conclusion, we have produced new effective and efficient ratiometric probes A and B by introducing salicylaldehye moiety as a part of rhodol dyes for monitoring pH changes in mitochondria under different oxidative stress and tracking pH changes during mitophagy and under hypoxia conditions. Probes A and B possess idyllic pKa values of 6.41 and 6.83 near physiological pH, respectively for monitoring intracellular pH fluctuations. The probes specifically target mitochondria with display low cytotoxicity. They exhibit reversible and ratiometric fluorescence responses toward pH alterations in live cells during mitophagy and under hypoxia conditions hypo. Furthermore, probe A has been used to monitor pH changes in D. melanogaster first-instar larvae. Additionally, these probes can be further modified to generate a series of new ratiometric near-infrared probes by conjugating different electron-withdrawing acceptors with the formyl group of probes A and B. This aspect is currently being studied.
Supplementary Material
Acknowledgements
We thank the National Institute of General Medical Sciences of the National Institutes of Health under Award Numbers R15GM114751 (for H. Liu), 2R15GM114751-02 (for H. Liu), and R15 GM146206-01 (for H. Liu and R. Luck) for financial support of this research. We also thank National Science Foundation under an award number 2117318 for financial support to purchase a new NMR spectrometer (for H. Liu). The calculations of the fluorescent probe were conducted by using a high-performance computing infrastructure at Michigan Technological University.
Footnotes
Conflicts of interest
There are no conflicts to declare.
Electronic supplementary information (ESI) available. See DOI: https://doi.org/10.1039/d2tb02791g
References
- 1.Chen WJ, Ma XX, Chen HJ, Liu SH and Yin J, Coord. Chem. Rev, 2021, 427, 213584. [Google Scholar]
- 2.Hande PE, Shelke YG, Datta A and Gharpure SJ, ChemBioChem, 2022, 23, e202100448. [DOI] [PubMed] [Google Scholar]
- 3.Wen Y, Jing N, Huo FJ and Yin CX, Analyst, 2021, 146, 7450–7463. [DOI] [PubMed] [Google Scholar]
- 4.Grillo-Hill BK, Webb BA and Barber DL, in Quantitative Imaging in Cell Biology, ed. Waters JC and Wittmann T, 2014, vol. 123, pp. 429–448. [Google Scholar]
- 5.Myochin T, Kiyose K, Hanaoka K, Kojima H, Terai T and Nagano T, J. Am. Chem. Soc, 2011, 133, 3401–3409. [DOI] [PubMed] [Google Scholar]
- 6.Liu XD, Xu Y, Sun R, Xu YJ, Lu JM and Ge JF, Analyst, 2013, 138, 6542–6550. [DOI] [PubMed] [Google Scholar]
- 7.Wan QQ, Chen SM, Shi W, Li LH and Ma HM, Angew. Chem., Int. Ed, 2014, 53, 10916–10920. [DOI] [PubMed] [Google Scholar]
- 8.Wang JB, Xia S, Bi JH, Fang MX, Mazi WF, Zhang YB, Conner N, Luo FT, Lu HP and Liu HY, Bioconjugate Chem, 2018, 29, 1406–1418. [DOI] [PMC free article] [PubMed] [Google Scholar]
- 9.Li XY, Hu YM, Li XH and Ma HM, Anal. Chem, 2019, 91, 11409–11416. [DOI] [PubMed] [Google Scholar]
- 10.Wang JB, Xia S, Bi JH, Zhang YB, Fang MX, Luck RL, Zeng YB, Chen TH, Lee HM and Liu HY, J. Mater. Chem. B, 2019, 7, 198–209. [DOI] [PMC free article] [PubMed] [Google Scholar]
- 11.Xia SA, Wang JB, Zhang YB, Whisman N, Bi JH, Steenwinkel TE, Wan SL, Medford J, Tajiri M, Luck RL, Werner T and Liu HY, J. Mater. Chem. B, 2020, 8, 1603–1615. [DOI] [PMC free article] [PubMed] [Google Scholar]
- 12.Juvekar V, Lim CS, Lee DJ, Song DH, Noh CK, Kang H, Shin SJ and Kim HM, ACS Appl. Bio Mater, 2021, 4, 2135–2141. [DOI] [PubMed] [Google Scholar]
- 13.Wan SL, Xia S, Medford J, Durocher E, Steenwinkel TE, Rule L, Zhang YB, Luck RL, Werner T and Liu HY, J. Mater. Chem. B, 2021, 9, 5150–5161. [DOI] [PMC free article] [PubMed] [Google Scholar]
- 14.Li YH, Wang YJ, Yang S, Zhao YR, Yuan L, Zheng J and Yang RH, Anal. Chem, 2015, 87, 2495–2503. [DOI] [PubMed] [Google Scholar]
- 15.Keller SG, Kamiya M and Urano Y, Molecules, 2020, 25, 5964. [DOI] [PMC free article] [PubMed] [Google Scholar]
- 16.Khan Z and Sekar N, Dyes Pigm., 2022, 208, 11073. [Google Scholar]
- 17.Poronik YM, Vygranenko KV, Gryko D and Gryko DT, Chem. Soc. Rev, 2019, 48, 5242–5265. [DOI] [PubMed] [Google Scholar]
- 18.Hou JT, Ren WX, Li K, Seo J, Sharma A, Yu XQ and Kim JS, Chem. Soc. Rev, 2017, 46, 2076–2090. [DOI] [PubMed] [Google Scholar]
- 19.Yue YK, Huo FJ, Lee S, Yin CX and Yoon J, Analyst, 2017, 142, 30–41. [DOI] [PubMed] [Google Scholar]
- 20.Wang BL, Jiang C, Li K, Liu YH, Xie YM and Yu XQ, Analyst, 2015, 140, 4608–4615. [DOI] [PubMed] [Google Scholar]
- 21.Xia S, Wang JB, Bi JH, Wang X, Fang MX, Phillips T, May A, Conner N, Tanasova M, Luo FT and Liu HY, Sens. Actuators, B, 2018, 265, 699–708. [DOI] [PMC free article] [PubMed] [Google Scholar]
- 22.Zhang YB, Xia S, Mikesell L, Whisman N, Fang MX, Steenwinkel TE, Chen K, Luck RL, Werner T and Liu HY, ACS Appl. Bio Mater, 2019, 2, 4986–4997. [DOI] [PMC free article] [PubMed] [Google Scholar]
- 23.Yan YN, Zhang YB, Xia S, Wan SL, Vohs T, Tanasova M, Luck RL and Liu HY, Molecules, 2021, 26, 2088. [DOI] [PMC free article] [PubMed] [Google Scholar]
- 24.Zhang H, Fan JL, Wang JY, Zhang SZ, Dou BR and Peng XJ, J. Am. Chem. Soc, 2013, 135, 11663–11669. [DOI] [PubMed] [Google Scholar]
- 25.Yin GX, Niu TT, Yu T, Gan YB, Sun XY, Yin P, Chen HM, Zhang YY, Li HT and Yao SZ, Angew. Chem., Int. Ed, 2019, 58, 4557–4561. [DOI] [PubMed] [Google Scholar]
- 26.Xu YX, Yan J, Zhu Y, Chen HY, Wu CY, Zhu XH, Zhang YY, Li HT, Liu ML and Yao SZ, Anal. Chem, 2022, 94, 14642–14651. [DOI] [PubMed] [Google Scholar]
- 27.Yin GX, Niu TT, Gan YB, Yu T, Yin P, Chen HM, Zhang YY, Li HT and Yao SZ, Angew. Chem., Int. Ed, 2018, 57, 4991–4994. [DOI] [PubMed] [Google Scholar]
- 28.Wan SL, Vohs T, Steenwinkel TE, White WR, Lara-Ramirez A, Luck RL, Werner T, Tanasova M and Liu HY, ACS Appl. Bio Mater, 2022, 5, 4294–4300. [DOI] [PMC free article] [PubMed] [Google Scholar]
- 29.Miao Z, Hou WL, Liu ML, Zhang YY and Yao SZ, New J. Chem, 2018, 42, 1446–1456. [Google Scholar]
- 30.Buckler KJ and Vaughan-Jones RD, J. Physiol, 1998, 513, 819–833. [DOI] [PMC free article] [PubMed] [Google Scholar]
- 31.He LL, Yang XH, Zhao F, Wang KM, Wang Q, Liu JB, Huang J, Li WS and Yang M, Anal. Chem, 2015, 87, 2459–2465. [DOI] [PubMed] [Google Scholar]
- 32.Liu XJ, Wang LL, Bing T, Zhang N and Shangguan DH, ACS Appl. Bio Mater, 2019, 2, 1368–1375. [DOI] [PubMed] [Google Scholar]
- 33.Bai QQ, Yang CJ, Yang MJ, Pei ZQ, Zhou XB, Liu JX, Ji HW, Li G, Wu MM, Qin YL, Wang Q and Wu L, Anal. Chem, 2022, 94, 2901–2911. [DOI] [PubMed] [Google Scholar]
- 34.Tsai KL, Wang SM, Chen CC, Fong TH and Wu ML, J. Physiol, 1997, 502, 161–174. [DOI] [PMC free article] [PubMed] [Google Scholar]
- 35.Wang YL and Floor E, J. Neurochem, 1998, 70, 646–652. [DOI] [PubMed] [Google Scholar]
- 36.Liu Y, Zhou J, Wang LL, Hu XX, Liu XJ, Liu MR, Cao ZH, Shangguan DH and Tan WH, J. Am. Chem. Soc, 2016, 138, 12368–12374. [DOI] [PubMed] [Google Scholar]
- 37.Lee MH, Park N, Yi C, Han JH, Hong JH, Kim KP, Kang DH, Sessler JL, Kang C and Kim JS, J. Am. Chem. Soc, 2014, 136, 14136–14142. [DOI] [PMC free article] [PubMed] [Google Scholar]
- 38.Loor G and Schumacker PT, Cell Death Differ., 2008, 15, 686–690. [DOI] [PubMed] [Google Scholar]
- 39.Kujan O, Shearston K and Farah CS, J. Oral Pathol. Med, 2017, 46, 246–252. [DOI] [PubMed] [Google Scholar]
- 40.Fan YS, Lu M, Yu XA, He ML, Zhang Y, Ma XN, Kou JP, Yu BY and Tian JW, Anal. Chem, 2019, 91, 6585–6592. [DOI] [PubMed] [Google Scholar]
- 41.Tang ZX, Yan Z, Gong LL, Zhang L, Yin XM, Sun J, Wu K, Yang WJ, Fan GW, Li YL and Jiang HQ, Anal. Chem, 2022, 94, 14778–14784. [DOI] [PubMed] [Google Scholar]
Associated Data
This section collects any data citations, data availability statements, or supplementary materials included in this article.


