Abstract
The κ-opioid receptor (KOR) represents a highly desirable therapeutic target for treating not only pain but also addiction and affective disorders1. However, the development of KOR analgesics has been hindered by the associated hallucinogenic side effects2. The initiation of KOR signalling requires the Gi/o-family proteins including the conventional (Gi1, Gi2, Gi3, GoA and GoB) and nonconventional (Gz and Gg) subtypes. How hallucinogens exert their actions through KOR and how KOR determines G-protein subtype selectivity are not well understood. Here we determined the active-state structures of KOR in a complex with multiple G-protein heterotrimers—Gi1, GoA, Gz and Gg—using cryo-electron microscopy. The KOR–G-protein complexes are bound to hallucinogenic salvinorins or highly selective KOR agonists. Comparisons of these structures reveal molecular determinants critical for KOR–G-protein interactions as well as key elements governing Gi/o-family subtype selectivity and KOR ligand selectivity. Furthermore, the four G-protein subtypes display an intrinsically different binding affinity and allosteric activity on agonist binding at KOR. These results provide insights into the actions of opioids and G-protein-coupling specificity at KOR and establish a foundation to examine the therapeutic potential of pathway-selective agonists of KOR.
Subject terms: Cryoelectron microscopy, Pharmacology
Active-state structures of the κ-opioid receptor in complexes with the G-protein heterotrimers Gi1, GoA, Gz and Gg provide insights into the actions of hallucinogenic opioids and G-protein-coupling specificity at the κ-opioid receptor.
Main
Opioid receptors are G-protein-coupled receptors (GPCRs) that have important roles in pain sensation. Almost all clinically used opioids act through the μ-opioid receptor (MOR). However, their use is associated with severe side effects, including a high potential for abuse, addiction and death due to respiratory depression in overdose3. The magnitude of these problems has led to a search for opioid alternatives for the treatment of pain and related conditions4. The activation of opioid receptors recruits downstream effectors, including heterotrimeric G proteins (including Gα, Gβ and Gγ subunits) and β-arrestins. Specifically, opioid receptors primarily couple to the Gαi/o family (Gi1, Gi2, Gi3, GoA, GoB, Gz and gustducin (Gg)) (Extended Data Fig. 1a). Some of these subtypes can mediate non-overlapping signalling pathways depending on the GPCR involved5–8. Whether signalling through individual pathways has redundant roles or separately drives the therapeutic efficacy and side effects of opioids remains mostly unclear.
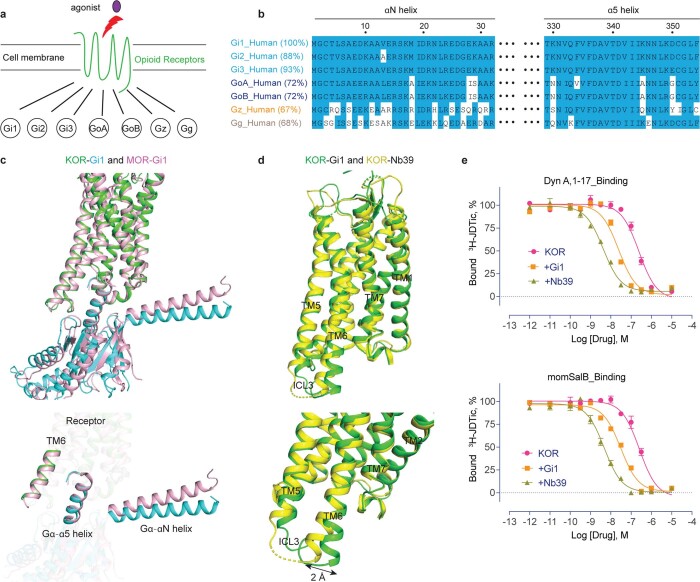
Extended Data Fig. 1. Comparison of KOR-Gi1 complex structure with MOR-Gi1 and active-state KOR-Nb39 structures.
a. Opioid receptors primarily couple to Gi/o family subtypes upon activation. b. Sequence alignment (αN and α5 helices) of Gαi/o family subtypes. The percentage represents the sequence similarity related to Gi1 (set as 100%). c. Overall alignment of KOR-Gi1 and MOR-Gi1 structures. The two structures are globally similar to each other, including TM6 of the receptor and α5 helix of the Gα subunit, but different in the αN helix of Gα. d. The Gi1-bound KOR differs from the Nb39-bound KOR in the degrees of TM6 outward movement (by 2 Å). e. Both Gi1 and Nb39 act as positive allosteric modulators of KOR, but differentially increase the binding affinity of KOR agonists. Data are grouped data ± s.e.m. from n = 3 biological replicates. Full quantitative parameters from this experiment are listed in Supplementary Table 8.
KOR is a highly desirable therapeutic target for treating not only pain but also addiction and affective disorders. KORs have gained increasing attention owing to their unique analgesic activity—they are predominantly expressed in pain-related neurons, and drugs that target KOR do not lead to addiction or cause death due to overdose as observed for MOR agonists1. The lack of rewarding/euphorigenic effects initially encouraged the development of KOR-agonist drugs as non-addictive analgesics9. Potent and selective KOR agonists have been developed, and these agonists produce effective peripheral and central analgesia. However, mood disorders such as dysphoria and psychotomimesis have been frequently observed as side effects of KOR agonists, which has limited their therapeutic application2. Here we determined the atomic structures of KOR in complex with different G-protein transducers and hallucinogenic ligands to help to elucidate the actions of opioids and the molecular basis for Gαi/o subtype selectivity.
Overall structures of KOR–G-protein complexes
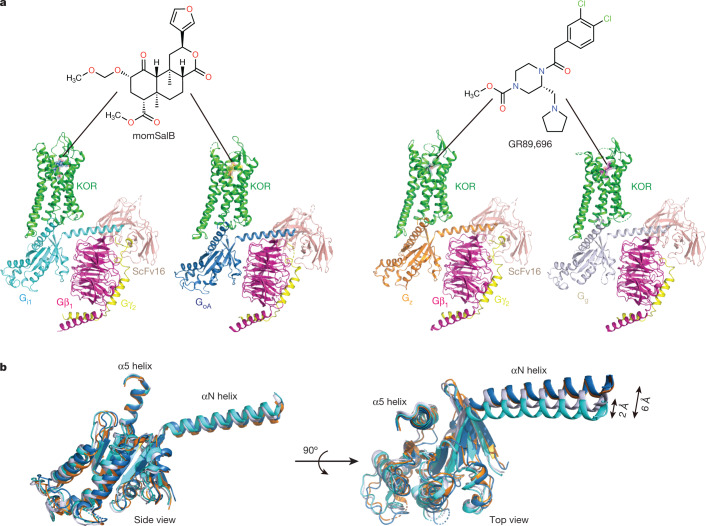
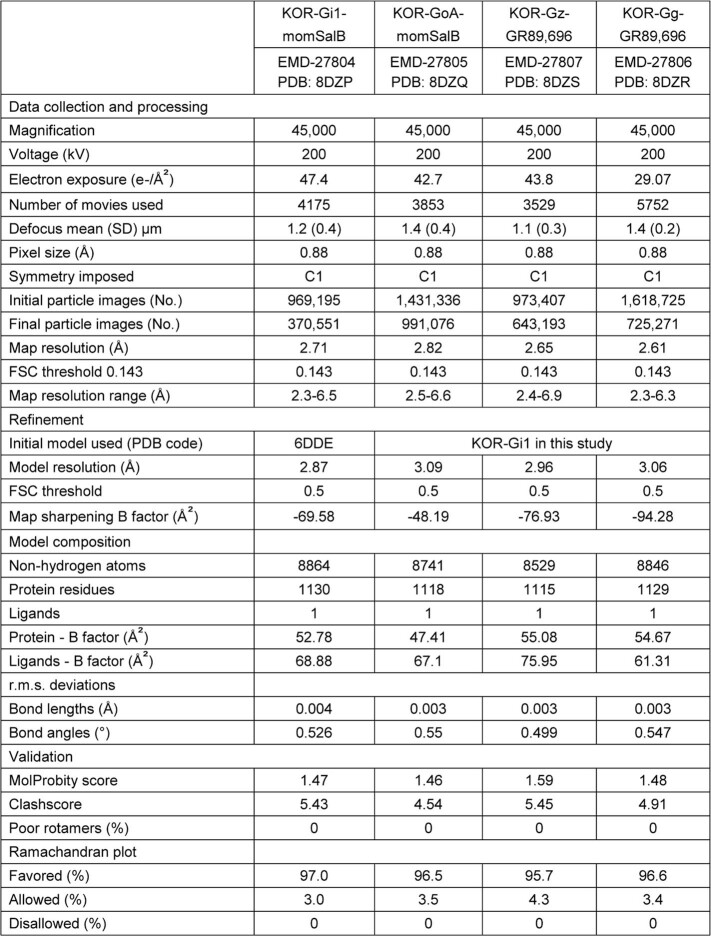
Although many efforts have been dedicated to the structural and molecular basis underlying the differences between G-protein and arrestin signalling, the roles of individual G-protein subtypes and the molecular determinants of subtype selectivity remain largely unclear. Sequence alignment of the seven Gi/o subtypes suggests that they could be further grouped into four subclasses on the basis of sequence identity (Gi1, Gi2 and Gi3; GoA and GoB; and Gz and Gg) (Extended Data Fig. 1b). To further understand the role of KOR–G-protein coupling and signalling, we determined the structures of KOR in complexes with four representative Gi/o subtypes (Gi1, GoA, Gz and Gg) at nominal resolutions of 2.71 Å, 2.82 Å, 2.65 Å, and 2.61 Å, respectively, using single-particle cryo-electron microscopy (cryo-EM; Fig. 1a, Supplementary Fig. 1 and Extended Data Table 1). In particular, KOR–Gi1 and KOR–GoA are bound to a psychotropic salvinorin analogue, methoxymethyl-salvinorin B (momSalB)10. However, cryo-EM experiments of KOR–Gz or KOR–Gg bound to momSalB yielded only low-resolution reconstructions (resolution of around 4.5–5 Å) that prevented the delineation of detailed molecular interactions. Thus, we leveraged another highly potent KOR agonist, GR89,696 (ref. 11), to obtain high-resolution structures of KOR–Gz and KOR–Gg.
Fig. 1. Cryo-EM structures of KOR in complex with Gi/o family subtypes.
a, Cartoon representations of KOR–G-protein complexes. Structures of KOR–Gi1 and KOR–GoA are bound to momSalB. Structures of KOR–Gz and Gg are bound to GR89,696. b, Structural alignment of the four Gα subunits. Distances of movement from the N terminus are labelled.
Extended Data Table 1.
Cryo-EM data collection, refinement, and validation statistics
The high-resolution maps of the four structures enabled unambiguous modelling of the agonist-bound heterotrimeric complexes (Supplementary Fig. 2). The overall differences between the four structures are subtle (root mean square deviations (r.m.s.d.) of 0.5 Å), with the exception of the Gα subunit in each complex (Fig. 1b). G-protein interactions with the receptor are canonically driven by the α5 and the N-terminal (αN) helices of the Gα subunit. The overlay of the four different G-protein subtypes showed that they adopt similar conformations in the α5 helix but differ in the extent of movement in the αN helix (Fig. 1b). In particular, relative to Gi1, both GoA and Gz exhibit a 6 Å displacement in the αN helix, whereas Gg has a smaller 2 Å displacement. Notably, alignments of the MOR–Gi1 structure12 with KOR–Gi1 indicate that the αN helix of Gi1 in MOR displays a position that is distinct from that of KOR–Gi1, whereas the α5 helix shows an orientation and interaction pattern similar to those in KOR (Extended Data Fig. 1c).
The overall structures of KOR in the Gi1/oA/z/g-bound states are similar to the previously reported nanobody-stabilized active conformation (KOR–Nb39)13 (r.m.s.d., 0.8 Å) (Extended Data Fig. 1d). Notably, a comparison of these two structures reveals that the intracellular end of transmembrane helix 6 (TM6) in the KOR–Gi1 protein complex moves 2 Å closer to TM7. Nb39 stabilizing a different receptor conformation is further supported by its positive allosteric ability to enhance agonist binding affinity (Extended Data Fig. 1e). Another feature unique to G-protein-bound KOR is the presence of a well-defined intracellular loop 3 (ICL3) conformation that is absent in the Nb39-stabilized KOR, presumably due to its inherent flexibility (Extended Data Fig. 1d). Similar differences have also been captured between MOR–Gi112 or β2AR–Gs14 and their corresponding nanobody-stabilized active states15,16, which further corroborate that a nanobody can stabilize a conformational state that mimics but is not identical to the G-protein-coupled state.
Interactions of KOR with hallucinogenic salvinorins
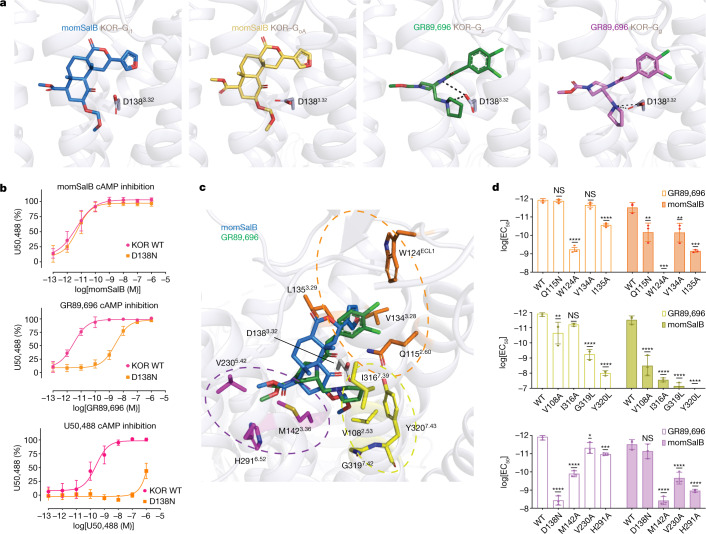
KORs have a prominent role in the modulation of human perception. Salvinorins, such as salvinorin A (SalA)17,18, are a group of naturally occurring hallucinogens with dissociative effects elicited by activating the central KORs. momSalB is a semi-synthetic analogue of SalA and displays similar in vivo pharmacology compared to SalA19,20. GR89,696 is a potent and long-lasting KOR agonist that produces antinociception and dysphoria but with unknown hallucinogenic properties21. Different binding poses of momSalB and GR89,696 were observed in the KOR orthosteric pocket. This is consistent with their divergent chemical structures—GR89,696 is an alkaloid (containing basic nitrogen atoms) and momSalB is a terpenoid (lacking basic nitrogen atoms) (Fig. 1a). The pyrrolidine nitrogen atom in GR89,696, as well as many other ligands including KOR’s endogenous dynorphin ligands22, is essential for the binding to KOR and enables the ligand to act as a hydrogen-bond (H-bond) donor and forms a salt bridge with the carboxylate side chain of Asp1383.32 in the binding pocket (where the superscript values indicate Ballesteros–Weinstein numbering for GPCRs23) (Fig. 2a). As salvinorin ligands (such as momSalB) lack the basic nitrogen atom, there are no attractive electrostatic interactions observed between the salvinorins and Asp1383.32. Indeed, neither D1383.32A nor D1383.32N (the mutation in KOR DREADD24) showed detrimental effects in the binding affinity or agonistic potency of SalA, whereas both mutants abolished the interaction with endogenous dynorphin ligands24–26. The mutation D1383.32N resulted in a significant loss of potency in U50,488 and GR89,696, but had minimal effects on momSalB (Fig. 2b). The side chain of Asp1383.32 pointing to the methoxymethyl group of momSalB also explains an interesting observation that D1383.32N could further enhance the binding affinity and potency of SalA and salvinorin B (SalB)24, probably due to the switch from the unfavourable acceptor–acceptor interaction to attraction resulting from the new H-bond interactions between the side chain of mutated asparagine and methoxy oxygen of the ligand.
Fig. 2. Ligand-specific interactions with KOR.
a, The binding poses of momSalB and GR89,696 in their respective complex structures. The salt bridge or H-bond interactions in Gz- and Gg-coupled structures are shown as black dashed lines. This salt bridge or H-bond interaction is absent in momSalB-bound KOR. b, The highly conserved anchoring residue Asp1383.32 has a different role in momSalB, GR89,696 or U50,488-mediated KOR activation. Data are normalized to the percentage of the reference agonist U50,488. Data are grouped data ± s.e.m. of n = 3 biological replicates. The full quantification parameters for this experiment are provided in Supplementary Table 1. c, Specific residues in the orthosteric pockets that interact with momSalB or GR89,696. Note that the I1353.29L mutation was included in KOR structure constructs to increase the expression level. d, Mutagenesis screening of binding-pocket residues using G-protein-mediated cAMP inhibition assays. The effect on the potency of momSalB or GR89,696 was quantified on the basis of the log[EC50] values. Data are log[EC50] ± s.e.m. of n = 3 biological replicates. Statistical significance for each mutant was calculated using one-way analysis of variance (ANOVA) with Dunnett’s multiple-comparison test compared with the wild type (WT); *P < 0.05, **P < 0.01, ***P < 0.001, ****P < 0.0001; NS, not significant. GR89,696: P = 0.016 (V230A), P = 0.0008 (H291A), P = 0.1758 (V134A), P = 0.9814 (Q115N), P = 0.006 (V108A), P = 0.1165 (I316A); momSalB: P = 0.344 (D138N), P = 0.0009 (W124A), P = 0.0064 (V134A), P = 0.0068 (Q115N), P = 0.0002 (I135A). The full quantification parameters for this experiment are provided in Supplementary Table 2.
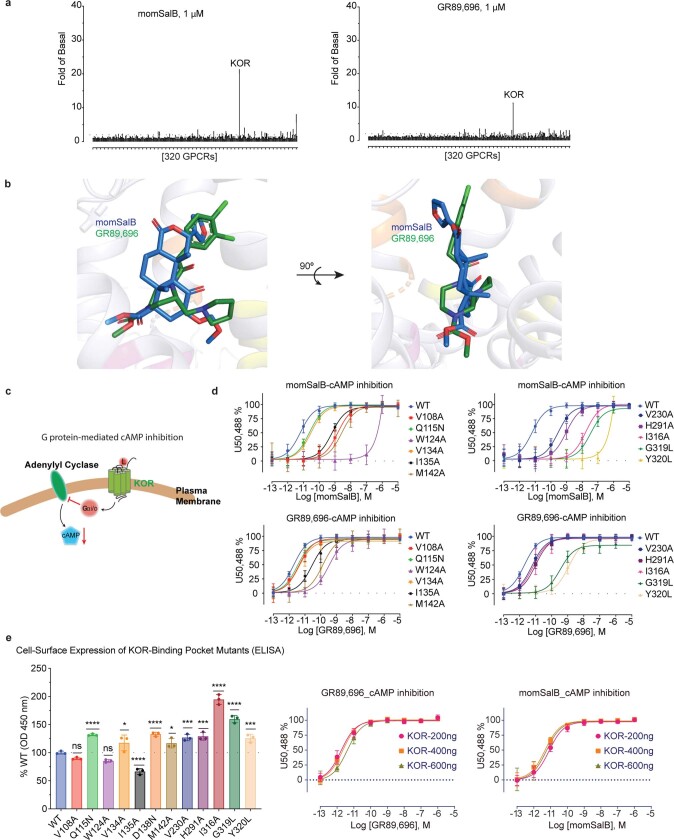
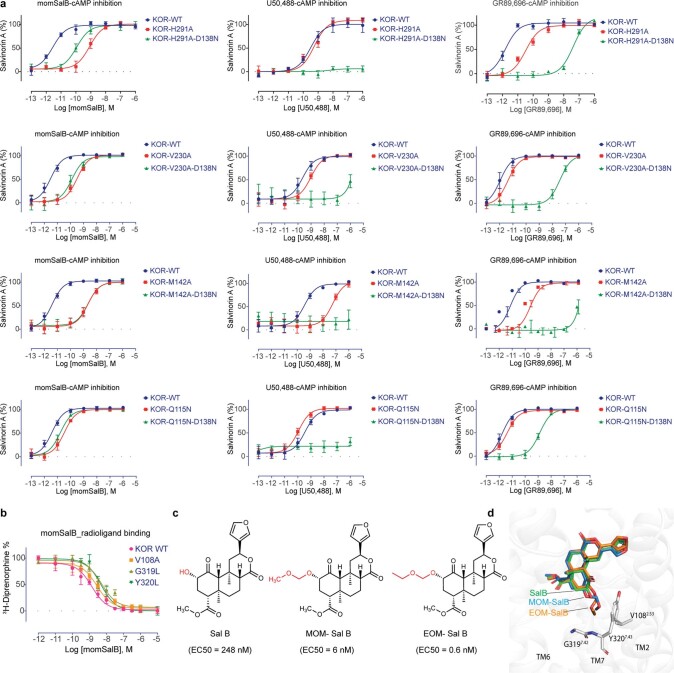
Both momSalB and GR89,696 are highly selective and potent agonists at KOR (Fig. 2b and Extended Data Fig. 2a), making them ideal templates to investigate the molecular determinants for ligand selectivity and efficacy. Although the two agonists overlap in the orthosteric binding pocket of KOR, the core rings occupy different planes that are perpendicular to each other (Extended Data Fig. 2b). As a result, the subgroups of the two ligands form different interactions with residues in the corresponding subpockets (Fig. 2c). Mutations of the majority of residues in these subpockets reduced the agonist activity of momSalB or GR89,696, but with different amplitudes (for example, Val1082.53, Gln1152.60, Met1423.36, Val2305.42 or His2916.52) (Fig. 2d and Extended Data Fig. 2c–e). The observation that the binding-pocket mutations have greater effects on momSalB-mediated cAMP inhibition than GR89,696 (for example, for H2916.52A, Δlog[median effective concentration (EC50)mutant−WT] = 2.23 ± 0.25 (momSalB) and 0.78 ± 0.27 (GR89,696)) is probably due to the lack of the anchoring interactions with Asp1383.32, which makes salvinorins more sensitive to other residue contacts. The double mutation in KOR (for example, D1383.32N and H2916.52A, pEC50 = 9.95 ± 0.06) displays a less deleterious effect on the potency of momSalB than H2916.52A does (pEC50 = 9.08 ± 0.06) alone (Extended Data Fig. 3a). A 2-fold to 2.5-fold improvement in potency was also observed from other mutations (Q1152.60N or V2305.42A) in combination with D1383.32N when compared with the single mutation without D1383.32N (Extended Data Fig. 3a). This effect might be specific to momSalB or salvinorin ligands as the double mutations (V2305.42A/D1383.32N or H2916.52A/D1383.32N) led to an inactive U50,488 or a further loss of potency for GR89,696-mediated cAMP inhibition in V2305.42A/D1383.32N (9,120-fold) or H2916.52A/D1383.32N (1,288-fold) compared with the respective single mutation (Extended Data Fig. 3a). Another major difference between momSalB and GR89,696 is that momSalB mainly forms hydrophobic interactions with residues that specifically contribute to the high potency of momSalB, such as Val1082.53, Val1343.28, Val2305.42 and Ile3167.39. In particular, Val1082.53 has also been indicated as a determinant of ligand selectivity between KOR and MOR or DOR, as the latter two opioid receptors have an Ala2.53 at the corresponding position27. Another hydrophobic pocket formed by the side chains of Val1082.53 and Tyr3207.43 and the backbone of Gly3197.42 appears to be a key determinant for agonist activity and receptor activation, as mutations of these residues significantly decreased or eliminated signal transduction of momSalB with a threefold reduction in its ligand-binding affinity (Fig. 2d and Extended Data Fig. 3b). Notably, the amplitude of interactions with residues in this hydrophobic pocket positively correlates with agonist potency because ligands with more extended interacting groups—such as SalB (-O-H), momSalB (-O-CH2-O-CH3) and ethoxymethyl SalB (-O-CH2-O-CH2-CH3) (Extended Data Fig. 3c,d)—have displayed increased potency in activating KOR19. This subpocket at the bottom of the ligand-binding pocket acts as a potential allosteric connector to initiate the conformational changes of other microswitch motifs, including the sodium site, CW6.48xxP and Pro5.50-Ile3.40-Phe6.44 motifs28,29.
Extended Data Fig. 2. The binding pharmacology of momSalB and GR89,696.
a. GPCRome screening at 320 GPCRs that measures agonist activity of tested ligands shows that momSalB and GR89,696 are selective at KOR. b. The binding poses of momSalB and GR89,696 show that they adopt different planes in the orthosteric pocket. c. A cartoon model of G protein-mediated cAMP reporter assays. The Gαi/o here represents all subtypes expressed in the cells. d. Mutagenesis screening of key binding-pocket residues using G protein-mediated cAMP reporter assay. Data are grouped data ± s.e.m. of n = 3 biological replicates. Full quantitative parameters from this experiment are listed in Supplementary Table 2. e. Measurement of cell surface expression of KOR binding pocket mutants by ELISA. In general, these mutants maintained robust cell surface expression. Although some mutations significantly altered surface expression compared to the wild type, the increased or decreased expression appeared to minimally affect the potency in agonist-mediated cAMP inhibition. Bar-graphs are OD450 ± s.e.m. from n = 3 biological replicates. Statistical significance for each mutant is compared in a one-way analysis of variance (ANOVA) with Dunnett’s multiple comparisons test to the wild type (* = p < 0.05, ** = p < 0.01, *** = p < 0.001, **** = p < 0.0001, “ns” represents no significance; V108A: p = 0.3919, W124A: p = 0.0893, V134A: p = 0.0308, M142A: p = 0.0398, V230A: p = 0.0004, H291A: p = 0.0002, Y320L: p = 0.0008). Signalling curves are grouped data ± s.e.m. of n = 3 biological replicates. Full quantitative parameters from this experiment are listed in Supplementary Table 9.
Extended Data Fig. 3. Molecular determinants of momSalB agonism.
a. The positive effect of additional D1383.32N mutation on the momSalB-mediated cAMP inhibition through KOR. The additional D1383.32N mutation does not rescue U50,488 or GR89,696-mediated cAMP inhibition. Data are grouped data ± s.e.m. from n = 3 biological replicates. Full quantitative parameters from this experiment are listed in Supplementary Table 10. b. Effects of mutations in the hydrophobic pocket on the binding affinity of momSalB. Data are grouped data ± s.e.m. from n = 3 independent biological replicates. Full quantitative parameters from this experiment are listed in Supplementary Table 11. c and d. Chemical structures of SalB, momSalB, and EOM-SalB. Differences are highlighted by red colour. The agonist activity of each analogue is shown in the parentheses. Data for EOM-SalB was taken from ref. 19. Binding poses of SalB and EOM-SalB at KOR were revealed by molecular docking performed in the Schrodinger Maestro v12.9. The three ligands occupy a similar binding pocket with different extents toward the hydrophobic pocket.
The overall binding pose of GR89,696 in KOR–Gz is similar to that in KOR–Gg. One notable difference is that GR89,696 forms stronger salt-bridge interactions with Asp1383.32 (2.9 and 3.4 Å) in KOR–Gz than those in KOR–Gg (3.5 and 3.9 Å) (Fig. 2a and Supplementary Fig. 3), which probably contributes to the higher potency in activating Gz compared with Gg (ref. 30). Mapping the atomic distances between the ligand and receptor showed that GR89,696 makes closer contact with residues in the KOR–Gz structure than in the KOR–Gg structure (in terms of distance), whereas momSalB in KOR–Gi1 and KOR–GoA largely overlaps and displays similar strength (Supplementary Fig. 3). For example, GR89,696 in KOR–Gz also forms H-bond interactions with Gln1152.60 (2.8 Å) and His2916.52 (3.3 Å), and, in KOR–Gg, Gln1152.60 (3.9 Å) and His2916.52 (4.0 Å). This suggests that GR89,696 leads to more contractions of the ligand-binding pocket in the presence of Gz compared with Gg.
Structural basis of G-protein subtype selectivity
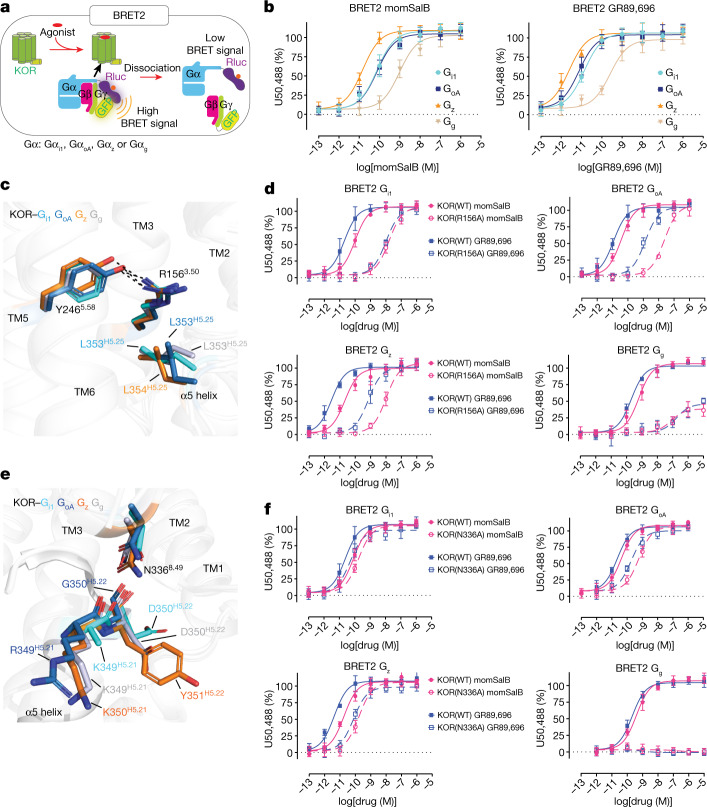
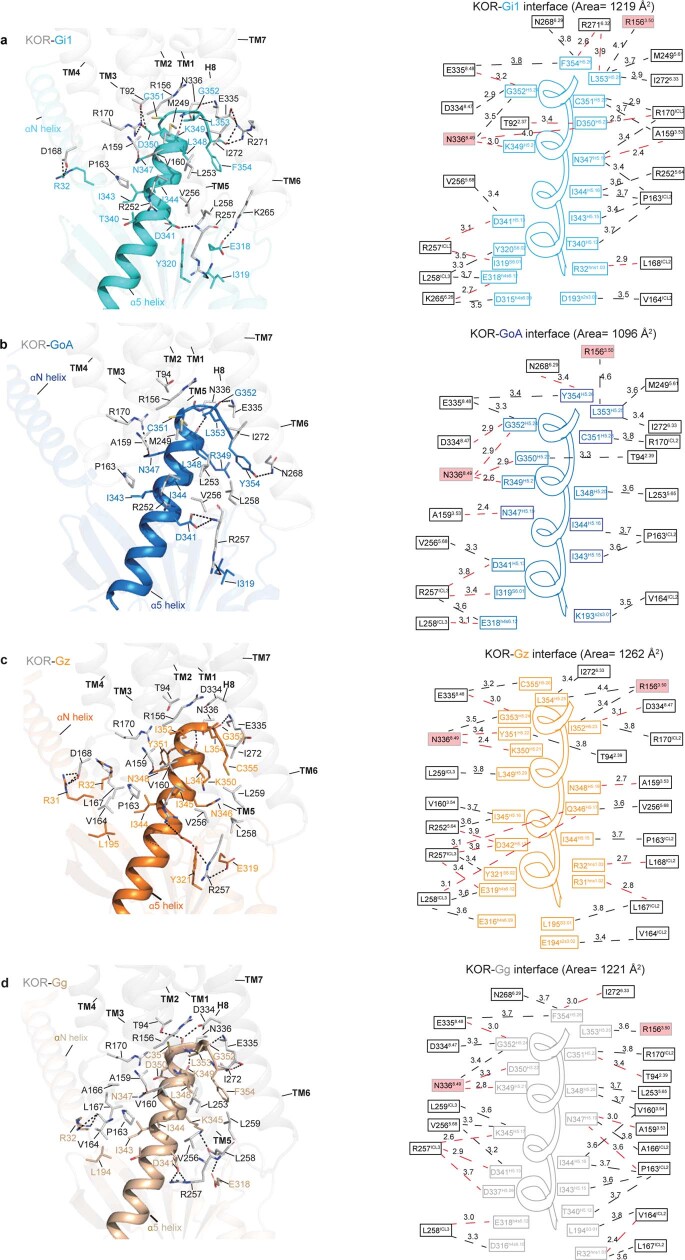
Similar to other opioid receptors, KOR exclusively couples to the Gi/o family30, including the canonical Gi/o subtypes (Gi1, Gi2, Gi3, GoA and GoB) and the noncanonical Gz and Gg. Whereas Gz is predominantly expressed in the central nervous system, Gg is the endogenous transducer of taste receptors, such as the bitter taste receptor 2 (TAS2R). Mice expressing engineered KORs in bitter-receptor cells show a strong aversion to a designed KOR agonist (inert to endogenous wild-type KOR but active in engineered KOR)31, suggesting that the KOR–Gg interaction and signalling may also occur in vivo. Using bioluminescence resonance energy transfer (BRET)-based transducerome profiling (Fig. 3a), we confirmed that both momSalB and GR89,696 could activate all four G-protein subtypes, although with different potencies (Fig. 3b). The primary interaction sites in KOR bound to different Gi/o subtypes involve nearly the entire intracellular regions of the receptor (ICL2, ICL3, TM3, TM5, TM6, TM7 and helix 8) and the αN and α5 helices of the Gα subunits (Extended Data Fig. 4). The key residues involved in KOR–G-protein interactions were mapped (Extended Data Fig. 4) and screened by alanine substitutions. In this section, we first report the effects of interface residues from the KOR side and then the residues from the Gα protein side.
Fig. 3. Comparison of the receptor–G-protein-binding interface of the KOR–Gi1, KOR–GoA, KOR–Gz and KOR–Gg complexes.
a, Schematic of the BRET2 assay. b, momSalB- or GR89,696-mediated G-protein-subtype activation measured by BRET2. Data are grouped data ± s.e.m. of n = 4 biological replicates. The full quantification parameters for this experiment are provided in Supplementary Table 3. c, Interactions of Arg1563.50 in the Asp (D)-Arg (R)-Tyr (Y) motif with KOR and Gα. d, Mutagenesis analysis of Arg1563.50 by BRET2. Data are grouped data ± s.e.m. of n = 3 biological replicates. The full quantification parameters for this experiment are provided in Supplementary Table 4. e, Interactions of Asn3368.49 in different KOR–G-protein complexes. f, The N3368.49 A mutation differentially affects KOR-mediated G-protein subtype activation. Data are global fit of grouped data ± s.e.m. of n = 3 independent biological replicates. The full quantification parameters for this experiment are provided in Supplementary Table 4.
Extended Data Fig. 4. Comparison of interface details and areas between KOR and each G protein subtypes.
Specific interactions between the receptor and individual Gα subunits, Gi1 (a), GoA (b), Gz (c) and Gg (d). (Cartoon) Key residues from the intracellular side of KOR, and residues in the αN and α5 helix were mapped out. The H-bond or salt-bridge interactions are shown as red dashed lines. The closest distances between the intracellular KOR residues and the Gα residues were labelled. The distance cutoff is 4 Å. The interface area was calculated by the online server PDBePISA77.
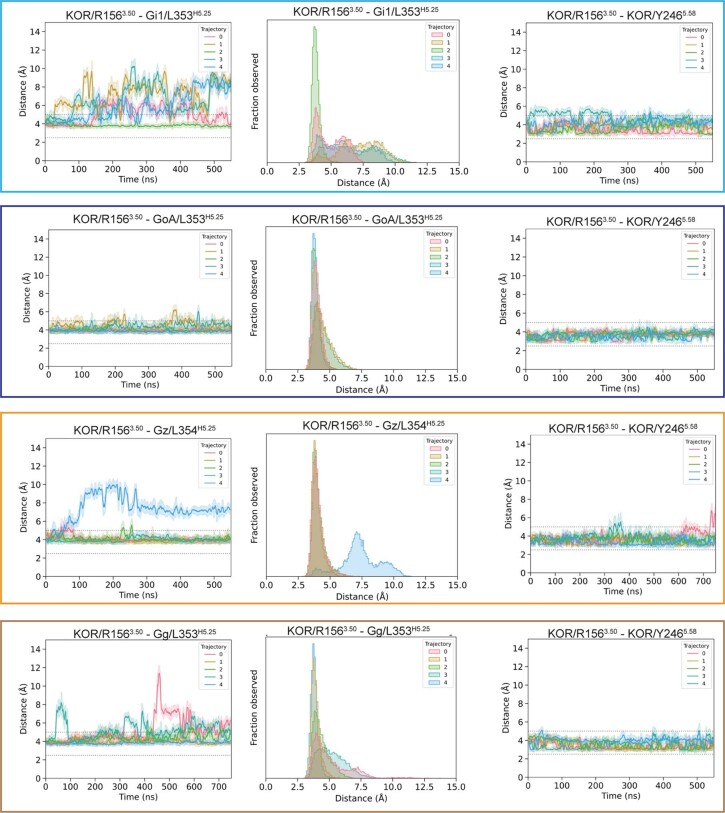
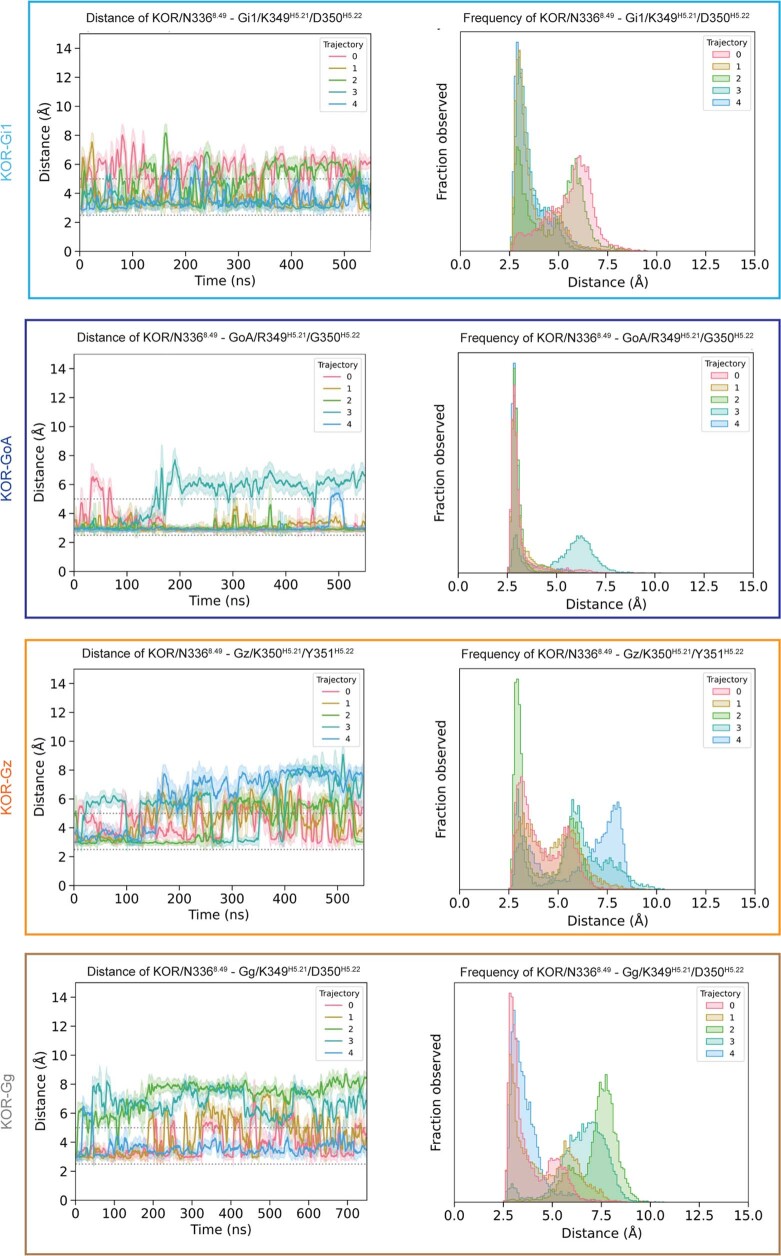
Although the KOR conformations in each G-protein-bound structure are similar to each other, notable differences were observed for the KOR residues involved in receptor–G-protein interactions. Mutagenesis screening using G-protein-mediated cAMP inhibition assays suggested that almost all of the residues on the KOR side contribute to KOR–G-protein signalling (Extended Data Fig. 5a,b). That was further confirmed by the BRET-based transducer profiling, which showed that mutations of these residues on the intracellular KOR side decreased agonist-mediated Gi1, GoA, Gz and Gg coupling (Extended Data Fig. 5c and Supplementary Fig. 4). Although most of the residues in the KOR interface affect the four G-protein couplings in a similar manner (Supplementary Fig. 4), some display subtype selectivity. Arg1563.50 is a highly conserved residue in the classic Asp3.49-Arg3.50-Tyr3.51 motif that has been implicated in having an important role in receptor activation and signal transduction (Fig. 3c). An ‘ionic lock’ has been frequently observed between Arg3.50 and Glu6.30 in class A GPCRs, keeping the receptor in an inactive state with TM3 and TM6 in close proximity. Thus, the breaking of this ionic lock is an important step towards the coupling of G proteins, as the TM6 movement away from TM3 is critical for penetration of the G-protein α5 helix into the cytoplasmic pocket12. The R1563.50A mutation significantly reduced the potency of agonist-mediated activation by momSalB or GR89,696 (Fig. 3d). Furthermore, R1563.50A specifically reduced the efficacy of agonist-mediated Gg activation, momSalB (WT (106 ± 3%) versus R1563.50A (38 ± 5%)) or GR89,696 (WT (103 ± 3%) versus R1563.50A (46 ± 7%)) (Fig. 3d and Extended Data Fig. 5d). In the inactive-state KOR32, the partially formed ionic lock is between Arg1563.50 and Thr2736.34; in the fully active KOR–agonist–G-protein states, this interaction is broken due to the insertion of the α5 helix of Gα protein, leading to the release of the side chain of Arg1563.50 to extend towards TM7 and form hydrophobic interactions with the second-to-last leucine (Leu353H5.25 in Gαi1, GαoA or Gαg; Leu354H5.25 in Gαz) of the Gα subunits (superscript notes for G proteins represent the CGN numbering system33) (Fig. 3c). This is further supported by the molecular dynamics simulations showing that the KOR-Arg1563.50 can form hydrophobic interactions with Gα-L353H5.25 or Leu354H5.25 maintaining <4 Å distances with these side chains (Extended Data Fig. 6). In this extended conformation, the KOR-Arg1563.50 guanidine group also forms a persistent H bond with Tyr2465.58 observed in all four complexes (Fig. 3c and Extended Data Fig. 6). These data suggest that the KOR-Arg1563.50 has an important role in KOR activation by directly interacting with the G proteins. A recent study also suggested that G proteins might need to precouple to the receptor and break the Arg1563.50-mediated ionic interaction before agonist binding and signalling34. Other important interactions are formed by residue Asn3368.49 in helix 8 of KOR, which engages different H-bond interactions with the backbone of the α5 helix in each Gα protein, such as Lys/ArgH5.21 and Gly/Asp/TyrH5.22 (Fig. 3e and Extended Data Fig. 4). The molecular dynamics simulations also provide support for these interactions, suggesting dynamic patterns of switches between specific interaction pairs (Extended Data Fig. 7). The mutation N3368.49A completely abolished KOR–Gg coupling (for example, momSalB), and a 2-fold loss in potency in Gi1, 14-fold in GoA or 9-fold in Gz coupling (Fig. 3f). Together with the effects observed from Arg1563.50 and Asn3368.49, these data indicate that these residues have differential roles in G-protein association, probably by engaging at different intermediate stages. The observation that several mutations have the largest effect on Gg compared with the other Gi/o subtypes suggests a non-canonical role of Gg in KOR-mediated signalling.
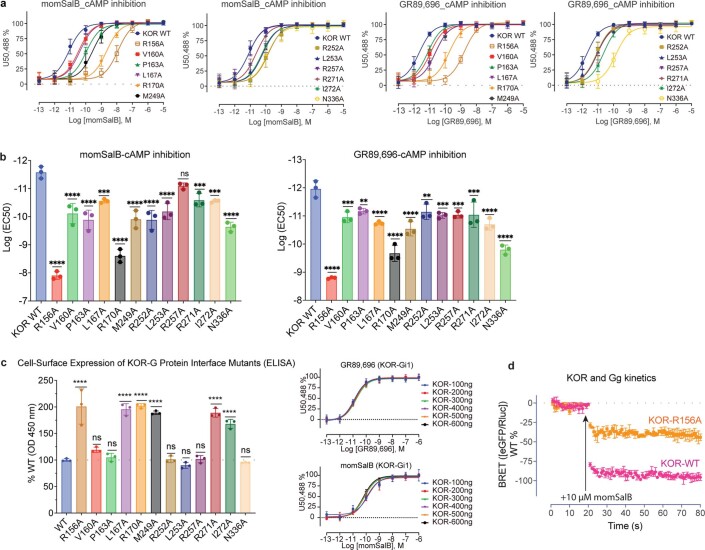
Extended data Fig. 5. The effect of KOR-G-protein interface residues on the G protein coupling.
a. Mutagenesis screening of KOR-G protein interface (KOR side) residues by cAMP inhibition assays. Data are grouped data ± s.e.m. from n = 3 biological replicates. b. Mutagenesis analysis of intracellular KOR residues by cAMP inhibition assays. Data are mean LogEC50 ± s.e.m. from n = 3 biological replicates. Statistical significance for each mutant is compared in a one-way analysis of variance (ANOVA) with Dunnett’s multiple comparisons test to the wild type (* = p < 0.05, ** = p < 0.01, *** = p < 0.001, **** = p < 0.0001, “ns” represents no significance, GR89,696: V160A: p = 0.0001, P163A: p = 0.0020, R252A: p = 0.0014, L253A: p = 0.0003, R257A: p = 0.0003, R271A: p = 0.0004; momSalB: L167A: p = 0.0003, R257A: p = 0.1514, R271A: p = 0.0004, I272A: p = 0.0002). Full quantitative parameters from this experiment are listed in Supplementary Table 12. c. Measurement of cell surface expression of KOR-G protein interface mutants by ELISA. The BRET results suggest a minor effect with different concentrations of KOR plasmids. Bar-graphs are OD450 ± s.e.m. from n = 3 independent biological replicates. Statistical significance for each mutant is compared in a one-way analysis of variance (ANOVA) with the Dunnett’s multiple comparisons test to the wild type (* = p < 0.05, ** = p<0.01, *** = p < 0.001, **** = p < 0.0001, “ns” represents no significance; V160A: p = 0.2732, P163A: p = 0.9992, R252A: p = 0.9998, L253A: p = 0.8943, R257A: p = 0.9997, N336A: p = 0.9992). Signalling curves are grouped data ± s.e.m. of n = 3 biological replicates. Full quantitative parameters from this experiment are listed in Supplementary Table 13. d. The KOR-R156A mediated decrease of efficacy was confirmed by the BRET2-based kinetic measurement. Data are net BRET ± s.e.m. from n = 3 independent biological replicates.
Extended Data Fig. 6. Molecular dynamics (MD) simulations reveal distance traces of interactions between the KOR residues (R1563.50) with Gα protein residues.
MD simulations revealed the distance traces and frequency between KOR-R1563.50 and L353/354H5.25 in the α5 of each Gα subunit. The position of KOR-R1563.50 is also supported by the stable interaction with KOR-Y2465.58. Five independent simulations of KOR-G complex (coral, orange, green, cyan, blue) are shown, spanning 0.55-0.75 μs of cumulative time per system, with the sampling rate of 10 frames per ns, solid lines and same-colour shadows representing moving average values and one standard deviation respectively from 50 frames in all cases.
Extended Data Fig. 7. Molecular dynamics (MD) simulations reveal distance traces of interactions between the KOR residues (N3368.49) with Gα protein residues.
The closest distances of polar residues N3368.49 in KOR with residues in Gi1, GoA, Gz, or Gg are shown. Distance histograms for each plot are also shown in parallel. Five independent simulations of KOR-G complex (coral, orange, green, cyan, blue) are shown, spanning 0.55 μs (KOR-Gi1, GoA, Gz) and 0.75 μs (KOR-Gg) of cumulative time per system, with the sampling rate of 10 frames per ns, solid lines and same-colour shadows representing moving average values and one standard deviation respectively from 50 frames in all cases.
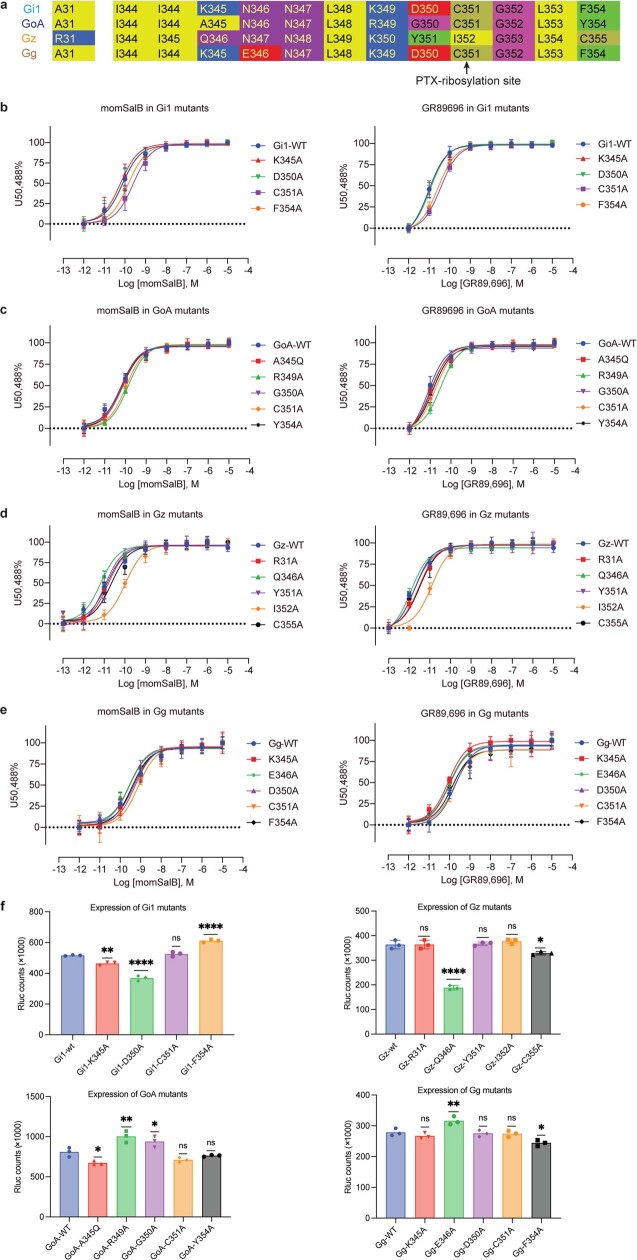
Next, we examined the Gα subunit by mutating the non-conserved residues in the αN or α5 helix to alanine (Extended Data Fig. 8a). However, we did not observe significant changes in the potency of agonist-mediated G-protein activation in BRET2 assays (Extended Data Fig. 8b–f and Supplementary Fig. 5). One exception is that C351H5.23A in Gαi1/oA/g or I352H5.23A in Gαz led to a significant decrease in potency for momSalB or GR89,696-mediated G-protein activation. This Ile352H5.23 in Gαz, compared with the corresponding Cys351H5.23 in other Gi/o subtypes, is known as the site that makes Gαz insensitive to pertussis toxin. The relative conformation of the α5 helix has been implicated as a key determinant between Gs and Gi specificity, in which the α5 helix adopts distinct positions and results in a larger outward movement of TM6 (13 Å in β2AR–Gs versus 9 Å in MOR–Gi1)12,35,36. The subtle differences in the α5 helix conformation of Gαi1/oA/z/g and the mutational evidence suggest that the G-protein-coupling specificity in the Gi/o family is probably determined by a more complex and/or dynamic three-dimensional network interaction37,38.
Extended Data Fig. 8. The role of G protein interface residues on KOR-G protein coupling.
a. The nonconserved residues in the G protein α5 and αN helices. b-e. The effects of individual mutations in each G protein subtype were screened using the BRET2 KOR-G protein assays. Data are grouped data ± s.e.m. from n = 3 biological replicates. Full quantitative parameters from this experiment are listed in Supplementary Table 14. f. The expression levels of G protein mutants were quantified based on the luminescence counts from the Gα-Rluc excitation. Data are BRET ratio ± s.e.m. from n = 3 biological replicates. Statistical significance for each mutant is compared in a one-way analysis of variance (ANOVA) with Dunnett’s multiple comparisons test to the wild type (* = p < 0.05, ** = p<0.01, *** = p < 0.001, **** = p < 0.0001, “ns” represents no significance; Gi1-K345A: p = 0.0015, Gi1-C351A: p = 0.7984; GoA-A345Q: p = 0.0210, GoA-R349A: p = 0.0019, GoA-G350A: p = 0.0284, GoA-C351A: p = 0.1102, GoA-Y354A: p = 0.6955; Gz-R31A: p > 0.9999, Gz-Y351A: p = 0.9947, Gz-I352A: p = 0.5286, Gz-C355A: p = 0.0161; Gg-K345A: p = 0.5849, Gg-E346A: p = 0.0050, Gg-D350A: p = 0.9936, Gg-C351A: p = 0.9808, Gg-F354A: p = 0.0091).
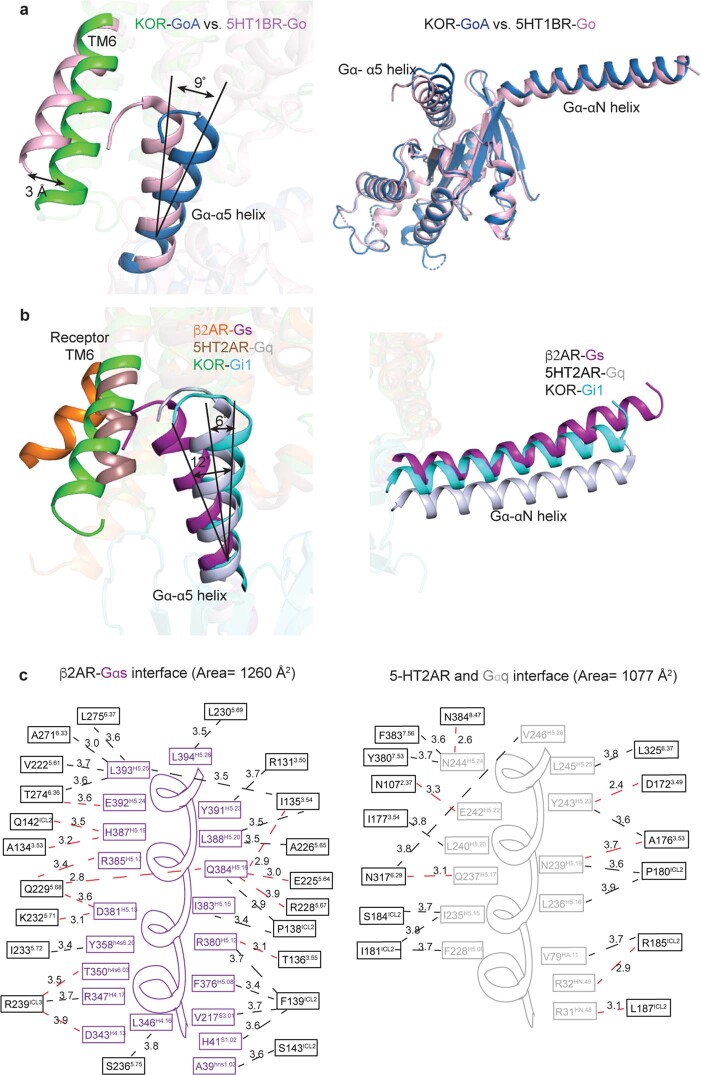
The overall interfaces of Gαi1, GαoA, Gαz and Gαg with KOR are highly conserved (Extended Data Fig. 4), but there are critical differences in the α5 and αN helices. The major contacts made by GαoA with KOR are through residues in the α5 helix (Extended Data Fig. 4b), whereas contacts made by Gαi1, Gαz and Gαg involve regions in both the α5 and αN helices (Extended Data Fig. 4a,c,d). Similarly, the 5HT1BR–Go39 interaction is also mediated solely by the α5 helix, but a structural comparison between KOR–GαoA and 5HT1BR–Go shows that the α5 helix in 5HT1BR–Go tilts an additional 9°, leading to a larger 3 Å outward movement of TM6 (Extended Data Fig. 9a). Alignment of the cytoplasmic regions of KOR–Gαi1, β2AR–Gαs and 5HT2AR–Gαq shows that the α5 helices are positioned differently. There are 6° and 12° tilts of the C-terminal end away from the plane of the membrane compared with Gαq and Gαs, respectively, leading to different magnitudes of outward movement of TM6 (Extended Data Fig. 9b). As a result of intracellular conformational differences, the KOR–Gαi1 forms an interface area of 1,219 Å2 (Extended Data Fig. 4a), compared with a slightly larger area of β2AR–Gαs (1,260 Å2) and a much smaller area of 5HT2AR–Gαq (1,077 Å2) (Extended Data Fig. 9c). Whereas Gαi1, Gαz and Gαg have similar interface areas (1,219, 1,262 and 1,221 Å2, respectively) (Extended Data Fig. 4a,c,d), GαoA has a much smaller area (1,096 Å2) (Extended Data Fig. 4b). Notably, the 822 Å2 surface area of Go in contact with 5HT1BR39 is closer to that of KOR and GαoA compared with other G-protein subtypes, suggesting a shared mechanism between different GPCRs and the same G protein.
Extended Data Fig. 9. Comparison of KOR-coupled Gα subunit with other G protein families.
a. The KOR-GoA displays a different conformation from the 5-HT1BR-miniGo structure, including both TM6 of the receptor and α5 helix of the Gα subunit. b. Comparison of receptor-G protein interface among Gs, Gi1, Gq bound complexes. The TM6 of the receptor, αN and α5 helices of the Gα subunits adopt different conformations. c. The receptor-Gα interface of β2AR-Gαs and 5-HT2AR-Gαq. The dashed lines represent the closest distance between the intracellular receptor residues and the Gα residues. The distance cutoff is 4 Å. The interface area shown in the brackets was calculated by the online server PDBePISA.
Intrinsic differences in G-protein subtypes
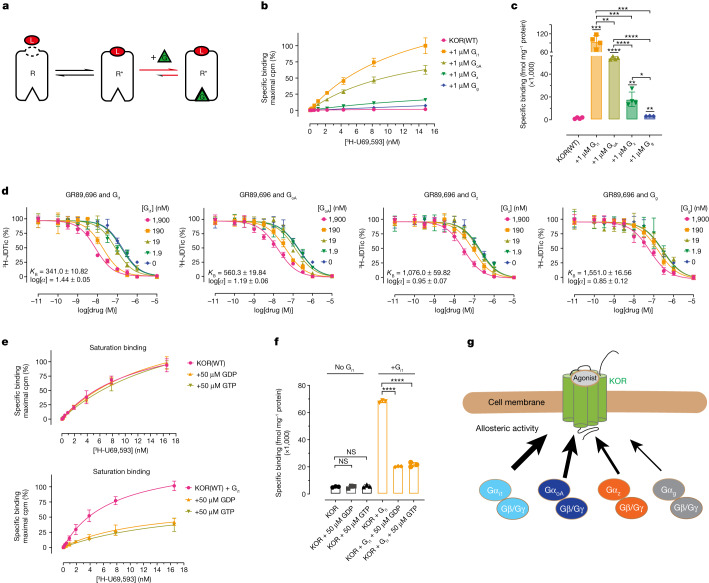
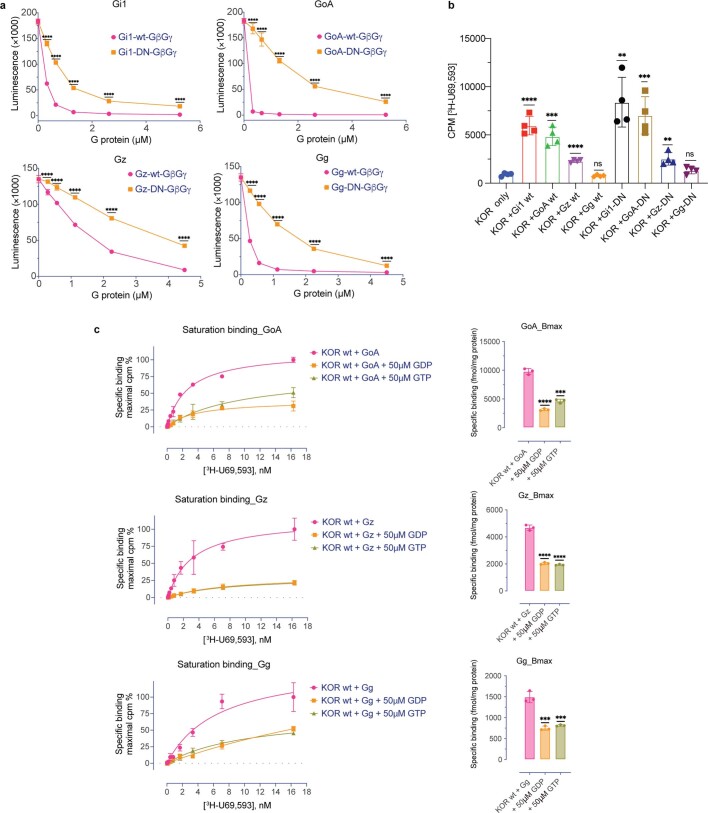
GPCR signalling is transduced through the allosteric changes between the extracellular ligand pocket and the intracellular G-protein-binding pocket. Conformational changes induced by agonist binding can enhance the binding affinity of G-protein heterotrimers. Conversely, G protein acts as a positive allosteric modulator and further enhances agonist-binding affinity by stabilizing the ternary complex40 formed by the receptor, ligand and G proteins (Fig. 4a). We next sought pharmacological evidence to test whether G-protein subtypes have intrinsic differences, including binding affinity and allosteric activity at KOR in the presence of agonists. On the basis of the ternary complex model41, the high-affinity agonist-binding states should increase in the presence of G-protein heterotrimers, as the latter can stabilize the active-state receptor favouring agonist binding. We performed saturation binding assays to test the binding of agonist radioligand 3H-U69,593 to KOR in the presence of Gi1, GoA, Gz and Gg. Notably, the four G proteins display substantial differences in the allosteric enhancement of agonist binding (Fig. 4b,c). Compared with the wild type alone (Bmax = 1,350 ± 116), the high-affinity binding sites for 3H-U69,593 were increased 62-, 38-, 14- and 7-fold in the presence of Gi1 (Bmax = 84,324 ± 4,214), GoA (Bmax = 52,086 ± 2,465), Gz (Bmax = 18,623 ± 1,468) and Gg (Bmax = 9,866 ± 3,493), respectively. These data are consistent with the ternary model that at least two binding states predominate in the unliganded receptor42—a high-affinity (G-protein-coupled) and a low-affinity (G-protein-uncoupled) binding state. We also compared the wild-type G proteins with the engineered G proteins used in our structural determination and observed similar patterns of Bmax increases (Extended Data Fig. 10b).
Fig. 4. The intrinsic differences of individual G-protein subtypes.
a, Schematic of the GPCR–G-protein–ligand ternary model. G, G protein; L, agonist; R, receptor. b, KOR saturation binding reveals that G proteins potentiate agonist binding with different amplitudes. Data are global fit of grouped data ± s.e.m. from n = 4 independent biological replicates. c, Summary of Bmax values in the presence of G proteins. Statistical analysis between groups was performed using the unpaired two-tailed Student’s t-tests; P = 0.0001 (KOR + Gi1 versus KOR), P = 0.0021 (KOR + Gz versus KOR), P = 0.0075 (KOR + Gg versus KOR), P = 0.0081 (KOR + Gi1 versus KOR + GoA), P = 0.0004 (KOR + Gi1 versus KOR + Gz), P = 0.0007 (KOR + Gi1 versus KOR + Gg) and P = 0.0116 (KOR + Gz versus KOR + Gg). d, Competition binding reveals that G proteins have a different binding affinity and allosteric activity on KOR. Data are global fit of grouped data ± s.e.m. of n = 3 independent biological replicates. e, The effect of GDP or GTP on the allosteric activity of G proteins. Data are global fit of grouped data ± s.e.m. of n = 3 independent biological replicates. f, Summary of Bmax values in the presence or absence of GDP/GTP. Statistical analysis was performed using unpaired two-tailed Student’s t-tests compared with the KOR or KOR + Gi1 group; P = 0.9874 (KOR + 50 μM GDP versus KOR), P = 0.4147 (KOR + 50 μM GTP versus KOR). g, A representative model of different allosteric activity of Gi/o family subtypes (Gi1 > GoA > Gz > Gg). The full quantification parameters for the experiments in b, d and e are provided in Supplementary Tables 5–7, respectively.
Extended Data Fig. 10. The presence of GDP or GTP reduces the allosteric potentiation of GoA, Gz, or Gg, respectively.
a. Comparison of functional activity between wild-type G proteins and engineered G proteins by GTP turnover assay. Data are luminescence ± s.e.m. of n = 3 biological replicates with each performed in triplicate. Significance analyses were performed using unpaired two-tailed student’s t-test to compare each point in engineered G protein (G protein-DN) to the corresponding point in wild-type G proteins. (* = p < 0.05, ** = p < 0.01, *** = p < 0.001, **** = p < 0.0001). b. Measurement of allosteric potentiation of engineered G proteins on KOR agonist binding. The concentration of 3H-U69,593 was 8 nM, and the G protein was 250 nM. DN, dominant negative. Data are cpm ± s.e.m. from n = 4 biological replicates. Significance analyses were performed using the unpaired two-tailed student’s t-test to compare each group to the KOR-only group (* = p < 0.05, ** = p < 0.01, *** = p < 0.001, **** = p < 0.0001, “ns” represents no significance; (KOR+GoAwt) vs KOR: p = 0.0002, (KOR+Ggwt) vs KOR: p = 0.2469, (KOR+Gi1DN) vs KOR: p = 0.0012, (KOR+GoADN) vs KOR: p = 0.0007, (KOR+GzDN) vs KOR: p = 0.0029, (KOR+GgDN) vs KOR: p = 0.0719). c. The saturation binding assays were conducted with or without 50 μM GDP/GTP. Data are Bmax ± s.e.m. from n = 3 biological replicates with each performed in duplicate. Statistical significance analyses between groups (with GTP/GDP and without GTP/GDP) are compared in the unpaired two-tailed student’s t-test (* = p < 0.05, ** = p < 0.01, *** = p < 0.001, **** = p < 0.0001; (KOR+GoA) vs (KOR+GoA+GTP): p = 0.0001, (KOR+Gg) vs (KOR+Gg+GDP): p = 0.0008, (KOR+Gg) vs (KOR+Gg+GTP): p = 0.0010). Full quantitative parameters from this experiment are listed in Supplementary Table 15.
The different magnitudes of Bmax increases among G-protein subtypes suggest that individual G proteins have different allosteric effects on ligand binding. To test this hypothesis, we next compared the cooperativity of the four G-protein subtypes by radioactive competition binding assays designed to quantify the G-protein binding affinity (KB) and cooperativity (α, G-protein cooperativity value, α > 1 indicates positive effects in increasing agonist affinity)43. The G-protein-insensitive antagonist radioligand 3H-JDTic was used for the following series of experiments. The inhibition of 3H-JDTic binding at KOR by GR89,696 progressively improved as the concentration of G protein increased, indicating positive cooperativity between G proteins and agonist binding (Fig. 4d). The calculated KB and α-cooperativity displayed a pattern similar to that observed in the saturation binding, in which Gi1 has the highest binding affinity and allosteric effects at KOR in the presence of agonists, and Gg has the least (Fig. 4d). The different binding affinities could have a role in G-protein-subtype selectivity, as G-protein subtypes with higher affinity can outcompete other G-protein subtypes, depending on subtype abundance, especially in cells expressing several or all Gi/o family subtypes.
Guanosine diphosphates (GDPs) or guanosine triphosphates (GTPs) are important regulators of GPCR–G-protein assembly and signalling44. We therefore examined whether the presence of GDP or GTP can affect the allosteric activity of G-protein subtypes. The specific binding of 3H-U69,593 was significantly reduced in the presence of GDP or GTP compared with the nucleotide-free state (Fig. 4e,f). The four G proteins exhibited a uniform pattern, showing similar responses to GDP or GTP (Extended Data Fig. 10c). These nucleotide-specific effects are consistent with the results of single-molecule studies of the β2AR–Gs complex showing that the presence of GDP or GTP accelerates the dissociation of β2AR and the Gs heterotrimer45, which is achieved through a sequential conformational change in the Gα subunit after the binding of GDP or GTP44,46. Note that the dominant negative Gi2 has been reported to abolish GTP binding and GTPase activity47; however, the engineered G proteins in this study appear to maintain the GTP binding affinity and GTP turnover activity, although at weaker levels compared with the wild type (Extended Data Fig. 10a).
Discussion
After activation, KOR can interact with up to seven G proteins, the coupling of which determines the direction of ligand-induced signalling. The seven G-protein subtypes are highly homologous but not structurally or functionally identical. The binding of signal transducers is coupled with specific receptor conformational changes, such as the magnitude of TM6 displacement. Such conformational differences have been observed in GPCRs bound to the Gs, Gi and Gq families. However, analysis of the four structures of KOR in complex with different Gi/o subtypes shows that the receptor adopts a similar conformation. In particular, the receptor conformations in KOR–Gz and KOR–Gg are nearly identical, although the bound agonist GR89,696 activates the two G proteins with a 100-fold difference in potency. This structural observation agrees with an original postulation that the cross-reactivity between receptors and G proteins speaks to the conservation of structure among the receptor-binding domains of the G proteins and the G-protein-binding domains of the receptors48. This conformational similarity, irrespective of transducer subtypes, has also been observed in other GPCRs engaging G proteins versus arrestins49. These subtle differences could be due to the limitation of the structures that reveal a well-resolved population of the nucleotide-free G-protein-bound conformational state of the receptor. These nucleotide-free states of Gα subunits (Gαi1, GαoA, Gαz and Gαg) tend to stabilize a specific conformational state of KOR. In the absence of G proteins or in the presence of nucleotide-bound G proteins, the receptor can adopt dynamic conformations that are different from that captured by nucleotide-free Gα45. Other approaches, including nuclear magnetic resonance (NMR)50 and molecular dynamics simulations51, have identified dynamic conformational states in the intracellular regions of the receptor related to transducer couplings in the presence of GDP or GTP.
Different GPCR–G-protein interfaces have been proposed to contribute to the differential kinetics of G proteins during association and dissociation with the receptor52,53. Our pharmacological characterization of the KOR–G-protein interface identified key residues that have different roles in G-protein coupling. The complexes that we targeted in this study displayed varying interface areas dependent on the receptors and G proteins. However, time-resolved studies are needed in the future for the direct measurement of G-protein association and dissociation rates, especially for different Gi/o subtypes, as the strength of the receptor–G-protein interface may be another factor that affects the coupling efficiency.
In the structures of KOR in complex with different G-protein subtypes, we also revealed the binding poses of two selective KOR agonists—momSalB and GR89,696. Although they occupied the same binding pocket, they adopted different conformations and interacting patterns, probably due to their unique chemical structures. GR89,696 displays stronger interactions in KOR–Gz than in KOR–Gg, which may contribute to its higher potency observed in the BRET2 assay. Owing to the unique scaffold and pharmacology of salvinorin ligands, extensive studies have been conducted to elucidate their binding and function13,25,26. Several residues or motifs in KOR (for example, Val1082.53, His2916.52, Ile3167.39) have been identified that are important for salvinorin’s agonism, which can now be explained by their direct interactions with momSalB. Notably, using multiple structural templates, previous salvinorin docking suggested different binding poses13,25,26, and our structures now provide direct evidence of how momSalB sits in the binding pocket of KOR.
We also observed allosteric differences among these highly conserved G-protein subtypes. As positive allosteric modulators, the four representative G proteins display distinct allosteric activity in potentiating agonist binding (Gi1 > GoA > Gz > Gg) (Fig. 4g). This is consistent with measurements of the binding affinity of different G proteins (Gi1 > GoA > Gz > Gg) at KOR. These intrinsic differences in G proteins, including the binding affinity and coupling efficiency, add pharmacological evidence to determinants for G-protein-subtype selectivity. Our structural observations from different G proteins in complex with KOR show that the Gi/o family subtypes share a highly conserved mechanism in interacting with KOR, but that each maintains pharmacological differences. Considering that many GPCRs can couple to different G-protein families, such as the β2AR coupling with both Gs and Gi/o (refs. 38,54), whether β2AR displays differential binding affinities with Gs and Gi/o may help to explain its G-protein coupling specificity.
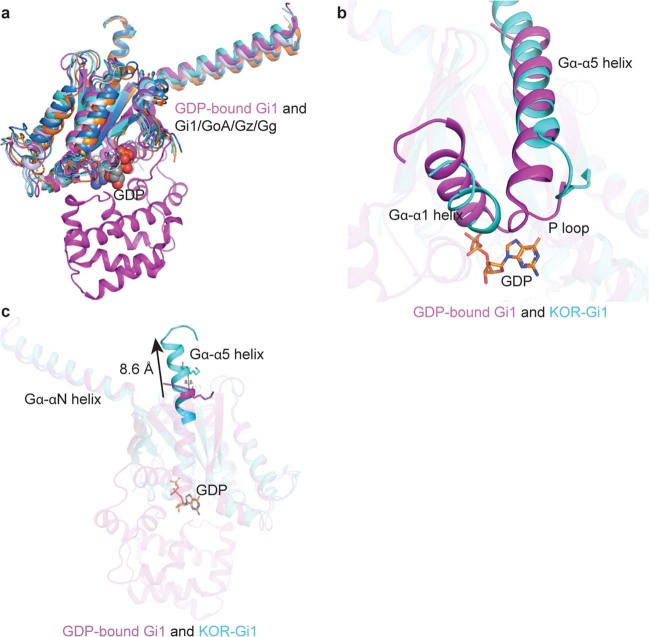
Furthermore, the allosteric activity of G proteins can be regulated by GDPs or GTPs that decouple G proteins from the receptor. It is known that nucleotide-specific conformations exist between nucleotide-free G proteins and GDP- or GTP-bound G proteins. When comparing the crystal structure of the uncoupled GDP-bound Gi1 heterotrimer55 and nucleotide-free (KOR–Gi1, GoA, Gz and Gg) heterotrimers (Extended Data Fig. 11a), several conformational displacements are noted (Extended Data Fig. 11b). The activated receptor engages the C terminus of the α5 helix of Gαi1, which undergoes an upward helical extension (8.6 Å) into the receptor core (Extended Data Fig. 11c) compared with the uncoupled G protein structure. The insertion of the α5 helix into the transmembrane helical bundle of the receptor has the following two consequences. First, the loop connecting the α5 helix and β6 strand moves outward 5 Å. Second, the movement of the α5 helix disrupts the original hydrophobic interactions between the α5 and α1 helices, leading to a displacement of the P loop. Both the P loop translocation and loss of coordination with GDPs are necessary for GDP release44,45. In agreement with the ternary complex model, our saturation binding data show that GDPs or GTPs act as negative regulators of agonist binding kinetics in the presence of G proteins. One limitation of this study is that we used an in vitro overexpressed system with engineered receptors and G proteins to measure ligand activity, which cannot be extended to in vivo without further experiments.
Extended Data Fig. 11. Comparison of uncoupled GDP-bound Gi1 and KOR-coupled nucleotide-free Gi1.
a. Comparison of GDP-bound Gi1 with KOR bound Gi1, GoA, Gz, and Gg. b. Conformational translocation of α1 and α5 helices upon GPCR engagement. c. α5 helix shows an 8.6 Å upward movement into the KOR intracellular core.
In summary, we have elucidated the molecular interaction details between highly conserved Gi/o subtypes and KOR using cryo-EM-derived atomic models. We have also examined the structural determinants of ligand selectivity and efficacy at KOR. Using structural pharmacology analysis, we revealed the intrinsic differences between these previously under-represented Gi/o subtypes and demonstrated that subtype selectivity is probably a combinational result of receptor conformational dynamics, the binding affinity of G proteins and cooperativity between agonist binding and G-protein coupling. Such findings are important both in understanding GPCR-mediated signalling and in the generation of new research tools and therapeutics based on the potential of G-protein-selective agonists.
Methods
Generation of constructs for cryo-EM
For the human KOR, we used a construct the same as the previously determined active-state KOR13. In brief, the construct (1) lacks N-terminal residues 1–53; (2) lacks C-terminal residues 359–380; (3) contains Met1–Leu106 of the thermostabilized apocytochrome b562 RIL (BRIL) from E. coli (M7W, H102I, R106L) in place of receptor N terminus residues Met1–His53. This N-terminal Bril will be removed using a PreScission cleavage site in the end. The single chain Fab scFv16 has the same sequence as previously reported56. A 6×His tag was added to the C-terminal scFv16 sequence with a PreScission cleavage site inserted between. For the G-protein heterotrimers, individual G-protein constructs (Gi1, GoA, Gz and Gg) were engineered (labelled as dominant negative, DN)47 for the binding of scFv16, and then subcloned into a designed vector that co-expresses the Gβ1 and Gγ2. Further modifications were made to enable a stable complex between KOR, G-protein heterotrimer and scFv16. Specifically, Gi1(DN) includes S47N, E245A, G203A and A326S. GoA(DN) includes C3S, S47N, G204A, E246A, A326S and M249K. For Gz(DN), the N-terminal sequence was replaced with the Gi2 sequence to allow for better interaction with scFv16; other mutations include S47N, G204A, E246A, R249K, N262D and A327S. For Gg(DN), the N-terminal sequence was replaced with the Gi2 sequence; other mutations include S47A, G203A, E245A, H248K, T261D, A326S and N251D.
Expression of KOR–G-protein–scFv16 complex
The Bac-to-Bac Baculovirus Expression System was applied to generate high-quality recombinant baculovirus (>10−9 viral particles per ml) for protein expression (KOR, G-protein heterotrimers and scFv16). For the expression of KOR–G–scFv16 protein complex, each heterotrimeric G protein, including Gα (Gi1, GoA, Gz or Gg), Gβ1 and Gγ2 was coexpressed with KOR and scFv16, respectively, by infection of Spodoptera frugiperda Sf9 cells at a cell density of 2.5 × 10⁶ cells per ml in ESF921 medium (Expression System) with the P1 baculovirus at a multiplicity of infection (MOI) ratio of 2:2:0.5. Cells were collected by centrifugation (125 rpm at 27 °C) for 48 h after infection, washed with HN buffer (25 mM HEPES pH 7.4, 100 mM NaCl), and stored at −80 °C for future purification.
Purification of the KOR–G-protein–scFv16 complex
The compounds used in this study—(−)-U50,488 (0496) and GR89,696 (1483)—were purchased from Tocris. momSalB was synthesized by a method described previously57. After purification by silica gel column chromatography, momSalB was a single spot on TLC (silica, 20% ethyl acetate, dichloromethane) with an Rf of 0.49. An NMR spectrum of momSalB was collected to confirm the chemical identity (Supplementary Fig. 6), which is consistent with the expected spectrum reported previously58.
We thawed the cell pellet and incubated it in buffer containing 20 mM HEPES pH 7.5, 50 mM NaCl, 1 mM MgCl2, 2.5 units Apyrase (NEB), 10 μM agonist (final concentration) and protease inhibitors (500 mM AEBSF, 1 mM E-64, 1 mM leupeptin, 150 nM aprotinin) for 1.5 h at room temperature. We then collected the membrane by centrifugation at 25,000 rpm for 30 min at 4 °C. The membrane was solubilized in buffer (40 mM HEPES pH 7.5, 100 mM NaCl, 5% (w/v) glycerol, 0.6% (w/v) lauryl maltose neopentyl glycol (LMNG), 0.06% (w/v) cholesteryl hemisuccinate (CHS), 10 μM agonist and protease inhibitors) with 200 μg scFv16 in the cold room. After 5 h, the supernatant was collected by centrifugation at 30,000 rpm for 30 min at 4 °C and incubated with 1 ml TALON IMAC resin (Clontech) and 20 mM imidazole overnight in the cold room. The next day, the resin was collected and washed with 10 ml buffer containing 20 mM HEPES pH 7.5, 100 mM NaCl, 30 mM imidazole, 0.01% (w/v) LMNG, 0.001% (w/v) CHS, 5% glycerol and 5 μM agonist. The protein was then eluted with the same buffer supplemented with 300 mM imidazole, concentrated and further purified by size-exclusion chromatography on the Superdex 200 increase 10/300 column (GE healthcare), which was pre-equilibrated with 20 mM HEPES pH 7.5, 100 mM NaCl, 100 μM TCEP, 0.00075% (w/v) LMNG, 0.00025% (w/v) glyco-diosgenin (GDN) and 0.00075% (w/v) CHS, 1 μM agonist. Peak fractions were collected, concentrated and incubated with PNGase F (NEB), PreScission protease (GenScript) to remove the potential glycosylation and N-terminal His–BRIL, respectively, and 100 μg scFv16 at 4 °C overnight. The next day, cleaved His–BRIL and protein, uncleaved protein and proteases were separated by the same procedure as described above. Peak fractions were concentrated to 3–5 mg ml−1 for electron microscopy analysis. Four KOR–G-protein–scFv16 complexes were purified according to the same procedure except that different agonists were used.
Expression and purification of scFv16 protein
The scFv16 protein was expressed by infection of Sf9 cells at a cell density of 2.5 × 10⁶ cells per ml in ESF921 medium (Expression System) with the P1 baculovirus at an MOI of 2. After 96 h, the cell culture medium containing secreted scFv16 protein was collected by centrifugation at 4,000 rpm for 15 min. The pH of the supernatant was adjusted to 7.5 by addition of Tris-base power. Chelating agents were quenched by the addition of 1 mM nickel chloride and 5 mM calcium chloride and incubation with stirring for 1 h at room temperature and 5 h in the cold room. We removed the precipitates by centrifugation and the resultant supernatant was further cleaned with 0.45 μm filter paper, and incubated with 2 ml Ni-NTA resin and 10 mM imidazole overnight in the cold room. The Ni-NTA resin was washed the next day with 20 ml buffer (20 mM HEPES pH 7.5, 100 mM NaCl, 0.00075% (w/v) LMNG, 0.000075% (w/v) CHS, 0.00025% (w/v) GDN, 20 mM imidazole). The protein was eluted with the same buffer supplemented with 300 mM imidazole, concentrated and further purified on the Superdex 200 increase 10/300 column. Monomeric fractions were pooled, concentrated, flash-frozen in liquid nitrogen and stored at −80 °C until future use.
Expression and purification of heterotrimeric G proteins
The expression of heterotrimeric G protein was achieved by infection of Sf9 cells at a cell density of 2.5 × 10⁶ cells per ml in ESF921 medium (Expression System) with the P1 baculovirus at an MOI of 2. After 48 h, cells were collected and lysed in buffer containing 200 mM NaCl, 40 mM HEPES pH 7.5, 0.2% Triton X-100, 5% glycerol, 3 mM β-me and protease inhibitors. The supernatant was isolated by centrifugation at 40,000 rpm for 50 min and incubated with 1 ml Ni-NTA resin and 20 mM imidazole overnight at 4 °C. The resin was collected the next day and washed with 20 ml buffer containing 100 mM NaCl, 20 mM HEPES pH 7.5, 5% glycerol, 20 mM imidazole and 3 mM β-me. The protein was then eluted with elution buffer (300 mM NaCl, 20 mM HEPES pH 7.5, 5% glycerol, 3 mM β-me and 300 mM imidazole), concentrated and further purified on the Superdex 200 increase 10/300 column, which was pre-equilibrated with buffer the same as the elution buffer except without the imidazole. The peak fractions were concentrated, flash-frozen in liquid nitrogen and stored at −80 °C for future binding assays.
Cryo-EM data collection and 3D reconstruction
The purified samples (3–4 μl) were applied to glow-discharged 300-mesh Au grids (Quantifoil R1.2/1.3) individually and vitrified using a Vitrobot mark IV (Thermo Fisher Scientific). Cryo-EM imaging was performed on the Talos Artica system operated at 200 kV at a nominal magnification of ×45,000 using a Gatan K3 direct electron detector at a physical pixel size of 0.88 Å. Each stack video was recorded for 2 to 2.7 s in 60 frames at a dose rate of about 15 e− px−1 s−1, leading to a total exposure dose indicated in Extended Data Table 1. Videos were collected automatically with SerialEM59 using an optimized multishot array procedure60.
Dose-fractioned image stacks were processed for beam-induced motion correction followed by contrast transfer function estimation. Particles were selected using Blob particle picker, extracted from the micrograph and then used for 2D classification and 3D classification followed by non-uniform refinement. All of these steps were performed in cryoSPARC61,62.
Model building and refinement
Maps from cryoSPARC were used for map building, refinement and subsequent structural interpretation. The dominant-negative Gi1 trimer model and scFv16 model were adapted from the cryo-EM structure of the MRGPRX2–Gi1 complex (Protein Data Bank (PDB): 7S8M)63. GoA, Gz and Gg trimer models were built from the Gi1 trimer model, followed by mutating the non-conserved residues back to the wild-type GoA, Gz and Gg. The receptor KOR model was taken from the active-state KOR–Nb39 structure (PDB: 6B73)13. The receptor, G proteins and scFv16 were docked into the cryo-EM map using Chimera64. The complex models (KOR–G-protein–scFv16) were manually built in Coot65, followed by several rounds of real-space refinement using Phenix66. The model statistics were validated using Molprobity67. Structural figures were prepared using Chimera or PyMol (https://pymol.org/2/).
cAMP inhibition assay
For the KOR–Gαi-mediated cAMP inhibition assay, HEK293T (ATCC CRL-11268) cells were co-transfected with human KOR or various mutants along with a split-luciferase-based cAMP biosensor (GloSensor, Promega) at a 1:1 ratio (KOR:GloSensor). After 16 h, the transfected cells were plated into poly-l-lysine-coated 96-well white clear-bottom cell culture plates with DMEM + 1% dialysed FBS at a density of 40,000–50,000 cells per 200 μl per well and incubated at 37 °C with 5% CO2 overnight. The next day, 3× drug solutions were prepared in fresh drug buffer (20 mM HEPES, 1× HBSS, 0.3% bovine serum albumin (BSA), pH 7.4). The plates were decanted the next day and received 40 μl per well of drug buffer (20 mM HEPES, 1× HBSS, pH 7.4) followed by addition of 20 μl of 3× drug solutions for 15 min in the dark at room temperature. Cells then received 20 μl luciferin (4 mM final concentration) supplemented with isoproterenol (300 nM final concentration), stimulating the production of endogenous cAMP through β2 adrenergic Gs activation, and incubated in the dark at room temperature. After 15 min, luminescence intensity was quantified using the Mithras LB 940 multimode microplate reader (Berthold Technologies). Data were plotted as a function of drug concentration, normalized to percentage U50,488 stimulation, and analysed using log (agonist) versus response in GraphPad Prism (v.9.3.1).
BRET2 assay
To measure the agonist-stimulated G-protein (wild type and mutants) activation by KOR and various mutants, a BRET2-based cell assay was used. Specifically, four plasmids (KOR, Gα, Gβ, Gγ) were used, in which each Gα is tagged with a luciferase (Rluc8) and Gγ is tagged with an N-terminal GFP. Specifically, the Gαi1/Gβ3/Gγ9, GαoA/Gβ3/Gγ8, Gαz/Gβ3/Gγ1 and Gαg/Gβ3/Gγ1 combinations were used for BRET2 Gi1, GoA, Gz and Gg experiments, respectively. Detailed information of the GFP-Gγ and Gα-Rluc8 constructs was described previously30. HEK293T cells were then transfected with the four plasmids (KOR, Gα-Rluc8, Gβ, Gγ–GFP) using a 1:5:5:5 DNA ratio of receptor:Gα-RLuc8:Gβ:Gγ-GFP2 (100 ng receptor, 500 ng Gα–RLuc8, Gβ and Gγ–GFP2 for 10 cm dishes). Transit 2020 (Mirus Biosciences) was used to complex the DNA at a ratio of 2 μl Transit per μg DNA in Opti-MEM (Gibco-Thermo Fisher Scientific). Then, 16 h after transfection, cells were plated in poly-l-lysine-coated 96-well white clear-bottom plates in plating medium (DMEM + 1% dialysed FBS) at a density of 40,000–50,000 cells in 200 μl per well and incubated overnight. The next day, the plates were decanted and washed once with 60 μl drug buffer (20 mM HEPES, 1× HBSS, pH 7.4) and then 60 μl drug buffer containing coelenterazine 400a (Nanolight Technology) at a final concentration of 5 μM was added to each well. After 5 min for substrate diffusion, 30 μl 3× drug solutions in fresh drug buffer (20 mM HEPES, 1× HBSS, 0.3% BSA, pH 7.4) was added to each well and incubated for an additional 5 min. Finally, the plates were read on the Mithras LB 940 multimode microplate reader (Berthold Technologies) with 400 nm (RLuc8-coelenterazine 400a) and 510 nm (GFP2) emission filters for 1 s per well. The GFP to Rluc8 ratio was calculated, plotted as a function of drug concentration, normalized to percentage U50,488 stimulation and analysed using log (agonist) vs response in GraphPad Prism (v.9.3.1).
Radioligand-binding assay
Saturation binding assays were performed using the construct BRIL-wt-KOR(54–368) reconstituted into nanodiscs comprised of KOR, spMSP1D1 and lipid mixture (POPC:POPE:POPG = 3:1:1) at a molar ratio of 1:3:100. Binding assays were set-up in 96-well plates in standard binding buffer (50 mM Tris-HCl, 10 mM MgCl2, 0.1 mM EDTA, 0.1% BSA, pH 7.4) at room temperature. Saturation binding assays with 0.1–20 nM 3H-U69,593 in the standard binding buffer were performed to determine the equilibrium dissociation constant (Kd) and Bmax. To determine the effects of G proteins on 3H-U69,593 binding, each G protein (final concentration 1 μM) was incubated with 3H-U69,593 and homogenous membrane fractions for 3.5 h at room temperature. Data were analysed using GraphPad Prism (v.9.3.1) using a one-site model.
For the competitive binding assay, 3H-JDTic (0.68 nM), homogenous membrane fractions expressing KOR and 3× GR89,696 solutions were incubated in 96-well plates in standard binding buffer in the absence or presence of four G proteins in various concentrations (final concentration: 1,900 nM, 190 nM, 19 nM, 1.9 nM, 0 nM) for 3.5 h at room temperature in the dark, and then terminated by rapid vacuum filtration onto chilled 0.3% PEI-soaked GF/A filters followed by three quick washes with cold wash buffer (50 mM Tris-HCl, pH 7.4) and read. Results (with or without normalization) were analysed using GraphPad Prism (v.9.3.1) using one-site or allosteric IC50 shift models.
Cell-surface expression studies
The cell-surface expression levels of wild-type KOR and its mutants were measured using an enzyme-linked immunosorbent assay (ELISA). In brief, HEK293T (ATCC CRL-11268) cells were transiently transfected with wild-type KOR and KOR mutant DNA at the same quantity. After 24 h, cells were plated in poly-l-lysine-coated 96-well white clear-bottom plates in plating medium (DMEM + 1% dialysed FBS) at a density of 40,000–50,000 cells in 200 μl per well and incubated overnight. The next day, plates were decanted and fixed with 4% (w/v) paraformaldehyde for 10 min at room temperature. Cells were then washed twice with 1× phosphate-buffered saline (PBS) (pH 7.4) and blocked by 1× PBS containing 0.5% (w/v) non-fat milk for at least 30 min at room temperature followed by incubation with anti-Flag (M2)–horseradish peroxidase-conjugated antibodies (Sigma-Aldrich, A8592) diluted 1:20,000 in the same buffer for 1 h at room temperature. After washing three times with 1× PBS, 1-Step Ultra-TMB ELISA substrate (Thermo Fisher Scientific, 34028) was added to the plates and the plates were incubated at 37 °C for 15–30 min and terminated by addition of 1 M sulfuric acid (H2SO4) stop solution. Finally, the plates were read at a wavelength of 450 nm using the BioTek Luminescence reader. The data were analysed using GraphPad Prism (v.9.3.1).
G-protein expression studies
To measure the expression levels of four wild-type G proteins and their mutants, HEK293T (ATCC CRL-11268) cells were transiently transfected with the same quantity of wild-type and mutant G proteins DNA. After 16 h, cells were plated in poly-l-lysine-coated 96-well white clear-bottom plates in plating medium (DMEM + 1% dialysed FBS) at a density of 40,000–50,000 cells in 200 μl per well and incubated overnight. The next day, the plates were decanted and washed once with 60 μl drug buffer (20 mM HEPES, 1× HBSS, pH 7.4), then 60 μl drug buffer containing coelenterazine 400a (Nanolight Technology) at a final concentration of 5 μM was added to each well. After 5 min for substrate diffusion, plates were read in a Mithras LB 940 multimode microplate reader (Berthold Technologies) with 400 nm (RLuc8-coelenterazine 400a) and 510 nm (GFP2) emission filters for 1 s per well. The Rluc8 values represented the G-protein expression levels and were plotted in the GraphPad Prism (v.9.3.1).
GTP turnover assay
Analysis of GTPase activity of G proteins (Gi1, GoA, Gz, Gg) was performed by using a modified protocol of the GTPase-Glo assay (Promega). G proteins were serially (1:1) diluted into various concentrations with a buffer of 300 mM NaCl, 20 mM HEPES pH 7.5 and 1 mM DTT, and 5 μl was dispensed into each well of a 384-well plate. The reaction was initiated by adding 5 μl 1 μM GTP solution to 5 μl G proteins. After incubation for 90 min at room temperature, 10 μl reconstituted GTPase-Glo reagent was added to the sample and incubated for 30 min at room temperature. Luminescence was measured after addition of 20 μl detection reagent and incubation for 10 min at room temperature using the Mithras LB 940 multimode microplate reader (Berthold Technologies). The data were analysed using GraphPad Prism (v.9.3.1).
Molecular dynamics simulations
The Gromacs simulation engine (v.2020.3)68 was used to run all molecular dynamics simulations under the Charmm36 force-field topologies and parameters69,70. Charmm force-field parameters and topologies for the ligands momSalB and GR89,696 were generated using Charmm-GUI’s Ligand Reader & Modeller tool70. The loop grafting and optimization for modelling missing side chains and loops was performed in the ICM-Pro (v.3.9-2b) molecular modelling and drug discovery suite (Molsoft)71. The structurally conserved helix-8 (Hx8) amphipathic helical motifs in KOR were modelled using human antagonist-bound KOR (PDB: 4DJH)26 as the template structure. The lobe in Gi1, GoA, Gz and Gg proteins was modelled using a human agonist-bound CB2–Gi structure (PDB: 6PT0)72. Structure regularization and torsion profile scanning were performed using ICMFF force field73. The GR89,696-bound structures of KOR complexes with Gz and Gg proteins as well as momSalB-bound KOR with Gi1 and GoA proteins were then uploaded to the Charmm-GUI webserver69, where the starting membrane coordinates were determined by the PPM74 server using the Charmm-GUI interface. The complexes were then embedded in a lipid bilayer composed of 1,2-dipalmitoyl-sn-glycero-3-phosphatidylcholine (DPPC), 1,2-dioleoyl-sn-glycero-3-phosphatidylcholine (DOPC) and cholesterol (CHL1) following the recommended ratio of 0.55:0.15:0.30, respectively75. The GR89,696-bound KOR complex with Gz contained 330 DPPC, 90 DOPC and 180 CHL1 lipids, 64,400 water molecules, and 178 sodium and 176 chloride ions. The GR89,696-bound KOR complex with Gg contained 330 DPPC, 90 DOPC and 180 CHL1 lipids, 64,227 water molecules, and 184 sodium and 175 chloride ions. The momSalB-bound KOR complex with Gi1 contained 220 DPPC, 60 DOPC and 120 CHL1 lipids, 43,172 water molecules, 124 sodium and 116 chloride ions. The momSalB-bound KOR complex with GoA contained 220 DPPC, 60 DOPC and 120 CHL1 lipids, 41,663 water molecules, and 126 sodium and 113 chloride ions. All of the systems were first processed for 50,000 steps of initial energy minimizations, then 60 ns of equilibration, followed by production runs of up to 750 ns for the KOR–Gg based system and 550 ns for the rest (Gi1, GoA and Gz-bound KOR systems). The simulations were carried out on GPU clusters at the University of Southern California’s High-Performance Computing Center. The temperature of 310 K and v-rescale thermostat algorithm were used during the production run76. The analyses of molecular dynamics trajectories were performed using the GROMACS software package68.
Data statistical analysis
For BRET2 and cAMP-inhibition assays, in the case of more than two groups, log-transformed EC50 values were first analysed using one-way ANOVA. If significant, the Dunnett’s multiple-comparison test was used to compare each mutant with the wild-type one, and the Tukey’s multiple-comparison test was used to compare log-transformed EC50 values between each group. In the case of two groups, log-transformed EC50 values were analysed using unpaired two-tailed Student’s t-tests to compare each mutant with a wild-type receptor. For the cell-surface expression studies, the optical density at 450 nm values of each mutant were normalized to the wild-type KOR receptor (normalized as 100%), and the resultant values were then first analysed using one-way ANOVA. If significant, a Dunnett’s multiple-comparison test was used to compare each mutant with the wild-type receptor. For G-protein expression studies, the Rluc values of each mutant were normalized to the wild-type G protein (normalized as 100%), and the resultant values were then first analysed using one-way ANOVA. If significant, a Dunnett’s multiple-comparison test was used to compare each mutant with the wild-type G protein. For radioligand binding and GTP turnover assays, data were analysed using unpaired two-tailed Student’s t-tests. In one-way ANOVA and unpaired two-tailed Student’s t-test analysis, the significance threshold was set at α = 0.05. Asterisks denote statistical significance; *P < 0.05, **P < 0.01, ***P < 0.001; ****P < 0.0001; NS represents not significant.
Reporting summary
Further information on research design is available in the Nature Portfolio Reporting Summary linked to this article.
Online content
Any methods, additional references, Nature Portfolio reporting summaries, source data, extended data, supplementary information, acknowledgements, peer review information; details of author contributions and competing interests; and statements of data and code availability are available at 10.1038/s41586-023-06030-7.
Supplementary information
Supplementary Methods (allosteric IC50 shift model equation), Supplementary Figs. 1–6 and Supplementary Tables 1–17.
Acknowledgements
We thank J. Peck and J. Strauss for technical assistance in this project; the staff at the Washington University Center for Cellular Imaging for sample screening; the staff of the NIDA Drug Supply Program for providing the 3H-JDTic; X.-P. Huang and the members of the Psychoactive Drug Screening Program (PDSP) at UNC-Chapel Hill for the GPCRome screening analysis; and staff at the Center for Advanced Research Computing (CARC) at the University of Southern California for providing computing resources that have contributed to the research results reported within this publication. The work is supported by NIH grants R35GM143061 (to T.C.) and R01NS099341 (to P.Y.). The Titan X Pascal used for this research was donated to J.F.F. by NVIDIA.
Extended data figures and tables
Author contributions
J.H. prepared the four KOR–G protein complexes, performed the functional validation assays and prepared the manuscript. J.Z. helped with the cryo-EM data processing. A.L.N. and J.H.L. performed the molecular dynamics simulations. S.M.B. helped with construct optimization, sample preparation and saturation binding experiments. B.E.K. provided the expression plasmid for Gg. L.Z. helped with protein expression. V.A.R. and S.M. helped to collect the NMR spectrum of momSalB. D.E.N. synthesized the compound momSalB. V.K. supervised the molecular dynamics simulations and manuscript discussion. P.Y. helped with the map discussion. J.F.F. prepared grids, collected the cryo-EM data and resolved the cryo-EM density map. P.Y., J.F.F. and T.C. prepared the manuscript and supervised the project.
Peer review
Peer review information
Nature thanks Graham Ladds and the other, anonymous, reviewer(s) for their contribution to the peer review of this work. Peer reviewer reports are available.
Data availability
The coordinate and cryo-EM map of KOR–Gi1–momSalB, KOR–GoA–momSalB, KOR–Gz–GR89,696 and KOR–Gg–GR89,696 have been deposited at the PDB and Electron Microscopy Data Bank under accession codes 8DZP (EMD-27804), 8DZQ (EMD-27805), 8DZS (EMD-27807) and 8DZR (EMD-27806), respectively. All data supporting the findings of this study are available within the Article and its Supplementary Information.
Competing interests
The authors declare no competing interests.
Footnotes
Publisher’s note Springer Nature remains neutral with regard to jurisdictional claims in published maps and institutional affiliations.
Contributor Information
Jonathan F. Fay, Email: jfay@som.umaryland.edu
Tao Che, Email: taoche@wustl.edu.
Extended data
is available for this paper at 10.1038/s41586-023-06030-7.
Supplementary information
The online version contains supplementary material available at 10.1038/s41586-023-06030-7.
References
- 1.Chavkin C. The therapeutic potential of κ-opioids for treatment of pain and addiction. Neuropsychopharmacology. 2011;36:369–370. doi: 10.1038/npp.2010.137. [DOI] [PMC free article] [PubMed] [Google Scholar]
- 2.Pfeiffer A, Brantl V, Herz A, Emrich HM. Psychotomimesis mediated by kappa opiate receptors. Science. 1986;233:774–776. doi: 10.1126/science.3016896. [DOI] [PubMed] [Google Scholar]
- 3.Bruchas MR, Roth BL. New technologies for elucidating opioid receptor function. Trends Pharmacol. Sci. 2016;37:279–289. doi: 10.1016/j.tips.2016.01.001. [DOI] [PMC free article] [PubMed] [Google Scholar]
- 4.Che, T. & Roth, B. L. Structural insights accelerate the discovery of opioid alternatives. Annu. Rev. Biochem. 10.1146/annurev-biochem-061620-044044 (2021). [DOI] [PubMed]
- 5.Ivanina T, et al. Gαi1 and Gαi3 differentially interact with, and regulate, the G protein-activated K+ channel. J. Biol. Chem. 2004;279:17260–17268. doi: 10.1074/jbc.M313425200. [DOI] [PubMed] [Google Scholar]
- 6.Jeong SW, Ikeda SR. G protein alpha subunit Gαz couples neurotransmitter receptors to ion channels in sympathetic neurons. Neuron. 1998;21:1201–1212. doi: 10.1016/S0896-6273(00)80636-4. [DOI] [PubMed] [Google Scholar]
- 7.Wong GT, Gannon KS, Margolskee RF. Transduction of bitter and sweet taste by gustducin. Nature. 1996;381:796–800. doi: 10.1038/381796a0. [DOI] [PubMed] [Google Scholar]
- 8.Wall MJ, et al. Selective activation of Galphaob by an adenosine A1 receptor agonist elicits analgesia without cardiorespiratory depression. Nat. Commun. 2022;13:4150. doi: 10.1038/s41467-022-31652-2. [DOI] [PMC free article] [PubMed] [Google Scholar]
- 9.Beck, T. C., Hapstack, M. A., Beck, K. R. & Dix, T. A. Therapeutic potential of kappa opioid agonists. Pharmaceuticals10.3390/ph12020095 (2019). [DOI] [PMC free article] [PubMed]
- 10.Peet MM, Baker LE. Salvinorin B derivatives, EOM-Sal B and MOM-Sal B, produce stimulus generalization in male Sprague–Dawley rats trained to discriminate salvinorin A. Behav. Pharmacol. 2011;22:450–457. doi: 10.1097/FBP.0b013e328349fc1b. [DOI] [PubMed] [Google Scholar]
- 11.Hayes AG, et al. A series of novel, highly potent and selective agonists for the κ-opioid receptor. Br. J. Pharmacol. 1990;101:944–948. doi: 10.1111/j.1476-5381.1990.tb14185.x. [DOI] [PMC free article] [PubMed] [Google Scholar]
- 12.Koehl A, et al. Structure of the micro-opioid receptor–Gi protein complex. Nature. 2018;558:547–552. doi: 10.1038/s41586-018-0219-7. [DOI] [PMC free article] [PubMed] [Google Scholar]
- 13.Che T, et al. Structure of the nanobody-stabilized active state of the kappa opioid receptor. Cell. 2018;172:55–67. doi: 10.1016/j.cell.2017.12.011. [DOI] [PMC free article] [PubMed] [Google Scholar]
- 14.Rasmussen SG, et al. Crystal structure of the β2 adrenergic receptor–Gs protein complex. Nature. 2011;477:549–555. doi: 10.1038/nature10361. [DOI] [PMC free article] [PubMed] [Google Scholar]
- 15.Huang WJ, et al. Structural insights into mu-opioid receptor activation. Nature. 2015;524:315–321. doi: 10.1038/nature14886. [DOI] [PMC free article] [PubMed] [Google Scholar]
- 16.Rasmussen SG, et al. Structure of a nanobody-stabilized active state of the β2 adrenoceptor. Nature. 2011;469:175–180. doi: 10.1038/nature09648. [DOI] [PMC free article] [PubMed] [Google Scholar]
- 17.Roth BL, et al. Salvinorin A: a potent naturally occurring nonnitrogenous kappa opioid selective agonist. Proc. Natl Acad. Sci. USA. 2002;99:11934–11939. doi: 10.1073/pnas.182234399. [DOI] [PMC free article] [PubMed] [Google Scholar]
- 18.Giroud C, et al. Salvia divinorum: an hallucinogenic mint which might become a new recreational drug in Switzerland. Forensic Sci. Int. 2000;112:143–150. doi: 10.1016/S0379-0738(00)00180-8. [DOI] [PubMed] [Google Scholar]
- 19.Kivell BM, Ewald AW, Prisinzano TE. Salvinorin A analogs and other κ-opioid receptor compounds as treatments for cocaine abuse. Adv. Pharmacol. 2014;69:481–511. doi: 10.1016/B978-0-12-420118-7.00012-3. [DOI] [PMC free article] [PubMed] [Google Scholar]
- 20.Wang Y, et al. 2-Methoxymethyl-salvinorin B is a potent kappa opioid receptor agonist with longer lasting action in vivo than salvinorin A. J. Pharmacol. Exp. Ther. 2008;324:1073–1083. doi: 10.1124/jpet.107.132142. [DOI] [PMC free article] [PubMed] [Google Scholar]
- 21.Butelman ER, et al. GR89,696: a potent kappa-opioid agonist with subtype selectivity in rhesus monkeys. J. Pharmacol. Exp. Ther. 2001;298:1049–1059. [PubMed] [Google Scholar]
- 22.Wang Y, et al. Structures of the entire human opioid receptor family. Cell. 2023;186:413–427. doi: 10.1016/j.cell.2022.12.026. [DOI] [PubMed] [Google Scholar]
- 23.Ballesteros JA, Weinstein H. Integrated methods for the construction of three-dimensional models and computational probing of structure-function relations in G protein-coupled receptors. Methods Neurosci. 1995;25:366–428. doi: 10.1016/S1043-9471(05)80049-7. [DOI] [Google Scholar]
- 24.Vardy E, et al. A new DREADD facilitates the multiplexed chemogenetic interrogation of behavior. Neuron. 2015;86:936–946. doi: 10.1016/j.neuron.2015.03.065. [DOI] [PMC free article] [PubMed] [Google Scholar]
- 25.Vardy E, et al. Chemotype-selective modes of action of κ-opioid receptor agonists. J. Biol. Chem. 2013;288:34470–34483. doi: 10.1074/jbc.M113.515668. [DOI] [PMC free article] [PubMed] [Google Scholar]
- 26.Wu H, et al. Structure of the human κ-opioid receptor in complex with JDTic. Nature. 2012;485:327–332. doi: 10.1038/nature10939. [DOI] [PMC free article] [PubMed] [Google Scholar]
- 27.Vortherms TA, Mosier PD, Westkaemper RB, Roth BL. Differential helical orientations among related G protein-coupled receptors provide a novel mechanism for selectivity. J. Biol. Chem. 2007;282:3146–3156. doi: 10.1074/jbc.M609264200. [DOI] [PubMed] [Google Scholar]
- 28.Hauser AS, et al. GPCR activation mechanisms across classes and macro/microscales. Nat. Struct. Mol. Biol. 2021;28:879–888. doi: 10.1038/s41594-021-00674-7. [DOI] [PMC free article] [PubMed] [Google Scholar]
- 29.Zarzycka B, Zaidi SA, Roth BL, Katritch V. Harnessing ion-binding sites for GPCR pharmacology. Pharmacol. Rev. 2019;71:571–595. doi: 10.1124/pr.119.017863. [DOI] [PMC free article] [PubMed] [Google Scholar]
- 30.Olsen RHJ, et al. TRUPATH, an open-source biosensor platform for interrogating the GPCR transducerome. Nat. Chem. Biol. 2020;16:841–849. doi: 10.1038/s41589-020-0535-8. [DOI] [PMC free article] [PubMed] [Google Scholar]
- 31.Mueller KL, et al. The receptors and coding logic for bitter taste. Nature. 2005;434:225–229. doi: 10.1038/nature03352. [DOI] [PubMed] [Google Scholar]
- 32.Che T, et al. Nanobody-enabled monitoring of kappa opioid receptor states. Nat. Commun. 2020;11:1145. doi: 10.1038/s41467-020-14889-7. [DOI] [PMC free article] [PubMed] [Google Scholar]
- 33.Flock T, et al. Universal allosteric mechanism for Galpha activation by GPCRs. Nature. 2015;524:173–179. doi: 10.1038/nature14663. [DOI] [PMC free article] [PubMed] [Google Scholar]
- 34.Mafi A, Kim SK, Goddard III WA. The mechanism for ligand activation of the GPCR-G protein complex. Proc. Natl Acad. Sci. USA. 2022;119:e2110085119. doi: 10.1073/pnas.2110085119. [DOI] [PMC free article] [PubMed] [Google Scholar]
- 35.Rose AS, et al. Position of transmembrane helix 6 determines receptor G protein coupling specificity. J. Am. Chem. Soc. 2014;136:11244–11247. doi: 10.1021/ja5055109. [DOI] [PubMed] [Google Scholar]
- 36.Glukhova A, et al. Rules of engagement: GPCRs and G proteins. ACS Pharmacol. Transl. Sci. 2018;1:73–83. doi: 10.1021/acsptsci.8b00026. [DOI] [PMC free article] [PubMed] [Google Scholar]
- 37.Flock T, et al. Selectivity determinants of GPCR-G-protein binding. Nature. 2017;545:317–322. doi: 10.1038/nature22070. [DOI] [PMC free article] [PubMed] [Google Scholar]
- 38.Inoue A, et al. Illuminating G-protein-coupling selectivity of GPCRs. Cell. 2019;177:1933–1947. doi: 10.1016/j.cell.2019.04.044. [DOI] [PMC free article] [PubMed] [Google Scholar]
- 39.Garcia-Nafria J, Nehme R, Edwards PC, Tate CG. Cryo-EM structure of the serotonin 5-HT1B receptor coupled to heterotrimeric G. Nature. 2018;558:620–623. doi: 10.1038/s41586-018-0241-9. [DOI] [PMC free article] [PubMed] [Google Scholar]
- 40.De Lean A, Stadel JM, Lefkowitz RJ. A ternary complex model explains the agonist-specific binding properties of the adenylate cyclase-coupled beta-adrenergic receptor. J. Biol. Chem. 1980;255:7108–7117. doi: 10.1016/S0021-9258(20)79672-9. [DOI] [PubMed] [Google Scholar]
- 41.Samama P, Cotecchia S, Costa T, Lefkowitz RJ. A mutation-induced activated state of the β2-adrenergic receptor. Extending the ternary complex model. J. Biol. Chem. 1993;268:4625–4636. doi: 10.1016/S0021-9258(18)53442-6. [DOI] [PubMed] [Google Scholar]
- 42.Staus DP, et al. Allosteric nanobodies reveal the dynamic range and diverse mechanisms of G-protein-coupled receptor activation. Nature. 2016;535:448–452. doi: 10.1038/nature18636. [DOI] [PMC free article] [PubMed] [Google Scholar]
- 43.Christopoulos A, Kenakin T. G protein-coupled receptor allosterism and complexing. Pharmacol. Rev. 2002;54:323–374. doi: 10.1124/pr.54.2.323. [DOI] [PubMed] [Google Scholar]
- 44.Dror RO, et al. Structural basis for nucleotide exchange in heterotrimeric G proteins. Science. 2015;348:1361–1365. doi: 10.1126/science.aaa5264. [DOI] [PMC free article] [PubMed] [Google Scholar]
- 45.Gregorio GG, et al. Single-molecule analysis of ligand efficacy in β2AR–G-protein activation. Nature. 2017;547:68–73. doi: 10.1038/nature22354. [DOI] [PMC free article] [PubMed] [Google Scholar]
- 46.Chung KY, et al. Conformational changes in the G protein Gs induced by the β2 adrenergic receptor. Nature. 2011;477:611–615. doi: 10.1038/nature10488. [DOI] [PMC free article] [PubMed] [Google Scholar]
- 47.Liang YL, et al. Dominant negative G proteins enhance formation and purification of agonist-GPCR-G protein complexes for structure determination. ACS Pharmacol. Transl. Sci. 2018;1:12–20. doi: 10.1021/acsptsci.8b00017. [DOI] [PMC free article] [PubMed] [Google Scholar]
- 48.Gilman AG. G proteins: transducers of receptor-generated signals. Annu. Rev. Biochem. 1987;56:615–649. doi: 10.1146/annurev.bi.56.070187.003151. [DOI] [PubMed] [Google Scholar]
- 49.Seyedabadi, M., Gharghabi, M., Gurevich, E. V. & Gurevich, V. V. Structural basis of GPCR coupling to distinct signal transducers: implications for biased signaling. Trends Biochem. Sci.10.1016/j.tibs.2022.03.009 (2022). [DOI] [PMC free article] [PubMed]
- 50.Cong X, et al. Molecular insights into the biased signaling mechanism of the mu-opioid receptor. Mol. Cell. 2021;81:4165–4175. doi: 10.1016/j.molcel.2021.07.033. [DOI] [PMC free article] [PubMed] [Google Scholar]
- 51.Suomivuori CM, et al. Molecular mechanism of biased signaling in a prototypical G protein-coupled receptor. Science. 2020;367:881–887. doi: 10.1126/science.aaz0326. [DOI] [PMC free article] [PubMed] [Google Scholar]
- 52.Lane JR, May LT, Parton RG, Sexton PM, Christopoulos A. A kinetic view of GPCR allostery and biased agonism. Nat. Chem. Biol. 2017;13:929–937. doi: 10.1038/nchembio.2431. [DOI] [PubMed] [Google Scholar]
- 53.Grundmann M, Kostenis E. Temporal bias: time-encoded dynamic GPCR signaling. Trends Pharmacol. Sci. 2017;38:1110–1124. doi: 10.1016/j.tips.2017.09.004. [DOI] [PubMed] [Google Scholar]
- 54.Wenzel-Seifert K, Seifert R. Molecular analysis of β2-adrenoceptor coupling to Gs-, Gi-, and Gq-proteins. Mol. Pharmacol. 2000;58:954–966. doi: 10.1124/mol.58.5.954. [DOI] [PubMed] [Google Scholar]
- 55.Wall MA, et al. The structure of the G protein heterotrimer Giα1β1γ2. Cell. 1995;83:1047–1058. doi: 10.1016/0092-8674(95)90220-1. [DOI] [PubMed] [Google Scholar]
- 56.Maeda S, et al. Development of an antibody fragment that stabilizes GPCR/G-protein complexes. Nat. Commun. 2018;9:3712. doi: 10.1038/s41467-018-06002-w. [DOI] [PMC free article] [PubMed] [Google Scholar]
- 57.Lee DY, et al. Synthesis and in vitro pharmacological studies of new C(2) modified salvinorin A analogues. Bioorg. Med. Chem. Lett. 2005;15:3744–3747. doi: 10.1016/j.bmcl.2005.05.048. [DOI] [PubMed] [Google Scholar]
- 58.Munro TA, et al. Standard protecting groups create potent and selective kappa opioids: salvinorin B alkoxymethyl ethers. Bioorg. Med. Chem. 2008;16:1279–1286. doi: 10.1016/j.bmc.2007.10.067. [DOI] [PMC free article] [PubMed] [Google Scholar]
- 59.Mastronarde DN. Automated electron microscope tomography using robust prediction of specimen movements. J. Struct. Biol. 2005;152:36–51. doi: 10.1016/j.jsb.2005.07.007. [DOI] [PubMed] [Google Scholar]
- 60.Peck JV, Fay JF, Strauss JD. High-speed high-resolution data collection on a 200 keV cryo-TEM. IUCrJ. 2022;9:243–252. doi: 10.1107/S2052252522000069. [DOI] [PMC free article] [PubMed] [Google Scholar]
- 61.Punjani A, Rubinstein JL, Fleet DJ, Brubaker MA. cryoSPARC: algorithms for rapid unsupervised cryo-EM structure determination. Nat. Methods. 2017;14:290–296. doi: 10.1038/nmeth.4169. [DOI] [PubMed] [Google Scholar]
- 62.Punjani A, Zhang H, Fleet DJ. Non-uniform refinement: adaptive regularization improves single-particle cryo-EM reconstruction. Nat. Methods. 2020;17:1214–1221. doi: 10.1038/s41592-020-00990-8. [DOI] [PubMed] [Google Scholar]
- 63.Cao C, et al. Structure, function and pharmacology of human itch GPCRs. Nature. 2021;600:170–175. doi: 10.1038/s41586-021-04126-6. [DOI] [PMC free article] [PubMed] [Google Scholar]
- 64.Pettersen EF, et al. UCSF Chimera—a visualization system for exploratory research and analysis. J. Comput. Chem. 2004;25:1605–1612. doi: 10.1002/jcc.20084. [DOI] [PubMed] [Google Scholar]
- 65.Emsley P, Lohkamp B, Scott WG, Cowtan K. Features and development of Coot. Acta Crystallogr. D. 2010;66:486–501. doi: 10.1107/S0907444910007493. [DOI] [PMC free article] [PubMed] [Google Scholar]
- 66.Adams PD, et al. PHENIX: a comprehensive Python-based system for macromolecular structure solution. Acta Crystallogr. D. 2010;66:213–221. doi: 10.1107/S0907444909052925. [DOI] [PMC free article] [PubMed] [Google Scholar]
- 67.Chen VB, et al. MolProbity: all-atom structure validation for macromolecular crystallography. Acta Crystallogr. D. 2010;66:12–21. doi: 10.1107/S0907444909042073. [DOI] [PMC free article] [PubMed] [Google Scholar]
- 68.Abraham MJ, et al. GROMACS: high performance molecular simulations through multi-level parallelism from laptops to supercomputers. SoftwareX. 2015;1:19–25. doi: 10.1016/j.softx.2015.06.001. [DOI] [Google Scholar]
- 69.Jo S, Kim T, Iyer VG, Im W. CHARMM-GUI: a web-based graphical user interface for CHARMM. J. Comput. Chem. 2008;29:1859–1865. doi: 10.1002/jcc.20945. [DOI] [PubMed] [Google Scholar]
- 70.Kim S, et al. CHARMM-GUI ligand reader and modeler for CHARMM force field generation of small molecules. J. Comput. Chem. 2017;38:1879–1886. doi: 10.1002/jcc.24829. [DOI] [PMC free article] [PubMed] [Google Scholar]
- 71.Abagyan R, Totrov M, Kuznetsov D. ICM—a new method for protein modeling and design: applications to docking and structure prediction from the distorted native conformation. J. Comput. Chem. 1994;15:488–506. doi: 10.1002/jcc.540150503. [DOI] [Google Scholar]
- 72.Xing C, et al. Cryo-EM structure of the human cannabinoid receptor CB2–Gi signaling complex. Cell. 2020;180:645–654. doi: 10.1016/j.cell.2020.01.007. [DOI] [PMC free article] [PubMed] [Google Scholar]
- 73.Arnautova YA, Abagyan RA, Totrov M. Development of a new physics-based internal coordinate mechanics force field and its application to protein loop modeling. Proteins Struct. Funct. Bioinform. 2011;79:477–498. doi: 10.1002/prot.22896. [DOI] [PMC free article] [PubMed] [Google Scholar]
- 74.Lomize MA, Pogozheva ID, Joo H, Mosberg HI, Lomize AL. OPM database and PPM web server: resources for positioning of proteins in membranes. Nucleic Acids Res. 2012;40:D370–D376. doi: 10.1093/nar/gkr703. [DOI] [PMC free article] [PubMed] [Google Scholar]
- 75.Leonard AN, Lyman E. Activation of G-protein-coupled receptors is thermodynamically linked to lipid solvation. Biophys. J. 2021;120:1777–1787. doi: 10.1016/j.bpj.2021.02.029. [DOI] [PMC free article] [PubMed] [Google Scholar]
- 76.Bussi, G., Donadio, D. & Parrinello, M. Canonical sampling through velocity rescaling. J. Chem. Phys.10.1063/1.2408420 (2007). [DOI] [PubMed]
- 77.Krissinel E, Henrick K. Inference of macromolecular assemblies from crystalline state. J. Mol. Biol. 2007;372:774–797. doi: 10.1016/j.jmb.2007.05.022. [DOI] [PubMed] [Google Scholar]
Associated Data
This section collects any data citations, data availability statements, or supplementary materials included in this article.
Supplementary Materials
Supplementary Methods (allosteric IC50 shift model equation), Supplementary Figs. 1–6 and Supplementary Tables 1–17.
Data Availability Statement
The coordinate and cryo-EM map of KOR–Gi1–momSalB, KOR–GoA–momSalB, KOR–Gz–GR89,696 and KOR–Gg–GR89,696 have been deposited at the PDB and Electron Microscopy Data Bank under accession codes 8DZP (EMD-27804), 8DZQ (EMD-27805), 8DZS (EMD-27807) and 8DZR (EMD-27806), respectively. All data supporting the findings of this study are available within the Article and its Supplementary Information.


