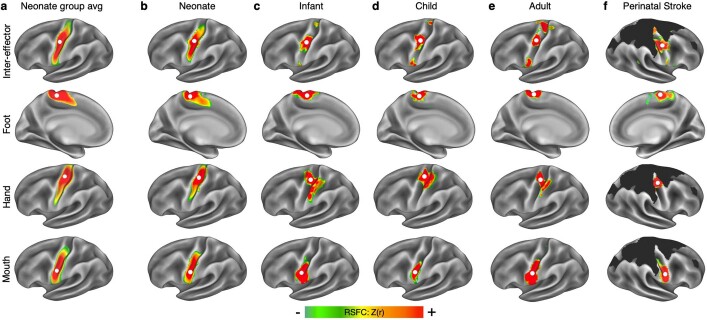
Extended Data Fig. 2. Motor cortex functional connectivity in pediatric participants and perinatal stroke.
Functional connectivity maps were seeded from a continuous line of points down precentral gyrus in fMRI data from a, data averaged across 262 human neonates, all scanned shortly after birth; b, a neonate scanned 13 days after birth; c, an 11-month old infant; d, a 9-year old child; e, adult participant P1 (from Fig. 1); and f, an adolescent who had experienced extensive cortical reorganization after severe bilateral perinatal strokes (destroyed cortex in black). Right hemisphere is shown in the stroke patient because left hemisphere M1 was entirely lost. Example seed maps shown here illustrate observed inter-effector (row 1) and effector-specific connectivity (rows 2-4). Inter-effector and effector-specific regions exhibited clear boundaries within M1 in the infant, child, the adults, and the stroke patient, but not in the neonates. Visualization thresholds varied between Z(r) > 0.3 and Z(r) > 0.5 across datasets due to differences in data collection and processing, as well as differences inherent to the populations.

