Abstract
Calcium homeostasis is implicated in some cancers, leading to the possibility that selective control of calcium might lead to new cancer drugs. Based upon this idea, we designed an assay using a glioblastoma cell line and screened a collection of 1,000 unique bacterial extracts. Isolation of the active compound from a hit extract led to the identification of boholamide A (1), a 4-amido-2,4-pentadieneoate- (APD)-class peptide. Boholamide A (1) applied in the nanomolar range induces an immediate influx Ca2+ in glioblastoma and neuronal cells. APD-class natural products are hypoxia-selective cytotoxins that primarily target mitochondria. Like other APD-containing compounds, 1 is hypoxia selective. Since APD natural products have received significant interest as potential chemotherapeutic agents, 1 provides a novel APD scaffold for the development of new anticancer compounds.
Graphical Abstract
Cancers are becoming more treatable, but those affecting the brain are still often lethal. Among brain cancers, glioblastoma multiforme (GBM) is the deadliest, with a median survival of ~14 months and a five-year survival rate of less than 6%.1 While much effort has gone into creating new GBM treatments, several problems have hindered the development of new drugs.2 These include the challenge of crossing the blood-brain barrier and resistance to chemotherapeutic agents. Crucially, hypoxia is a major factor in the etiology of GBM, and the best GBM drugs are less effective under hypoxic conditions.3 Thus, there remains a significant need for innovation in GBM drug discovery.
Substantial evidence suggests that modulating Ca2+ may be of use in targeting cancers.4 For example, genes related to calcium signaling are differentially regulated in several types of cancer.5 Brain cancers are prime candidates for Ca2+-modulating therapies, since the cells express many different, cell-type specific ion channels and receptors that might require selective drugs. Several Ca2+ channel blockers have already entered clinical trials for gliomas, GBM, and meningiomas, where in some cases promising early results have been obtained.1 These and other studies provide proof-of-concept that Ca2+ modulators have promise in cancer therapy.
Based upon these ideas, we designed an assay to discover compounds that directly modulate intracellular Ca2+ in glioblastoma cell lines. We screened extracts from a panel of bacteria isolated from marine mollusks. Here, we describe the structure and pharmacology of one of the hits from this assay, boholamide A (1). Because 1 is structurally similar to a series of hypoxia-selective 4-amido-2,4-pentadieneoate- (APD)-cyclodepsipeptides,6–7 we tested the compound for cytotoxicity under hypoxic and normoxic conditions. Because 1 was found to be hypoxia-selective, the structural features found in 1 but not in other APD-class compounds may be of use in the design of new agents for treatment of GBM.
Results
Calcium Assay.
We tested 1,000 extracts from small-scale marine bacterial cultures in a primary screen measuring Ca2+ modulation in glioblastoma (U87MG cells)8 (Figures 1 and S1). Initially, 34 hits were obtained from the glioblastoma assay. Of these, 17 were validated using a fluorescent microscopy assay, and three were still active after the cultures were scaled up to >1 L. Our validated hit rate was ~1.5%, but we experienced significant attrition during scale up, in which the active compounds were no longer produced by cultivated isolates.
Figure 1.
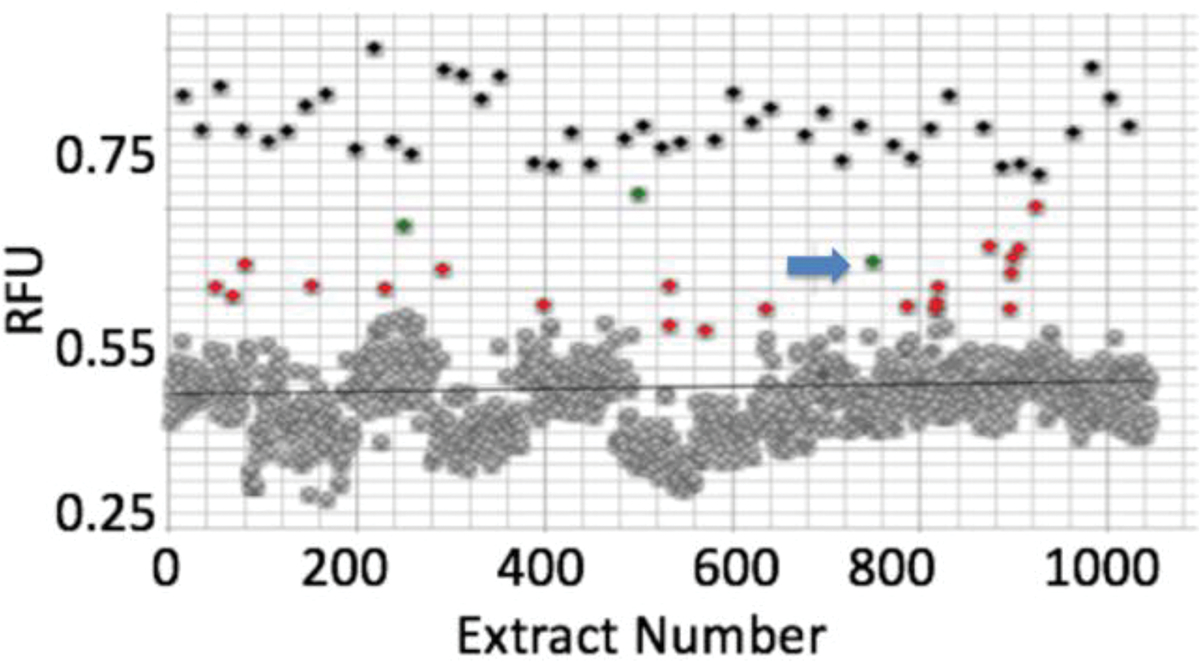
Discovery of boholamide A (1) as a Ca2+-perturbing agent. Ca2+ imaging assay results for a subset of ~1,000 bacterial extracts using glioblastoma U87MG cells. Relative fluorescence units (RFU) were measured for each extract using a Ca2+-selective dye. Black points are from positive controls (detergent lysis of cells), while gray points are inactive extracts that cluster around a black bar indicating mean activity. Red and green dots are active extracts, with extract 3158H.R.1.a.03 indicated by a blue arrow.
One of the most active extracts in the collection originated in strain 3158H.R.1a.03, identified as Nocardiopsis sp. by 16S rRNA gene sequencing. The strain was originally isolated from a Truncatella sp. mollusk from Bohol, Philippines. The chemical extract from the strain increased intracellular [Ca2+] in the glioblastoma assay. Assay-guided fractionation led to the purification of the active principle, boholamide A (1), named after the source island in the Philippines.
Structure Elucidation of Boholamide A (1).
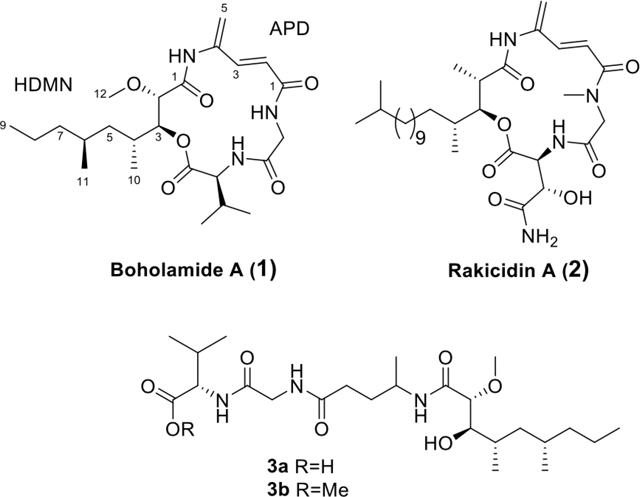
The molecular formula of 1 was established as C24H39N3O6 using a measured m/z of 466.2933 (Δ 3.4 ppm), as well as 13C and HSQC data (Table 1 and Figures S2–S7) indicating six methyl, five methylene, eight methine, and five fully substituted carbons. The peptidic nature was evident by the presence of three exchangeable NH protons at δH 7.70, 8.30, and 9.27. The proteinogenic amino acids glycine and valine were deduced from their 1H and 13C chemical shifts, as well as COSY and HMBC correlations typical of these residues (Figure 2). A third, unusual amino acid was defined using COSY and HMBC data as the APD moiety. Comparison of the chemical shifts of 1 with those from other APD-containing natural products confirmed this assignment.9–11 In particular, the APD amide proton at δH 9.27 and C-1 at δC 167.9 matched very closely the signals of the rakicidins.9
Table 1.
NMR Data of Compound 1 in DMSO-d6
| unit | No. | δC, type | δH, (J in Hz) |
|---|---|---|---|
|
| |||
| HDMN | 1 | 169.0, C | - |
| 2 | 79.5, CH | 4.04, d (9.0) | |
| 3 | 74.5, CH | 5.20, dd (9.0, 2.4) | |
| 4 | 30.7, CH | 2.13, m | |
| 5 | 41.2 CH2 | 1.28, m; 0.96, m | |
| 6 | 29.4, CH | 1.60, m | |
| 7 | 39.2, CH2 | 1.24, m; 1.04, m | |
| 8 | 20.0, CH2 | 1.36, m; 1.23, m | |
| 9 | 14.9, CH3 | 0.88, t (7.2) | |
| 10 | 14.9, CH3 | 0.99, d (6.9) | |
| 11 | 20.4, CH3 | 0.87, d (6.7) | |
| 12 | 57.5, CH3 | 3.34, s | |
| APD | 1 | 167.9, C | - |
| 2 | 119.6, CH | 6.16, d (15.1) | |
| 3 | 138.8, CH | 6.92, d (15.1) | |
| 4 | 138.3, C | - | |
| 5 | 117.0, CH2 | 5.64, s; 5.5, s | |
| NH | - | 9.27, brs | |
| Gly | 1 | 170.0, C | - |
| 2 | 45.2, CH2 | 4.08, dd (17.2, 5.7); 3.62, dd (17.3, 8.2) | |
| NH | - | 7.70, dd (8.2, 5.7) | |
| Val | 1 | 169.8, C | - |
| 2 | 58.2, CH | 4.34, dd (10.0, 7.2) | |
| 3 | 32.3, CH | 2.02, dq (7.2, 6.9) | |
| 4 | 19.4, CH3 | 0.92, d (6.9) | |
| 5 | 19.4, CH3 | 0.91, d (6.9) | |
| NH | - | 8.30, d (10.0) | |
Figure 2.
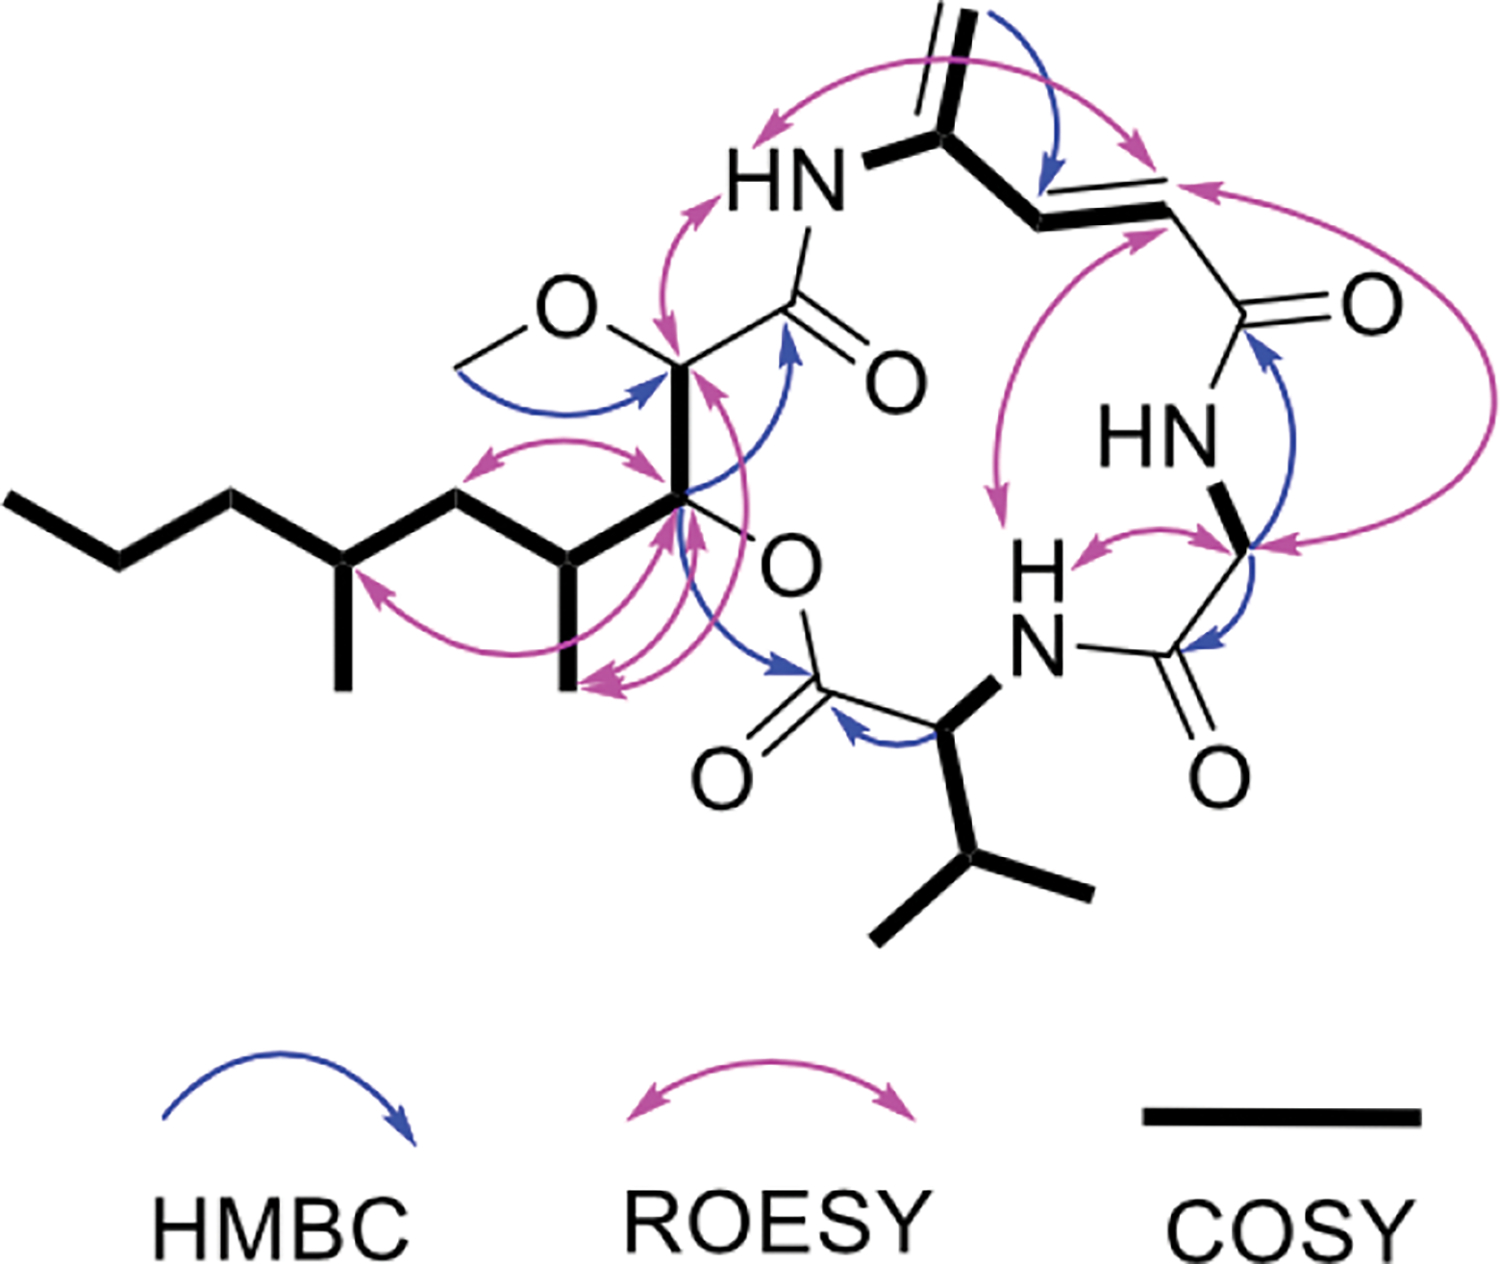
Key HMBC, ROESY and COSY correlations of 1.
The remaining portion of the molecule was assigned to a polyketide moiety, 3-hydroxy-4,6-dimethyl-2-methoxy-nonanoic acid (HDMN), which has no close precedent in the literature. The connections between carbons could be discerned through COSY correlations. An HMBC correlation between H-3 and C-1 defined the acyl portion of the molecule. The position of the methyl ether was confirmed by an HMBC correlation between H-12 and C-2, while the chemical shifts at C-3 (δH 5.20; δC 74.5) indicated the presence of an ester. HDMN H-3 and Val H-2 each had HMBC correlations to Val C-1, revealing the position of the ester.
The relative positions of glycine and APD were inferred using ROESY correlations (Figure 2). Interpretation of the ROESY spectrum was not straightforward due to the presence of several cross-ring correlations. However, the correlations were very similar to those previously reported from the related macrocycle of rakicidin A (2) (Figure S8).9 The relative chemical shifts of the carbonyls in the compound were similar to their homologous amide carbonyls in 2. The HMBC correlations between the alpha protons of glycine and the two carbonyls at δC 167.9 and 170.0 supported the connection between glycine and APD. Moreover, reduction of 1 followed by hydrolysis of the ester led to a series of compounds (3) (Figures S9–S12), which in MS2 yielded fragments (Figure S13) supporting the NMR structure. Thus, we proposed the planar structure of 1.
The configuration of L-Val was determined using Marfey’s method (Figure S14).12 The configuration of the HDMN residue was established by analyzing coupling constants and ROESY data (Figure 3) of the HDMN moiety of 3a/3b (Figure 3). A large H-H coupling constant between H-2 and H-3 indicated that the protons are in the anti-configuration. Strong ROESY correlations between H-10 and H-3/H-12, as well as weaker correlations between H-4 and H-3/H-12, established the relative configuration as 2S*3S*. Similarly, a small coupling constant between H-3 and H-4 and the ROESY correlations suggested the configuration 2S*3S*4R*.
Figure 3.
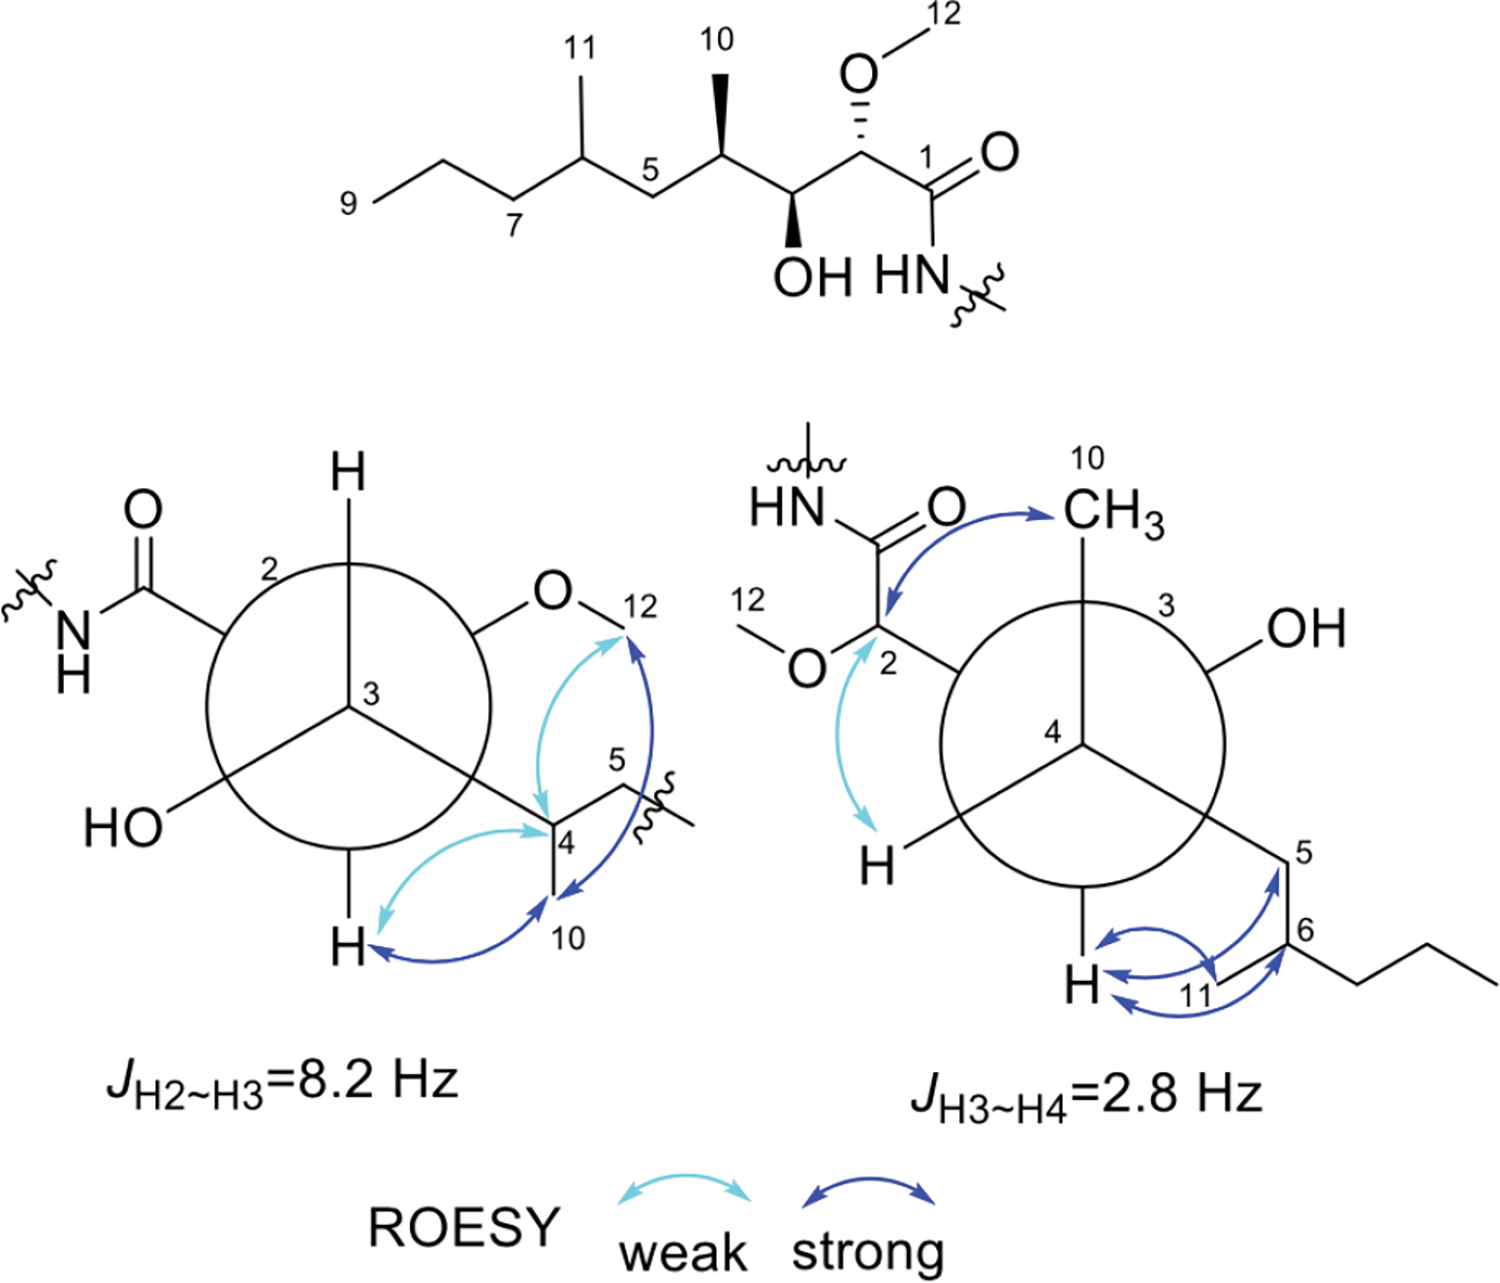
Key ROESY correlations of the HDMN in compounds 3a/3b.
To establish the absolute configuration of these centers, we used ConfBuster13 to analyze the preferred conformation of the boholamide A (1) macrocycle. Setting the Val residue as S, we then modeled all four remaining possible stereoisomers of 1. Only diasteromers with HDMN as 2S,3S,4R,6S were consistent with the coupling and ROESY data (Figure S15). If true, this compound would have the same configuration as rakicidin A (2) at the homologous positions.14 Indeed, 2 has very similar reported distance and coupling constant data (Figure S8).9 We modeled the preferred configuration of 2 and obtained a model that was almost overlapping with that of 1 (Figure S14).
To further support this assignment, we used the output of ConfBuster to model the electronic circular dichroism (ECD) spectra of the four possible diastereomers of 1.13 Only models with the HDMN 2S,3S configuration matched the experimental ECD spectra (Figure S16), while 2R,3R gave spectra that were opposite. Thus, the absolute configuration of 1 is Val 2S HDMN 2S,3S,4R,6S. Interestingly, both rakicidins and boholamide A (1) are enantiomeric to the related natural products vinylamycin (4) and microtermolide (5) (Figure 4).10–11, 14–17 Compounds 4 and 5 are much less bioactive than 1 and rakicidin A (2) in cancer assays (see below).
Figure 4.
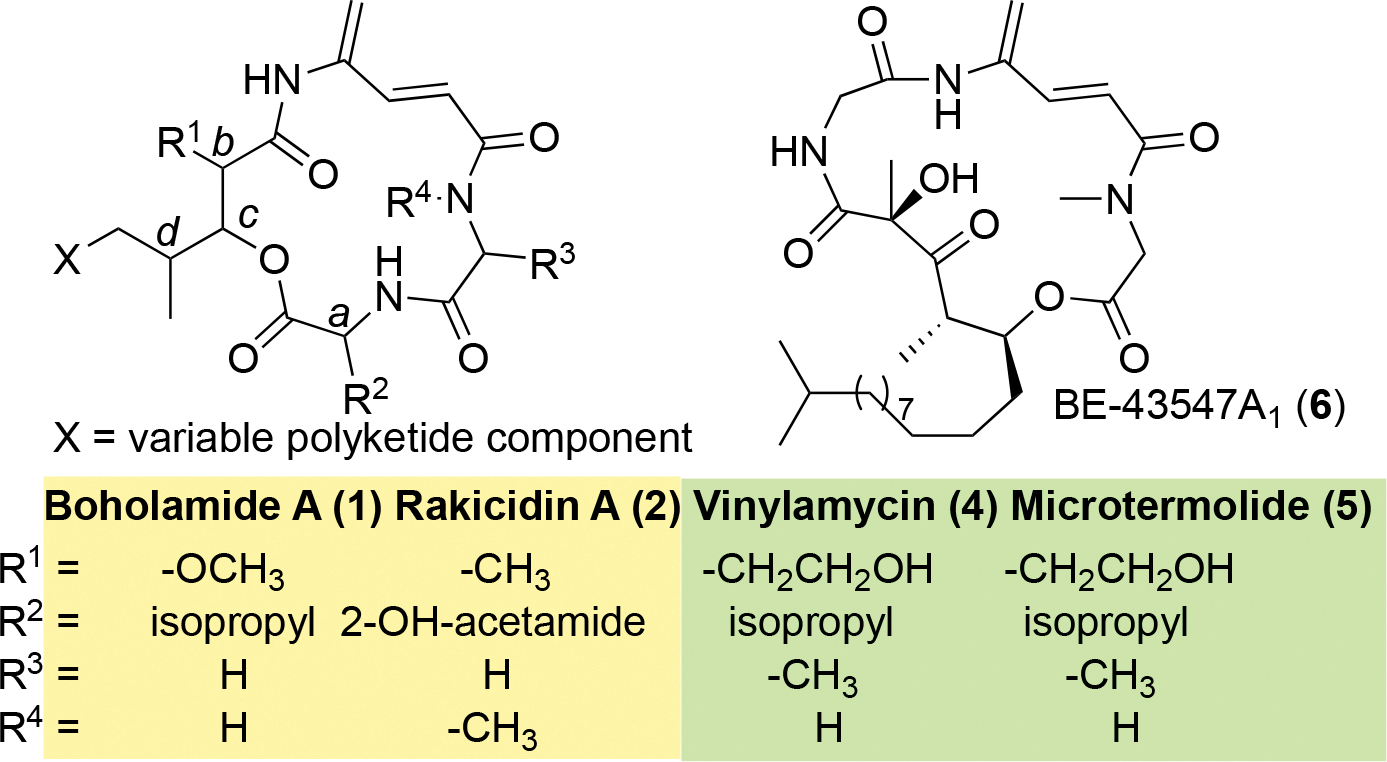
Comparative structures of APD compounds. The yellow box indicates compounds with the configuration abcd = SSRS, while the green box indicates the enantiomeric abcd = RRSR.
Pharmacology of Boholamide A (1)
Hypoxia-selective Cytotoxicity.
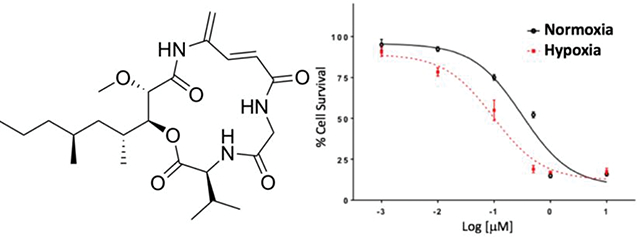
The cytotoxicity of 1 against glioblastoma U87MG was evaluated using the MTT assay. Compound 1 exhibited cytotoxicity with IC50 at 410 nM and showed hypoxia-selectivity on the same cell line having an IC50 of 120 nM. Compared to standard glioblastoma drugs doxorubicin and temozolomide in normoxic versus hypoxic conditions, 1 was about 3.6 times more potent, indicating potentially useful hypoxia selectivity while the standard drugs were about half as potent under hypoxic conditions (Figure 6). Boholamide A (1) was also cytotoxic against a panel of cell lines, with IC50s from ~100–400 nM (Table 2).
Figure 6.
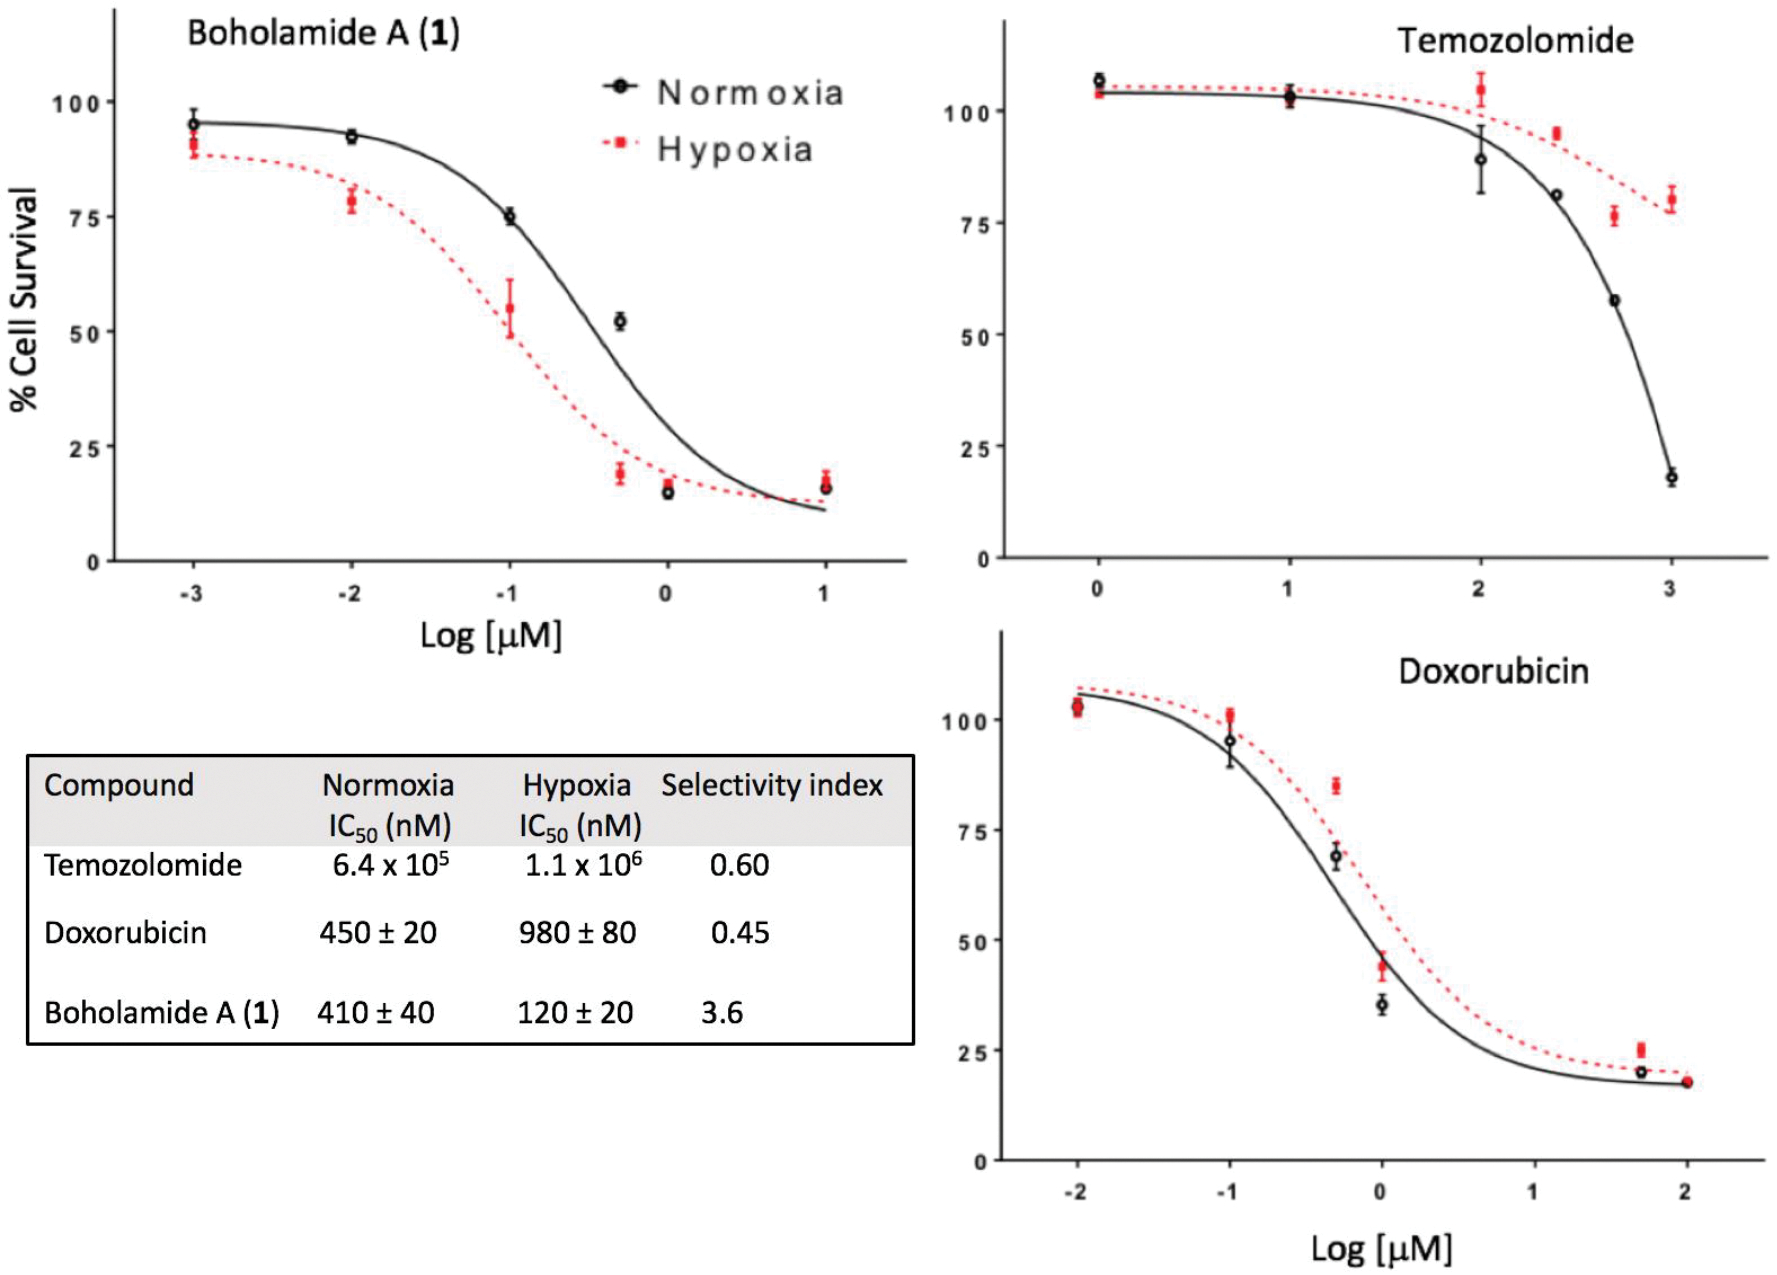
Hypoxia-selective cytotoxicity of boholamide A (1) against U87MG glioblastoma cells. 1 is compared with standard glioblastoma treatments doxorubicin and temozolomide, showing that 1 is hypoxia-selective, whereas the standards are less cytotoxic to hypoxic cells.
Table 2.
Cytotoxicity of Boholamide A (1).
| Cell line | Source | IC50 (nM) |
|---|---|---|
|
| ||
| CH157 | Human meningioma | 98 ± 32 |
| HUH7 | Human liver carcinoma | 190 ± 10 |
| A549 | Human adenocarcinoma | 390 ± 60 |
| U87MG | Human glioblastoma | 410 ± 20 |
| CHO | Chinese hamster ovary | 390 ± 40 |
Dorsal Root Ganglion Assay.
We used a primary culture of mouse dorsal root ganglion (DRG) neurons and glia to further investigate the calcium activity of 1.18 Using a fluorescent dye, the DRG assay tracks intracellular [Ca2+] as a series of different reagents is applied to the culture over a ~1-h experiment. Neurons are assigned into distinct cell classes using four pharmacological identifiers (allylisothiocyanate (AITC) 100 μM, menthol 400 μM, capsaicin 300 nM, and peptide kM-RIIIJ 1 μM), as well as two non-pharmacological markers (IB4 and CGRP-GFP).19 These cell classes faithfully represent the major categories of sensory neurons that communicate pain, heat, cold, itch, position, pressure, and other sensations from the body to the spinal cord. Glia are also represented in the experiment. In this way, it is possible to simultaneously track both the activity of investigational compounds and the individual cell types affected by the compounds.
Compound 1 exhibited a direct effect on cells, causing Ca2+ influx into the cytoplasm. Using a 15-second application of the compound, cells are affected at concentrations as low as ~10 nM of 1, and the effects become irreversible at 1 μM (Figure S17). To circumvent this problem, a 7-second application of 1 was applied (Figure 7). In this experiment ~8% of neurons responded to 1 at a concentration of 500 nM. Interestingly, most of the neurons (61%) responding at 500 nM belong to a single class of thermosensory N15 neurons. When the concentration was increased to 1 μM, 34% of cells respond reversibly, representing broad classes of neurons. At 1 μM, affected cells often showed profound vesiculation leading to cell death, with the notable exception of N15 neurons (Figures 7B, S18).
Figure 7.
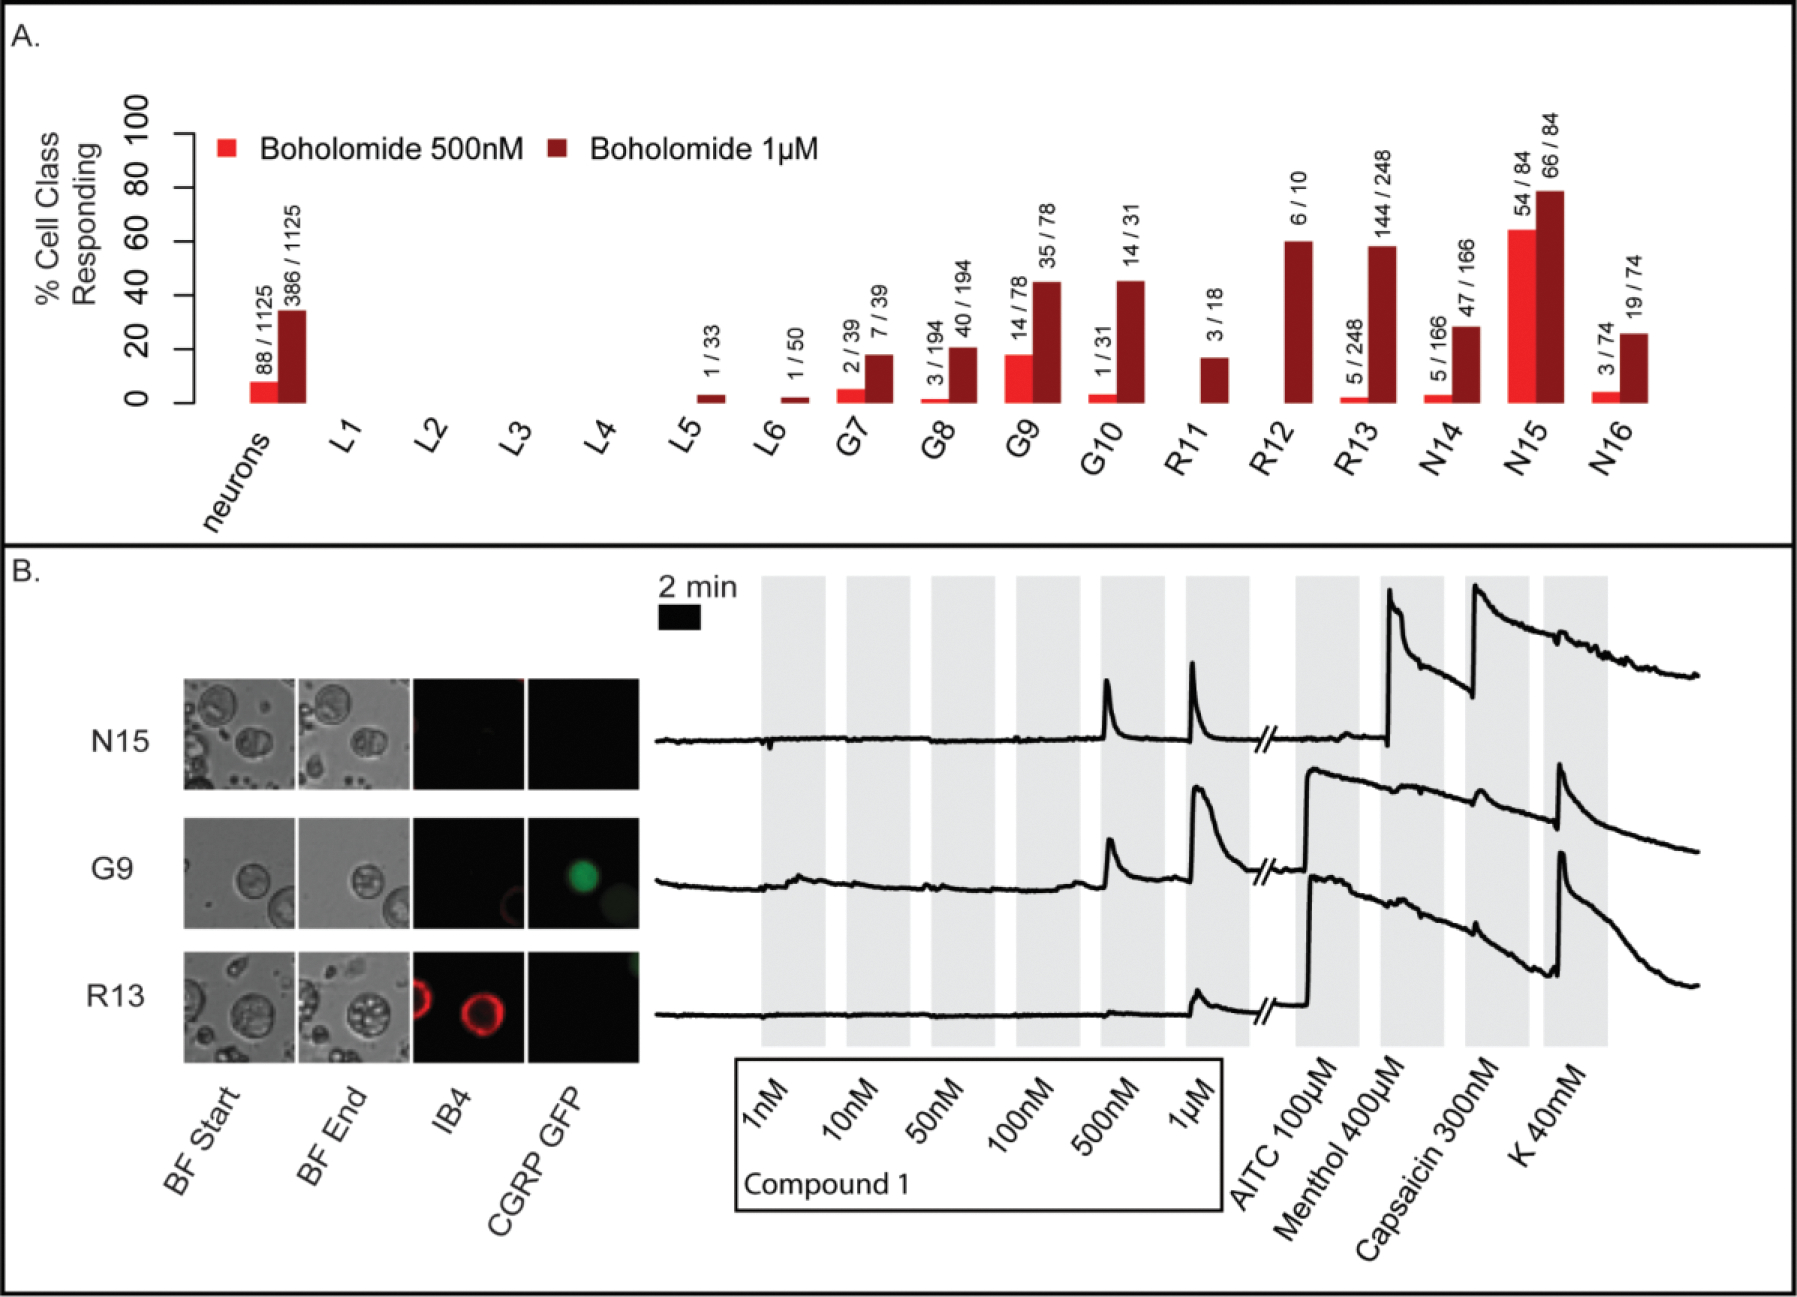
DRG experiments using a 7-second pulse of boholamide A (1). (A) Summary of neurons affected in an experiment containing 1,125 individual cells. In the y-axis, the % of cells responding to boholamide (1) at 0.5 and 1 μM is shown, while the x-axis indicates the individual cell types affected. (B) The raw data underlying the experiment are shown. Three individual representative cells out of 1,125 total were selected. Cells are shown using bright-field (BF) microscopy at the start and end of the experiment. Small spheres within G9 and R13 are indicative of vesiculation. Fluorescent microscopy shows cells that are stained using IB4 antibodies or that express CGRP-GFP, differentiating cell types. To the right of the micrographs, a series of traces are shown representing fluorescence from Ca2+ entry into the cytoplasm. The y-axis represents relative fluorescence. On the x-axis, the individual treatments with reagents is shown. K = potassium chloride 40 mM.
Using mouse brain cortex cells, we further investigated the cell death phenomenon (Figure 8 and Movie S1). Within seconds of the application of compound 1 at 1 μM, cytoplasmic Ca2+ accumulates, followed immediately by vesiculation. Within ~5 seconds, cells begin to lyse. Interestingly some cells are spared from vesiculation, suggesting that 1 has a specific molecular target. We performed a preliminary test of toxicity using a zebrafish embryo development assay (Figure S19). No toxic effects were observed, so either the compounds are not overtly toxic or the active form of the compound did not penetrate the embryos.
Figure 8:
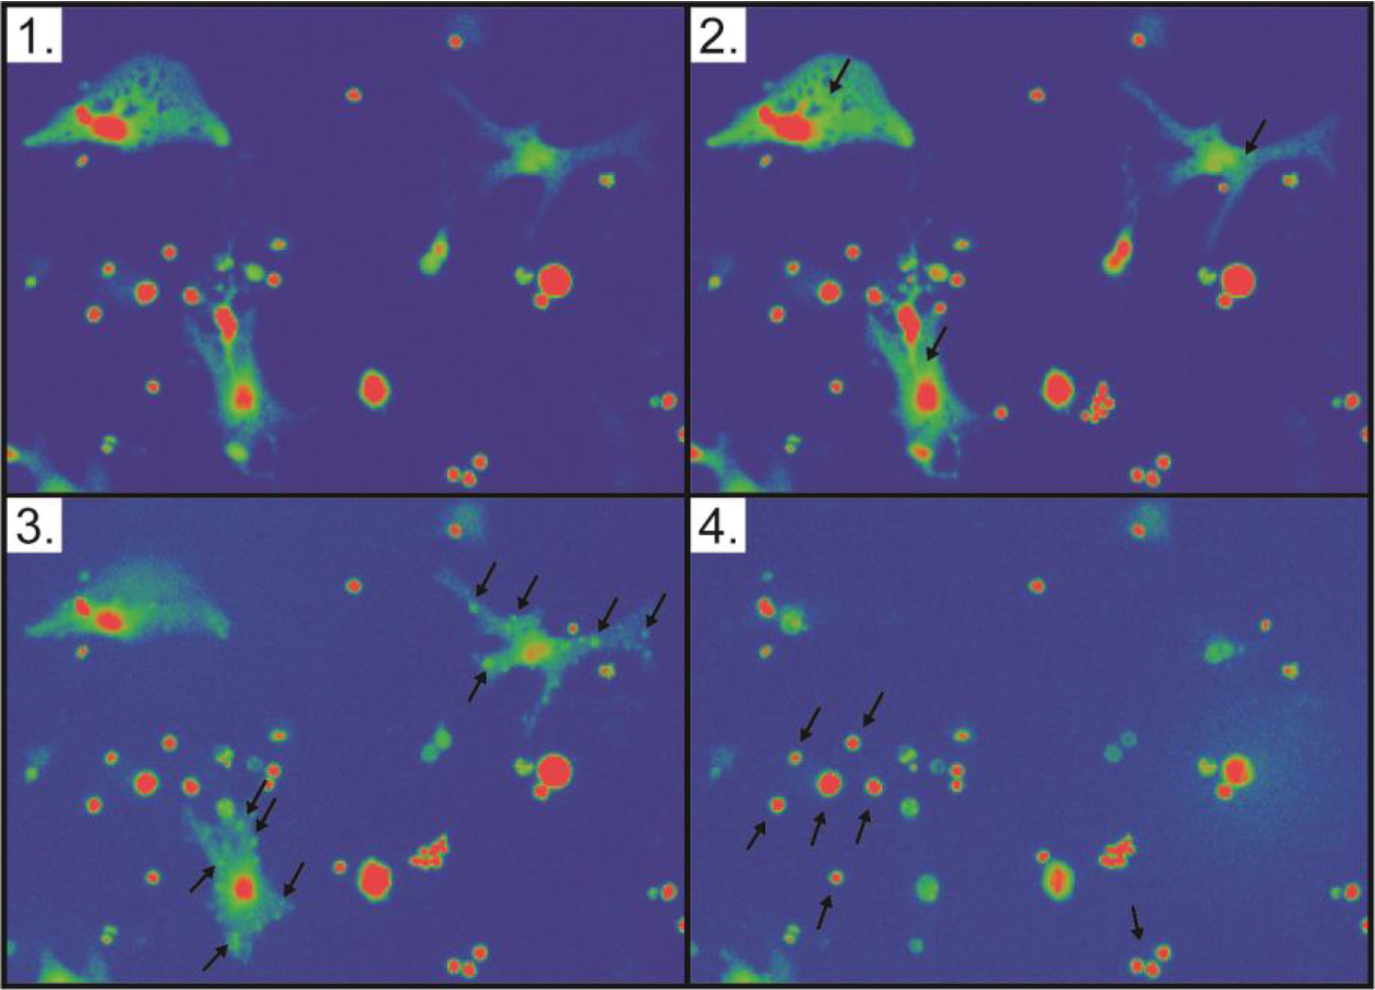
Boholamide A (1) causes lysis of mouse brain cortex cells. Each panel is a still shot taken from Movie S1. (1) Cells prior to application of compound 1. (2) Upon application of 1, Ca2+ immediately floods cells, as shown by increasing fluorescence of cells as indicated with arrows. (3) Within seconds, puncta form on the surface of cells, indicated with arrows. (4) Shortly thereafter, the cytoplasm is lost from the cell, leaving a ghost membrane. Arrows indicate cells that were not affected by the compound.
Discussion
Boholamide A (1) is a structurally new member of the APD cyclodepsipeptide family of cytotoxins.20 It most resembles rakicidin A (2) and its relatives, having the same ring size and absolute configuration at each position, but with different amino acid and polyketide moieties.9, 21–22 It is also somewhat similar to the later isolated vinylamycin (4) and microtermolide A (5),10–11 with an identical ring size. Interestingly, 1 and 2 have the same relative, but opposite absolute, configurations as 4 and 5. Another APD compound, with a different ring size but with otherwise similar structural features, is BE-43547A1 (6) and relatives.23–24
A difficulty with all of the compounds in this series is that, while they are stable in certain solutions and in many assay conditions (for example, in vivo in mice),6 they are unstable upon drying or under different chemical treatments.9, 20 For this reason, initially the stereogenic centers of all members of this series were either not determined, or chemical methods were misleading. Ultimately, the correct configurations of all compounds were reported only following total syntheses.14, 16–17, 24 Here, we solved this problem that has long plagued the field by applying a recently developed computational approach13 to the configuration of 1 and demonstrating its validity using rakicidin A (2) as a control. Computation was supplemented with NMR measurements, Marfey’s method and with ECD measurements, leading to a definitive assignment of stereogenic centers.
Compound 2 was initially identified as a potent cytotoxin,9 with much less potent cytotoxins 4 and 5 identified later.10–11 In a landmark study, it was shown that 2 is much more cytotoxic under hypoxic conditions.7, 25 Compound 6 is even more potent than 2 and has a higher selectivity index for hypoxia.6, 24 Since hypoxic tumors are poorly treated in many different cancers, these results led to significant interest in developing APD natural products as drugs.6 Inspired by these results, we tested boholamide A (1) in hypoxia-selective cytotoxicity assays, finding that 1 exhibits a similar potency and selectivity index as 2.
The mechanisms of action of APD compounds have been extensively investigated. The APD moiety is a Michael acceptor, and it reacts with cysteine residues in model proteins.26 Hydroxylated analogs are stable and may undergo a reverse Michael reaction to release the active drug in situ,27 demonstrating the importance of the Michael reaction in drug action. Indeed, a synthetic analog of compound 6 was used in pull-down experiments, leading to the identification of mitochondrial proteins such as reticulons 3 and 4 as potential targets.6 Compound 6, and presumably others in the series, exert their hypoxia selectivity by targeting the mitochondrion via mechanisms that are more sensitive under hypoxic conditions. Because 1 has a very similar bioactivity profile, it is likely that the mechanism of action is similar or identical to that established for 6.
We discovered 1 using a [Ca2+] assay, but it is currently unclear whether the Ca2+ influx is related to hypoxia-selective cytotoxicity. In previous studies, at 1 μM concentration 2 was found to cause membrane leakage, along with a very pronounced cell shape change, while 6 did not cause leakage or shape change.24 Both 2 and 6 had similar hypoxia-selective cytotoxicities at lower concentrations. This led the authors to conclude that 2 exhibits two different mechanisms of action. We found that 1 was very similar to 2, in that DRG and cortex cells change shape and die rapidly at high concentrations of 1.
It remains to be determined whether the Ca2+ and hypoxia-selective responses represent two different mechanisms of action. One possibility is that compounds such as 1 and 2 cause indiscriminate membrane leakage, which is distinct from the hypoxia-selective effect. A second possibility is that Ca2+ leakage from internal stores is related to hypoxia selectivity, in that 6 damages organelles.
In the mouse DRG, compound 1 selectively targets N15 neurons at lower concentrations, yet even at higher concentrations it does not elicit the death phenotype shown by other neurons and by glia (Figures 8, S18). These data support the hypothesis that 1 may have at least two different molecular mechanisms. In this work, we used a functional classification scheme that was recently described,19 although the formal designation of N15 as cold thermosensors has not yet been published. Selectively targeting thermoregulatory neurons may be useful, but first a medicinal chemistry approach would be required to separate the toxic effects of 1 from its N15 selectivity.
Our work and previous studies show that APD compounds are not indiscriminate toxins. The compounds have received widespread interest as preclinical leads for cancer therapy. Mouse studies have shown no overt toxicity and revealed promising early results in vivo.6, 28 In our hands, 1 showed no overt toxicity to zebrafish embryos, although the data are preliminary as they are negative (no toxicity or other visible effect). In addition, 1 did not cause all cells to lyse but showed some selectivity to specific neuronal classes.
Finally, our work adds to a growing body of structure-activity relationship (SAR) studies en route to drug development. Many APD natural products and their analogues have been synthesized and tested.14, 17, 20, 24, 26, 28–30 Boholamide A (1) is quite structurally unique among the APD compounds especially in terms of its polyketide component. In particular, the methoxy group in position 2 is not found in any other APD. Interestingly, while vinylamycin (4) is nearly inactive against mammalian cell lines, its enantiomer, having the same absolute configuration as 1, is potent at the low micromolar level.30 Further, when the hydroxy group in the side chain at position 2 of vinylamycin’s polyketide portion was protected with a lipophilic group, it became much more active, similar to the potency of 1. Our results thus add new chemical handles for diversification in the course of APD drug development.
In summary, here we define the structure and biological activity of boholamide A (1), a novel APD natural product that informs APD cancer drug design.
Experimental Section
General Experimental Procedures.
UV and ECD spectra were obtained using the AVIV spectrophotometer M 410. The UV spectrum was calculated from the dynode voltage using the “Convert Dynode to ABS” function. NMR data were obtained using either a Varian 500 (1H 500 MHz, 13C 125 MHz) NMR spectrometer with 3mm Nalorac MDBG probe or a Varian INOVA 600 (1H 500 MHz, 13C 125 MHz) equipped with a 5mm 1H[13C, 15N] triple resonance cold probe with a z-axis gradient, using the residual DMSO signal (δH 2.54, δC 40.45) as reference. High-resolution mass spectra (HRESIMS) were collected using Xevo G2-XS QToF (Waters) equipped with Acquity H Class Plus UPLC (Waters). Semi-preparative HPLC was performed using a Phenomenex Luna 5u C18 250 × 10 mm column. U87MG, HUH7, CHO and A549 cell lines were purchased from ATCC; CH157-MN was provided by Dr. Randy Jensen (University of Utah). All assays performed with purified 1 were done using triplicate biological replicates.
Bacterial Isolation and Identification
Mollusks were obtained in Bohol, Philippines, with appropriate permits from the local government and the Bureau of Fisheries and Aquatic Resources (BFAR). Bacterial isolation from animal tissues was performed as previously described.31 Briefly, the animal was removed from the shell after crushing, and interior tissues were rinsed using sterile seawater. Tissues were then homogenized using mortar and pestle with sterile seawater (1 mL), serially diluted, and spread on R2A, ISP2, and marine agar plates. Agar plates were supplemented with nalidixic acid (10 ug/mL), cycloheximide (20 ug/mL), nystatin (25 ug/mL) and NaCl (2%). Plates were incubated at 30 °C for 4 weeks to allow colonies to grow. Strains were purified by successive replating on the initial isolation medium without antimicrobial supplements and stored in 20% glycerol at −80 °C. Strain 3158H.R.1.a.03 was isolated from a Truncatella sp. specimen (PMS-3143T).
Genomic DNA of 3158H.R.1.a.03 was extracted using the UltraClean Microbial DNA Isolation Kit (Mobio). The 16S rRNA gene was amplified by PCR using primers 27F (5’-AGAGTTTGATCCTGGCTCAG-3’) and 1492R (5’-TACGGYTACCTTGTTACG ACTT-3’) using a C1000 Touch Thermal Cycler (Bio-Rad) with the following conditions: 60 s of denaturation at 95 °C, 35 amplification cycles (30 s at 95 °C, 45 s at 54 °C and 60 s at 72 °C) and a final extension of 300 s at 72 °C. The amplified 16S rRNA gene was sent to Genewiz for Sanger sequencing using the PCR primers. The 16S rRNA gene sequence of 3158H.R.1a.03 was deposited in GenBank (accession number SUB3870064).
Bacterial Extract Library Preparation
Small-scale cultures of all pure isolates were used to prepare a chemical extract library. Each isolate was grown in appropriate liquid growth medium (5 mL) for 7 days at 30 °C with 180 rpm shaking. Cells were pelleted by centrifugation, and the supernatant was incubated with HP20 diaion resin for 2 h at room temperature. The resin was filtered, washed with H2O (100 mL) and 25% MeOH in H2O (20 mL) before finally eluting the with 100% MeOH (20 mL). The 100% MeOH elutions were dried in vacuo and resuspended in DMSO to make 10 mg/mL chemical extract stocks in a 96-well plate format, stored at −20 °C.
Calcium Assay
Cell lines U87MG were cultured in Dulbecco’s Modified Eagle Medium (DMEM) supplemented with 10% fetal bovine serum, L-glutamine (10 mM), penicillin (100 IU/mL), and streptomycin (100 IU/mL). Cells were plated in plated in poly-D-lysine coated 96-well plates at a density of 7,000 cells/well and incubated at 37 °C to allow cells to recover. Culture media was removed after 48 h of incubation, and each well was replenished with DMEM (100 μL) loaded with probenicid (25 μM) and 1x Fluo-4 Direct (from the Fluo-4 NW Calcium Assay Kit, Thermo Fisher), prepared according to the manufacturer’s specifications. The cells were incubated at 37 °C for 30 min to allow the dye to permeate into cells. Extracts or purified compounds (2 μL in DMSO) were added in DMEM (50 μL). Triton-X (50% diluted in DMEM), was added to lyse cell membranes, causing influxes of calcium (positive response), and any unused wells were left blank (negative). After the incubation period, the extract solutions from 96-well round bottom plate were directly added to the plate containing the cells. Relative fluorescence was measured with a BioTek Synergy 2 instrument and Gen5 1.11 software for 1 h, using a G1Ph protocol between the specified filters of 545/40 and 480/40 nm wavelengths for emissions and excitation, respectively.
Validation Assay
The image-based assay was developed as a rigorous method to retest any potential active extracts. Rather than reading bulk signaling, it measures individual cellular responses. Cells were cultured in four wells of a 24-well plate lined with a 12-mm gasket ring. To prevent cell clustering, cells were plated within the silicone ring with a cell density of 500 cells/well with DMEM, 5% FBS and 2% PS. After 48 h of incubation, Fura-2 dye (2 μM diluted in DMEM) was added to each well, according product specifications, and incubated for another 30 min. Using the microscope, images were taken of the cells within the silicone ring of a well, and 30–50 regions of interest (ROIs) were marked and saved. The dye was removed from the specific well, and the cells were washed with PBS to rinse away any remaining dye. The instrument was then used measured calcium levels under 380 and 340 nm wavelengths, specifically tracing activity within the selected ROIs. After instrument set up, cells were initially pulsed with acetylcholine (1 μM) or (10 μM) ATP to establish a responsivity baseline and cell activity within the first five minutes. After a resting period, the cells were then pulsed with the target extract or compound. Because pictures of the resting cells were taken beforehand and overlaid with the selected ROIs, the ROIs could be changed to follow cells that exhibited changes in fluorescence during the experiment. If excitation levels never returned to a resting baseline, another well within the plate was prepared and retested.
Isolation of Boholamide A (1)
Bioactivity-guided fractionation led to isolation of boholamide A (1), with each fraction assayed in the intracellular calcium assay. Nocardiopsis sp. 3158H.R.1a.03 was inoculated into 15 2.8 L Fernbach flasks, each containing Marine Broth (1 L; Difco). The strain was incubated for 7 days at 30 °C at 170 rpm. The culture broth was centrifuged to separate supernatant from cells. The supernatant was incubated with HP20 diaion resin for 4 h at room temperature. The resin was filtered over filter paper and washed with H2O to remove salt before eluting metabolites with MeOH. The MeOH extract was concentrated under reduced pressure, and the residual water-containing fraction was extracted three times with EtOAc. The organic extract was dried and fractionated on an end-capped C18 open column using a step-gradient of MeOH (30%, 40%, 50%, 60% 70%, 80%, 100%) in H2O. Fraction 5 eluting at 70% MeOH was further purified using an end-capped C18 column using 60% MeCN in water to give three fractions. The third fraction was further purified by C18 HPLC using 50% MeCN in H2O to give compound 1 (2.2 mg). The purity of the compound was assessed by analytical runs using the same HPLC conditions (Figure S20).
Boholamide A (1).
white powder, UV (MeOH) λmax (logε) 225 (4.44), 259 (4.32) nm; ECD (0.86 mM, MeOH), λmax (Δε) 235 (12.3), 264 (1.7) nm, 1H and 13C, Table 1. HRESIMS m/z 466.2933 [M+H]+ calcd for C24H40N3O6, 466.2917.
Configuration of Boholamide A (1).
The configuration of valine was determined using Marfey’s method.12 Boholamide A (1, ~0.1 mg) was dissolved in 6N HCl (200 μL) and hydrolyzed for 18 h at 110 °C. The residue was resuspended in H2O (50 μL). 1M NaHCO3 (20 μL) and 1% Nα-(2,4- dinitro-5-fluorophenyl)-L-leucinylamide in acetone (100 μL) were added, and the reaction mixture incubated at 37 °C for 1 h. The reaction was quenched using 1N HCl (20 μL). An aliquot (2 μL) of the quenched reaction was diluted with MeOH (300 μL) and subjected to LCMS. LCMS was performed using a Micromass Quattro-II (Waters) instrument using an Agilent Eclipse XDB-C18 column (4.6 × 150mm, 5 mm) with a linear gradient of 30%–100% mobile phase B over 20 min. (Solvent A, H2O with 0.05 % formic acid; solvent B, MeCN.) Parallel reactions were done using standards of L-valine and D-valine.
The preferred conformation of 1 was modelled using online ConfBuster (https://confbuster.ibis.ulaval.ca/), with default parameters.13 All possible configurations of 1 were modeled, and the resulting models were compared with ROESY data of 1. A similar protocol was followed using rakicidin A (2) as a standard. Using the ConfBuster output as a starting point, we created models in Gaussian and used the top 5 Gaussian conformations to determine the calculated ECD spectra, using our previously described method in the Center for High Performance Computing at the University of Utah.32 The resulting calculated spectra were compared to the experimental spectrum.
Synthesis of 3a and 3b.
To a solution of boholamide A (1, 1 mg) dissolved in MeOH (2 mL) was added Pd/C (2 mg). The mixture was stirred overnight under H2 at room temperature. The reaction mixture was centrifuged to separate the catalyst from the supernatant and dried in vacuo. Reduced boholamide A was dissolved in a solution of cold MeOH with 10% ether (1 mL). LiAlH4 (1.0 mg) was added to the solution, and the reaction mixture was stirred overnight in an ice bath. The supernatant was separated from the catalyst by centrifugation and dried in vacuo. The residue was resuspended in H2O, and the solution was titrated with TFA until pH ~7. Crude reaction products were recovered by back extraction using EtOAc. A inseparable mixture of 3a and 3b were then HPLC purified using a reversed-phase C18 column. NMR and MS spectra are shown in the Supporting Information.
MTT Proliferation Assay
Human cell lines U87MG, HUH7, CHO and A549 were cultured in DMEM with 10% FBS, L-glutamine (2 mM), penicillin (100 IU/mL) and streptomycin (100 μg/mL). A549 was cultured in Roswell Park Memorial Institute Medium 1640 10% FBS, L-glutamine (2 mM), penicillin (100 IU/mL) and streptomycin (100 μg/mL). Cells were seeded at 10,000 cells/well in 96 well-plates and incubated for 24 h at 37 °C. Cells were then treated with boholamide A (1), doxorubicin, or temozolomide (TMZ) at varying concentrations as indicated and incubated for 48 hours either in a CO2 incubator or in a hypoxic chamber at 37 °C. The medium was removed, and 3-(4,5-dimethylthiazol-2-yl)-2,5-diphenyltetrazolium (MTT; 25 μL of 0.5 mg/mL in PBS buffer) was added into wells and was further incubated for 2 h. DMSO (100 μL) was added before measuring absorbance at 570 nm using Spectra Max M5 (Molecular Devices). IC50 values were calculated using GraphPad Prism.
DRG Assay
CGRP-GFP mice (strain name: STOCK Tg(Calca-EGFP)FG104Gsat/Mmucd) were created by the Gensat project as previously described.33 In this mouse strain, GFP expression is driven by the gene regulatory elements of calcitonin gene-related peptide (CGRP), which primarily labels peptidergic nociceptors in the somatosensory neuronal cell population.
CGRP-GFP mice were used for the assay. Briefly, lumbar DRGs L1-L6 from CGRP-GFP mice dissected, trimmed, and then places in a balanced salt solution. They were then treated with 0.25% trypsin for 20 min. The DRGs were then gently mechanically triturated with decreasing diameters of fire polished Pasteur pipettes. Neurons were then plated into the center of a silicone ring (10 mm outer diameter 4.5 mm inner diameter) attached to the floor of a 24-well poly-D-lysine coated plate. After allowing the cells to adhere to the floor of the plate for approximately one to two hours. Solution A (700 μL) [minimal essential media (MEM (Invitrogen) supplemented with 10% fetal bovine serum (FBS), 1x penicillin/streptomycin, 10 mM HEPES, and 0.4% (w/v) glucose, pH 7.4] was gently added to each well. The plated cells were placed in a 5% CO2 incubator at 37 °C for ~16 – 24 h. Cells were then incubated with 4 μM Fura2-AM dye, for 1 h at 37 °C. The fluorescence of 340nm/380nm excitation ratio (510 nm emission) was used as an indicator of the relative level of intracellular calcium in each cell while applying a set of pharmacological agents at room temperature. Using a 12-bit camera the exposure for 340 nM excitation was set to where the maximum intensity (disregarding outliers) was 1000. This same exposure length was set for the 380 exposure. Exposure times ranges from 200–400 ms and each image was taken every 2 seconds for the duration of the experiment.
Pharmacological agents present in the experiment include KCl 40 mM, AITC 100 μM, and capsaicin 300 nM. Boholamide A (1) was incubated with cells for 7 seconds and tested at a series of concentrations of 1, 10, 50, 100, 500, and 900 nM.
Following the calcium imaging experiments, cells were incubated with Alexa-Flour 647 Isolectin B4 (IB4) at 2.5 μg/mL for 7 min at room temperature. Nis Elements was used to acquire the data, CellProfiler34 was used to create ROIs, and extract cellular information (like intensity, area, etc.). Custom in house software built in Python and R extracted video information, and trace data was analyzed with in house software built in the R language.
Mouse Cortex Cells
Following a published method,35 the cortex of a 2-day-old mouse was removed, placed in Hank’s Balanced Salt Solution (HBSS), and sliced into squares roughly 5% of the size of the cortex. The pieces of cortex were transferred to 900 μL ice-cold HBSS. Trypsin (2.5% wt/vol, 100 μL) was added, and the mixture and incubated for 5 min at 37 °C. Trypsin was removed by adding and removing solution A (4 mL) four times. Tissue was dissociated as described above for DRG neurons. 20 μL of the cell solution was transferred to the center of a silicone donut affixed to a poly-D-lysine-coated, 24-well tissue-culture plate. The inner diameter of the silicone donut was 4.5 mm. Cells were allowed to settle and adhere to the plate for 1 h in a 37 °C incubator before flooding the well with solution A (1 mL). Neurons were cultured overnight for 16–20 h at 37 °C with 5% CO2 atmosphere. Cells were imaged as described above. Boholamide A (1) was added at 1 μM.
Zebrafish Assay
TuAB zebrafish (Danio rerio) embryos were treated with DMSO vehicle control or Boholamide A at the concentration indicated from 6 hours post fertilization (hpf) to 1 day post fertilization at 28.5 °C. Bright-field images were obtained using a stereomicroscope (Zeiss SteREO Discovery. V8) equipped with a CCD camera (Zeiss AxioCam MRc). Animals (both mice and zebrafish) were maintained according to protocols approved by the University of Utah’s Institutional Animal Care and Use Committee.
Supplementary Material
Acknowledgments
Research reported in this publication was supported by the Fogarty International Center of the National Institutes of Health under Award Number U19TW008163. The content is solely the responsibility of the authors and does not necessarily represent the official views of the National Institutes of Health. All collections followed the Nagoya Protocol under supervision of the Department of Agriculture-Bureau of Fisheries and Aquatic Resources, Philippines (DA-BFAR) in compliance with all required legal instruments and regulatory issuances covering the conduct of the research. Specimens were collected under Gratuitous Permit numbers FBP-0036-10, GP-0054-11, GP-0064-12, GP-0107-15, and GP-0140-17. We thank the government and municipalities of the Philippines for access and help. We also acknowledge support from the L. S. Skaggs Presidential Endowed Chair. We thank M. Y. Koh, Y. S. Green, and E. Reichert for assistance with hypoxia selectivity experiments.
Footnotes
Associated Content
Supporting information is available free of charge
1D and 2D NMR data; ECD, MS, and configurational analysis data
Zebrafish assay
Time-lapse movie of mouse cortex cells
References
- 1.Ostrom QT; Gittleman H; Farah P; Ondracek A; Chen Y; Wolinsky Y; Stroup NE; Kruchko C; Barnholtz-Sloan JS Neuro. Oncol. 2013, 15 Suppl 2, ii1–56. [DOI] [PMC free article] [PubMed] [Google Scholar]
- 2.Taylor OG; Brzozowski JS; Skelding KA Front. Oncol. 2019, 9, 963. [DOI] [PMC free article] [PubMed] [Google Scholar]
- 3.Haar CP; Hebbar P; Wallace GCT; Das A; Vandergrift WA; Smith JA; Giglio P; Patel SJ; Ray SK; Banik NL Neurochem. Res. 2012, 37, 1192–1200. [DOI] [PMC free article] [PubMed] [Google Scholar]
- 4.Maklad A; Sharma A; Azimi I Cancers 2019, 11. [DOI] [PMC free article] [PubMed] [Google Scholar]
- 5.Monteith GR; Davis FM; Roberts-Thomson SJ J. Biol. Chem. 2012, 287, 31666–31673. [DOI] [PMC free article] [PubMed] [Google Scholar]
- 6.Jacobsen KM; Villadsen NL; Torring T; Nielsen CB; Salomon T; Nielsen MM; Tsakos M; Sibbersen C; Scavenius C; Nielsen R; Christensen EI; Guerra PF; Bross P; Pedersen JS; Enghild JJ; Johannsen M; Frokiaer J; Overgaard J; Horsman MR; Busk M; Poulsen TB Cell Chem. Biol. 2018, 25, 1337–1349. [DOI] [PubMed] [Google Scholar]
- 7.Yamazaki Y; Kunimoto S; Ikeda D Biol. Pharm. Bull. 2007, 30, 261–265. [DOI] [PubMed] [Google Scholar]
- 8.Allen M; Bjerke M; Edlund H; Nelander S; Westermark B Sci. Transl. Med. 2016, 8, 354re3. [DOI] [PubMed] [Google Scholar]
- 9.McBrien KD; Berry RL; Lowe SE; Neddermann KM; Bursuker I; Huang S; Klohr SE; Leet JE J. Antibiot. 1995, 48, 1446–1452. [DOI] [PubMed] [Google Scholar]
- 10.Igarashi M; Shida T; Sasaki Y; Kinoshita N; Naganawa H; Hamada M; Takeuchi TJ Antibiot. 1999, 52, 873–879. [DOI] [PubMed] [Google Scholar]
- 11.Carr G; Poulsen M; Klassen JL; Hou Y; Wyche TP; Bugni TS; Currie CR; Clardy J Org. Lett. 2012, 14, 2822–2825. [DOI] [PMC free article] [PubMed] [Google Scholar]
- 12.Bhushan R; Bruckner HJ Chromatogr. B 2011, 879, 3148–3161. [DOI] [PubMed] [Google Scholar]
- 13.Barbeau X; Vincent AT; Lagüe PJ Open Res. Soft. 2018, 6, 1. [Google Scholar]
- 14.Sang F; Li D; Sun X; Cao X; Wang L; Sun J; Sun B; Wu L; Yang G; Chu X; Wang J; Dong C; Geng Y; Jiang H; Long H; Chen S; Wang G; Zhang S; Zhang Q; Chen YJ Am. Chem. Soc. 2014, 136, 15787–15791. [DOI] [PubMed] [Google Scholar]
- 15.Oku N; Matoba S; Yamazaki YM; Shimasaki R; Miyanaga S; Igarashi YJ Nat. Prod. 2014, 778, 2561–2565. [DOI] [PubMed] [Google Scholar]
- 16.Yang Z; Ma M; Yang CH; Gao Y; Zhang Q; Chen YJ Nat. Prod. 2016, 79, 2408–2412. [DOI] [PubMed] [Google Scholar]
- 17.Yang Z; Yang G; Ma M; Li J; Liu J; Wang J; Jiang S; Zhang Q; Chen Y Org. Lett. 2015, 17, 5725–2727. [DOI] [PubMed] [Google Scholar]
- 18.Teichert RW; Schmidt EW; Olivera BM Annu. Rev. Pharmacol. Toxicol. 2015, 55, 573–589. [DOI] [PMC free article] [PubMed] [Google Scholar]
- 19.Giacobassi MJ; Leavitt LS; Raghuraman S; Alluri S; Chase K; Finol-Urdaneta RK; Terlau H; Teichert RW; Olivera BM Proc. Natl. Acad. Sci. U S A 2019, epub. [DOI] [PMC free article] [PubMed] [Google Scholar]
- 20.Tsakos M; Jacobsen KM; Yu W; Poulsen TB Synlett 2016, 27, 1898–1906. [Google Scholar]
- 21.Igarashi Y; Shimasaki R; Miyanaga S; Oku N; Onaka H; Sakurai H; Saiki I; Kitani S; Nihira T; Wimonsiravude W; Panbangred WJ Antibiot. 2010, 63 (9), 563–565. [DOI] [PubMed] [Google Scholar]
- 22.Kitani S; Ueguchi T; Igarashi Y; Leetanasaksakul K; Thamchaipenet A; Nihira TJ Antibiot. 2018, 71, 139–141. [DOI] [PubMed] [Google Scholar]
- 23.Nishioka H; Nakajima S; Nagashimna M; Kojiri K; Suda H Patent JP 10147594 A19980602, 1998.
- 24.Villadsen NL; Jacobsen KM; Keiding UB; Weibel ET; Christiansen B; Vosegaard T; Bjerring M; Jensen F; Johannsen M; Torring T; Poulsen TB Nat. Chem. 2017, 9, 264–272. [DOI] [PubMed] [Google Scholar]
- 25.Takeuchi M; Ashihara E; Yamazaki Y; Kimura S; Nakagawa Y; Tanaka R; Yao H; Nagao R; Hayashi Y; Hirai H; Maekawa T Cancer Sci. 2011, 102, 591–596. [DOI] [PubMed] [Google Scholar]
- 26.Clement LL; Tsakos M; Schaffert ES; Scavenius C; Enghild JJ; Poulsen TB Chem. Commun. 2015, 51, 12427–12430. [DOI] [PubMed] [Google Scholar]
- 27.Sang F; Ding Y; Wang J; Sun B; Sun J; Geng Y; Zhang Z; Ding K; Wu LL; Liu JW; Bai C; Yang G; Zhang Q; Li LY; Chen YJ Med. Chem. 2016, 59, 1184–1196. [DOI] [PubMed] [Google Scholar]
- 28.Chen J; Li J; Wu L; Geng Y; Yu J; Chong C; Wang M; Gao Y; Bai C; Ding Y; Chen Y; Zhang Q Eur. J. Med. Chem. 2018, 151, 601–627. [DOI] [PubMed] [Google Scholar]
- 29.Tsakos M; Clement LL; Schaffert ES; Olsen FN; Rupiani S; Djurhuus R; Yu W; Jacobsen KM; Villadsen NL; Poulsen TB Angew. Chem. Int. Ed. Engl. 2016, 55, 1030–1035. [DOI] [PubMed] [Google Scholar]
- 30.Wang J; Kuang B; Guo X; Liu J; Ding Y; Li J; Jiang S; Liu Y; Bai F; Li L; Zhang Q; Zhu XY; Xia B; Li CQ; Wang L; Yang G; Chen YJ Med. Chem. 2017, 60, 1189–1209. [DOI] [PubMed] [Google Scholar]
- 31.Distel DL; Altamia MA; Lin Z; Shipway JR; Han A; Forteza I; Antemano R; Limbaco M; Tebo AG; Dechavez R; Albano J; Rosenberg G; Concepcion GP; Schmidt EW; Haygood MG Proc. Natl. Acad. Sci. U S A 2017, 114, E3652–E3658. [DOI] [PMC free article] [PubMed] [Google Scholar]
- 32.Lin Z; Phadke S; Lu Z; Beyhan S; Abdel Aziz MH; Reilly C; Schmidt EW J. Nat. Prod. 2018, 81, 2605–2611. [DOI] [PMC free article] [PubMed] [Google Scholar]
- 33.Gong S; Zheng C; Doughty ML; Losos K; Didkovsky N; Schambra UB; Nowak NJ; Joyner A; Leblanc G; Hatten ME; Heintz N Nature 2003, 425, 917–925. [DOI] [PubMed] [Google Scholar]
- 34.Jones TR; Kang IH; Wheeler DB; Lindquist RA; Papallo A; Sabatini DM; Golland P; Carpenter AE, BMC Bioinform. 2008, 9, 482. [DOI] [PMC free article] [PubMed] [Google Scholar]
- 35.Curtice KJ; Leavitt LS; Chase K; Raghuraman S; Horvath MP; Olivera BM; Teichert RW J. Neurophysiol. 2016, 115, 1031–1042. [DOI] [PMC free article] [PubMed] [Google Scholar]
Associated Data
This section collects any data citations, data availability statements, or supplementary materials included in this article.


