Abstract
Oceanographic changes adjacent to Antarctica have global climatic and ecological impacts. However, this is the most challenging place in the world to obtain marine data due to its remoteness and inhospitable nature, especially in winter. Here, we present more than 2000 Conductivity-Temperature-Depth (CTD) profiles and associated water sample data collected with (almost uniquely) full year-round coverage from the British Antarctic Survey Rothera Research Station at the west Antarctic Peninsula. Sampling is conducted from a small boat or a sled, depending on the sea ice conditions. When conditions allow, sampling is twice weekly in summer and weekly in winter, with profiling to nominally 500 m and with discrete water samples taken at 15 m water depth. Daily observations are made of the sea ice conditions in the area. This paper presents the first 20 years of data collection, 1997-2017. This time series represents a unique and valuable resource for investigations of the high-latitude ocean’s role in climate change, ocean/ice interactions, and marine biogeochemistry and carbon drawdown.
Subject terms: Ocean sciences, Physical oceanography, Marine chemistry
Background & Summary
The seas around Antarctica are globally important, being intimately connected to the rest of the Earth System. Processes on the Antarctic shelves lead to the formation of the densest waters that participate in the global ocean overturning circulation, and hence play a large role in setting planetary climate1,2. The water column is highly biologically productive due to the input of micronutrients from sediments and glaciers, in addition to the high macronutrient concentrations from the upwelling of circumpolar deep water; this structures the marine ecosystem and plays a leading role in ocean carbon cycling3,4. These oceans lie adjacent to, and beneath, Antarctic ice shelves and marine terminating glaciers, which are being melted by ocean heat, with consequences for sea level rise globally5–7. It is thus of key importance to obtain sustained oceanographic measurements here, however this is especially challenging due to the remoteness and inhospitable nature of the environment. This is particularly the case during the austral winter, when extensive sea ice cover and shortened daylength (with up to 24-hour darkness) hamper operations. As such, year-round observations have great scientific value, given the systematic seasonal biases in nearly all existing datasets.
Here we report such a year-round dataset collected at Rothera Research Station, which is located adjacent to Ryder Bay, and embayment within Marguerite Bay, at 67°34′8″S, 68°7′29″W on the eastern side of Adelaide Island at the west Antarctic Peninsula (WAP; Fig. 1). It is now the principal base of the British Antarctic Survey (BAS), with both a deep-water wharf and, since 1992, a 900 m gravel runway. The focus of marine science sampling was relocated to Rothera from Signy Research Station on the South Orkney Islands (60°43′0″S, 45°36′0″W) following the completion of the runway and the start of regular flights to Rothera from South America and the Falkland Islands in 1994. This led to the inception of the Rothera Oceanographic and Biological Time Series (RaTS) in 19978. The first twenty years of oceanographic and water sampling data from RaTS are presented here. Observations are ongoing, with the intention that this dataset will be updated on a five-yearly basis.
Fig. 1.
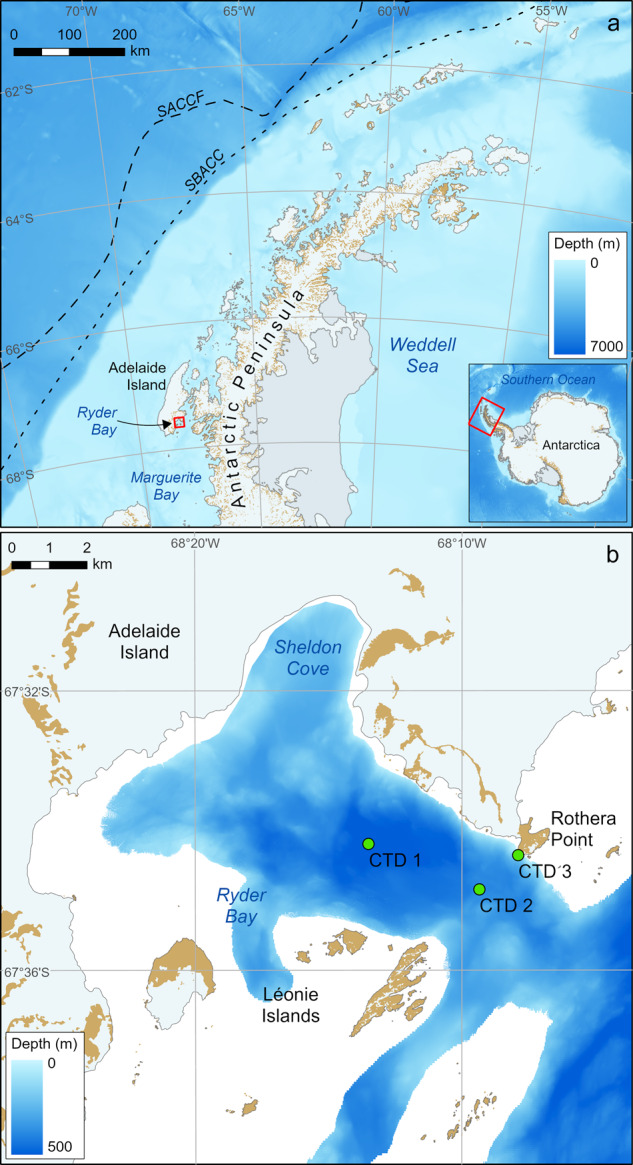
Sampling locations. (a) location of Ryder Bay within Marguerite Bay at the west Antarctic Peninsula, WAP; (b) sampling sites within Ryder Bay used in Rothera Time Series (CTD sites 1, 2, and 3 shown by green circles). SACCF = Southern Antarctic Circumpolar Current Front; SBACC = Southern Boundary of the Antarctic Circumpolar Current.
The WAP has a relatively mild and maritime climate by Antarctic standards, with temperatures above freezing for much of summer and falling to around −20 °C in winter. Sea ice forms in winter but is not always present or persistent, depending on variability in air temperature and wind strength and direction. Deep waters are relatively warm (≈1 °C) and some of this heat can be vented to the atmosphere, especially in winters with low sea ice cover and hence sustained periods where deep mixing and air-sea fluxes can persist (Fig. 2). These factors combine to create significant variability through the time series on seasonal and interannual timescales.
Fig. 2.
The time series of mixed layer depth (MLD, red line) at the RaTS site and fast ice cover in Ryder Bay (black line), measured as part of the RaTS program.
The atmosphere of the WAP has warmed strongly over the past several decades9, though with an apparent hiatus since around the turn of the century. The summertime surface ocean and deep ocean have warmed significantly since the middle of the last century through to the year 2000, with strong impacts on glacial retreat5,10. The two decades of data presented here span a significant part of this period, though quantification and investigation of potential trends will be pursued in separate publications.
The deep waters on the WAP shelf are modified Circumpolar Deep Water (mCDW). This derives from the CDW that flows along the shelf break at the southern edge of the Antarctic Circumpolar Current (ACC); this crosses the physical and dynamical barrier of the shelf break to flow onto the WAP shelf. The water reaching the area around Rothera is particularly strongly modified due to the convoluted route through narrow deep channels, with sills blocking the densest water and creating localised mixing due to the overflows11. The sill depth into Ryder Bay is 350 m, thus water below these depths will have previously overflowed the sill and likely entrained some overlying water as it does so, leading to some seasonal and interannual variability in deep water properties.
Whilst these deeper waters (~150 m and below) show relatively little seasonal variability in temperature and salinity (Figs. 3, 4), the overlying waters show pronounced seasonal changes due to wind-driven and convective mixing in winter. This process creates a deep winter mixed layer (50–100 m thick), which is overlaid in summer with waters that are warmed by insolation and freshened by ice melt. Interannual changes in the depth of winter mixing, often tied to sea ice concentration in winter, result in year-on-year changes in near-surface water mass properties. Low sea ice years have deeper mixed layer depths due to increased wind-driven mixing12, with less sea ice formation due to relatively warm air temperatures13.
Fig. 3.
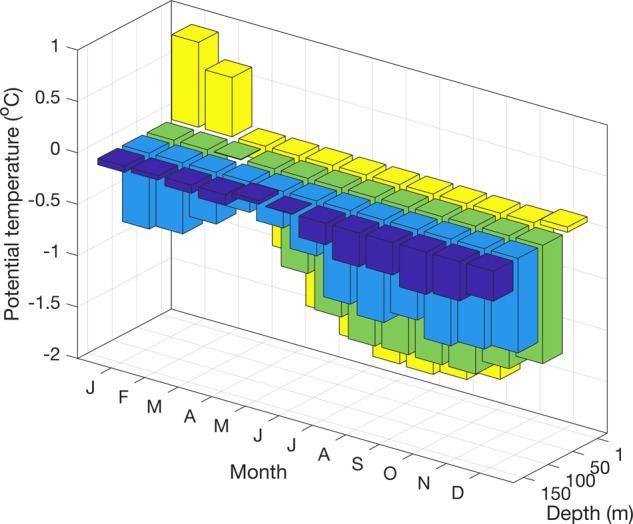
Seasonal climatology of potential temperature measurements at different depth levels (1, 50, 100, and 150 m) from the RaTS dataset (1997–2017).
Fig. 4.
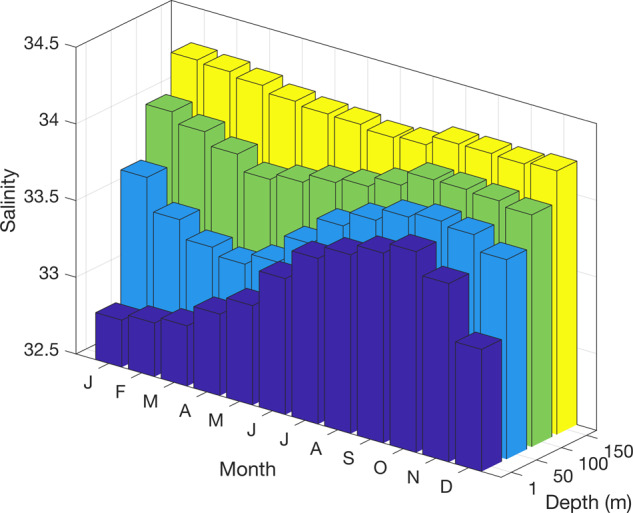
Seasonal climatology of practical salinity measurements at different depth levels (1, 50, 100, and 150 m) from the RaTS dataset (1997–2017). Note depth axis reversed relative to Fig. 3.
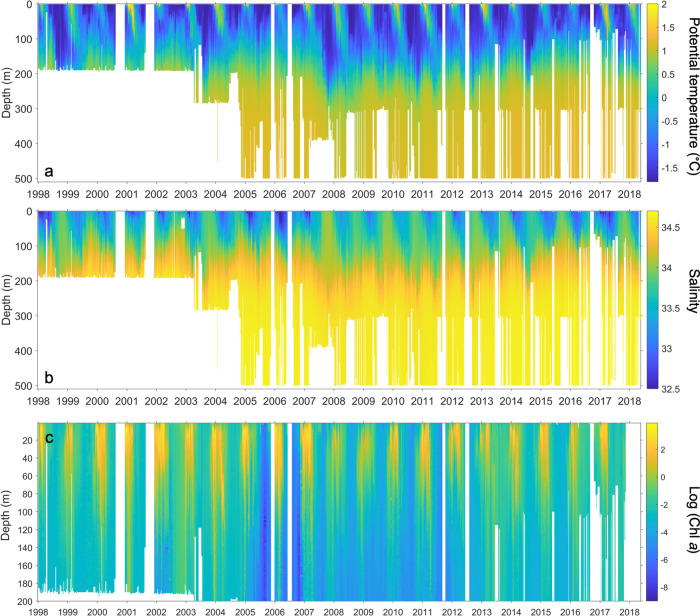
The supply of macronutrients from the mCDW, trace metals from the glacial outflow, shelf sediments and nearshore areas and the strong surface stratification from ice melt (sea ice and glacial ice) mean that conditions are sometimes near optimal for phytoplankton growth14–17. Chlorophyll a concentrations can exceed 20 mg m−3 at the peak of the spring and summer phytoplankton blooms, in contrast to midwinter values well below 0.1 mg m−3 (Fig. 5).
Fig. 5.
(a) Potential temperature, (b) Practical salinity and (c) Logarithm of total chlorophyll a concentration from the RaTS site, measured as part of the RaTS program.
The RaTS program has clearly shown the value in sustained observations and sampling in the marginal ice zone on the WAP. The time series has been supported by the US Antarctic Program Palmer Long Term Ecological Research (LTER) study18,19, with a near-annual intercomparison station in Marguerite Bay as part of the annual LTER grid along the WAP on the R/V Laurence M. Gould, for calibration purposes (see below). The RaTS sampling has captured the variability throughout the annual cycle, made possible due to sampling in the polar winter and spring. In addition, the time series highlights interannual variability, which is influenced strongly by winter sea ice changes and, therefore, the meteorological forcings of that variability14. The changes in water mass characteristics from particularly low sea ice years can be seen through the following summer in a range of parameters, and at depth can persist on a decadal timescale when sea ice anomalies are more widespread14. The level to which significant decadal variability/trends exist in the data depends on multiple factors, including the nature and forcings of each variable being considered and the level of seasonal and interannual variability of that variable (subject explored in separate publications14). The addition of autonomous underwater gliders to the RaTS program has provided an increase in temporal and spatial resolution of physical and bio-optical parameters, and these data are reported separately11.
The RaTS program sampling has provided a foundation for other scientific research projects to run alongside the core time-series sampling, for varying periods according to purpose. The additional expertise and equipment that these projects have brought have greatly increased the measurements achieved by the wintering scientists running the time series from Rothera. These projects have been run through BAS core funding, three individual UK Natural Environment Research Council (NERC) research fellowships, Antarctic Funding Initiative, Collaborative Gearing Scheme (CGS) and Collaborative Antarctic Science Scheme (CASS) projects (where BAS hosts visiting UK-based scientists) and a collaboration with the Netherlands Polar Programme. These include (but are not limited to) projects focused on: internal tides and coastal upwelling20; inorganic carbon chemistry21; macronutrients and trace metals3,15,16,22,23; climate active gases24–26; sediment trap moorings and export27–29; and phytoplankton community dynamics17,30.
Methods
Measurements are led by a wintering scientist (Marine Assistant) based at Rothera Research Station, supported by the boating team and other personnel on station. In the early part of the record, Marine Assistants would typically spend two consecutive winters (spanned by three summers) in Antarctica, though this has since reduced to one winter and two summers. Overlap of personnel in summer allows for training and handover of duties.
Sampling occurs throughout the year, with typically more events in the austral summer compared with winter due to weather and sea ice conditions (Fig. 6). Most of the sampling is carried out from a small boat with a hand winch. The CTD profiling was carried out to 200 m water depth until 2003, with subsequent profiles carried out for the full depth of the water column, down to 500 m at the primary site (site 1). This change marks the switch from a Chelsea Instruments Aquapak CTD (rated to 200 m) to a pair of SBE19 CTDs rated to 600 m. The CTDs are attached to a Kevlar rope, marked with graded depth markers, and lowered and recovered by a hand winch, with data downloaded in the laboratory at Rothera Research Station after recovery. The CTDs are swapped and calibrated in the UK every other year when possible.
Fig. 6.
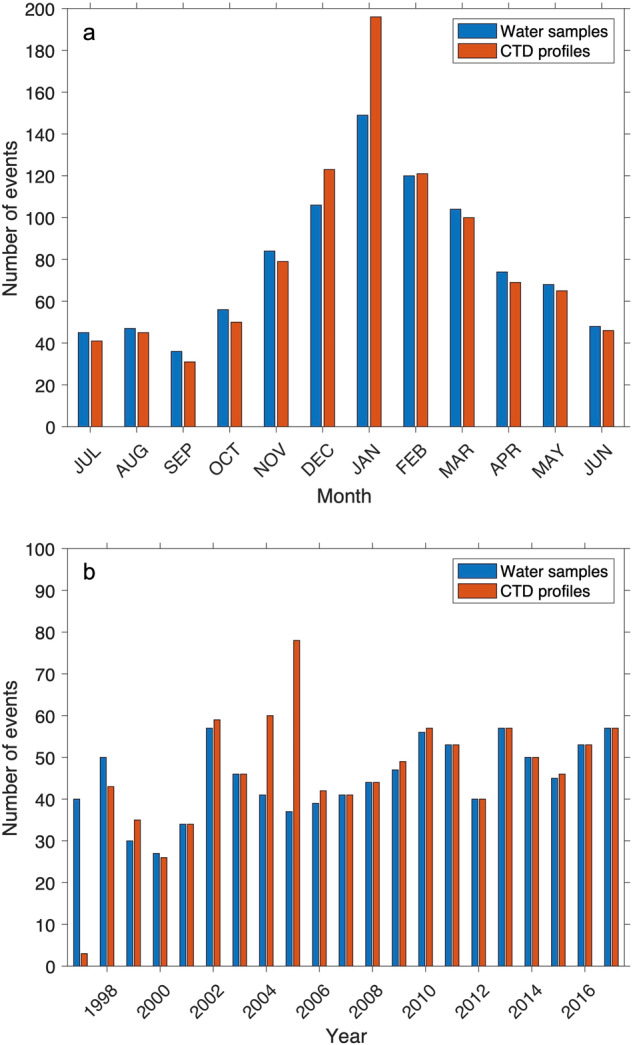
Number of discrete water samples (blue) and CTD profiles (red) carried out as part of the RaTS program plotted against (a) month and (b) year.
The deepest part of the bay at site 1 is approximately 4 km from Rothera Research Station (Fig. 1), at a water depth of 500 m. Site 2 is 300 m deep and is used when sea ice conditions make site 1 inaccessible, though access through brash ice with a small boat is often achievable, especially with calm conditions and careful boat handling. Some casts are taken close to the wharf to 100 m (site 3) if site 2 is also unreachable. When there is traversable sea ice, the winch is fitted to a sled and towed to one of the sampling points either manually or by skidoo. A hole is then cut in the ice with a chainsaw and the profiling and sample taken as per methods employed from the small boat when fast ice is not present.
The small boat and CTD deployment methodology allows for relatively undisturbed sampling close to the surface. When sampling, the boat is slowed and held at a stop over the chosen site to reduce impact on the water being measured. This approach allows the CTD to measure to within 50 cm of the surface given the configuration of the pumping setup. This is in contrast to stopping a large research vessel and using a larger ship-deployed CTD, where structure in the upper 10 m is often destroyed by mixing. Given the large amounts of meltwater and the importance of surface stratification on setting many of the key processes we seek to address, this is an important distinction. The CTD sensors are generally soaked for three minutes at 15 m water depth, except when profiling through sea ice, or other times when the air temperature is low, when the initial soak is at 40 m to remove ice that might have built up on the frame during transit or during first contact with the seawater.
Water is sampled from 15 m using a Niskin bottle, closed by a messenger weight. Other samples are taken directly from just below the surface from over the side of the boat. Water samples have been taken from other depths using a Niskin bottle by these means, but this requires extra time and effort for winching; accordingly, comprehensive profiles of water sample-derived properties within RaTS are rare. After returning to Rothera (journey time up to 45 minutes depending on site and conditions), samples are transferred to the Bonner Laboratory for analysis, or processing/storage before transferring to the UK for analysis.
Discrete water samples
Chlorophyll a and phaeopigment
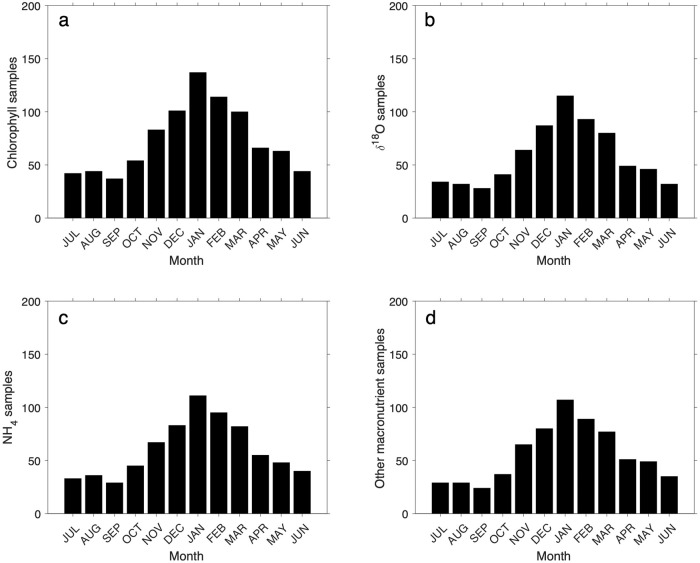
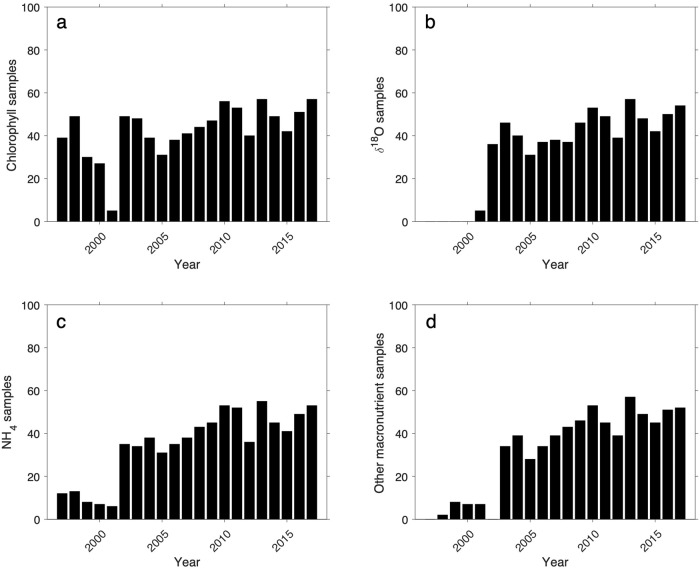
Collected water samples were mixed gently by inversion, and triplicate samples (100 ml in summer and 500 ml in winter, adjusted for expected chlorophyll a concentrations to 250 ml in summer and 2000 ml in winter) were gravity-filtered immediately on return to the research station through sequential 47 mm filters as follows: i) microphytoplankton (>20 μm size fraction via nylon mesh), ii) large nanophytoplankton (5 to 20 μm size fraction via membrane filters), iii) small nanophytoplankton (2 to 5 μm size fraction via membrane filters), iv) picophytoplankton (0.2 to 2 μm size fraction via membrane filters). Pigments were extracted into chloroform/methanol31 and measured by fluorometry (Turner AU-10 fluorometer) before and after addition of two drops of 0.1 N HCl under low light levels. Data density of chlorophyll a and other discrete water sample measurements are shown in Figs. 7, 8.
Fig. 7.
Number of sampling events per month for different parameters at RaTS: (a) size-fractionated chlorophyll a; (b) δ18O of seawater; (c) ammonium; (d) other inorganic macronutrients (nitrate, nitrite, silicic acid, phosphate).
Fig. 8.
Number of discrete water sample measurements made per year for different parameters at RaTS: (a) size-fractionated chlorophyll a; (b) δ18O of seawater; (c) ammonium; (d) other inorganic macronutrients (nitrate, nitrite, silicic acid, phosphate).
Inorganic macronutrients
Water samples for the determination of macronutrient concentrations were filtered as soon as possible after collection (GF/C until 2015 and a PALL Acrodisc 32 mm Syringe Filter with 0.8/0.2 μm Supor Membrane and a 60 ml syringe after 2015). Ammonium (measured as ) was analysed at Rothera Research Station typically within four hours of collection. From 1997 to 2005 ammonium measurements were carried out using the indophenol technique adapted to utilise dichloroisocyanurate as the chlorine donor and a modified UV incubation32. The measurements were calibrated by spiking of triplicate samples33. From 2005, ammonium measurements were carried out using ortho-phthaldialdehyde (OPA) and fluorometry34. Sample measurements were carried out in triplicate using a Turner TD-700 fluorometer8.
Before 2002, other macronutrients (nitrate (), nitrite (), orthophosphate () and silicic acid (Si(OH)4)) were measured using standard wet chemistry approaches in Rothera Research Station33. After 2002, these macronutrient samples were frozen at −20 °C and measured in the UK using a standard nutrient autoanalyser approach35. From 2002 to 2017, the samples were measured at the National Oceanography Centre, Southampton (SEAL QuAAtro39 segmented flow auto-analyser); from 2017 onwards, the samples were measured at the Plymouth Marine Laboratory (SEAL analytical AAIII segmented flow colorimetric auto-analyser36).
Seawater oxygen isotopes
As a tracer measured in tandem with salinity, seawater oxygen isotopes (denoted by δ18O) inform on the relative prevalence of sea ice melt in the water sampled compared with freshwater from meteoric sources (precipitation and glacial melt); it thus has great value in determining the origin of substances delivered to the ocean via the freshwater system37. Unfiltered water samples were stored in capped and sealed glass bottles with rubber inserts and minimal head space and kept in the dark at +4 °C during transport to the UK37. The samples were measured for δ18O using the CO2 equilibration method for oxygen38 in triplicate (Natural Environment Research Council Isotope Geosciences Laboratory, Keyworth, UK). Before 2012, the δ18O measurements were made with a SIRA 10 mass spectrometer plus Isoprep18 device. From 2012 to 2017, the δ18O measurements were made with an Isoprime 100 mass spectrometer plus Aquaprep device.
Sea ice observations
Direct (human) observations of ice type and coverage are made on a daily basis by the Marine Assistant, with up to three types of ice observed recorded at any one time. Ice coverage is given in tenths. Ice categories are given in Table 5.
Table 5.
Categories of sea ice observations recorded as part of the RaTS program (1997–2017).
| Abbreviations are as follows: |
| C = Clear |
| G = Grease ice (unconsolidated ice crystals giving the sea surface a grey appearance) |
| Pn = Pancake ice (predominantly circular pieces of ice up to 3 m in diameter, |
| with raised rims where individual pieces have ground together in swell) |
| B = Brash ice (floating ice fragments up to 2 m across, formed from wreckage of other forms of ice, including meteoric ice) |
| P = Pack ice (individual floes of ice, typically larger than 2 m) |
| F = Fast ice (sea ice which remains fast, that is attached to, the coast or islands) |
| NR = Not recorded |
| Date source abbreviations: |
| O = ice observed and recorded |
| I = inferred, i.e., no observation made but status inferred from observations on other dates |
Data Records
CTD profiles
The Data Records are provided in comma-separated values (.csv) and NetCDF (.nc) formats and are held by the UK Polar Data Centre39. The data coverage of CTD casts is shown in Fig. 6. The sensor data are recorded in Rats_CTD_1998_2017_SL.csv and Rats_CTD_1998_2017_SL.nc (Table 1). The derived variables are recorded in Rats_Strat_1998_2017_SL.csv and Rats_Strat_1998_2017_SL.nc (Table 2).
Table 1.
Structure of Rats_CTD_1998_2017_SL.csv and Rats_CTD_1998_2017_SL.nc files, reporting CTD sensor data.
| Variable description | Variable name in the file |
|---|---|
| Rats_CTD_1998_2017_SL.csv | |
| CTD Site (1,2 or 3) | Ryder_Bay_Sampling_site |
| Event number | EventIndex |
| Year | Year |
| Month | Month |
| Day of the month | DayOfMonth |
| Water depth | depth_m |
| Pressure | sea_water_pressure_due_to_sea_water_dbar |
| Conductivity | sea_water_electrical_conductivity_S_m-1 |
| In situ temperature | sea_water_temperature_C |
| Practical salinity | sea_water_practical_salinity |
| PAR | downwelling_photosynthetic_photon_flux_in_sea_water_mol_m-2_s-1 |
| Fluorescence | fluorescence |
| Chlorophyll a | mass_concentration_of_chlorophyll_in_sea_water_mg_m-3 |
| Rats_CTD_1998_2017_SL.nc | |
| CTD Site (1,2 or 3) | Ryder_Bay_Sampling_site |
| Event number | EventIndex |
| Year | Year |
| Month | Month |
| Day of the month | DayOfMonth |
| Water depth | depth |
| Units = ‘m’ | |
| Pressure | sea_water_pressure_due_to_sea_water |
| Units = ‘dbar’ | |
| Conductivity | sea_water_electrical_conductivity |
| Units = ‘S m-1’ | |
| In situ temperature | sea_water_temperature |
| Units = ‘degree C’ | |
| Practical salinity | sea_water_practical_salinity |
| PAR | downwelling_photosynthetic_photon_flux_in_sea_water |
| Units = ‘mol m-2 s-1’ | |
| Fluorescence | fluorescence |
| Chlorophyll a | mass_concentration_of_chlorophyll_in_sea_water |
| Units = ‘mg m-3’ | |
Table 2.
Structure of Rats_Strat_1998_2017_SL.csv and Rats_Strat_1998_2017_SL.nc files, reporting CTD sensor data and derived physical oceanographic variables from the RaTS program (1997–2017).
| Variable description | Variable name in the file |
|---|---|
| Rats_Strat_1998_2017_SL.csv | |
| CTD Site (1,2 or 3) | Ryder_Bay_Sampling_site |
| Event number | EventIndex |
| Year | Year |
| Month | Month |
| Day of the month | DayOfMonth |
| MLD referenced to 0 m | Mixed_Layer_Depth_deltasigma_0p05_m |
| MLD referenced to 10 m | Mixed_Layer_Depth_deltasigma_0p05_refdepth_10 m_m |
| Stratification calculated at 10 m depth intervals | Potential_energy_anomaly_stratification_refdepth_10 m_J_m-2 |
| Potential_energy_anomaly_stratification_refdepth_20m_J_m-2 | |
| Potential_energy_anomaly_stratification_refdepth_30m_J_m-2 | |
| Potential_energy_anomaly_stratification_refdepth_40m_J_m-2 | |
| Potential_energy_anomaly_stratification_refdepth_50m_J_m-2 | |
| Potential_energy_anomaly_stratification_refdepth_60m_J_m-2 | |
| Potential_energy_anomaly_stratification_refdepth_70m_J_m-2 | |
| Potential_energy_anomaly_stratification_refdepth_80m_J_m-2 | |
| Potential_energy_anomaly_stratification_refdepth_90m_J_m-2 | |
| Potential_energy_anomaly_stratification_refdepth_100m_J_m-2 | |
| Rats_Strat_1998_2017_SL.nc | |
| CTD Site (1,2 or 3) | Ryder_Bay_Sampling_site |
| Event number | EventIndex |
| Year | Year |
| Month | Month |
| Day of the month | DayOfMonth |
| Stratification calculated at 10 m depth intervals | Potential_energy_anomaly_startification_10m_increments |
| Units = ‘J m-2’ | |
| MLD referenced to 0m | Mixed_Layer_Depth_deltasigma_0p05 |
| Units = ‘m’ | |
| MLD referenced to 10m | Mixed_Layer_Depth_deltasigma_0p05_refdepth_10m |
| Units = ‘m’ | |
Discrete water samples
The Data Records are provided as comma separated variable (.csv; Table 3) and are held by the UK Polar Data Centre39, with each record listing the Event number, Date (YYYY-MM-DD), the parameter (and units), and any additional comments. The data coverage of the discrete water samples, and seawater parameters measured from the samples, is shown in Figs. 7, 8.
Table 3.
Comma separated variable datasets for discrete water sample parameters made as part of the RaTS program (1997–2017).
| Parameter | Filename |
|---|---|
| Ammonium () | ammonia.csv |
| Silicic acid (Si(OH)4) | silicate.csv |
| Phosphate () | phosphate.csv |
| Nitrite () | nitrite.csv |
| Nitrate () | nitrate.csv |
| Seawater oxygen isotopes (δ18O) | oxygen_isotope.csv |
| Size-fractionated chlorophyll a | chlorophyll.csv |
| Parameter | Readme file |
| Size-fractionated chlorophyll a | chlorophyll_readme.txt |
Sea ice
The Data Records are provided as comma separated variable (.csv; Table 4) and are held by the UK Polar Data Centre39, with each record listing the Event number, Date (YYYY-MM-DD), the site, ice observations, and any additional comments. Abbreviations used in the ice observation dataset are shown in Table 5 and in ice_data_readme.txt.
Table 4.
Comma separated variable datasets for ice observations made as part of the RaTS program (1997–2017).
| Parameter | Filename |
|---|---|
| Ice coverage in South Cove (south of Rothera runway) | ice_data_south_cove.csv |
| Ice coverage in Ryder Bay | ice_data_ryder_bay.csv |
| Ice coverage in Hangar Cove (north of Rothera runway) | ice_data_hangar_cove.csv |
Technical Validation
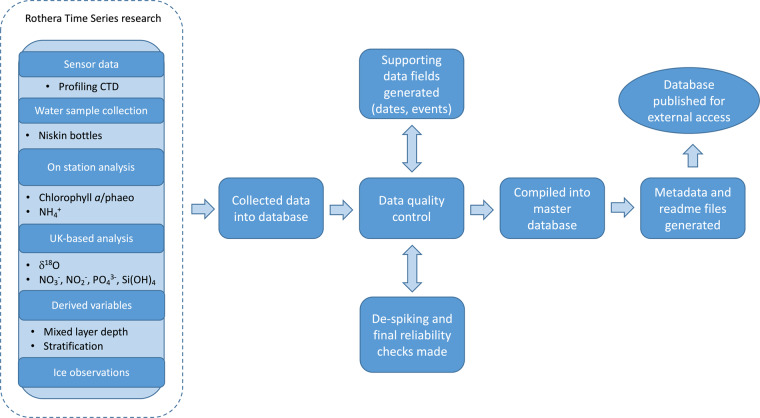
The compilation of the datasets is shown in Fig. 9, with details of the quality control given below.
Fig. 9.
Flowchart of how the RaTS datasets were compiled including collection of sensor data, water sample collection and analyses, data processing and utilisation.
CTD profiles
Salinity
In polar waters, with temperatures normally below 4 °C, density profiles are largely governed by the shape of the salinity profile. This means that salinity checks can also include density profile checks and the dynamical feasibility of density overturns. There are a limited number of casts with significant density overturns. As these would make the profiles statically unstable (dense water above less dense), in almost all cases they can be ascribed to sensor problems. They can happen throughout a profile but are more common at the surface or bottom of the profile. They were screened by detecting overturns of >0.05 kg m−3 and by seeking unusually large deviations between different mixed layer depth calculations (including using the 10 m depth as the reference value). Spikes were then identified and removed manually in salinity in the initial processing. This is usually between 1 and 7 metres of data, though some profiles are completely removed where pump problems make all data invalid. The precision of the salinity data is ensured by discrete samples being collected and by joint casts between the RaTS CTD(s) and that used by the Palmer LTER program, with adjustments applied in initial processing.
Temperature
Temperature has little effect on density in the range encountered and is therefore free to vary up and down with depth such that there is no way to ascribe a profile to be physically implausible. The temperature data have been very robust, with no suspicious profiles and very tight matches in all joint casts, it is therefore presented as recorded, except for profiles with pump problems.
Photosynthetically active radiation
From 2017 there have been repeating problems with the Photosynthetically Active Radiation (PAR) sensors, despite servicing and replacement. Some values at depth are easily filtered as impossible but other times the values are within bounds but the shape of the profile is implausible. There are standard sampling issues, caused by shading from the boat, ice and varying cloud coverage, such that mean light can increase rapidly with time and/or depth. This makes filtering the problem profiles harder, without removing data where the sensor is working well. Often the shape of the profile is more important than the absolute values, as it is a direct measure of attenuation, so these profiles that increase with depth are of reduced value.
The first filtering is to use a mask created from the first 700 events and remove values <−1. This removes fliers, accounting for the variability driven by weather and attenuation (which can vary considerably with phytoplankton concentration). Away from changing shading/cloud conditions the expectation is for an exponential decline of PAR with depth, and so significant deviations from this can flag up potentially problematic profiles. Estimations of attenuation from PAR profiles are calculated by fitting a regression line to the logarithm of PAR in overlapping 5 m depth intervals down the profile. Checking profiles with negative “attenuation” catches further profiles that are judged to be problematic due to the sensor (rather than natural effects) and these PAR profiles are removed after individual checking. Two profiles in 2015 (Events 1667, 1673) show very unlikely increases at depth. Given the similarities and closeness of the profiles these have also been deemed a sensor problem and blanked out.
Mixed layer depth (derived variable)
Quantification of mixed layer depth (MLD) is sensitive to the definition used, which is inevitably a processing choice, with no universally correct answer. Profile-by-profile checking has shown that the use of a 0.05 kg m−3 density difference criterion (referenced to either the surface density or density at 10 m) gives a good match to the reduction of chlorophyll with depth, for the period of the year where the mixed layer exceeds the photic zone. This is a good indication of the mixed layer depth that is calculated describing the depth that is, or has very recently been, connected to the surface through vertical mixing.
A time where this has been found to be too tight a criterion is during winter or early spring where spring melt can produce a very shallow layer of fresher, less dense water, above a homogenous zone that has clearly mixed recently. This is exacerbated by our inability to take profiles in the windy conditions that drive the mixing, due to boating safety reasons. To counter this a mixed layer depth relative to 10 m is also calculated, which has use in identifying (for example) deep mixing events that can happen between sampling events.
Stratification (derived variable)
There are frequent times through summer where there is strong stratification through the surface depths (to within 5 m, or even 10 cm of the surface) due to the large input of meltwater from sea ice, icebergs and the glaciers. In these circumstances, a mixed layer depth of 1 m or 2 m does little to describe the conditions for mixing of phytoplankton. Due to this, stratification is calculated from the surface to 10 m, 20 m, 30 m through to 100 m in 10 m increments. This is calculated as the additional potential energy that is required to homogenise the depth interval, which gives a physically based metric, with units of J m−2 40. This is considered more relevant than a profile of (for example) Brunt Väisälä frequency.
Discrete water samples
Chlorophyll a and phaeopigment
Calibration is carried out twice a year using chlorophyll a standards, with samples diluted as required during strong phytoplankton blooms to reduce the range of values measured. The ratio of fluorescence before and after acidification measured each sampling day and is used to assess the reliability of the phaeopigement data. All data are reported as chlorophyll a (calculated as total chlorophyll minus phaeopigment8). Due to a quality control issue, chlorophyll values after Event 1930 (15 NOV 2017) are currently blanked; it is hoped to incorporate these in a future RaTS data release once resolved.
Inorganic macronutrients
Ammonium measurements were carried out in triplicate using a Turner TD-700 fluorometer, and calibrated using standard addition comprising four concentrations, also in triplicate8. The detection limit is 0.01 μM. Any negative values were reset at 0.001 μM.
For the other inorganic macronutrients, detection limits are 0.3 μM for nitrate, 0.1 μM for nitrite, 0.2 μM for orthophosphate, and 1.2 μM for silicic acid from 1998 to 2017 (OSIL/NOCS). From 2017 onwards, detection limits for nitrate and orthophosphate were 0.02 μM, and 0.01 μM for nitrite, and 0.02–0.03 μM for silicic acid (PML). The typical uncertainty of the analytical results was between 2 and 3%. Clean sampling and handling techniques were employed during the sampling, processing, defrosting (most critical for the quantitative recovery of silicic acid), and manipulations within the laboratory, and where possible carried out according to the International GO-SHIP nutrient manual recommendations41. After 2017, seawater nutrient reference materials (KANSO Ltd. Japan) were analysed to assess analyser performance and for quality control purposes. Spikes were removed from the macronutrient dataset as follows: Nitrite – Events 502 and 504 (APR 2003); Nitrate – Event 328 (15 JUN 2001); Orthophosphate – Event 486 (21 FEB 2003); Silicic acid – Event 314 (18 APR 2001).
Seawater oxygen isotopes
Isotope measurements used internal standards calibrated against the international standards VSMOW and VSLAP (before 2012) and VSMOW2 and VSLAP2 (after 2012), with errors typically <0.05‰ for δ18O.
Acknowledgements
The authors would like to thank all Rothera Research Station personnel who have supported the RaTS program since 1997. Data collection has been supported since 1997 by the Natural Environment Research Council (NERC) through core funding supplied to the British Antarctic Survey. Since 2017, it has been supported by NERC award “National Capability – Polar Expertise Supporting UK Research” (NE/R016038/1). Henley was supported by NERC through grant NE/K010034/1.
Author contributions
All authors contributed to the analyses, collection and/or management of the data. H.V., A.C., M.M., M.B. have overseen data collection and RaTS program management. P.t.H. and H.P. manage the UK PDC and oversaw the archiving of the data. H.V., K.H. and M.M. led the metadata document and manuscript preparation. All authors reviewed and approved the manuscript prior to submission.
Code availability
No custom code was used to generate or process the data described in this manuscript.
Competing interests
The authors declare no competing interests.
Footnotes
Publisher’s note Springer Nature remains neutral with regard to jurisdictional claims in published maps and institutional affiliations.
References
- 1.Rintoul SR. The global influence of localized dynamics in the southern ocean. Nature. 2018;558:209–218. doi: 10.1038/s41586-018-0182-3. [DOI] [PubMed] [Google Scholar]
- 2.Meredith, M. et al. Polar Regions. Chapter 3, IPCC Special Report on the Ocean and Cryosphere in a Changing Climate (2019).
- 3.Henley SF, et al. Changing biogeochemistry of the southern ocean and its ecosystem implications. Frontiers in marine science. 2020;7:581. doi: 10.3389/fmars.2020.00581. [DOI] [Google Scholar]
- 4.Morley SA, et al. Global drivers on southern ocean ecosystems: changing physical environments and anthropogenic pressures in an earth system. Frontiers in Marine Science. 2020;7:547188. doi: 10.3389/fmars.2020.547188. [DOI] [Google Scholar]
- 5.Cook AJ, et al. Ocean forcing of glacier retreat in the western Antarctic Peninsula. Science. 2016;353:283–286. doi: 10.1126/science.aae0017. [DOI] [PubMed] [Google Scholar]
- 6.Roberts J, et al. Ocean forced variability of Totten Glacier mass loss. Geological Society, London, Special Publications. 2018;461:175–186. doi: 10.1144/SP461.6. [DOI] [Google Scholar]
- 7.Frederikse T, et al. Antarctic ice sheet and emission scenario controls on 21st-century extreme sea-level changes. Nature communications. 2020;11:1–11. doi: 10.1038/s41467-019-14049-6. [DOI] [PMC free article] [PubMed] [Google Scholar]
- 8.Clarke A, Meredith MP, Wallace MI, Brandon MA, Thomas DN. Seasonal and interannual variability in temperature, chlorophyll and macronutrients in northern Marguerite Bay, Antarctica. Deep Sea Research Part II: Topical Studies in Oceanography. 2008;55:1988–2006. doi: 10.1016/j.dsr2.2008.04.035. [DOI] [Google Scholar]
- 9.Turner J, et al. Antarctic temperature variability and change from station data. International Journal of Climatology. 2020;40:2986–3007. doi: 10.1002/joc.6378. [DOI] [Google Scholar]
- 10.Meredith, M. P. & King, J. C. Rapid climate change in the ocean west of the Antarctic Peninsula during the second half of the 20th century. Geophysical Research Letters32 (2005).
- 11.Venables HJ, Meredith MP, Brearley JA. Modification of deep waters in Marguerite Bay, western Antarctic Peninsula, caused by topographic overflows. Deep Sea Research Part II: Topical Studies in Oceanography. 2017;139:9–17. doi: 10.1016/j.dsr2.2016.09.005. [DOI] [Google Scholar]
- 12.Brearley JA, Meredith MP, Garabato ACN, Venables HJ, Inall ME. Controls on turbulent mixing on the West Antarctic Peninsula shelf. Deep Sea Research Part II: Topical Studies in Oceanography. 2017;139:18–30. doi: 10.1016/j.dsr2.2017.02.011. [DOI] [Google Scholar]
- 13.Venables HJ, Meredith MP. Feedbacks between ice cover, ocean stratification, and heat content in Ryder Bay, western Antarctic Peninsula. Journal of Geophysical Research: Oceans. 2014;119:5323–5336. doi: 10.1002/2013JC009669. [DOI] [Google Scholar]
- 14.Venables HJ, Clarke A, Meredith MP. Wintertime controls on summer stratification and productivity at the western Antarctic Peninsula. Limnology and Oceanography. 2013;58:1035–1047. doi: 10.4319/lo.2013.58.3.1035. [DOI] [Google Scholar]
- 15.Annett AL, et al. Comparative roles of upwelling and glacial iron sources in Ryder Bay, coastal western Antarctic Peninsula. Marine Chemistry. 2015;176:21–33. doi: 10.1016/j.marchem.2015.06.017. [DOI] [Google Scholar]
- 16.Henley SF, et al. Macronutrient supply, uptake and recycling in the coastal ocean of the west Antarctic Peninsula. Deep Sea Research Part II: Topical Studies in Oceanography. 2017;139:58–76. doi: 10.1016/j.dsr2.2016.10.003. [DOI] [Google Scholar]
- 17.Rozema P, et al. Interannual variability in phytoplankton biomass and species composition in northern Marguerite Bay (West Antarctic Peninsula) is governed by both winter sea ice cover and summer stratification. Limnology and Oceanography. 2017;62:235–252. doi: 10.1002/lno.10391. [DOI] [Google Scholar]
- 18.Ducklow HW, et al. West Antarctic Peninsula: an ice-dependent coastal marine ecosystem in transition. Oceanography. 2013;26:190–203. doi: 10.5670/oceanog.2013.62. [DOI] [Google Scholar]
- 19.Saba GK, et al. Winter and spring controls on the summer food web of the coastal West Antarctic Peninsula. Nature communications. 2014;5:1–8. doi: 10.1038/ncomms5318. [DOI] [PubMed] [Google Scholar]
- 20.Wallace MI, et al. On the characteristics of internal tides and coastal upwelling behaviour in Marguerite Bay, west Antarctic Peninsula. Deep Sea Research Part II: Topical Studies in Oceanography. 2008;55:2023–2040. doi: 10.1016/j.dsr2.2008.04.033. [DOI] [Google Scholar]
- 21.Legge OJ, et al. The seasonal cycle of carbonate system processes in Ryder Bay, West Antarctic Peninsula. Deep Sea Research Part II: Topical Studies in Oceanography. 2017;139:167–180. doi: 10.1016/j.dsr2.2016.11.006. [DOI] [Google Scholar]
- 22.Hendry KR, Rickaby RE, de Hoog JC, Weston K, Rehkämper M. Cadmium and phosphate in coastal Antarctic seawater: implications for southern ocean nutrient cycling. Marine Chemistry. 2008;112:149–157. doi: 10.1016/j.marchem.2008.09.004. [DOI] [Google Scholar]
- 23.Bown J, et al. Bioactive trace metal time series during Austral summer in Ryder Bay, Western Antarctic Peninsula. Deep Sea Research Part II: Topical Studies in Oceanography. 2017;139:103–119. doi: 10.1016/j.dsr2.2016.07.004. [DOI] [Google Scholar]
- 24.Chance R, et al. Seasonal and interannual variation of dissolved iodine speciation at a coastal Antarctic site. Marine Chemistry. 2010;118:171–181. doi: 10.1016/j.marchem.2009.11.009. [DOI] [Google Scholar]
- 25.Hughes C, et al. Microbial control of bromocarbon concentrations in coastal waters of the western Antarctic Peninsula. Marine Chemistry. 2013;151:35–46. doi: 10.1016/j.marchem.2013.01.007. [DOI] [Google Scholar]
- 26.Stefels J, et al. Impact of sea-ice melt on dimethyl sulfide (sulfoniopropionate) inventories in surface waters of Marguerite Bay, West Antarctic Peninsula. Philosophical Transactions of the Royal Society A: Mathematical, Physical and Engineering Sciences. 2018;376:20170169. doi: 10.1098/rsta.2017.0169. [DOI] [PMC free article] [PubMed] [Google Scholar]
- 27.Hendry KR, Rickaby RE, Meredith MP, Elderfield H. Controls on stable isotope and trace metal uptake in Neogloboquadrina pachyderma (sinistral) from an Antarctic sea-ice environment. Earth and Planetary Science Letters. 2009;278:67–77. doi: 10.1016/j.epsl.2008.11.026. [DOI] [Google Scholar]
- 28.Henley S, et al. Factors influencing the stable carbon isotopic composition of suspended and sinking organic matter in the coastal Antarctic sea ice environment. Biogeosciences. 2012;9:1137–1157. doi: 10.5194/bg-9-1137-2012. [DOI] [Google Scholar]
- 29.Weston K, et al. Primary production export flux in Marguerite Bay (Antarctic Peninsula): Linking upper water-column production to sediment trap flux. Deep Sea Research Part I: Oceanographic Research Papers. 2013;75:52–66. doi: 10.1016/j.dsr.2013.02.001. [DOI] [Google Scholar]
- 30.Annett AL, Carson DS, Crosta X, Clarke A, Ganeshram RS. Seasonal progression of diatom assemblages in surface waters of Ryder Bay, Antarctica. Polar biology. 2010;33:13–29. doi: 10.1007/s00300-009-0681-7. [DOI] [Google Scholar]
- 31.Wood LW. Chloroform–methanol extraction of chlorophyll a. canadian journal of fisheries and aquatic sciences. 1985;42:38–43. doi: 10.1139/f85-005. [DOI] [Google Scholar]
- 32.Catalano G. An improved method for the determination of ammonia in seawater. Marine Chemistry. 1987;20:289–295. doi: 10.1016/0304-4203(87)90079-X. [DOI] [Google Scholar]
- 33.Clarke A, Leakey RJ. The seasonal cycle of phytoplankton, macronutrients, and the microbial community in a nearshore Antarctic marine ecosystem. Limnology and Oceanography. 1996;41:1281–1294. doi: 10.4319/lo.1996.41.6.1281. [DOI] [Google Scholar]
- 34.Holmes RM, Aminot A, Kérouel R, Hooker BA, Peterson BJ. A simple and precise method for measuring ammonium in marine and freshwater ecosystems. Canadian Journal of Fisheries and Aquatic Sciences. 1999;56:1801–1808. doi: 10.1139/f99-128. [DOI] [Google Scholar]
- 35.Strickland, J. D. H. & Parsons, T. R. A practical handbook of seawater analysis. Bull. Fish. Res. Bd. Can. 167. (1968).
- 36.Woodward E, Rees A. Nutrient distributions in an anticyclonic eddy in the northeast Atlantic Ocean, with reference to nanomolar ammonium concentrations. Deep Sea Research Part II: Topical Studies in Oceanography. 2001;48:775–793. doi: 10.1016/S0967-0645(00)00097-7. [DOI] [Google Scholar]
- 37.Meredith MP, et al. Variability in the freshwater balance of northern Marguerite Bay, Antarctic Peninsula: results from δ18o. Deep Sea Research Part II: Topical Studies in Oceanography. 2008;55:309–322. doi: 10.1016/j.dsr2.2007.11.005. [DOI] [Google Scholar]
- 38.Epstein S, Mayeda T. Variation of O18 content of waters from natural sources. Geochimica et cosmochimica acta. 1953;4:213–224. doi: 10.1016/0016-7037(53)90051-9. [DOI] [Google Scholar]
- 39.Clarke A, 2022. Quasi-weekly, year-round oceanographic and ice measurements at the coastal Western Antarctic Peninsula from 1997 to 2018 (version 1.0). Tech. Rep. Version 1.0, NERC EDS UK Polar Data Centre. NERC EDS UK Polar Data Centre. [DOI]
- 40.Simpson J, Allen C, Morris N. Fronts on the continental shelf. Journal of Geophysical Research: Oceans. 1978;83:4607–4614. doi: 10.1029/JC083iC09p04607. [DOI] [Google Scholar]
- 41.Becker S, et al. GO-SHIP repeat hydrography nutrient manual: the precise and accurate determination of dissolved inorganic nutrients in seawater, using continuous flow analysis methods. Frontiers in Marine Science. 2020;7:581790. doi: 10.3389/fmars.2020.581790. [DOI] [Google Scholar]
Associated Data
This section collects any data citations, data availability statements, or supplementary materials included in this article.
Data Citations
- Clarke A, 2022. Quasi-weekly, year-round oceanographic and ice measurements at the coastal Western Antarctic Peninsula from 1997 to 2018 (version 1.0). Tech. Rep. Version 1.0, NERC EDS UK Polar Data Centre. NERC EDS UK Polar Data Centre. [DOI]
Data Availability Statement
No custom code was used to generate or process the data described in this manuscript.


