Abstract
The COVID-19 pandemic has affected all domains of human life, including the economic and social fabric of societies. One of the central strategies for managing public health throughout the pandemic has been through persuasive messaging and collective behaviour change. To help scholars better understand the social and moral psychology behind public health behaviour, we present a dataset comprising of 51,404 individuals from 69 countries. This dataset was collected for the International Collaboration on Social & Moral Psychology of COVID-19 project (ICSMP COVID-19). This social science survey invited participants around the world to complete a series of moral and psychological measures and public health attitudes about COVID-19 during an early phase of the COVID-19 pandemic (between April and June 2020). The survey included seven broad categories of questions: COVID-19 beliefs and compliance behaviours; identity and social attitudes; ideology; health and well-being; moral beliefs and motivation; personality traits; and demographic variables. We report both raw and cleaned data, along with all survey materials, data visualisations, and psychometric evaluations of key variables.
Subject terms: Human behaviour, Politics, Decision making
Background & Summary
Well over two years after the official outbreak1, it is evident that the COVID-19 pandemic has affected all domains of human life, including the economic and social fabric of societies2 as well as people’s physical and mental health3. At the time of writing, the world reached 850 million confirmed infections and up to 18 million deaths4. The detrimental effects of the pandemic extend beyond physical health with evidence of increased stress levels5 and suicide rates6, along with deterioration of general well-being7. Such findings reflect the cautionary warnings by Taylor8 that the psychological and societal effects are “likely to be more pronounced, more widespread, and longer-lasting than the purely somatic effects of the infection”8, p.23.
In the early stages of the pandemic, when vaccines were not yet available, governments introduced non-pharmaceutical interventions to reduce the spread of the SARS-CoV-2 virus9. Various contact-restricting policies (e.g., stay-at-home recommendations, curfews, police hours, partial or complete lock-downs) were enacted, and citizens were advised to adhere to public health recommendations (e.g., hand washing, face masks, and spatial distancing). It quickly became clear that behavioural science had a major role to play10.
On April 11th, a team of researchers launched a call for international collaboration in social and moral psychology. The initiative quickly gained momentum, gathering a consortium of over 250 academics worldwide. The aim of this project was to collect data from as many countries as possible to serve as a public good for the scientific community by allowing future research to draw on this broad database collected during this early phase of the COVID-19 pandemic. The survey, developed by the initial team, was circulated among the national teams, who provided feedback, translated it into 32 languages, and disseminated it online. The project concluded with responses from a total of 51,404 participants from 69 countries, 77 samples, between April 22nd and June 3rd, 2020.
A key goal of the project was to test the hypothesis that national identity predicts support for public health measures during the COVID-19 pandemic, which has since been confirmed11,12. In addition to collecting variables to test this hypothesis, we collected data on a variety of other social and moral constructs to make of our multi-country large-scale survey a rich resource for future research. The survey focused on the following areas: on a) COVID-19 beliefs and compliance behaviours (COVID-19 public health support, COVID-19 risk perception, COVID-19 conspiracy beliefs, and COVID-19 testing behaviour); b) identity and social attitudes (national identification, national narcissism, and social belonging); c) ideology (political ideology); d) health and well-being (subjective physical health, a wealth ladder ranking, and psychological well-being); e) moral beliefs and motivation (generosity, morality as cooperation, moral identity, and moral circle); f) personality traits and dispositions (open-mindedness, self-esteem, trait optimism, trait self-control, narcissism, and cognitive reflection); and g) demographic variables (i.e., sex, age, marital status, number of children, and employment status).
Using this dataset, project team members have pre-registered a variety of secondary hypotheses (see icsmp-covid19.netlify.app/preregistration), several of which have already been published11–23. In this paper, we present the complete ICSMP datasets to facilitate its findability, accessibility, interoperability, and reuse (FAIR;24,25) and maximize its educational impact26–28.
Methods
When possible, we used articles published in Nature Scientific Data presenting social sciences data as blueprints5,29. Given the urgent call for COVID-19 research, this study received an umbrella ethical approval from the University of Kent (see osf.io/ce638) but also complied with local ethics, norms, and regulations in the countries where the data were collected.
Participants
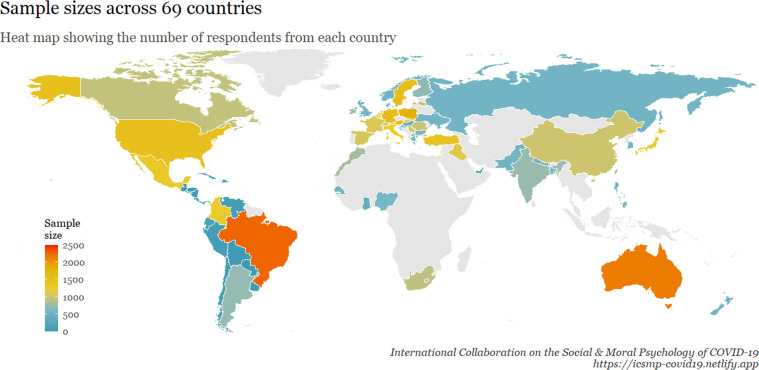
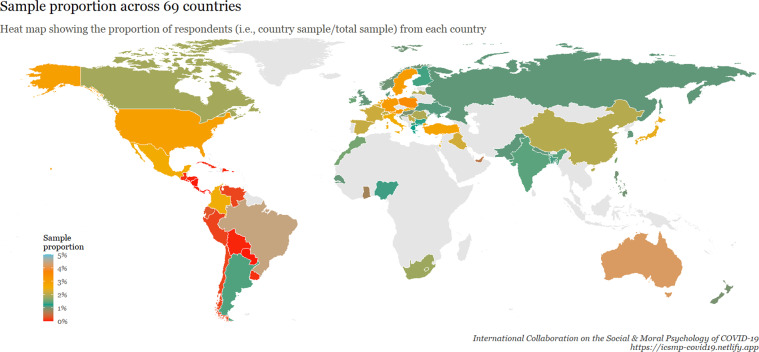
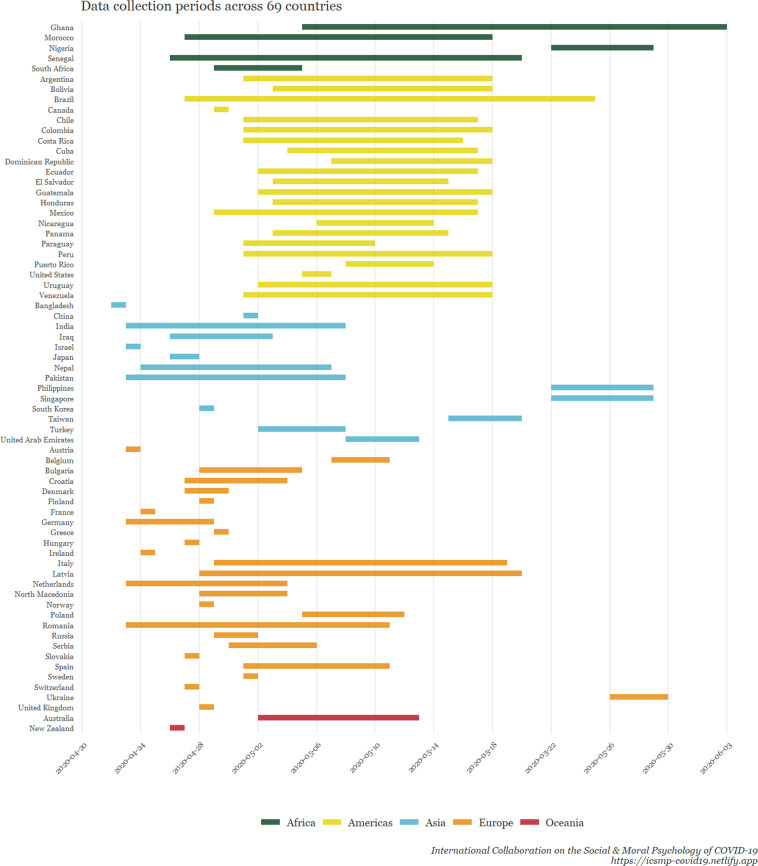
A total of 51,404 individuals from 77 samples across 69 countries participated in our survey. The inclusion criteria were the following: being 18 years of age and older, and giving informed consent (although researchers were encouraged to, ideally, recruit representative samples regarding age and gender). Data were collected between April 22nd and June 3rd, 2020. Figure 1 displays where the data were collected, coloured according to national sample size. Figure 2 displays the proportion of respondents in relation to the full sample. Figure 3 shows when the data were collected in each country.
Fig. 1.
A world map visualizing the number of participants in each surveyed country. Note: This heat map shows the number of respondents from each country. The gray areas are the countries that are not covered by the data, and the colour scale shows the size of the sample in accordance with the scale on the lower left side.
Fig. 2.
International Collaboration on the Social and Moral Psychology of COVID-19: Investigated constructs, items and variables.
Fig. 3.
Gantt Chart illustrating the data collection periods for each surveyed country.
Demographic variables across countries are summarised in several tables: Tables 1, 2 show the number of participants, the mean proportion of non-missing ‘valid’ answers, and age. Tables 3, 4 illustrate the distribution of gender; Tables 5, 6 show employment status; and Tables 7–9 show marital status and number of children. When multiple samples were collected within the same country, data were split into numbered subgroups (e.g., for Brazil, which has three samples, they were flagged as Brazil_1, Brazil_2 and Brazil_3). Note that in the tables above, we kept country subsamples separated to highlight they were collected by different teams, often using different sampling methodologies or languages, which impact their characteristics (e.g., representativeness).
Table 8.
Distribution of marital status and number of children in 69 countries (I-R).
| Country | Marital Status | Number of Children | |||||||||
|---|---|---|---|---|---|---|---|---|---|---|---|
| Single | Relation | Married | Unreported (MS) | 0 | 1 | 2 | 3 | 4 | ≥4 | Unreported (Child.) | |
| India_1 | 0.55 | 0.14 | 0.13 | 0.18 | 0.69 | 0.03 | 0.07 | 0.00 | 0.00 | 0.00 | 0.20 |
| India_2 | 0.29 | 0.07 | 0.55 | 0.10 | 0.20 | 0.29 | 0.18 | 0.01 | 0.00 | 0.00 | 0.31 |
| Iraq | 0.26 | 0.04 | 0.20 | 0.50 | 0.30 | 0.03 | 0.05 | 0.04 | 0.03 | 0.03 | 0.52 |
| Ireland | 0.32 | 0.28 | 0.34 | 0.05 | 0.52 | 0.10 | 0.17 | 0.09 | 0.05 | 0.02 | 0.06 |
| Israel | 0.24 | 0.11 | 0.55 | 0.09 | 0.38 | 0.12 | 0.20 | 0.18 | 0.06 | 0.05 | 0.00 |
| Italy_1 | 0.26 | 0.25 | 0.49 | 0.00 | 0.44 | 0.25 | 0.25 | 0.05 | 0.01 | 0.00 | 0.00 |
| Italy_2 | 0.23 | 0.30 | 0.46 | 0.00 | 0.49 | 0.20 | 0.25 | 0.06 | 0.00 | 0.00 | 0.00 |
| Japan | 0.35 | 0.05 | 0.54 | 0.06 | 0.46 | 0.14 | 0.23 | 0.08 | 0.02 | 0.00 | 0.07 |
| Korea | 0.35 | 0.07 | 0.49 | 0.10 | 0.44 | 0.16 | 0.25 | 0.03 | 0.01 | 0.00 | 0.10 |
| Latvia | 0.34 | 0.25 | 0.42 | 0.00 | 0.00 | 0.32 | 0.19 | 0.31 | 0.12 | 0.05 | 0.00 |
| Macedonia | 0.30 | 0.19 | 0.48 | 0.03 | 0.50 | 0.17 | 0.26 | 0.04 | 0.00 | 0.00 | 0.04 |
| Mexico_1 | 0.26 | 0.18 | 0.49 | 0.07 | 0.34 | 0.13 | 0.25 | 0.14 | 0.04 | 0.03 | 0.07 |
| Mexico_2 | 0.31 | 0.19 | 0.50 | 0.00 | 0.29 | 0.18 | 0.32 | 0.15 | 0.04 | 0.02 | 0.00 |
| Morocco | 0.57 | 0.09 | 0.33 | 0.01 | 0.70 | 0.09 | 0.10 | 0.06 | 0.01 | 0.01 | 0.02 |
| Nepal | 0.36 | 0.05 | 0.21 | 0.37 | 0.46 | 0.08 | 0.06 | 0.01 | 0.00 | 0.00 | 0.39 |
| Netherlands | 0.29 | 0.27 | 0.43 | 0.00 | 0.41 | 0.12 | 0.29 | 0.13 | 0.03 | 0.02 | 0.00 |
| New Zealand | 0.39 | 0.20 | 0.41 | 0.00 | 0.41 | 0.16 | 0.21 | 0.13 | 0.06 | 0.04 | 0.00 |
| Nicaragua | 0.19 | 0.25 | 0.56 | 0.00 | 0.25 | 0.12 | 0.25 | 0.19 | 0.12 | 0.06 | 0.00 |
| Nigeria | 0.42 | 0.11 | 0.34 | 0.13 | 0.51 | 0.10 | 0.12 | 0.08 | 0.03 | 0.02 | 0.13 |
| Norway | 0.32 | 0.26 | 0.42 | 0.00 | 0.41 | 0.15 | 0.24 | 0.16 | 0.03 | 0.01 | 0.00 |
| Pakistan | 0.51 | 0.10 | 0.24 | 0.14 | 0.66 | 0.07 | 0.07 | 0.02 | 0.01 | 0.01 | 0.15 |
| Panama | 0.33 | 0.17 | 0.50 | 0.00 | 0.44 | 0.11 | 0.28 | 0.11 | 0.00 | 0.06 | 0.00 |
| Paraguay | 0.56 | 0.31 | 0.12 | 0.00 | 0.44 | 0.06 | 0.31 | 0.06 | 0.12 | 0.00 | 0.00 |
| Peru | 0.40 | 0.14 | 0.46 | 0.00 | 0.35 | 0.20 | 0.29 | 0.13 | 0.01 | 0.02 | 0.00 |
| Philippines | 0.44 | 0.15 | 0.38 | 0.03 | 0.46 | 0.21 | 0.17 | 0.09 | 0.02 | 0.02 | 0.03 |
| Poland | 0.29 | 0.21 | 0.50 | 0.00 | 0.33 | 0.22 | 0.31 | 0.10 | 0.03 | 0.01 | 0.00 |
| Puerto Rico | 0.00 | 0.50 | 0.50 | 0.00 | 0.00 | 0.00 | 0.00 | 0.50 | 0.50 | 0.00 | 0.00 |
| Romania_1 | 0.32 | 0.13 | 0.55 | 0.00 | 0.65 | 0.22 | 0.11 | 0.01 | 0.00 | 0.00 | 0.00 |
| Romania_2 | 0.27 | 0.19 | 0.54 | 0.00 | 0.40 | 0.32 | 0.22 | 0.04 | 0.01 | 0.01 | 0.00 |
| Russian Federation | 0.41 | 0.15 | 0.44 | 0.00 | 0.39 | 0.28 | 0.26 | 0.05 | 0.01 | 0.01 | 0.00 |
Note: Country = country names in accordance with ISO3 codes, Columns 2-5 shows the proportion of different marital status, NA(MS) = unreported marital status, Columns 6-12 shows proportion of respondents by the number of children they have and NA(Child.) = proportion of unreported number of children.
Table 1.
Sample size, average proportion of valid answers, age of respondents and the number of data collections in 69 countries (A-M).
| Sample | Country | N | % Valid Answers | Age | Multiple datasets | ||
|---|---|---|---|---|---|---|---|
| <50% | <90% | μAge | sdAge | per country | |||
| AR | Argentina | 721 | 1.00 | 1.00 | 47.38 | 15.29 | 1 |
| AU | Australia | 2161 | 1.00 | 1.00 | 46.92 | 17.59 | 1 |
| AT | Austria | 1605 | 0.90 | 0.87 | 49.77 | 14.13 | 1 |
| BD | Bangladesh | 596 | 0.82 | 0.67 | 31.90 | 10.89 | 1 |
| BE | Belgium | 1159 | 1.00 | 1.00 | 46.29 | 18.67 | 1 |
| BO | Bolivia | 29 | 1.00 | 1.00 | 43.41 | 12.98 | 1 |
| BR_1 | Brazil_1 | 961 | 0.99 | 0.99 | 39.31 | 14.57 | 3 |
| BR_2 | Brazil_2 | 1301 | 0.75 | 0.67 | 34.89 | 13.12 | 3 |
| BR_3 | Brazil_3 | 6 | 1.00 | 1.00 | 40.33 | 13.14 | 3 |
| BG | Bulgaria | 666 | 1.00 | 0.96 | 30.69 | 11.13 | 1 |
| CA_e | Canada_english | 792 | 1.00 | 1.00 | 42.70 | 17.39 | 2 |
| CA_f | Canada_french | 171 | 1.00 | 1.00 | 46.83 | 16.97 | 2 |
| CL | Chile | 97 | 1.00 | 1.00 | 49.21 | 15.47 | 1 |
| CN | China | 1030 | 1.00 | 1.00 | 43.24 | 14.02 | 1 |
| CO_1 | Colombia_1 | 731 | 0.99 | 0.91 | 37.26 | 14.68 | 2 |
| CO_2 | Colombia_2 | 546 | 1.00 | 1.00 | 44.91 | 15.16 | 2 |
| CR | Costa Rica | 25 | 1.00 | 1.00 | 44.64 | 12.73 | 1 |
| HR | Croatia | 515 | 1.00 | 1.00 | 45.91 | 14.56 | 1 |
| CU | Cuba | 43 | 1.00 | 1.00 | 48.65 | 12.73 | 1 |
| DK | Denmark | 566 | 1.00 | 1.00 | 48.69 | 17.54 | 1 |
| DO | Dominican Republic | 36 | 1.00 | 1.00 | 40.39 | 12.46 | 1 |
| EC | Ecuador | 148 | 1.00 | 1.00 | 40.63 | 11.98 | 1 |
| SV | El Salvador | 28 | 1.00 | 1.00 | 46.43 | 11.51 | 1 |
| FI | Finland | 698 | 0.99 | 0.98 | 38.64 | 13.77 | 1 |
| FR | France | 1119 | 1.00 | 0.99 | 43.18 | 16.20 | 1 |
| DE | Germany | 1587 | 1.00 | 1.00 | 49.58 | 16.14 | 1 |
| GH | Ghana | 390 | 0.68 | 0.49 | 31.46 | 7.54 | 1 |
| GR | Greece | 640 | 1.00 | 1.00 | 29.77 | 11.43 | 1 |
| GT | Guatemala | 48 | 1.00 | 1.00 | 44.67 | 13.31 | 1 |
| HN | Honduras | 24 | 1.00 | 1.00 | 39.25 | 14.30 | 1 |
| HU | Hungary | 506 | 1.00 | 1.00 | 48.53 | 16.54 | 1 |
| IN_1 | India_1 | 312 | 0.87 | 0.81 | 26.94 | 8.49 | 2 |
| IN_2 | India_2 | 429 | 0.94 | 0.84 | 36.81 | 12.05 | 2 |
| IQ | Iraq | 1142 | 0.57 | 0.48 | 31.03 | 14.13 | 1 |
| IE | Ireland | 785 | 0.96 | 0.95 | 38.23 | 14.63 | 1 |
| IL | Israel | 1253 | 1.00 | 1.00 | 41.13 | 15.25 | 1 |
| IT_1 | Italy_1 | 998 | 0.99 | 0.99 | 46.41 | 16.26 | 2 |
| IT_2 | Italy_2 | 284 | 1.00 | 1.00 | 47.35 | 18.07 | 2 |
| JP | Japan | 1239 | 0.96 | 0.93 | 47.10 | 15.21 | 1 |
| KR | Korea | 555 | 0.92 | 0.89 | 41.83 | 13.90 | 1 |
| LV | Latvia | 1008 | 1.00 | 1.00 | 45.60 | 14.11 | 1 |
| MK | Macedonia | 726 | 0.97 | 0.96 | 38.13 | 11.63 | 1 |
| MX_1 | Mexico_1 | 804 | 0.94 | 0.93 | 47.81 | 13.89 | 2 |
| MX_2 | Mexico_2 | 507 | 1.00 | 1.00 | 47.77 | 13.54 | 2 |
| MA | Morocco | 812 | 0.81 | 0.71 | 31.95 | 12.27 | 1 |
Note: Country = country names in accordance with ISO3 codes, N = number of respondents in each country. <50% and <90% = average proportion of valid (non NA) answers that are below 0.5 and 0.9 respectively in the subject level. μAge = mean age and sdAge = standard deviation of the age, Multiple datasets = whether there were multiple data collections in the country. Tables 1, 2 show the number of participants, the mean proportion of non-missing ‘valid’ answers, and age. When multiple samples were collected within the same country, data were split into numbered subgroups (e.g., for Brazil, which has three samples, they were flagged as Brazil_1, Brazil_2 and Brazil_3). Multiple subsamples can be observed for Brazil, Canada, Colombia, India, Italy, Mexico and Romania. Note that in all the tables, we kept country subsamples separated to highlight they were collected by different teams, often using different sampling methodologies or languages, which impact their characteristics (e.g., representativeness).
Table 2.
Sample size, average proportion of valid answers, age of respondents and the number of data collections in 69 countries (N-V).
| Sample | Country | N | % Valid Answers | Age | Multiple datasets | ||
|---|---|---|---|---|---|---|---|
| <50% | <90% | μAge | sdAge | per country | |||
| NP | Nepal | 563 | 0.78 | 0.61 | 28.06 | 7.58 | 1 |
| NL | Netherlands | 1297 | 1.00 | 0.99 | 49.63 | 16.83 | 1 |
| NZ | New Zealand | 510 | 1.00 | 1.00 | 45.76 | 17.62 | 1 |
| NI | Nicaragua | 16 | 1.00 | 1.00 | 42.75 | 14.84 | 1 |
| NG | Nigeria | 608 | 0.93 | 0.87 | 32.08 | 10.81 | 1 |
| NO | Norway | 532 | 1.00 | 1.00 | 47.04 | 17.39 | 1 |
| PK | Pakistan | 565 | 0.90 | 0.85 | 26.94 | 8.38 | 1 |
| PA | Panama | 18 | 1.00 | 1.00 | 44.11 | 17.32 | 1 |
| PY | Paraguay | 16 | 1.00 | 1.00 | 38.94 | 9.33 | 1 |
| PE | Peru | 91 | 1.00 | 1.00 | 46.21 | 14.44 | 1 |
| PH | Philippines | 524 | 0.98 | 0.96 | 36.74 | 12.27 | 1 |
| PL | Poland | 1817 | 1.00 | 1.00 | 46.44 | 17.09 | 1 |
| PR | Puerto Rico | 2 | 1.00 | 1.00 | 64.00 | 16.97 | 1 |
| RO_1 | Romania_1 | 500 | 1.00 | 1.00 | 42.26 | 13.45 | 2 |
| RO_2 | Romania_2 | 505 | 1.00 | 0.99 | 42.53 | 14.50 | 2 |
| RU | Russian Federation | 558 | 1.00 | 1.00 | 45.02 | 15.46 | 1 |
| SN | Senegal | 552 | 0.62 | 0.51 | 34.36 | 12.43 | 1 |
| RS | Serbia | 1070 | 0.88 | 0.71 | 42.92 | 11.93 | 1 |
| SG | Singapore | 564 | 0.96 | 0.92 | 43.06 | 13.73 | 1 |
| SK | Slovakia | 1265 | 1.00 | 1.00 | 44.19 | 15.88 | 1 |
| ZA | South Africa | 939 | 0.82 | 0.56 | 39.90 | 13.44 | 1 |
| ES | Spain | 1090 | 1.00 | 0.99 | 46.01 | 13.68 | 1 |
| SE | Sweden | 1568 | 1.00 | 1.00 | 52.90 | 15.42 | 1 |
| CH | Switzerland | 1056 | 1.00 | 1.00 | 47.94 | 16.66 | 1 |
| TW | Taiwan | 833 | 1.00 | 1.00 | 43.99 | 13.25 | 1 |
| TR | Turkey | 1455 | 1.00 | 0.99 | 37.23 | 15.24 | 1 |
| UA | Ukraine | 577 | 1.00 | 1.00 | 37.45 | 8.03 | 1 |
| AE | United Arab Emirates | 313 | 0.71 | 0.59 | 31.77 | 8.59 | 1 |
| GB | United Kingdom | 550 | 1.00 | 1.00 | 45.66 | 15.62 | 1 |
| US | United States of America | 1506 | 1.00 | 0.99 | 44.23 | 16.60 | 1 |
| UY | Uruguay | 49 | 1.00 | 1.00 | 52.88 | 13.70 | 1 |
| VE | Venezuela | 96 | 1.00 | 1.00 | 46.53 | 12.97 | 1 |
Note: Country = country names in accordance with ISO3 codes, N = number of respondents in each country. <50% and <90% = average proportion of valid (non NA) answers that are below 0.5 and 0.9 respectively in the subject level. μAge = mean age and sdAge = standard deviation of the age, Multiple datasets = whether there were multiple data collections in the country. Tables 1, 2 show the number of participants, the mean proportion of non-missing ‘valid’ answers, and age. When multiple samples were collected within the same country, data were split into numbered subgroups (e.g., for Brazil, which has three samples, they were flagged as Brazil_1, Brazil_2 and Brazil_3). Multiple subsamples can be observed for Brazil, Canada, Colombia, India, Italy, Mexico and Romania. Note that in all the tables, we kept country subsamples separated to highlight they were collected by different teams, often using different sampling methodologies or languages, which impact their characteristics (e.g., representativeness).
Table 3.
Distribution of sex in 69 countries (A-M).
| Country | % Female | % Male | % Other | % Unreported |
|---|---|---|---|---|
| Argentina | 0.69 | 0.31 | 0.00 | 0.00 |
| Australia | 0.51 | 0.48 | 0.01 | 0.00 |
| Austria | 0.46 | 0.41 | 0.00 | 0.13 |
| Bangladesh | 0.37 | 0.31 | 0.01 | 0.31 |
| Belgium | 0.41 | 0.59 | 0.00 | 0.00 |
| Bolivia | 0.59 | 0.41 | 0.00 | 0.00 |
| Brazil_1 | 0.49 | 0.50 | 0.01 | 0.01 |
| Brazil_2 | 0.47 | 0.19 | 0.00 | 0.33 |
| Brazil_3 | 0.83 | 0.17 | 0.00 | 0.00 |
| Bulgaria | 0.65 | 0.34 | 0.00 | 0.01 |
| Canada_English | 0.62 | 0.38 | 0.01 | 0.00 |
| Canada_French | 0.54 | 0.46 | 0.00 | 0.00 |
| Chile | 0.65 | 0.35 | 0.00 | 0.00 |
| China | 0.49 | 0.51 | 0.00 | 0.00 |
| Colombia_1 | 0.62 | 0.37 | 0.00 | 0.01 |
| Colombia_2 | 0.63 | 0.37 | 0.00 | 0.00 |
| Costa Rica | 0.36 | 0.64 | 0.00 | 0.00 |
| Croatia | 0.52 | 0.48 | 0.00 | 0.01 |
| Cuba | 0.51 | 0.49 | 0.00 | 0.00 |
| Denmark | 0.49 | 0.51 | 0.00 | 0.00 |
| Dominican Republic | 0.81 | 0.19 | 0.00 | 0.00 |
| Ecuador | 0.55 | 0.45 | 0.00 | 0.00 |
| El Salvador | 0.54 | 0.46 | 0.00 | 0.00 |
| Finland | 0.45 | 0.48 | 0.05 | 0.02 |
| France | 0.55 | 0.45 | 0.00 | 0.00 |
| Germany | 0.50 | 0.50 | 0.00 | 0.00 |
| Ghana | 0.26 | 0.53 | 0.00 | 0.22 |
| Greece | 0.35 | 0.65 | 0.00 | 0.00 |
| Guatemala | 0.44 | 0.56 | 0.00 | 0.00 |
| Honduras | 0.71 | 0.29 | 0.00 | 0.00 |
| Hungary | 0.52 | 0.48 | 0.00 | 0.00 |
| India_1 | 0.42 | 0.38 | 0.02 | 0.18 |
| India_2 | 0.31 | 0.59 | 0.01 | 0.10 |
| Iraq | 0.23 | 0.26 | 0.01 | 0.50 |
| Ireland | 0.63 | 0.31 | 0.00 | 0.05 |
| Israel | 0.51 | 0.49 | 0.00 | 0.00 |
| Italy_1 | 0.50 | 0.49 | 0.00 | 0.00 |
| Italy_2 | 0.66 | 0.33 | 0.00 | 0.01 |
| Japan | 0.48 | 0.46 | 0.00 | 0.06 |
| Korea | 0.42 | 0.48 | 0.00 | 0.10 |
| Latvia | 0.63 | 0.37 | 0.00 | 0.00 |
| Macedonia | 0.54 | 0.43 | 0.01 | 0.03 |
| Mexico_1 | 0.39 | 0.53 | 0.00 | 0.07 |
| Mexico_2 | 0.61 | 0.38 | 0.00 | 0.00 |
| Morocco | 0.52 | 0.47 | 0.01 | 0.00 |
Note: Country = country names in accordance with ISO3 codes, % Female = Proportion of female respondents in the country, % Male = proportion of male respondents, % Other = proportion of non-binary respondents and % NA = proportion of the unreported sex.
Table 4.
Distribution of sex in 69 countries (N-V).
| Country | % Female | % Male | % Other | % Unreported |
|---|---|---|---|---|
| Nepal | 0.33 | 0.29 | 0.01 | 0.37 |
| Netherlands | 0.46 | 0.54 | 0.00 | 0.00 |
| New Zealand | 0.50 | 0.50 | 0.00 | 0.00 |
| Nicaragua | 0.62 | 0.38 | 0.00 | 0.00 |
| Nigeria | 0.49 | 0.51 | 0.00 | 0.00 |
| Norway | 0.53 | 0.46 | 0.00 | 0.00 |
| Pakistan | 0.46 | 0.40 | 0.00 | 0.14 |
| Panama | 0.67 | 0.33 | 0.00 | 0.00 |
| Paraguay | 0.88 | 0.12 | 0.00 | 0.00 |
| Peru | 0.45 | 0.55 | 0.00 | 0.00 |
| Philippines | 0.50 | 0.50 | 0.00 | 0.00 |
| Poland | 0.49 | 0.50 | 0.00 | 0.00 |
| Puerto Rico | 0.50 | 0.50 | 0.00 | 0.00 |
| Romania_1 | 0.52 | 0.48 | 0.00 | 0.00 |
| Romania_2 | 0.49 | 0.50 | 0.00 | 0.00 |
| Russian Federation | 0.53 | 0.47 | 0.00 | 0.00 |
| Senegal | 0.37 | 0.63 | 0.01 | 0.00 |
| Serbia | 0.53 | 0.19 | 0.00 | 0.28 |
| Singapore | 0.51 | 0.49 | 0.00 | 0.00 |
| Slovakia | 0.50 | 0.50 | 0.00 | 0.00 |
| South Africa | 0.51 | 0.17 | 0.00 | 0.31 |
| Spain | 0.33 | 0.67 | 0.00 | 0.00 |
| Sweden | 0.40 | 0.59 | 0.00 | 0.00 |
| Switzerland | 0.51 | 0.49 | 0.00 | 0.00 |
| Taiwan | 0.50 | 0.50 | 0.00 | 0.00 |
| Turkey | 0.51 | 0.49 | 0.00 | 0.00 |
| Ukraine | 0.52 | 0.47 | 0.00 | 0.00 |
| United Arab Emirates | 0.29 | 0.31 | 0.00 | 0.40 |
| United Kingdom | 0.51 | 0.49 | 0.00 | 0.00 |
| United States of America | 0.51 | 0.48 | 0.00 | 0.00 |
| Uruguay | 0.69 | 0.31 | 0.00 | 0.00 |
| Venezuela | 0.56 | 0.44 | 0.00 | 0.00 |
Note: Country = country names in accordance with ISO3 codes, % Female = Proportion of female respondents in the country, % Male = proportion of male respondents, % Other = proportion of non-binary respondents and % NA = proportion of the unreported sex.
Table 5.
Distribution of employment status in 69 countries (A-M).
| Country | % Full | % Part | % Unemp. | % Student | % Retired | % Other | % Unreported |
|---|---|---|---|---|---|---|---|
| Argentina | 0.45 | 0.15 | 0.02 | 0.08 | 0.08 | 0.22 | 0.00 |
| Australia | 0.36 | 0.18 | 0.11 | 0.05 | 0.23 | 0.07 | 0.00 |
| Austria | 0.36 | 0.13 | 0.02 | 0.05 | 0.12 | 0.20 | 0.13 |
| Bangladesh | 0.18 | 0.15 | 0.08 | 0.21 | 0.02 | 0.04 | 0.32 |
| Belgium | 0.28 | 0.04 | 0.03 | 0.25 | 0.25 | 0.14 | 0.00 |
| Bolivia | 0.52 | 0.14 | 0.07 | 0.07 | 0.00 | 0.21 | 0.00 |
| Brazil_1 | 0.51 | 0.10 | 0.11 | 0.09 | 0.09 | 0.09 | 0.01 |
| Brazil_2 | 0.25 | 0.08 | 0.06 | 0.16 | 0.04 | 0.08 | 0.33 |
| Brazil_3 | 0.50 | 0.00 | 0.00 | 0.33 | 0.00 | 0.17 | 0.00 |
| Bulgaria | 0.37 | 0.06 | 0.06 | 0.24 | 0.01 | 0.23 | 0.03 |
| Canada_English | 0.41 | 0.12 | 0.09 | 0.11 | 0.18 | 0.09 | 0.00 |
| Canada_French | 0.00 | 0.00 | 0.63 | 0.05 | 0.25 | 0.08 | 0.00 |
| Chile | 0.40 | 0.16 | 0.04 | 0.04 | 0.07 | 0.28 | 0.00 |
| China | 0.73 | 0.01 | 0.01 | 0.05 | 0.20 | 0.00 | 0.00 |
| Colombia_1 | 0.42 | 0.07 | 0.09 | 0.26 | 0.05 | 0.11 | 0.02 |
| Colombia_2 | 0.40 | 0.15 | 0.04 | 0.12 | 0.07 | 0.22 | 0.00 |
| Costa Rica | 0.68 | 0.04 | 0.12 | 0.00 | 0.08 | 0.08 | 0.00 |
| Croatia | 0.48 | 0.03 | 0.16 | 0.05 | 0.24 | 0.05 | 0.00 |
| Cuba | 0.74 | 0.07 | 0.09 | 0.02 | 0.02 | 0.05 | 0.00 |
| Denmark | 0.41 | 0.07 | 0.07 | 0.10 | 0.29 | 0.07 | 0.00 |
| Dominican Republic | 0.56 | 0.14 | 0.08 | 0.11 | 0.03 | 0.08 | 0.00 |
| Ecuador | 0.57 | 0.10 | 0.06 | 0.07 | 0.05 | 0.14 | 0.00 |
| El Salvador | 0.68 | 0.07 | 0.07 | 0.04 | 0.00 | 0.14 | 0.00 |
| Finland | 0.44 | 0.08 | 0.09 | 0.19 | 0.08 | 0.10 | 0.02 |
| France | 0.55 | 0.07 | 0.07 | 0.08 | 0.18 | 0.05 | 0.00 |
| Germany | 0.37 | 0.13 | 0.05 | 0.07 | 0.29 | 0.09 | 0.00 |
| Ghana | 0.31 | 0.08 | 0.11 | 0.22 | 0.01 | 0.05 | 0.22 |
| Greece | 0.33 | 0.10 | 0.14 | 0.37 | 0.03 | 0.03 | 0.00 |
| Guatemala | 0.56 | 0.08 | 0.04 | 0.04 | 0.04 | 0.23 | 0.00 |
| Honduras | 0.46 | 0.38 | 0.08 | 0.04 | 0.00 | 0.04 | 0.00 |
| Hungary | 0.44 | 0.07 | 0.07 | 0.05 | 0.29 | 0.07 | 0.00 |
| India_1 | 0.31 | 0.05 | 0.06 | 0.33 | 0.01 | 0.05 | 0.18 |
| India_2 | 0.37 | 0.11 | 0.09 | 0.10 | 0.05 | 0.19 | 0.10 |
| Iraq | 0.09 | 0.08 | 0.09 | 0.17 | 0.01 | 0.04 | 0.50 |
| Ireland | 0.42 | 0.12 | 0.05 | 0.18 | 0.06 | 0.12 | 0.05 |
| Israel | 0.39 | 0.13 | 0.15 | 0.06 | 0.09 | 0.18 | 0.00 |
| Italy_1 | 0.42 | 0.12 | 0.13 | 0.08 | 0.17 | 0.08 | 0.00 |
| Italy_2 | 0.37 | 0.07 | 0.04 | 0.15 | 0.25 | 0.11 | 0.00 |
| Japan | 0.44 | 0.12 | 0.16 | 0.05 | 0.10 | 0.06 | 0.06 |
| Korea | 0.49 | 0.12 | 0.06 | 0.08 | 0.06 | 0.09 | 0.10 |
| Latvia | 0.63 | 0.08 | 0.06 | 0.07 | 0.10 | 0.08 | 0.00 |
| Macedonia | 0.70 | 0.04 | 0.07 | 0.08 | 0.02 | 0.06 | 0.03 |
| Mexico_1 | 0.45 | 0.12 | 0.08 | 0.03 | 0.10 | 0.16 | 0.07 |
| Mexico_2 | 0.52 | 0.15 | 0.03 | 0.05 | 0.07 | 0.18 | 0.00 |
| Morocco | 0.38 | 0.09 | 0.12 | 0.29 | 0.03 | 0.09 | 0.01 |
Note: Country = country names in accordance with ISO3 codes, % Full = Proportion of full time workers, % Part = proportion of part time workers, % Unemp. = proportion of unemployed respondents, % Student = proportion of students, % Retired = proportion of retirees, % Other = proportion of respondents who do not fit in the mentioned categories and % NA = proportion of the unreported employment status.
Table 6.
Distribution of employment status in 69 countries (N-V).
| Country | % Full | % Part | % Unemp. | % Student | % Retired | % Other | % Unreported |
|---|---|---|---|---|---|---|---|
| Nepal | 0.25 | 0.08 | 0.07 | 0.19 | 0.01 | 0.04 | 0.37 |
| Netherlands | 0.31 | 0.17 | 0.04 | 0.08 | 0.20 | 0.19 | 0.00 |
| New Zealand | 0.40 | 0.16 | 0.10 | 0.05 | 0.16 | 0.12 | 0.00 |
| Nicaragua | 0.44 | 0.25 | 0.06 | 0.00 | 0.06 | 0.19 | 0.00 |
| Nigeria | 0.30 | 0.14 | 0.17 | 0.18 | 0.01 | 0.06 | 0.13 |
| Norway | 0.45 | 0.09 | 0.03 | 0.06 | 0.20 | 0.15 | 0.00 |
| Pakistan | 0.24 | 0.05 | 0.07 | 0.43 | 0.01 | 0.06 | 0.14 |
| Panama | 0.50 | 0.00 | 0.11 | 0.06 | 0.11 | 0.22 | 0.00 |
| Paraguay | 0.62 | 0.38 | 0.00 | 0.00 | 0.00 | 0.00 | 0.00 |
| Peru | 0.49 | 0.21 | 0.07 | 0.08 | 0.07 | 0.09 | 0.00 |
| Philippines | 0.47 | 0.12 | 0.15 | 0.09 | 0.03 | 0.11 | 0.03 |
| Poland | 0.37 | 0.07 | 0.13 | 0.07 | 0.26 | 0.10 | 0.00 |
| Puerto Rico | 0.50 | 0.00 | 0.00 | 0.00 | 0.00 | 0.50 | 0.00 |
| Romania_1 | 0.63 | 0.04 | 0.08 | 0.07 | 0.13 | 0.05 | 0.00 |
| Romania_2 | 0.58 | 0.05 | 0.08 | 0.08 | 0.14 | 0.08 | 0.00 |
| Russian Federation | 0.26 | 0.20 | 0.23 | 0.05 | 0.24 | 0.02 | 0.00 |
| Senegal | 0.51 | 0.05 | 0.06 | 0.23 | 0.01 | 0.13 | 0.00 |
| Serbia | 0.49 | 0.03 | 0.06 | 0.05 | 0.05 | 0.00 | 0.33 |
| Singapore | 0.63 | 0.06 | 0.08 | 0.04 | 0.05 | 0.05 | 0.07 |
| Slovakia | 0.48 | 0.05 | 0.08 | 0.07 | 0.24 | 0.08 | 0.00 |
| South Africa | 0.39 | 0.06 | 0.04 | 0.05 | 0.04 | 0.10 | 0.31 |
| Spain | 0.54 | 0.07 | 0.09 | 0.05 | 0.13 | 0.11 | 0.00 |
| Sweden | 0.51 | 0.06 | 0.03 | 0.05 | 0.27 | 0.09 | 0.00 |
| Switzerland | 0.37 | 0.18 | 0.06 | 0.07 | 0.20 | 0.11 | 0.00 |
| Taiwan | 0.57 | 0.10 | 0.06 | 0.07 | 0.14 | 0.07 | 0.00 |
| Turkey | 0.37 | 0.07 | 0.11 | 0.20 | 0.10 | 0.16 | 0.00 |
| Ukraine | 0.61 | 0.14 | 0.12 | 0.02 | 0.02 | 0.09 | 0.00 |
| United Arab Emirates | 0.30 | 0.02 | 0.05 | 0.18 | 0.00 | 0.05 | 0.40 |
| United Kingdom | 0.40 | 0.17 | 0.11 | 0.05 | 0.17 | 0.10 | 0.00 |
| United States of America | 0.48 | 0.11 | 0.12 | 0.04 | 0.18 | 0.06 | 0.00 |
| Uruguay | 0.53 | 0.14 | 0.00 | 0.06 | 0.12 | 0.14 | 0.00 |
| Venezuela | 0.46 | 0.12 | 0.07 | 0.02 | 0.03 | 0.29 | 0.00 |
Note: Country = country names in accordance with ISO3 codes, % Full = Proportion of full time workers, % Part = proportion of part time workers, % Unemp. = proportion of unemployed respondents, % Student = proportion of students, % Retired = proportion of retirees, % Other = proportion of respondents who do not fit in the mentioned categories and % NA = proportion of the unreported employment status.
Table 7.
Distribution of marital status and number of children in 69 countries (A-H).
| Country | Marital Status | Number of Children | |||||||||
|---|---|---|---|---|---|---|---|---|---|---|---|
| Single | Relation | Married | Unreported (MS) | 0 | 1 | 2 | 3 | 4 | ≥4 | Unreported (Child.) | |
| Argentina | 0.29 | 0.27 | 0.44 | 0.00 | 0.37 | 0.16 | 0.26 | 0.14 | 0.05 | 0.02 | 0.00 |
| Australia | 0.37 | 0.15 | 0.48 | 0.00 | 0.44 | 0.15 | 0.24 | 0.10 | 0.04 | 0.02 | 0.00 |
| Austria | 0.20 | 0.24 | 0.43 | 0.13 | 0.32 | 0.17 | 0.23 | 0.11 | 0.03 | 0.01 | 0.13 |
| Bangladesh | 0.33 | 0.04 | 0.31 | 0.32 | 0.36 | 0.07 | 0.10 | 0.03 | 0.00 | 0.01 | 0.43 |
| Belgium | 0.37 | 0.26 | 0.36 | 0.00 | 0.57 | 0.12 | 0.19 | 0.08 | 0.03 | 0.01 | 0.00 |
| Bolivia | 0.38 | 0.10 | 0.52 | 0.00 | 0.41 | 0.14 | 0.28 | 0.10 | 0.07 | 0.00 | 0.00 |
| Brazil_1 | 0.40 | 0.14 | 0.45 | 0.01 | 0.44 | 0.23 | 0.20 | 0.09 | 0.02 | 0.01 | 0.01 |
| Brazil_2 | 0.24 | 0.21 | 0.22 | 0.33 | 0.45 | 0.10 | 0.09 | 0.03 | 0.00 | 0.00 | 0.33 |
| Brazil_3 | 0.17 | 0.33 | 0.50 | 0.00 | 0.67 | 0.33 | 0.00 | 0.00 | 0.00 | 0.00 | 0.00 |
| Bulgaria | 0.40 | 0.37 | 0.21 | 0.02 | 0.67 | 0.16 | 0.13 | 0.01 | 0.00 | 0.01 | 0.02 |
| Canada_English | 0.40 | 0.21 | 0.39 | 0.00 | 0.57 | 0.15 | 0.16 | 0.08 | 0.03 | 0.01 | 0.00 |
| Canada_French | 0.49 | 0.22 | 0.29 | 0.00 | 0.58 | 0.16 | 0.17 | 0.06 | 0.02 | 0.01 | 0.00 |
| Chile | 0.38 | 0.18 | 0.44 | 0.00 | 0.32 | 0.12 | 0.27 | 0.20 | 0.07 | 0.02 | 0.00 |
| China | 0.11 | 0.05 | 0.84 | 0.00 | 0.20 | 0.74 | 0.06 | 0.00 | 0.00 | 0.00 | 0.00 |
| Colombia_1 | 0.40 | 0.29 | 0.30 | 0.01 | 0.55 | 0.16 | 0.18 | 0.07 | 0.02 | 0.01 | 0.02 |
| Colombia_2 | 0.32 | 0.21 | 0.47 | 0.00 | 0.39 | 0.16 | 0.27 | 0.12 | 0.03 | 0.02 | 0.00 |
| Costa Rica | 0.44 | 0.12 | 0.44 | 0.00 | 0.56 | 0.08 | 0.04 | 0.12 | 0.16 | 0.04 | 0.00 |
| Croatia | 0.21 | 0.14 | 0.61 | 0.04 | 0.34 | 0.17 | 0.34 | 0.10 | 0.02 | 0.02 | 0.01 |
| Cuba | 0.23 | 0.21 | 0.56 | 0.00 | 0.19 | 0.40 | 0.23 | 0.12 | 0.05 | 0.02 | 0.00 |
| Denmark | 0.28 | 0.26 | 0.46 | 0.00 | 0.39 | 0.16 | 0.31 | 0.09 | 0.02 | 0.02 | 0.00 |
| Dominican Republic | 0.44 | 0.25 | 0.31 | 0.00 | 0.50 | 0.28 | 0.14 | 0.08 | 0.00 | 0.00 | 0.00 |
| Ecuador | 0.36 | 0.16 | 0.48 | 0.00 | 0.43 | 0.18 | 0.26 | 0.09 | 0.03 | 0.03 | 0.00 |
| El Salvador | 0.39 | 0.11 | 0.50 | 0.00 | 0.36 | 0.25 | 0.21 | 0.14 | 0.00 | 0.04 | 0.00 |
| Finland | 0.37 | 0.34 | 0.27 | 0.02 | 0.63 | 0.11 | 0.15 | 0.05 | 0.02 | 0.03 | 0.02 |
| France | 0.35 | 0.30 | 0.35 | 0.00 | 0.58 | 0.20 | 0.15 | 0.05 | 0.01 | 0.01 | 0.00 |
| Germany | 0.38 | 0.19 | 0.43 | 0.00 | 0.48 | 0.19 | 0.23 | 0.08 | 0.01 | 0.01 | 0.00 |
| Ghana | 0.36 | 0.11 | 0.32 | 0.21 | 0.00 | 0.00 | 0.00 | 0.00 | 0.00 | 0.00 | 1.00 |
| Greece | 0.45 | 0.38 | 0.16 | 0.00 | 0.86 | 0.07 | 0.06 | 0.01 | 0.00 | 0.00 | 0.00 |
| Guatemala | 0.29 | 0.25 | 0.46 | 0.00 | 0.40 | 0.17 | 0.25 | 0.10 | 0.06 | 0.02 | 0.00 |
| Honduras | 0.38 | 0.17 | 0.46 | 0.00 | 0.58 | 0.12 | 0.00 | 0.04 | 0.17 | 0.08 | 0.00 |
| Hungary | 0.30 | 0.27 | 0.43 | 0.00 | 0.39 | 0.25 | 0.26 | 0.08 | 0.01 | 0.01 | 0.00 |
Note: Country = country names in accordance with ISO3 codes, Columns 2-5 shows the proportion of different marital status, NA(MS) = unreported marital status, Columns 6-12 shows proportion of respondents by the number of children they have and NA(Child.) = proportion of unreported number of children.
Table 9.
Distribution of marital status and number of children in 69 countries (S-V).
| Country | Marital Status | Number of Children | |||||||||
|---|---|---|---|---|---|---|---|---|---|---|---|
| Single | Relation | Married | Unreported (MS) | 0 | 1 | 2 | 3 | 4 | ≥4 | Unreported (Child.) | |
| Senegal | 0.48 | 0.08 | 0.44 | 0.00 | 0.50 | 0.13 | 0.11 | 0.12 | 0.06 | 0.07 | 0.01 |
| Serbia | 0.19 | 0.15 | 0.38 | 0.28 | 0.28 | 0.16 | 0.21 | 0.05 | 0.01 | 0.01 | 0.29 |
| Singapore | 0.31 | 0.08 | 0.53 | 0.07 | 0.44 | 0.18 | 0.21 | 0.08 | 0.01 | 0.01 | 0.07 |
| Slovakia | 0.28 | 0.25 | 0.47 | 0.00 | 0.37 | 0.18 | 0.31 | 0.11 | 0.03 | 0.01 | 0.00 |
| South Africa | 0.23 | 0.16 | 0.30 | 0.32 | 0.32 | 0.11 | 0.16 | 0.07 | 0.01 | 0.01 | 0.32 |
| Spain | 0.24 | 0.27 | 0.49 | 0.00 | 0.49 | 0.17 | 0.27 | 0.06 | 0.01 | 0.00 | 0.00 |
| Sweden | 0.27 | 0.27 | 0.46 | 0.00 | 0.29 | 0.14 | 0.33 | 0.16 | 0.05 | 0.03 | 0.00 |
| Switzerland | 0.31 | 0.28 | 0.41 | 0.00 | 0.46 | 0.19 | 0.25 | 0.08 | 0.03 | 0.01 | 0.00 |
| Taiwan | 0.35 | 0.11 | 0.54 | 0.00 | 0.46 | 0.16 | 0.27 | 0.09 | 0.02 | 0.00 | 0.00 |
| Turkey | 0.37 | 0.06 | 0.57 | 0.00 | 0.42 | 0.12 | 0.26 | 0.11 | 0.03 | 0.05 | 0.00 |
| Ukraine | 0.19 | 0.12 | 0.62 | 0.07 | 0.33 | 0.39 | 0.24 | 0.03 | 0.01 | 0.00 | 0.00 |
| United Arab Emirates | 0.26 | 0.15 | 0.20 | 0.40 | 0.40 | 0.08 | 0.07 | 0.04 | 0.00 | 0.01 | 0.40 |
| United Kingdom | 0.33 | 0.24 | 0.42 | 0.00 | 0.50 | 0.15 | 0.24 | 0.07 | 0.03 | 0.01 | 0.00 |
| United States of America | 0.41 | 0.11 | 0.48 | 0.00 | 0.47 | 0.18 | 0.23 | 0.08 | 0.02 | 0.02 | 0.00 |
| Uruguay | 0.29 | 0.14 | 0.57 | 0.00 | 0.27 | 0.22 | 0.37 | 0.08 | 0.06 | 0.00 | 0.00 |
| Venezuela | 0.28 | 0.23 | 0.49 | 0.00 | 0.31 | 0.19 | 0.30 | 0.15 | 0.05 | 0.00 | 0.00 |
Note: Country = country names in accordance with ISO3 codes, Columns 2-5 shows the proportion of different marital status, NA(MS) = unreported marital status, Columns 6-12 shows proportion of respondents by the number of children they have and NA(Child.) = proportion of unreported number of children.
For the most part, participants were recruited via professional survey research companies and were incentivised to participate. In countries that, to our knowledge, did not possess polling infrastructure30, incentivising participants was not feasible. To collect data in these countries, leaders of national teams relied on online volunteers recruited via media appeals, mailing lists, advertisements on news aggregators, local communities and bloggers, and private messaging apps such as WhatsApp or WeChat.
Materials
The measures we used are illustrated in Figs. 4, 5 along with the specific items listed for each measure. In most cases, participants’ responses were collected on a scale from 0 = ‘strongly disagree’ to 10 = ‘strongly agree’, with 5 = ‘neither disagree nor agree’. In some cases, when more appropriate, we used other response scales (e.g., the generosity measure, where a 0–100% response scale was applied to hypothetical donations). In total, we collected 98 unique variables and meta-data. To ensure participants’ anonymity, no data that would allow their identification were collected.
Fig. 4.
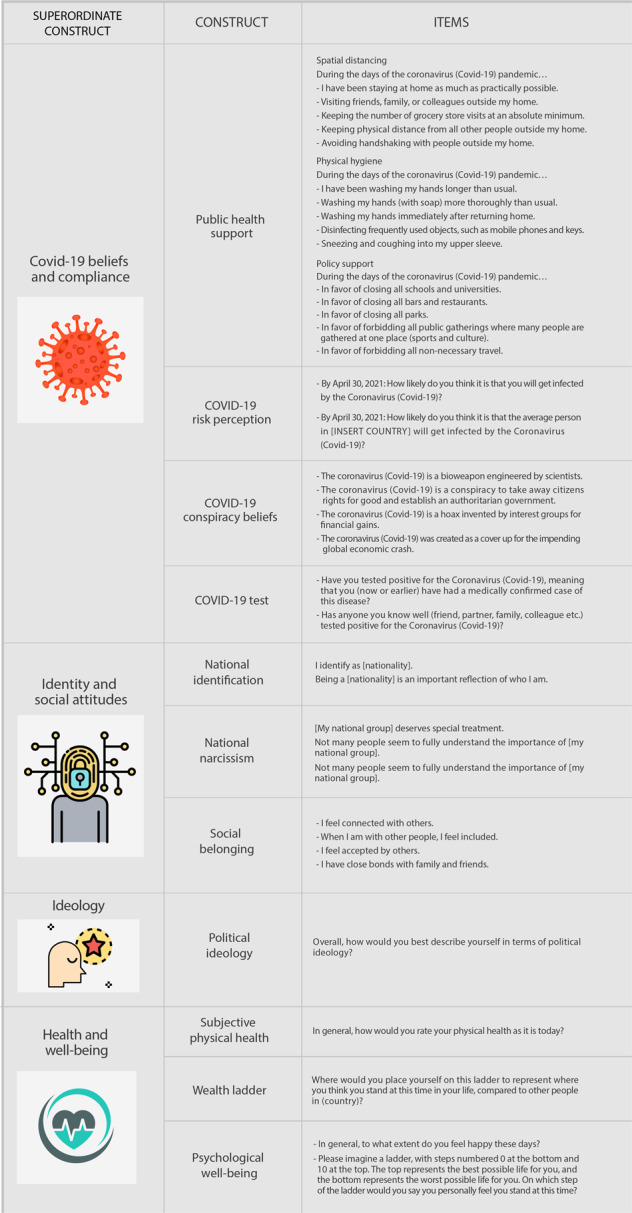
International Collaboration on the Social and Moral Psychology of COVID-19: Investigated constructs, items and variables.
Fig. 5.
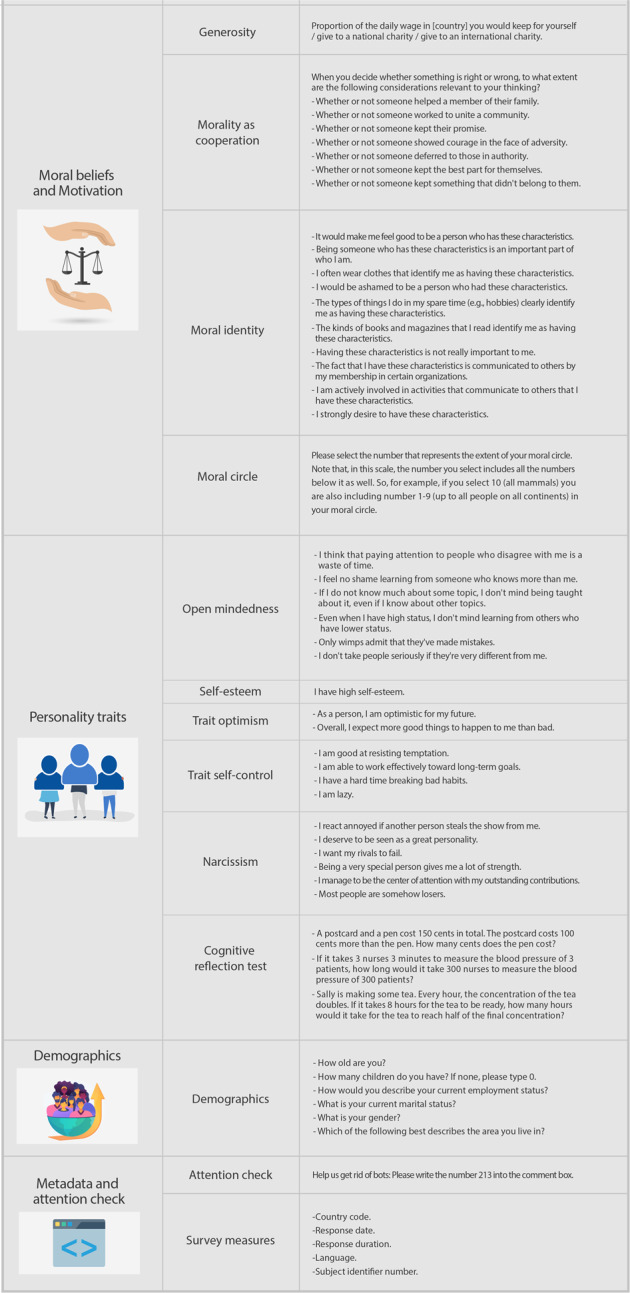
International Collaboration on the Social and Moral Psychology of COVID-19: Investigated constructs, items and variables.
COVID-19 Beliefs and compliance
Four constructs: COVID-19 public health support, COVID-19 risk perception, COVID-19 conspiracy theory beliefs, and COVID-19 testing behaviour. The public health support construct, in turn, is composed of three measures: spatial distancing, physical hygiene, and policy support. These are ad-hoc scales that we developed ourselves.
Identity and social attitudes
Three constructs: national identification31, national narcissism32, and social belonging33.
Ideology
One construct: political ideology. Participants self-reported their political orientation according to a single item on a scale from 0 (“Very left-leaning”) to 10 (“Very right-leaning”). This measure has been shown to account for a significant proportion of the variance in voting intentions in American presidential elections between 1972 and 200434 and 201635–37. In fact, using a single-item scale to measure political ideology has been a common practice in political psychology literature, providing substantive evidence for the validity of the measure both across national and international research38,39. However, even if the symbolic ideology can be a useful and parsimonious instrument to study political attitudes, when interpreting results, users should be attentive to the political and cultural applicability, psychometric validity, and generalisability of measures of political ideology40–42.
Health and well-being
Three constructs: subjective physical health, wealth ladder, and psychological well-being. Each of these scales relied on well-validated instruments43–45.
Moral beliefs and motivation
Four constructs: generosity46, morality as cooperation47, moral identity48, and moral circle49.
Personality traits
Six constructs: open-mindedness50, self-esteem51, trait optimism52, trait self-control53, narcissism54, and cognitive reflection55.
Demographics
Six questions: age, number of children, employment status, marital status, gender, and urbanicity.
Metadata and attention check
An attention check was used to mitigate negative impact on data quality from potential non-human responses and the likelihood of biasing data and subsequent analysis of low base-rate outcomes—such as endorsement of COVID-19 conspiracies. We collected typical questionnaire metadata (e.g., start, record, and end dates, duration, and language). In addition, we created an internal participant ID, added ISO2 and ISO3 country codes, and sample representativeness.
Translation
The survey instrument was drafted in English and translated into other languages using the standard forward-backward method (i.e., members of national teams were advised to split members into forward-translating the survey into the local language and back-translating it into English, and then have the two groups discuss and resolve discrepancies). In total, the survey instrument was translated into 32 languages, including adaptations of region-specific dialects or vernaculars. Specifically, from English into Arabic, Bengali, Bulgarian, Croatian, Danish, Dutch, Finnish, French, German, Greek, Hebrew, Hungary, Italian, Japanese, Korean, Kurdish, Latvian, Macedonian, Mandarin simplified, Mandarin traditional, Nepali, Norwegian, Polish, Portuguese, Romanian, Russian, Serbian, Slovak, Spanish, Swedish, Turkish, and Ukrainian (see osf.io/tfsza at sub-folder Translations).
Data cleaning
We received individual data files from each national team. To merge these raw data, minor modifications were introduced, which we delineate in this section. First, we renamed columns to match across data sets, reordered variables alphabetically, and standardised variable labels. Furthermore, all missing values and values denoting the absence of a response were converted to NAs (not available). When ambiguous date formats were found (e.g., on start date, end date, and record date), we manually specified the correct format and standardised them. At the second stage, we introduced multiple modifications to clean the data for research. Some modifications were introduced to every national data set, while others were introduced to specific national data sets (both of which are thoroughly reported in the Data Records section). To each national data set, we recoded the attention check (attcheck) into pass (1) or fail (0); standardised generosity items (generosity1–3), recoded CRT items into intuitive (2), correct (1), and incorrect (0); converted the number of children (children) into a variable with a fixed range from zero to ten or more; recoded all participants declaring being older than 100 years old as 100; and we excluded all duplicates (i.e., in case multiple participants were recorded with identical inputs within a national database, only the first input was retained).
Data Records
All materials associated with the ICSMP COVID-19 project can be found on the project’s repository (comprising five folders) hosted by the Open Science Framework (OSF, 10.17605/osf.io/tfsza)56,57. The folder named Code includes an R Markdown document (ICSMP official data.Rmd; osf.io/dwpng) that loads multiple data files (from each national team), cleans them up, merges them into a single data file, generates a data-driven code-book, and saves all outputs. It also includes a reproducible report with all reported numbers, analyses and graphs in this article (Analyses-SciData.html; osf.io/s5c4p; Analyses SciData.Rmd; osf.io/9suyb). The folder named Data includes three sub-folders. The Raw data sub-folder contains the original and unmodified data files from each national team (country data files.zip; osf.io/dqmut). The sub-folder named Cleaned data contains the merged and cleaned dataset, which is provided in a non-proprietary (ICSMP_cleaned_data.csv; osf.io/ypkrc) and a labelled (ICSMP_cleaned_data.sav; at osf.io/8tyj9) file formats. In addition, we included in a sub-folder a dataset that removes observations failing the attention check or filled out less than 50% of the items, both in a non-proprietary (ICSMP_cleaned_data_nobots.csv; osf.io/98fex) and a labelled (ICSMP_cleaned_data_nobots.sav; at osf.io/3yjga) file formats. The Metadata sub-folder provides a thorough itemised description of the data cleaning process in both text (Data Cleaning.docx; osf.io/7udpt) and human-readable change-log (human-readable change log ICSMP.xlsx; osf.io/fydx2).
We also provide a data-driven codebook detailing how each measure was collected—e.g., listing variable names, variable labels, and label values (dt.codebook.xlsx; osf.io/ecva2). The IRB folder contains both the Internal Review Board Ethics application (ICSMP Kent Ethics application full.pdf; osf.io/xt9gr) and Ethics approval (ICSMP Kent Ethics approval.pdf; osf.io/ce638). The folder Sample Type & Representativeness includes the documentation for an internal survey conducted with national team leaders about the employed survey methodology for the data provided (Sample Type & Representativeness.zip; osf.io/fj5xn). The folder Survey Instrument contains the initial English version of our survey instrument along with its Qualtrics.qsf for reproducibility (Survey Instrument.zip; osf.io/nf48q). In the sub-folder Translations, we archived all 32 translated survey instruments along with a report on the languages of conducted surveys per country (i.e., several countries had their surveys in multiple languages per country; Country and language.xlsx; osf.io/wj7d2).
Potential for future research
The data contains four measures of COVID-19 beliefs and compliance, 17 social and moral psychological constructs, and six sociodemographic characteristics, amounting to 27 socially-relevant variables. To quantify the potential of this dataset—and assuming a typical research paper uses between three to five key main constructs plus sociodemographics and controls—we calculated the number of combinations of 17 constructs, taken three, four, and five at a time, yielding a grand total of 9248 possible unique designs. As a demonstration of the broad scope of the ICSMP data, published studies cover a broad range of psychological disciplines, including social psychology13,14, cognitive psychology15,17, political psychology16, moral psychology16,18, economic psychology19 and health sciences20, among others. They explore different populations in reference to the COVID-19 pandemic in terms of age (e.g., older adults see21, marital status19 or nationality (e.g., for a study on the Spanish population, see;22 for Swedish and Chinese population see23), and other socio-demographic characteristics. These all attest to the great potential of the ICSMP data to inspire further research. In sum, the present dataset affords numerous opportunities for cross-cultural research on a plethora of hypotheses. We encourage researchers who consider reusing ICSMP data to examine the list of pre-registrations before beginning a new project so as to avoid duplication (see icsmp-covid19.netlify.app/preregistration).
Data visualisation interface
In addition to the raw data, a dedicated Web application was developed to provide a general overview of the dataset (icsmp.shinyapps.io/icsmp_covid19). The application is based on an R shiny server (rstudio.com/products/shiny), together with the leaflet58 and ggplot259 graphical libraries to generate dynamic plots. All the generated figures can be exported as .png files, and all tables can be exported as .csv files. The Web application allows easy and dynamic generation of illustrations like the figures with maps for each construct with zoomable world maps and static figures and plots for sample and country characteristics. In addition, all tables are embedded with dynamic features for sorting and filtering. To make it more accessible for the readers, both tables and figures are downloadable. The Shiny app has two tabs giving general information about the project and the international consortium. The first tab contains sample descriptions such as sample size, missing data, and attention checks for each country with a Gantt chart showing the dates of data collection. The second tab displays world maps of spatial distancing, policy support, national identity, conspiracy beliefs, national narcissism and morality as cooperation as well as all tables reported in dynamic formats.
Technical Validation
To support the technical quality of the dataset, we conducted an analysis to showcase its reliability (and its diverse applicability to research questions in social sciences and beyond). For completeness, in the analyses that follow, we examined all samples-including those with very few observations, such as Puerto Rico (N = 2), Brazil_3 (N = 6), and Panama (N = 12).
We evaluated the adopted survey methodology utilised by national teams by conducting an internal survey to ensure the accuracy of reported sample types. The inspection showed that 28 samples were quota-based nationally representative samples (36%), 6 used post hoc weights to achieve an approximate level of national representation (8%) which nonetheless should be seen as convenience samples, and 43 were convenience samples (56%), many of which were from low and middle-income countries60. We codified the results of this survey into the cleaned data as the variable ‘sample_coding’ and present a summary in Table 10. National representativeness for the 28 quota-based samples relate to an approximation of the demographic characteristics of age and gender only for each country.
Table 10.
Overview of the samples.
| Sample Coding | Samples (Countries) | N Samples | N Respondents | % Countries | % Respondents |
|---|---|---|---|---|---|
| Continued on next page Quota-based nationally representative | AU, BR_1, CA_e, CA_f, CH, CN, DE, FR, HR, HU, IL, IT_1, JP, KR, LV, NG, NO, NZ, PH, PL, RO_1, RU, SG, SK, TR, TW, GB, US | 28 | 26173 | 0.36 | 0.51 |
| Post-hoc weights | AT, DK, ES, NL, SE, UA | 6 | 6703 | 0.08 | 0.13 |
| Convenience | AE, BD, BE, BG, BR_2, BR_3, CO_1, FI, GH, GR, IE, IN_1, IN_2, IT_2, IQ, CO_2, AR, CL, MX_2, PE, VE, CR, PY, BR_3, EC, GT, UY, BO, SV, PA, HN, CU, NI, DO, PR, MA, MK, MX_1, MX_2, NP, PK, RO_2, RS, SN, ZA | 43 | 18528 | 0.56 | 0.36 |
| Total | 77 | 51404 | 1.00 | 1.00 |
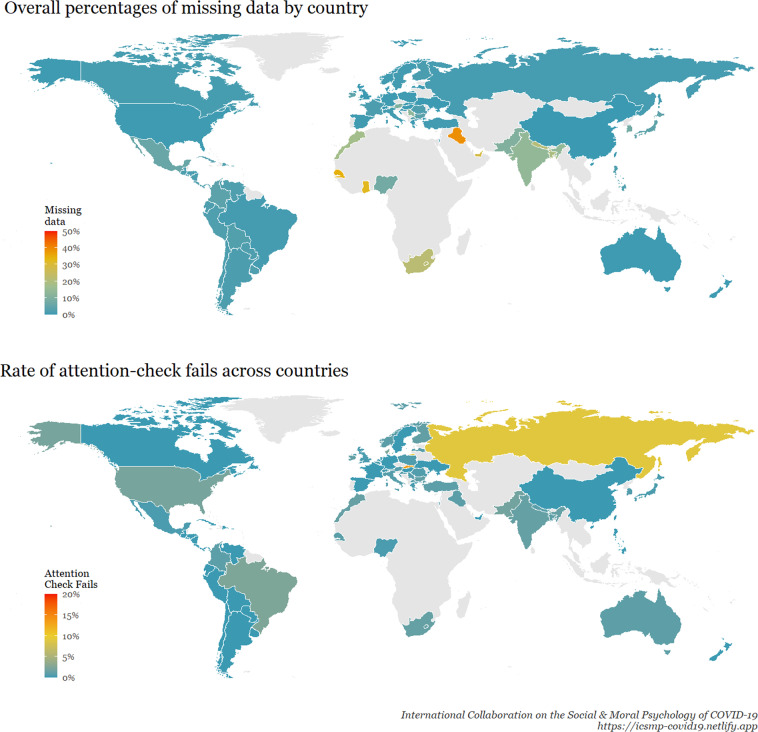
Regarding individual-level data quality, Fig. 6 shows a world map of the 69 countries from which data were collected, coloured according to overall percentages of missing data (overall mean = 6.0%). Overall, 95.6% of participants had less than 50% missing data, 92.8% participants had less than 10% missing data, and 24.7% of participants had 0% missing data. Another indicator of data quality is the rate of attention check fails per country. On the last screen of the survey, participants were given the following instructions: “Help us get rid of bots: Please write the number 213 into the comment box.” Participants who wrote “213” were coded as passing the attention check, participants who wrote anything else were coded as failing the attention check, and those who did not reach this screen of the survey were coded as missing data. Figure 6 also shows (bottom plot) a world map coloured according to the rate of attention-check fails across countries. Overall, 90.1% of participants passed the attention check (1.0% failed), and 8.0% did not reach the final screen with the attention check.
Fig. 6.
Data quality indicators for each surveyed country. Note: The percentage of missing data considered all the questions in the survey (i.e., all sociodemographics and psychological scales”). We calculated, for each country, the mean of the participants’ proportion of missing data across all survey questions, including sociodemographics (this information is also provided in our reproducible report of Fig. 6, where the R code is provided).
The full dataset presents N = 51,404 cases across 69 countries (from 77 samples, 28 of which are quota-based nationally representative), with an average sample size of 745 (SD = 549) and a proportion of valid answers of 95%. The mean age of respondents was 42.93 (SD = 16.04) years, and 50.9% were women (44% males, 0.3% others, and 4.8% unreported). The employment status breakdown shows 44.8% employed full-time, 10.6% part-time, 8.1% unemployed, 10% students, 10.1% retired, 11% other, and 5.3% unreported. The overall marital status shows 33% of respondents were single, 18.7% in a relationship, 42.7% married, and 5.5% unreported. The majority of our participants reported having no children (41.6%), with 16.7% having one child, 20.1%, 9.2%, and 3.9% with two, three and four children, respectively, and 1.7% had five or more children (6.9% unreported). We break down these aggregated results per country. Tables 1, 2 show the number of cases and valid answers, Table 3,4 summarises the distribution of sex, Tables 5, 6 display employment status, and Tables 7–9 illustrate both marital statuses and the number of children.
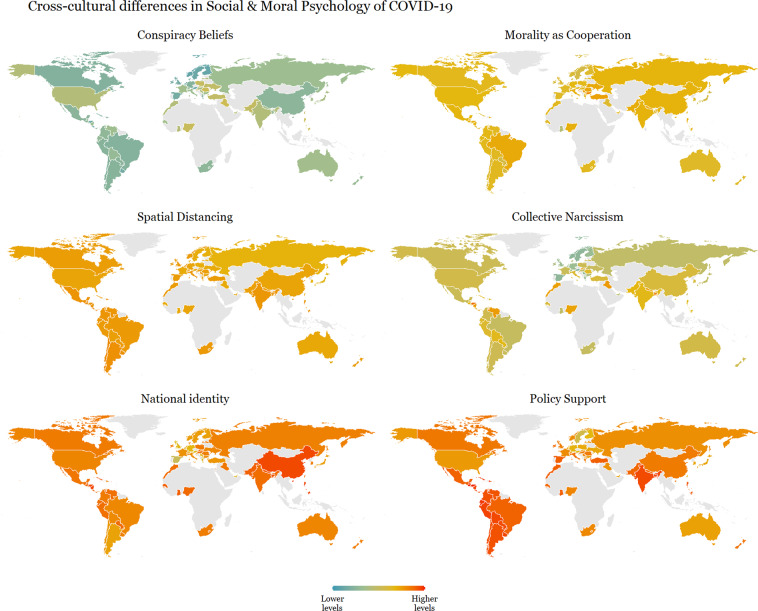
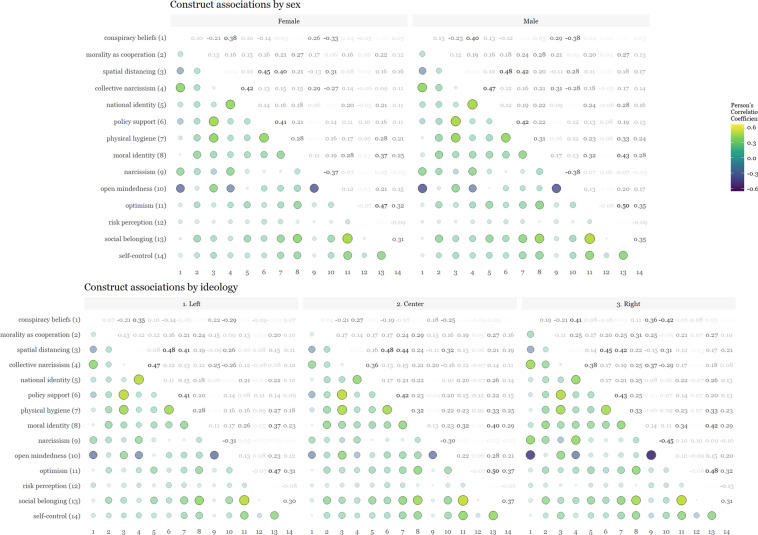
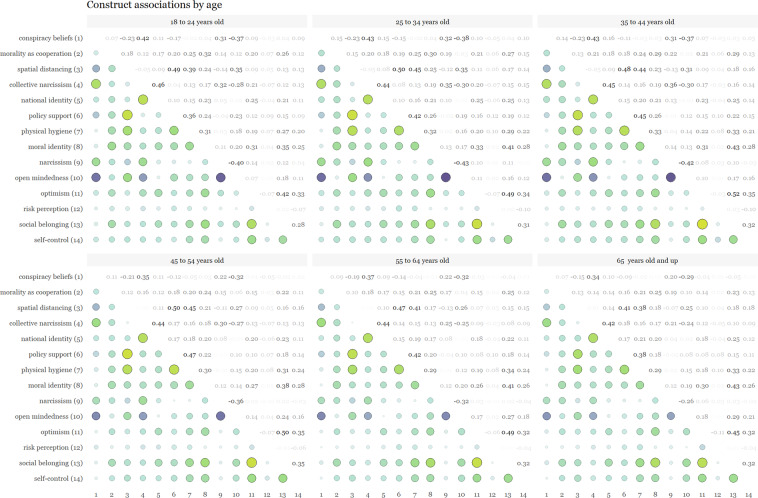
We also examined cross-cultural differences in conspiracy beliefs, morality as cooperation, spatial distancing, national narcissism, national identification, and policy support for preventative measures across 69 countries in Fig. 7. Additionally, we showcase patterns of associations between these moral and psychological constructs across gender, ideology and age in Figs. 8, 9. For the association pattern analysis, we excluded samples with less than 490 respondents as recommended for stable correlations61, as well as for the subsequent consistency measure analysis.
Fig. 7.
Cross-cultural differences in Social & Moral Psychology of COVID-19 across 69 countries. Note: Each world heat map in the figure shows the means score, at the country level, for constructs in the survey. Conspiracy Beliefs - participant’s beliefs in conspiracy theories regarding COVID-19; Morality as Cooperation - participant’s moral concern based on the morality-as-cooperation theory; Spatial Distancing - participant’s support for spatial distancing as a strategy against COVID-19; Collective Narcissism - participant’s narcissism, i.e., an inflated view regarding their ingroup (in this research we focused on nationality); National Identity - participant’s identity attached to belonging to a nation; Policy Support - participant’s support to public policies (e.g., closing parks or schools) as a strategy against COVID-19.
Fig. 8.
Cross-cultural differences in associations of Social & Moral Psychology of COVID-19 across sex and ideology in 69 countries.
Fig. 9.
Cross-cultural differences in associations of Social & Moral Psychology of COVID-19 across age in 69 countries.
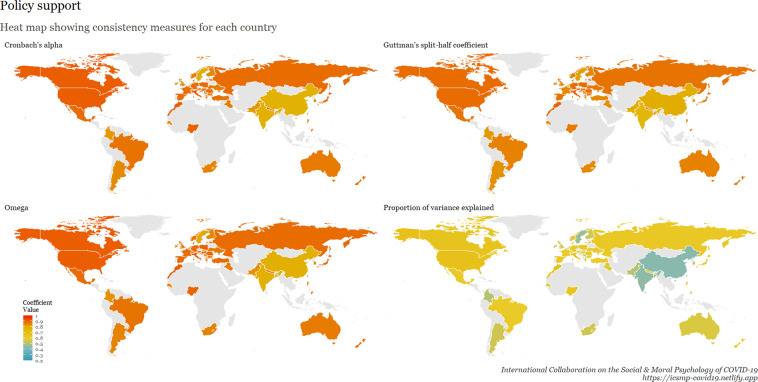
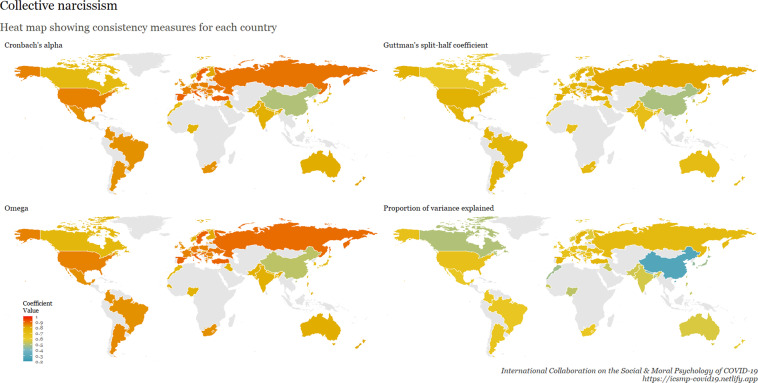
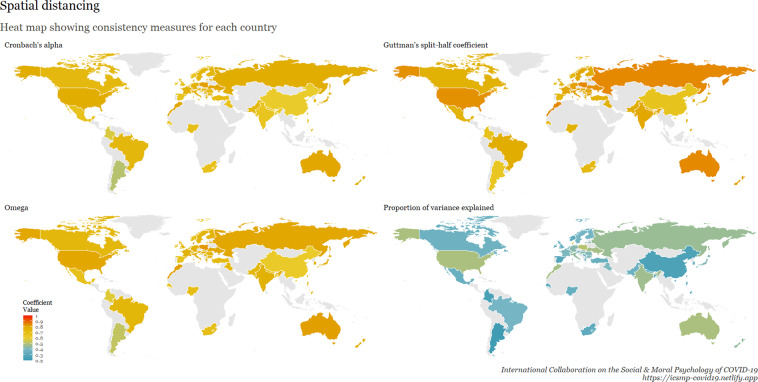
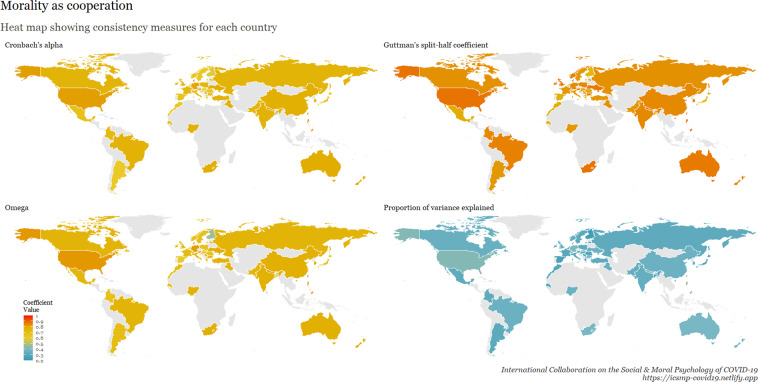
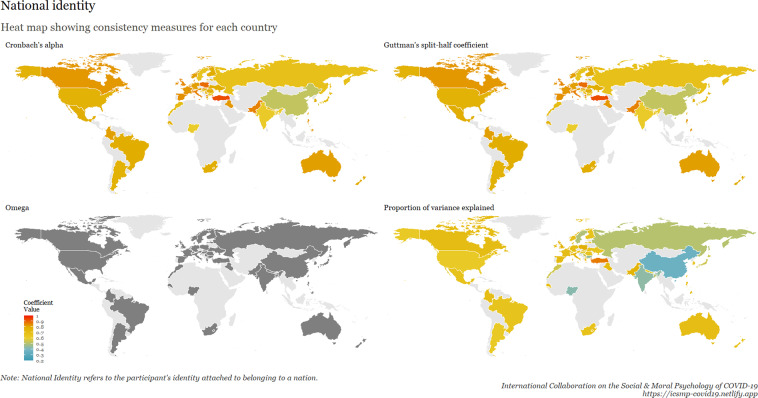
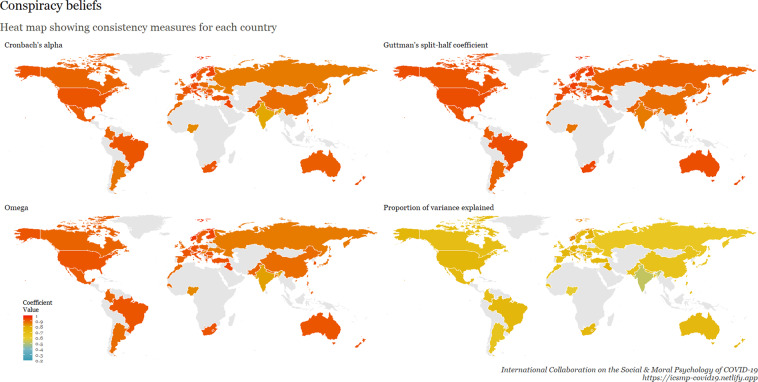
To examine internal consistency for the main scales, we calculated Cronbach’s Alpha, Omega, Guttman split-half reliability, and proportion of variance explained by a unidimensional factor. This table is available at osf.io/ed7yg and shows indices of internal consistency by country for measures of conspiracy beliefs, morality as cooperation, spatial distancing, national narcissism, national identification, and policy support for preventative measures, respectively. We found that the spatial distancing construct, on average, has the lowest Cronbach’s alpha, followed by morality as cooperation. On average, conspiracy beliefs have the highest Cronbach’s alpha, followed by policy support. These patterns hold for the Omega measures, but when considering Guttman’s split-half reliability, collective narcissism and national identity yield the lowest values. Figures 9–15 show these patterns visually.
Fig. 10.
Support for policies in 69 countries.
Fig. 11.
Collective narcissism in 69 countries.
Fig. 12.
Spatial distancing in 69 countries.
Fig. 13.
Morality as cooperation in 69 countries.
Fig. 14.
National identity in 69 countries.
Fig. 15.
Cross-cultural differences in Internal Consistency Coefficients (Cronbach’s alpha, McDonald’s Omega, Guttman Split-Half), and variance explained of Social & Moral Psychology Constructs in 69 countries. Note: internal consistency typically refers to correlations between different items on the same test to evaluate the extent to which latent indicators comprising the scale measure the same construct.
Usage Notes
The datasets are shared, cleaned, and ready for analysis. We recommend that interested researchers use the cleaned version of the data (available at 10.17605/osf.io/tfsza)56. The use of the labelled data is also suggested for convenience as it has all variable levels encoded, thus eliminating the need to consult the codebook when using the.csv format.
The Data were imported and cleaned using the R software for statistical analysis62 and packages readr63, haven64, readxl65, dplyr66, psych67, htmltools68, mime69, xfun70, labelled71, sjlabelled72, codebook73, lubridate74.
As previously noted5, those wishing to approximate national representativeness can apply the appropriate survey weights to demographic and countries of interest when random sampling is used (e.g., sex: https://ourworldindata.org/gender-ratio; age: http://data.un.org/Data.aspx?d=POP&f=tableCode%3A22; education: https://ourworldindata.org/global-education; marital status: https://ourworldindata.org/marriages-and-divorces).
To minimize misclassification of text-based responses to the cognitive reflection test (CRT) and the attention check, we used multiple steps of data cleaning using REGEX (regular expressions) as fully detailed in (ICSMP official data.Rmd; osf.io/dwpng) located in the folder named Code. First, we coded the predefined numerical and text values as correct (in the case of CRT, also the values predefined as intuitive). Then, iteratively, we screened the remaining responses and, using REGEX, updated answers. Remaining responses were recoded as incorrect.
Acknowledgements
The ICSMP consortium would like to acknowledge the additional contributions of numerous friends and collaborators in translating and sharing the COVIDiSTRESS survey, even if contributions were small or the person did not wish their name included as a member of the consortium.
Author contributions
Conceptualization: F.A. Data curation: F.A., T.P., W.M.S. and G.R. Formal analysis: F.A., F.C.A., T.P., T.E. and J.C.R. Investigation: F.A. Methodology: F.A. Project administration: F.A. Resources: F.A. Software: F.A. and T.P. Supervision: F.A. Validation: F.A. and R.M.R. Visualization: F.A., F.C.A., T.E., H.F.C., L.C., C.L. and J.C.R. Writing - original draft: F.A., B.G., R.M.R. and P.S. Writing - review & editing: ICSMP Collaborators.
Funding
Open Access funding enabled and organized by Projekt DEAL.
Code availability
All raw and cleaned data—as well as the R-code—used for standardising national-teams data, merging, and cleaning them are available at 10.17605/osf.io/tfsza56.
Competing interests
André Krouwel (ownership and stocks in Kieskompas BV, a data collector in this project). No payment was received by the author. No other authors reported a competing interest.
Footnotes
Publisher’s note Springer Nature remains neutral with regard to jurisdictional claims in published maps and institutional affiliations.
References
- 1.Cucinotta D, Vanelli M. Who declares COVID-19 a pandemic. Acta Biomed. 2020;91:157. doi: 10.23750/abm.v91i1.9397. [DOI] [PMC free article] [PubMed] [Google Scholar]
- 2.Nicola, M. et al. The socio-economic implications of the coronavirus and COVID-19 pandemic: A review. Int. J. Surg. (2020). [DOI] [PMC free article] [PubMed]
- 3.Holmes, E. A. et al. Multidisciplinary research priorities for the COVID-19 pandemic: A call for action for mental health science. The Lancet Psychiatry (2020). [DOI] [PMC free article] [PubMed]
- 4.Adam D, et al. Covid’s true death toll: Much higher than official records. Nature. 2022;603:562–562. doi: 10.1038/d41586-022-00708-0. [DOI] [PubMed] [Google Scholar]
- 5.Yamada Y, et al. COVIDiSTRESS global survey dataset on psychological and behavioural consequences of the COVID-19 outbreak. Sci. Data. 2021;8:1–23. doi: 10.1038/s41597-020-00784-9. [DOI] [PMC free article] [PubMed] [Google Scholar]
- 6.John A, et al. The impact of the COVID-19 pandemic on self-harm and suicidal behaviour: A living systematic review. F1000Research. 2020;9:1097. doi: 10.12688/f1000research.25522.1. [DOI] [PMC free article] [PubMed] [Google Scholar]
- 7.Serafini G, et al. The psychological impact of COVID-19 on the mental health in the general population. QJM. 2020;113:531–537. doi: 10.1093/qjmed/hcaa201. [DOI] [PMC free article] [PubMed] [Google Scholar]
- 8.Taylor, S. The psychology of pandemics: Preparing for the next global outbreak of infectious disease (Cambridge Scholars Publishing, Newcastle upon Tyne, 2019).
- 9.Haug N, et al. Ranking the effectiveness of worldwide COVID-19 government interventions. Nat. Hum. Behav. 2020;4:1303–1312. doi: 10.1038/s41562-020-01009-0. [DOI] [PubMed] [Google Scholar]
- 10.Van Bavel JJ, et al. Using social and behavioural science to support COVID-19 pandemic response. Nature Human Behaviour. 2020;4:460–471. doi: 10.1038/s41562-020-0884-z. [DOI] [PubMed] [Google Scholar]
- 11.Van Bavel JJ, et al. National identity predicts public health support during a global pandemic. Nature Communications. 2022;13:517. doi: 10.1038/s41467-021-27668-9. [DOI] [PMC free article] [PubMed] [Google Scholar]
- 12.Pavlović, T. et al. Predicting attitudinal and behavioral responses to COVID-19 pandemic using machine learning. PNAS Nexus1, 10.1093/pnasnexus/pgac093 (2022). [DOI] [PMC free article] [PubMed]
- 13.Sternisko, A., Cichocka, A., Cislak, A. & Van Bavel, J. J. National narcissism predicts the belief in and the dissemination of conspiracy theories during the COVID-19 pandemic: Evidence from 56 countries. Personality and Social Psychology Bulletin 01461672211054947 (2021). [DOI] [PMC free article] [PubMed]
- 14.Cichocka, A. et al. Globalization is associated with lower levels of national narcissism: Evidence from 56 countries. Social Psychological and Personality Science (2022).
- 15.Nurse MS, Ross RM, Isler O, Van Rooy D. Analytic thinking predicts accuracy ratings and willingness to share covid-19 misinformation in Australia. Memory & Cognition. 2022;50:425–434. doi: 10.3758/s13421-021-01219-5. [DOI] [PMC free article] [PubMed] [Google Scholar]
- 16.McHugh, C. et al. Moral identity predicts adherence to COVID-19 mitigation procedures depending on political ideology: A comparison between the USA and New Zealand. Political Psychology. Ahead of print (2022). [DOI] [PMC free article] [PubMed]
- 17.Maglić, M., Pavlović, T. & Franc, R. Analytic thinking and political orientation in the corona crisis. Frontiers in psychology 2711 (2021). [DOI] [PMC free article] [PubMed]
- 18.Gkinopoulos T, Elbæk CT, Mitkidis P. Morality in the echo chamber: The relationship between belief in COVID-19 conspiracy theories and public health support and the mediating role of moral identity and morality-as-cooperation across 67 countries. PLOS ONE. 2022;17:e0273172. doi: 10.1371/journal.pone.0273172. [DOI] [PMC free article] [PubMed] [Google Scholar]
- 19.Borau S, Couprie H, Hopfensitz A. The prosociality of married people: Evidence from a large multinational sample. Journal of Economic Psychology. 2022;92:102545. doi: 10.1016/j.joep.2022.102545. [DOI] [PMC free article] [PubMed] [Google Scholar]
- 20.Bonetto E, Delouvée S, Mahfud Y, Adam-Troian J. National identification, a social cure for COVID-19? Evidence from 67 countries. International Journal of Social Psychiatry. 2022;68:1116–1126. doi: 10.1177/00207640211020036. [DOI] [PubMed] [Google Scholar]
- 21.Cutler J, Nitschke JP, Lamm C, Lockwood PL. Older adults across the globe exhibit increased prosocial behavior but also greater in-group preferences. Nature Aging. 2021;1:880–888. doi: 10.1038/s43587-021-00118-3. [DOI] [PMC free article] [PubMed] [Google Scholar]
- 22.Gualda, E. et al. Social distancing and COVID-19: Factors associated with compliance with social distancing norms in Spain. Frontiers in Psychology12 (2021). [DOI] [PMC free article] [PubMed]
- 23.Pan, Y. et al. Psychological well-being is associated with prosociality during the COVID-19 pandemic: A comparison of Swedish and Chinese samples. Emotion. Advance online publication at 10.1037/emo0001121 (2022). [DOI] [PubMed]
- 24.Wilkinson MD, et al. The fair guiding principles for scientific data management and stewardship. Scientific data. 2016;3:1–9. doi: 10.1038/sdata.2016.18. [DOI] [PMC free article] [PubMed] [Google Scholar]
- 25.Parsons S, et al. A community-sourced glossary of open scholarship terms. Nature human behaviour. 2022;6:312–318. doi: 10.1038/s41562-021-01269-4. [DOI] [PubMed] [Google Scholar]
- 26.Pownall M, et al. Embedding open and reproducible science into teaching: A bank of lesson plans and resources. Scholarship of Teaching and Learning in Psychology. 2021 doi: 10.1037/stl0000307. [DOI] [Google Scholar]
- 27.Pownall, M. et al. Teaching Open and Reproducible Scholarship: A Critical Review of the Evidence Base for Current Pedagogical Methods and their Outcomes. Preprint at 10.31222/osf.io/9e526 (2022). [DOI] [PMC free article] [PubMed]
- 28.Azevedo, F. et al. Introducing a framework for open and reproducible research training (FORRT). OSF Preprints. Preprint at 10.31219/osf.io/bnh7p (2019).
- 29.Jong J, et al. Traumatic life experiences and religiosity in eight countries. Scientific data. 2020;7:1–8. doi: 10.1038/s41597-020-0482-y. [DOI] [PMC free article] [PubMed] [Google Scholar]
- 30.Azevedo, F. et al. An international investigation of the psychology of COVID-19. Behavioural and Social Sciences at Nature Portfolio. Blog post at https://go.nature.com/3JtupRd (2021).
- 31.Postmes T, Haslam SA, Jans L. A single-item measure of social identification: Reliability, validity, and utility. Br. J. Soc. Psychol. 2013;52:597–617. doi: 10.1111/bjso.12006. [DOI] [PubMed] [Google Scholar]
- 32.de Zavala AG, Cichocka A, Eidelson R, Jayawickreme N. Collective narcissism and its social consequences. Journal of Personality and Social Psychology. 2009;97:1074–1096. doi: 10.1037/a0016904. [DOI] [PubMed] [Google Scholar]
- 33.Malone GP, Pillow DR, Osman A. The general belongingness scale (GBS): Assessing achieved belongingness. Personality and Individual Differences. 2012;52:311–316. doi: 10.1016/j.paid.2011.10.027. [DOI] [Google Scholar]
- 34.Jost JT. The end of the end of ideology. American Psychologist. 2006;61:651–670. doi: 10.1037/0003-066X.61.7.651. [DOI] [PubMed] [Google Scholar]
- 35.Azevedo F, Jost JT, Rothmund T, Sterling J. Neoliberal ideology and the justification of inequality in capitalist societies: Why social and economic dimensions of ideology are intertwined. Journal of Social Issues. 2019;75:49–88. doi: 10.1111/josi.12310. [DOI] [Google Scholar]
- 36.Azevedo F, Jost JT, Rothmund T. “making america great again”: System justification in the us presidential election of 2016. Translational Issues in Psychological Science. 2017;3:231. doi: 10.1037/tps0000122. [DOI] [Google Scholar]
- 37.Azevedo F, Jost JT. The ideological basis of antiscientific attitudes: Effects of authoritarianism, conservatism, religiosity, social dominance, and system justification. Group Processes & Intergroup Relations. 2021;24:518–549. doi: 10.1177/1368430221990104. [DOI] [Google Scholar]
- 38.Imhoff R, et al. Conspiracy mentality and political orientation across 26 countries. Nature Human Behaviour. 2022;6:392–403. doi: 10.1038/s41562-021-01258-7. [DOI] [PubMed] [Google Scholar]
- 39.Van der Linden S, Panagopoulos C, Azevedo F, Jost JT. The paranoid style in american politics revisited: An ideological asymmetry in conspiratorial thinking. Political Psychology. 2021;42:23–51. doi: 10.1111/pops.12681. [DOI] [Google Scholar]
- 40.Azevedo, F. & Bolesta, D. Measuring ideology: Current practices, consequences, and recommendations. Manuscript in preparation (forthcoming). Preprint at https://measuring.ideology.flavioazevedo.com.
- 41.Azevedo, F., Marques, T. & Micheli, L. In pursuit of racial equality: Identifying the determinants of support for the black lives matter movement with a systematic review and multiple meta-analyses. Perspectives on Politics 1–23 (2022).
- 42.Azevedo, F., Bolesta, D. & Micheli, L. Does stereotype threat contribute to the political knowledge gender gap? a preregistered replication study of ihme and tausendpfund. Journal of Experimental Political Science (in press) (2018).
- 43.Pinquart M. Correlates of subjective health in older adults: a meta-analysis. Psychology and Aging. 2001;16:414–426. doi: 10.1037/0882-7974.16.3.414. [DOI] [PubMed] [Google Scholar]
- 44.Adler NE, Epel ES, Castellazzo G, Ickovics JR. Relationship of subjective and objective social status with psychological and physiological functioning: Preliminary data in healthy, white women. Health psychology. 2000;19:586. doi: 10.1037/0278-6133.19.6.586. [DOI] [PubMed] [Google Scholar]
- 45.Bjørnskov C. How comparable are the gallup world poll life satisfaction data? J. Happiness Stud. 2010;11:41–60. doi: 10.1007/s10902-008-9121-6. [DOI] [Google Scholar]
- 46.Sjåstad H. Short-sighted greed? focusing on the future promotes reputation-based generosity. Judgm. Decis. Mak. 2019;14:199–213. doi: 10.1017/S1930297500003430. [DOI] [Google Scholar]
- 47.Curry OS, Chesters MJ, Van Lissa CJ. Mapping morality with a compass: Testing the theory of ‘morality-as-cooperation’ with a new questionnaire. J. Res. Pers. 2019;78:106–124. doi: 10.1016/j.jrp.2018.10.008. [DOI] [Google Scholar]
- 48.Aquino K, Reed A., II The self-importance of moral identity. J. Pers. Soc. Psychol. 2002;83:1423. doi: 10.1037/0022-3514.83.6.1423. [DOI] [PubMed] [Google Scholar]
- 49.Waytz A, Iyer R, Young L, Haidt J, Graham J. Ideological differences in the expanse of the moral circle. Nat. Commun. 2019;10:1–12. doi: 10.1038/s41467-019-12227-0. [DOI] [PMC free article] [PubMed] [Google Scholar]
- 50.Alfano M, et al. Development and validation of a multi-dimensional measure of intellectual humility. PloS ONE. 2017;12:e0182950. doi: 10.1371/journal.pone.0182950. [DOI] [PMC free article] [PubMed] [Google Scholar]
- 51.Scheier MF, Carver CS, Bridges MW. Distinguishing optimism from neuroticism (and trait anxiety, self-mastery, and self-esteem): A reevaluation of the life orientation test. J. Pers. Soc. Psychol. 1994;67:1063. doi: 10.1037/0022-3514.67.6.1063. [DOI] [PubMed] [Google Scholar]
- 52.Robins RW, Hendin HM, Trzesniewski KH. Measuring global self-esteem: Construct validation of a single-item measure and the rosenberg self-esteem scale. Personality and Social Psychology Bulletin. 2001;27:151–161. doi: 10.1177/0146167201272002. [DOI] [Google Scholar]
- 53.Tangney JP, Baumeister RF, Boone AL. High self-control predicts good adjustment, less pathology, better grades, and interpersonal success. J. Pers. 2004;72:271–324. doi: 10.1111/j.0022-3506.2004.00263.x. [DOI] [PubMed] [Google Scholar]
- 54.Back MD, et al. Narcissistic admiration and rivalry: Disentangling the bright and dark sides of narcissism. J. Pers. Soc. Psychol. 2013;105:1013. doi: 10.1037/a0034431. [DOI] [PubMed] [Google Scholar]
- 55.Primi C, Morsanyi K, Chiesi F, Donati MA, Hamilton J. The development and testing of a new version of the cognitive reflection test applying item response theory (IRT) Journal of Behavioral Decision Making. 2016;29:453–469. doi: 10.1002/bdm.1883. [DOI] [Google Scholar]
- 56.Azevedo F, 2022. Social amp; Moral Psychology of COVID-19. Open Science Framework. [DOI]
- 57.Azevedo F, et al. Social and moral psychology of covid-19 across 69 countries. 2022 doi: 10.31234/osf.io/a3562. [DOI] [PMC free article] [PubMed] [Google Scholar]
- 58.Graul, C. leafletR: Interactive Web-Maps Based on the Leaflet JavaScript Library. R package version 0.4-0 (2016).
- 59.Wickham, H. ggplot2: Elegant Graphics for Data Analysis (Springer-Verlag New York, 2016).
- 60.Ghai S. It’s time to reimagine sample diversity and retire the weird dichotomy. Nature Human Behaviour. 2021;5:971–972. doi: 10.1038/s41562-021-01175-9. [DOI] [PubMed] [Google Scholar]
- 61.Kretzschmar A, Gignac GE. At what sample size do latent variable correlations stabilize? Journal of Research in Personality. 2019;80:17–22. doi: 10.1016/j.jrp.2019.03.007. [DOI] [Google Scholar]
- 62.R Core Team. R: A Language and Environment for Statistical Computing. R Foundation for Statistical Computing, Vienna, Austria (2019).
- 63.Wickham, H. & Hester, J. readr: Read Rectangular Text Data. R package version 1.4.0 (2020).
- 64.Wickham, H. & Miller, E. haven: Import and Export SPSS, Stata and SAS Files. R package version 2.4.1 (2021).
- 65.Wickham, H. & Bryan, J. readxl: Read Excel Files. R package version 1.3.1 (2019).
- 66.Wickham, H., François, R., Henry, L. & Müller, K. dplyr: A Grammar of Data Manipulation. R package version 1.0.6 (2021).
- 67.Revelle, W. psych: Procedures for Psychological, Psychometric, and Personality Research. R package version 2.1.6 (2021).
- 68.Cheng, J., Sievert, C., Chang, W., Xie, Y. & Allen, J. htmltools: Tools for HTML. R package version 0.5.1 (2021).
- 69.Xie, Y. mime: Map Filenames to MIME Types. R package version 0.11 (2021).
- 70.Xie, Y. xfun: Supporting Functions for Packages Maintained by Yihui Xie. R package version 0.25 (2021).
- 71.Larmarange, J. labelled: Manipulating Labelled Data. R package version 2.9.0 (2021).
- 72.Lüdecke, D. sjlabelled: Labelled Data Utility Functions. R package version 1.1.6 (2020).
- 73.Arslan, R. codebook: Automatic Codebooks from Metadata Encoded in Dataset Attributes. R package version 0.9.2 (2020).
- 74.Spinu, V., Grolemund, G. & Wickham, H. lubridate: Make Dealing with Dates a Little Easier. R package version 1.7.10 (2021).
Associated Data
This section collects any data citations, data availability statements, or supplementary materials included in this article.
Data Citations
- Azevedo F, 2022. Social amp; Moral Psychology of COVID-19. Open Science Framework. [DOI]
Data Availability Statement
All raw and cleaned data—as well as the R-code—used for standardising national-teams data, merging, and cleaning them are available at 10.17605/osf.io/tfsza56.


