Abstract
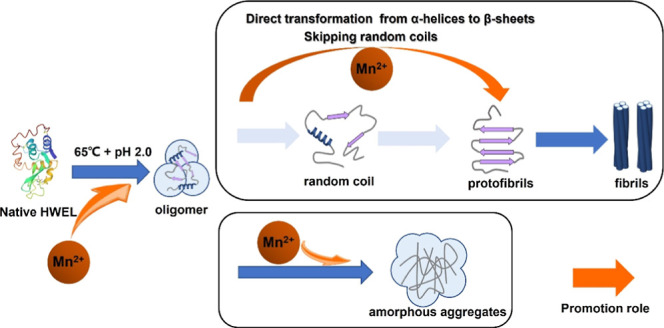
As manganese ions (Mn2+) are identified as an environmental risk factor for neurodegenerative diseases, uncovering their action mechanism on protein amyloid fibril formation is crucial for related disease treatments. Herein, we performed a combined study of Raman spectroscopy, atomic force microscopy (AFM), thioflavin T (ThT) fluorescence, and UV–vis absorption spectroscopy assays, in which the distinctive effect of Mn2+ on the amyloid fibrillation kinetics of hen egg white-lysozyme (HEWL) was clarified at the molecular level. With thermal and acid treatments, the unfolding of protein tertiary structures is efficiently accelerated by Mn2+ to form oligomers, as indicated by two Raman markers for the Trp residues on protein side chains: the FWHM at 759 cm–1 and the I1340/I1360 ratio. Meanwhile, the inconsistent evolutionary kinetics of the two indicators, as well as AFM images and UV–vis absorption spectroscopy assays, validate the tendency of Mn2+ toward the formation of amorphous aggregates instead of amyloid fibrils. Moreover, Mn2+ plays an accelerator role in the secondary structure transition from α-helix to organized β-sheet structures, as indicated by the N–Cα-C intensity at 933 cm–1 and the amide I position of Raman spectroscopy and ThT fluorescence assays. Notably, the more significant promotion effect of Mn2+ on the formation of amorphous aggregates provides credible clues to understand the fact that excess exposure to manganese is associated with neurological diseases.
1. Introduction
Amyloid fibrillation is a special self-assembly of proteins to form morphologically β-sheet-rich fibrillar aggregates, which are usually thought to have various toxic effects in cells.1,2 The amyloid formation and lack of proper cellular mechanisms for the removal of the fibrils are closely associated with neurodegenerative diseases like Parkinson’s (PD) and Alzheimer’s (AD).3 Thus, it is important to understand the corresponding dynamic mechanisms, and hereby some investigations have been performed in model systems.4−7
Among all in vitro model proteins, hen egg white-lysozyme (HEWL) has been most extensively utilized for the study of amyloid fibrils formation,8 since it is associated with hereditary systemic amyloidosis in humans. Rich structural information and the multiple conditions for successful induction/inhibition of HEWL aggregation in vitro were reported,8,9 and the molecular mechanism of amyloid formation in the pH 6.5 aqueous solution was analyzed using Raman spectroscopy and differential scanning calorimetry.10 Because HEWL in the nature state is resistant to denaturation, previous studies on the denaturation of HEWL were mainly carried out in unnatural conditions, like acidic and thermal treatment.11,12 Moreover, the promotion or inhibition effects of ethanol,13 guanidine hydrochloride,14 alkaline pH,15 sunset yellow,16 and succinimide,17 even including silver nanoparticles,18 were also discussed on amyloid fibrils formation. Besides, the specific roles of transition metal ions in protein denaturation are well-known as “Hofmeister series” according to the sequence of their action strength.19,20 It is worth noting that the disparate effects of Zn2+,21,22 Cu2+,23,24 Al3+,25 and Mn2+26,27 on denaturation of various proteins were reported. For example, a double-edged effect of Al3+ ions on the HEWL amyloid fibrillation kinetics has been revealed recently25 that Al3+ ions accelerate the conformational transformations from α-helices to organized β-sheets, in addition to postponing α-helix degradation. Therefore, revealing the specific influence of each transition-metal ion on the overall denaturation kinetics of HEWL is valuable.
Manganese is an important trace metal element for the human body28 and is widely distributed in the environment.29 Manganese ions (Mn2+) have special biochemical and physiological functions as they are essential for the activity of various enzymes (e.g., arginase and glutamine synthase).30 However, it has been reported that elevated Mn2+ concentrations may result in aberrant neurological symptoms.31,32 Hence, Mn2+ is identified as an environmental risk factor for neurodegenerative diseases. Very recently, the influence of Mn2+ on neurological disorders has been reviewed by Kim et al.,33 where some evidence has been summarized from previous epidemiological and preclinical studies. An important conclusion was proposed that excess exposure to manganese is associated with neurological diseases.34 In terms of protein denaturation induced by Mn2+ and its derivatives, only a few studies have been carried out. Using thioflavin T (ThT) and anilinonaphthalene-8-sulfonic acid (ANS) fluorescence assays together with circular dichroism spectroscopy and transmission electron microscopy, Bahramikia and Yazdanparast found the inhibitory and disruptive effects of two salen–manganese complexes with aromatic structures, namely EUK-8 and EUK-134, against the HEWL fibrillation.35 Xu et al. validated that Mn2+ facilitates α-Synuclein (α-Syn) phase transition to accelerate the formation of α-Syn amyloid aggregates based on a combination of fluorescence recovery after photobleaching assay, ThT fluorescence, and sedimentation-based assays.36 Apparently, the action mechanism of Mn2+ ions in amyloid fibril formation of the HEWL-like protein systems is still unknown, especially on the conformational structure transformation. This gives us a motivation to study the specific influence of Mn2+ on the amyloid aggregation kinetics of HEWL at the molecular level.
Notably, the influence of Mn2+ in a moderate concentration on the HEWL amyloid fibrils formation is not obvious, as described below (Section 3.7). Considering that the amyloid fibrillation of HEWL in thermal/acidic conditions (65 °C and pH 2.0) has been well studied,37,38 we hereby prefer to clarify the synergistic interaction of Mn2+ ions and acids in each stage of the HEWL amyloid fibril formation kinetics. With thermal/acid treatments, the morphology and conformational structure transformation of HEWL in aqueous solution are investigated and compared in the absence and presence of Mn2+, with a combination of Raman spectroscopy, atomic force microscopy (AFM), ThT fluorescence, and UV–vis absorption spectroscopy assays. From these measurements, the transformation kinetics of the protein secondary and tertiary structures in the amyloid fibril formation is plainly revealed. Through comparing the differences in the absence and presence of Mn2+, the specific role of Mn2+ in the molecular structure transformation and aggregate morphology formation of HEWL is highlighted.
2. Experimental Section
2.1. Protein Solutions
HEWL was purchased from Sangon Biotech (Shanghai) Co. Ltd. and used without further purification. ThT dye was purchased from Sigma-Aldrich, while the other chemicals in reagent grade or better were ordered from Sinopharm Chemical Reagent Co. Ltd. In experiments, three different types of solutions were prepared in which the HEWL concentration was set to be 20 mg/mL prior to incubation. One was mixed with MnCl2·4H2O with a 1:1 molar ratio of metal ions to HEWL, with a weakly acidic condition (pH 5.0–6.0) due to the nature of the protein itself. The other two solutions were adjusted to pH = 2.0 with hydrochloric acid, one of which was mixed with Mn2+ ions (the molar ratio of metal to HWEL was 1:1) and the other without Mn2+. Then, the solutions in sealed glass vials (5 mL) were incubated at 65 °C without agitation. At various incubation times, aliquots of the incubated protein solution were taken from the vials and centrifuged at 12,000g for 20 min to separate the soluble fraction from the gelatinous aggregates. The residual supernatant was directly used for Raman spectroscopy, ThT fluorescence assays, atomic force microscopy (AFM) imaging, and absorption spectroscopy measurements.
Apparently, the influence of Mn2+ itself on protein denaturation was expected to be revealed from the kinetic measurements of the first sample. Moreover, by comparing the differences between the two latter samples in the absence or presence of Mn2+, we expected to validate the synergistic interaction of Mn2+ ions and acids.
2.2. Spontaneous Raman Spectroscopy
Spontaneous Raman spectroscopy was performed as described elsewhere.39,40 Briefly, a continuous-wave laser at 532 nm (Verdi V5, Coherent) was the excitation light source. Backscattered Raman light from the supernatants in a quartz cuvette (10 mm × 10 mm) was collected, dispersed, and recorded by a high-resolution monochromator (Triple-Pro, Acton Research) coupled with a liquid-nitrogen-cooled CCD camera (Spec-10:100B, Princeton Instruments). The acquisition time for each measurement was 1 min, and the average of 10 acquisitions was used to achieve better signal-to-noise ratios in Raman spectra. Additionally, the Raman spectra of water were recorded in identical conditions. After subtracting the background spectra of the solvent, the revised Raman spectra were reported and analyzed, providing sufficiently reliable data for kinetic analyses. The resolution of the present Raman spectra was ∼1 cm–1 in the frequency range of 200–3000 cm–1, and the wavelength was calibrated using standard spectral lines from a mercury lamp.
2.3. ThT Fluorescence Assay
At each incubation time, 200 μL of the supernatant was mixed into 4.8 mL of ThT solution at the concentration of 12 mg/L. Notably, this ThT concentration was approximately 10 times the critical micellar concentration (∼4 × 10⁻⁶ mol/L). However, such a high concentration had negligible influence on its indicator role as a “gold standard” for cross β-sheet-rich structures, as previously reported.17,25 With photoexcitation at 409 nm, steady-state fluorescence emission spectra of the mixed solutions were recorded with a fiber optic spectrometer (AvaSpec-ULS2048, Avantes) in the wavelength range of 400–800 nm. The excitation laser power was as low as 20 mW to ensure no saturation effect.
2.4. AFM Imaging
At several specific incubation times, the supernatant was diluted 10 times with Milli-Q water and dropped onto freshly cleaved mica. Fifteen minutes later, the sample was rinsed off three times with deionized water. After naturally drying at room temperature, the sample was stored in a desiccator, and then AFM imaging measurements were performed with a Dimension Icon scanning probe microscope (Muimodle8, Bruker) in tapping mode using a 5 μm × 5 μm scanner. The AFM height images were reconstructed using the NanoScope v9.2 software.
2.5. UV–Vis Absorption Spectroscopy Assay
Steady-state UV–vis absorption spectra of the supernatant were measured using a commercial spectrometer (UV-2550, Shimadzu) in the wavelength range of 220–500 nm at various incubation times. The supernatant was diluted twenty times before measurements to avoid exceeding the detection limit due to high concentrations. A weak shoulder band extending to 400 nm gradually appeared and monotonically increased during incubation, which is attributed to the soluble aggregates formed in the protein denaturation process. Accordingly, we used the absorbance at 350 nm to directly represent the soluble aggregate concentration, and then the kinetic assays were done. Notably, the present absorption assay is different from turbidity assays commonly used in the field of protein pharmaceuticals,41,42 although they are both derived from UV–vis absorption spectroscopy. In the turbidity assays, the spectra are directly measured for protein solutions without centrifugation, so the absorbance change is straightforwardly used for determining protein content.42−44 In contrast, the absorbance at 350 nm of the supernatant is proposed to be a new specific indicator for the soluble aggregates.
3. Result and Discussion
3.1. Morphologies of HEWL Aggregates in Amyloid Fibrillation
Figure 1 shows the AFM height images of HEWL at several specific incubation times, in the absence and presence of Mn2+. Apparently, the morphologies of proteins are significantly changed during the denaturation process. In the absence of Mn2+, spherical oligomers are clearly formed after incubation for 24 h (Figure 1a) and then gradually fuse and assemble into protofibrils (Figure 1b) and mature fibrils (Figure 1c), which is consistent with previous conclusions on the HEWL amyloid fibrillation in similar conditions.14 In contrast, short protofibril-like aggregates are formed 24 h later when adding Mn2+ ions, and much more protofibrils are observed after incubation for 42 h than the case without the metal ions, as shown in Figure 1d,e. This comparison provides direct evidence for the promotor role of Mn2+ in the amyloid fibrils formation of HEWL.
Figure 1.
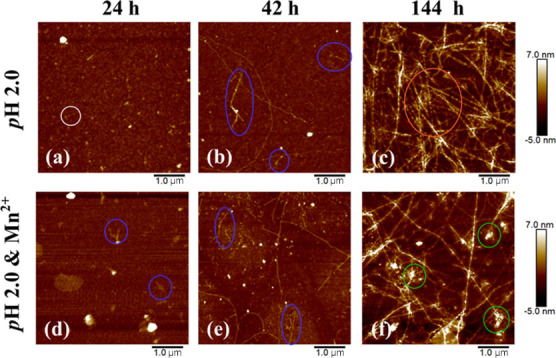
AFM height images of HEWL with thermal and acid treatments for 24 (a), 42 (b), and 144 h (c), and in thermal/acid/Mn2+ conditions for 24 (d), 42 (e), and 144 h (f), where white circles label oligomers, blue represents protofibrils, orange denotes mature fibers, and green denotes amorphous aggregates.
To our surprise, although protein denaturation definitely occurs in the two conditions, the mature fibrils are overwhelming 144 h later in the absence of Mn2+ ions, while a portion of protein aggregates maintain amorphous structures with the action of Mn2+ in addition to fibers (Figure 1f). Consequently, we have reason to believe that Mn2+ can accelerate the formation of oligomers and meanwhile significantly promote the transformation from oligomers to amorphous aggregates. Assuming that the amorphous aggregates have similar toxicity to oligomers, the addition of Mn2+ ions might increase toxicity to cells like small oligomers, according to the fact that the oligomers can efficiently damage membrane integrity, leading to cellular stress and/or apoptosis.45−48
3.2. Raman Spectra of HEWL in the Native State and the Denaturation Products
Raman spectroscopy has been successfully applied to monitor changes in protein secondary and tertiary structures in real time, where some well-assigned vibrational bands can readily indicate the transformation of protein secondary and tertiary structures.49−51Figure 2 shows the Raman spectra of HEWL in the native state and the denaturation products after incubation for 144 h, in which four main regions involving five spectral indicators (noted with gray boxes) are exhibited. Considering the decreasing protein concentration in the supernatant due to the formation of insoluble aggregates, a direct comparison of band intensities is difficult to convince. Notably, the spectral intensity of the Phe ring at 1003 cm–1 is insensitive to the microenvironment around protein and exclusively depends on the protein concentration;52 thus, the band intensities in Figure 2 are all normalized with the Phe peak intensity.
Figure 2.
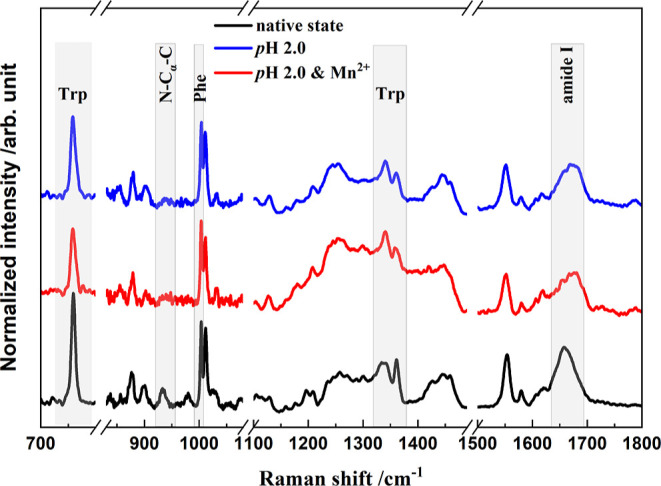
Normalized Raman spectra of HEWL in the native state and the denaturation products in thermal and acidic conditions (65 °C and pH 2.0) in the absence and presence of Mn2+ ions. Gray boxes indicate the Raman indicators for protein structures, as described in the text.
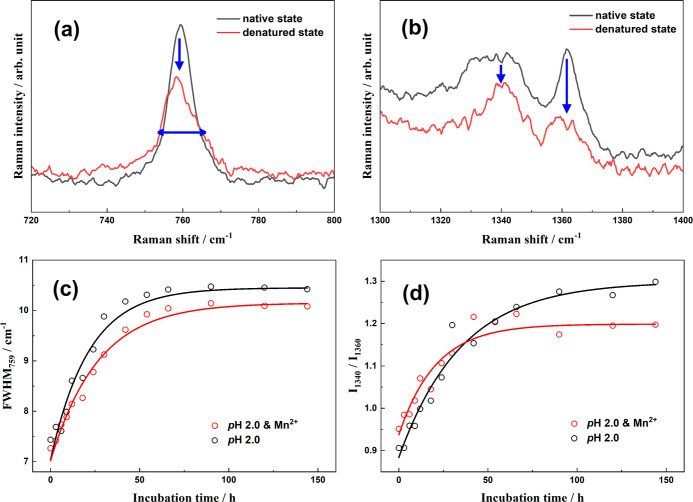
It is well known that the peak at 759 cm–1 is assigned to the in-phase symmetric breathing vibration of benzene and pyrrole (indole ring) of tryptophan (Trp) residues on protein side chains, and its full width at half maximum (FWHM) depends on the conformational distributions of Trp residues in the surrounding.53 Moreover, two vibrational peaks of Trp indole ring (so-called “W7”) located at 1340 and 1360 cm–1 are attributed to the Fermi resonance. Notably, their relative intensity, I1340/I1360, is closely related to the hydrophobicity of the Trp residue microenvironment.54 Thus, the two spectral markers are commonly used to indicate the tertiary structure of HEWL during denaturation processes.53,55 For the HEWL secondary structure changes in amyloid fibrillation, two spectral indicators are widely utilized: (1) the peak at 933 cm–1 is exclusively contributed by the N–Cα–C stretching vibration of the protein α-helix backbone56,57 so that its intensity is indicative of the α-helical populations; (2) the wide peak covering 1640 to 1680 cm–1 is well-known as the “amide I” band and associates with various secondary structures of proteins.37,58
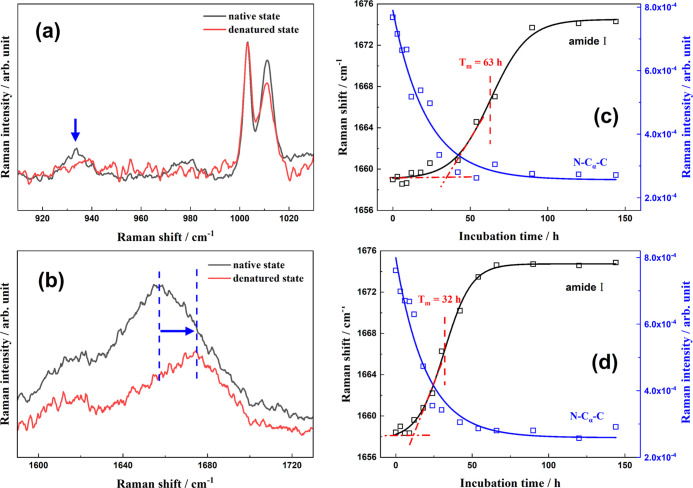
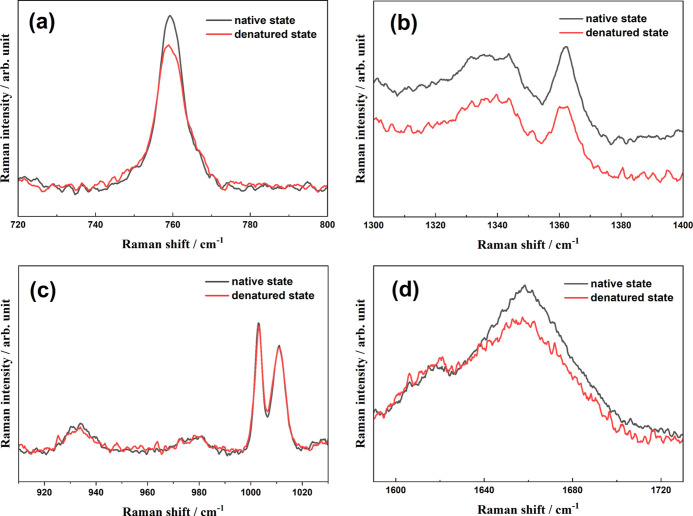
The four Raman spectral indicators all exhibit obvious variations after denaturation, as shown in Figure 2. The FWHM at 759 cm–1 is increased from 7.3 cm–1 in the native state to 10.4 cm–1 in the mature fibrils formed in thermal and acidic conditions, or 10.1 cm–1 in the denaturation products with thermal/acid/Mn2+ treatments (Figure 3a). This broadening indicates the diversification of the Trp conformational distribution in protein aggregates and validates the unfolding of the HEWL tertiary structures. Similarly, there is an obvious change in the I1340/I1360 ratio after incubation. The peak intensity at 1340 cm–1 is slightly lower than that of 1360 cm–1 in the native state (I1340/I1360 < 1), while the ratio is dramatically increased to more than 1.0 in the denaturation products, regardless of the existence of the metal ions. Thus, the local environments around indole rings of Trp side chains become more hydrophilic with conformational changes in the amyloid fibrillation process. Moreover, the significantly decreased intensity of the N–Cα–C band at 933 cm–1 after incubation (Figure 4a) undoubtedly affirms the complete disruption of protein α-helical structures. The peak position of the amide I band exhibits a visible blue shift in the HEWL amyloid fibrillation from 1658 to 1674 cm–1 (Figure 4b). Actually, various protein secondary structures have different peak positions in the amide I region of the Raman spectrum,57 for example, α-helical structure covers 1650–1660 cm–1,59 β-sheets are mainly located at 1671–1673 cm–1,14,60 β-turns and random structures are in 1670–1680 cm–1,50 extended PP II in protofibril is at 1667 cm–1,61 and β-intermolecular and intramolecular structures are located at 1669 and 1682 cm–1, respectively.62 Accordingly, the blue shift of the amide I peak position clearly validates the transformation from α-helix to β-sheets or random structures. Although these evidences are solid enough to affirm that the present two treatments can both efficiently induce proteins to proceed with conformational transformation, the specific role of Mn2+, in comparison to acid, is vague without time-dependent spectral measurements.
Figure 3.
(a) Raman spectra of the native HEWL (in black) and the denatured state (in red) in the range of 720–800 (a) and 1300–1400 cm–1 (b); incubation time-dependence curves of the FWHM at 759 cm–1 (c); I1340/I1360 ratio (d) in thermal/acid (in black) and thermal/acid/Mn2+ (in red) conditions.
Figure 4.
Raman spectra of the native HEWL (in black) and the denatured state (in red) in the range of 910–1030 (a) and 1590–1730 cm–1 (b); and incubation time-dependence curves of the intensity at 933 cm–1 (in blue) and the peak position of the amide I band (in black) with thermal/acid (c) and thermal/acid/Mn2+ (d) treatments.
3.3. Unfolding Kinetics of HEWL Tertiary Structures
To in-depth understand the influence of Mn2+ ions on the evolutionary kinetics of the HEWL tertiary structures, incubation time-dependent curves of the FWHM at 759 cm–1 and the I1340/I1360 ratio in thermal/acid and thermal/acid/Mn2+ conditions were measured and directly compared in Figure 3c,d.
To our surprise, two indicators show some opposite effects of Mn2+ on the corresponding evolutionary kinetics in thermal and acidic conditions, although all curves exhibit single exponential growth. In the presence of Mn2+, a slightly slower growth rate is observed in the FWHM at 759 cm–1, while that of the I1340/I1360 indicator becomes much faster. Interestingly, this paradoxical feature has never been observed in previously spectroscopic investigations with other metal ions like Zn2+,21 Cu2+,24 and Al3+,25 strongly indicating the unique role of Mn2+ in the unfolding kinetics of HEWL tertiary structures. Actually, this seemingly contradictory conclusion can be explained in terms of product morphologies. As observed in the AFM images, Mn2+ ions play a promotor role for the oligomer formations, accelerating the unfolding of HEWL tertiary structures, as indicated by the I1340/I1360 ratio. However, Mn2+ ions prefer to induce protein transformation into amorphous aggregates, as mentioned above. Along this incomplete amyloid fibril formation process, the conformational distributions of Trp residues are confined to some extent, leading to a slower rate of the FWHM marker and a smaller average value in the denaturation products (Figure 3d).
Moreover, as shown in Figure 3c, the peak width in the denaturation products with the action of Mn2+ is narrower than that without the metal ion, indicating that the average conformational distribution of Trp residues on protein side chains is relatively regulated in Mn2+-induced aggregates. On the other hand, the I1340/I1360 ratio is smaller after long-time incubation with the addition of Mn2+ (Figure 3d), indicative of less hydrophilic microenvironments around indole rings of Trp side chains. These tendencies are in line with the fact that more aggregates with amorphous structures are formed with the action of Mn2+, causing incomplete exposure of Trp side chains.
3.4. Transformation Kinetics of HEWL Secondary Structures
In the amyloid fibril formation process, the most important conformational change for proteins is the transformation from α-helix to cross β-sheet-rich structures. Thus, the N–Cα–C intensity at 933 cm–1 and the amide I peak position are two perfect indicators for monitoring the transformation kinetics of HEWL secondary structures in real time. Figure 4 shows the magnified Raman spectra in corresponding wavenumber ranges and the incubation time-dependence curves of the corresponding two indicators with thermal/acid and thermal/acid/Mn2+ treatments.
In the absence
of metal ions (Figure 4c), the N–Cα–C intensity at 933 cm–1 rapidly decreases within the first 30 h, while the
time dependence of the amide I peak position exhibits a typical sigmoidal
curve,  , where Ii and If are the peak positions of the initial and
final states, respectively, Tm is the
transition midpoint time, and 2 × ΔT corresponds
to the transition interval. For the kinetics of the amide I indicator,
the lag phase lasts up to about 35 h, followed by a growth phase (35–90
h) and an equilibrium phase, and Tm is
determined to be 63 h. This is consistent with the previous measurement.14 According to the known fibrillation mechanism,63 soluble prefibrillar oligomers are formed and
aggregate to form a nucleus during the lag phase, and then, the nuclear
template protein assembles into fibrils. Notably, there is an obvious
lag between the α-helix depletion and the β-sheets formation,
indirectly confirming the hypothesis that α-helix prefers to
transform into statistical coils rather than directly into organized
β-sheets.37
In thermal/acid/Mn2+ conditions, the amide I peak position in the denaturation products is located at 1674 cm–1 as is without the metal ions. Nevertheless, the dynamic behavior becomes different to a certain extent. As shown in Figure 4d, the N–Cα–C intensity at 933 cm–1 almost exhausts within ∼30 h, and the decay rates in the absence and presence of the metal ions are approximately equal. It indicates that Mn2+ has an insignificant influence on the α-helix depletion of HEWL, or much less than the effect of acid. In comparison, with the addition of Mn2+ ions, the lag phase of fibrillation is significantly shortened to ∼10 h, and the growth phase mainly covers the period of 10–50 h with a Tm of 32 h (Figure 4d). Both the shorter lag phase and the faster transformation rate undoubtedly affirm the promotion effect of Mn2+ on the amyloid fibril formation of HEWL. In addition, it is worth noting that the growth phase ends at the time that exactly corresponds to the complete depletion of α-helix with the action of Mn2+, strongly suggesting that the consumption of α-helical structures and the β-sheets formation occur simultaneously. In other words, Mn2+ ions can efficiently accelerate the direct transformation from α-helices to β-sheets by skipping the formation of intermediate random coils. This effect is very similar to that of Al3+ ions,25 implying that the similar electrostatic effects of metal ions might be the essential reason.
To further exhibit the distribution change of different protein secondary structures, the Raman spectra in the amide I region at several representative incubation times are directly compared in Figure 5. Apparently, the dominant components of this band are varied during the overall amyloid fibrillation process, as the peak position and profile are constantly changing. The whole band is gradually broadened (0–66 h) and then becomes narrower (66–144 h).
Figure 5.
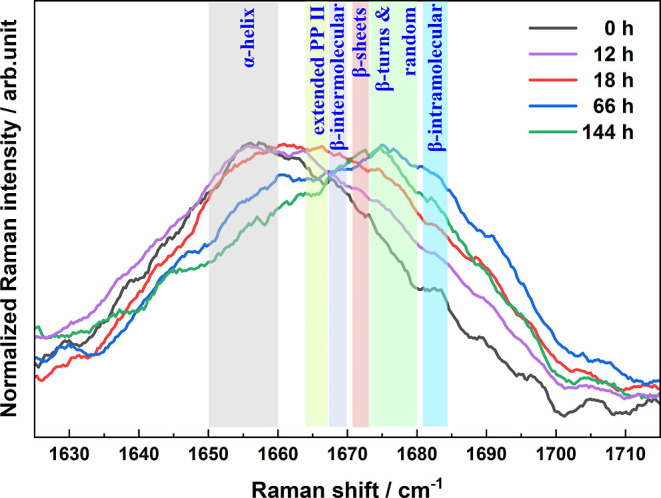
Normalized Raman spectra in the amide I region of HEWL with thermal/acid/Mn2+ treatments at several specific incubation times.
Specifically, the α-helical structures are predominant in the HEWL native state; hence, the band is relatively narrow, with the peak at 1658 cm–1. After incubation for 12–18 h, the intensity in the range of 1660–1670 cm–1 is significantly enhanced. According to the spectral assignments mentioned above, it indicates the massive formation of extended PP II structures in protofibrils, which agrees well with the oligomers and protofibrils observed in the AFM images. Following this process, the spectral intensity at over 1670 cm–1 is remarkably increased. Considering this frequency range is attributed to the contributions of β-turns, random structures, and β-intramolecular, the intensity enhancement implies their preferential formations in the denaturation kinetics. Notably, the amide I band has the widest profile at 66 h in the whole denaturation process of HEWL. With further incubation, the band width is obviously reduced due to the significant decrease of the intensities in the ranges of 1645–1665 and 1680–1700 cm–1 although the peak position almost does not change. This change is consistent with the dominant formation of β-sheets from the nuclear template protein. Notably, the final peak position after incubation is located at 1674 cm–1, which is slightly higher than that of β-sheet-structures (1671 cm–114,60). As observed in the AFM images, minor amorphous aggregates are formed with the Mn2+ induction in addition to the predominant fibers. Thus, the amide I position deviation might be caused by these amorphous aggregates, according to the fact that they commonly have relatively disordered secondary structures with spectral contributions in the region of higher than 1670 cm–1. Using the curve-fitting of the amide I band profile,64,65 we roughly estimated the relative contents of various protein secondary structures after incubation for 144 h in both thermal/acid and thermal/acid/Mn2+ conditions. As shown in Figure S1 and Table S1, the relative contents of major protein secondary structures are determined to be 9% for random coils, 16% for α-helix, 44% for β-sheet, and 31% for random structures with thermal/acid/Mn2+ treatment, while they are 10% for random coils, 17% for α-helix, 55% for β-sheet, and 18% for random structures in the absence of Mn2+. Although the accuracy of these population ratios is debatable, their trend clearly demonstrates that more amorphous aggregates with random structures are formed by the action of Mn2+. In sum, the amide I indicator provides more detailed information on protein secondary structure changes in protein amyloid fibrillation at the molecular level.
According to electrostatic interactions, the preferential binding sites of Mn2+ are located on the Asp52 and Glu35 residues on the HEWL surface. Although there are no molecular dynamics calculations for this system to date, we can propose a probable explanation for the Mn2+ effects on the basis of the above conclusions of the HEWL secondary structure transformation. Considering the Asp52 residue is mainly located on β-sheets, Mn2+ binding can naturally hinder the self-assembly of β-sheet fragments because of electrostatic repulsion, resulting in more amorphous aggregates with random structures.
3.5. ThT Fluorescence Assays
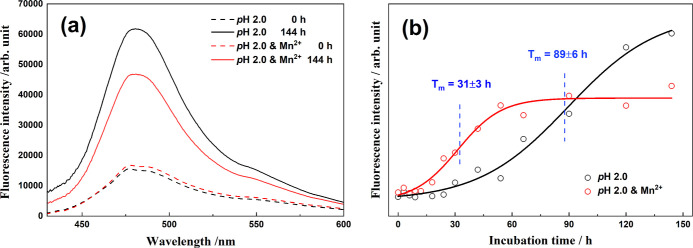
ThT is a widely used and sensitive indicator for detecting amyloid fibrils and is considered the “gold standard” for cross β-sheet-rich structures.25,65,66 Accordingly, we investigated the influence of Mn2+ on the formation kinetics of cross β-sheet-rich structures in HEWL amyloid fibril formation using the assays. Figure 6a displays the fluorescence emission spectra of the mixed solution of HEWL and ThT in the native state and the denaturation products after incubation for 144 h with thermal/acid and thermal/acid/Mn2+ treatments. The fluorescence intensity is enhanced by 3-fold and 2-fold in the absence and presence of Mn2+, respectively, in line with the formation of amyloid fibrils with cross β-sheet structures after incubation. Superficially, the reduced intensity of the denaturation products suggests an inhibition effect of the metal ions on the formation of cross β-sheet-rich structures, which agrees with Bahramikia and Yazdanparast ThT fluorescence experiments of two salen–manganese complexes against the HEWL fibrillation.35 This conclusion is contrary to those of the aforementioned Raman spectroscopy and AFM imaging.
Figure 6.
(a) ThT fluorescence spectra of HEWL and ThT mixed solutions in the native state and denaturation state after incubation for 144 h in thermal/acid and thermal/acid/Mn2+ conditions, with photoexcitation at 409 nm; (b) incubation time-dependent curves of the ThT fluorescence intensity at 479 nm.
As shown in Figure 6b, the incubation time-dependent curves of the ThT fluorescence intensity at 479 nm in two conditions both exhibit sigmoidal functions. Notably, due to the influence of Mn2+, the lag phase is dramatically shortened to a few hours, and the Tm value is determined to be 31 h in comparison to that of 89 h without the addition of Mn2+. Meanwhile, the growth rate is slightly faster. All these evidences solidly support the promotor role of Mn2+ in the HEWL amyloid fibrillation kinetics.
We know that, when ThT is added to protein solutions the surfaces of the protein cross-β structures with extended channel-like motifs are the ThT-binding sites. Accordingly, free rotations of bound benzylamine and benzothiazole rings of ThT are restricted in these channels, enhancing fluorescence intensities.67 In other words, the enhanced effect of ThT fluorescence intensity is significantly more sensitive to the concentration of cross-β-sheet structures rather than other species, such as soluble oligomers and amorphous aggregates, due to the lack of extended channel-like motifs on the surfaces of soluble oligomers and amorphous aggregates. As shown in the AFM image of Figure 1f, the relative proportion of amorphous aggregates is visibly increased after incubation in the presence of Mn2+. Therefore, the ThT fluorescence intensity was weaker under the influence of Mn2+. In addition, it is worth noting that the end time of the growth phase is ∼60 h in the presence of Mn2+ (Figure 6b), which approximately corresponds to the moment when the secondary structures of the denatured protein are most disorganized (the widest amide I band profile in Figure 5). This seeming coincidence provides extra evidence for our explanation.
3.6. UV–Vis Absorption Spectroscopy Assays
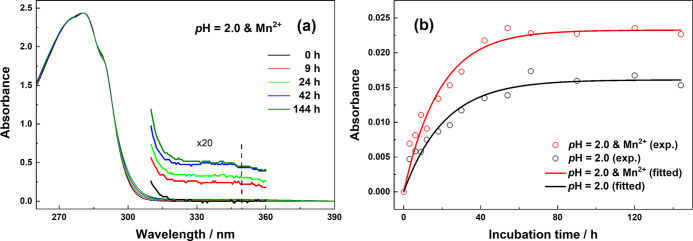
Amyloid fibrillation is a multi-stage kinetic process in which different types and sizes of aggregates are produced at each stage. Along with the protein aggregation process, enhanced intramolecular and intermolecular interactions, such as hydrogen bonding, may lead to a red shift in the absorption of chromophores such as Trp. As shown in Figure 7a, the absorption tail extending to 400 nm is monotonically increased during incubation. Considering that soluble aggregates might contribute to this absorption, its formation kinetics is shown in Figure 7b by the plot of the absorbance at 350 nm vs the incubation time.
Figure 7.
(a) UV–vis absorption spectra of the supernatant of HEWL aqueous solution with thermal/acid/Mn2+ treatments at several incubation times; (b) incubation time-dependence of the absorbance at 350 nm in the presence and absence of Mn2+.
Regardless of the existence of Mn2+ ions, the absorbance at 350 nm of protein solution increases rapidly with single exponential functions, as shown in Figure 7b. We notice that the equilibrium state can both be achieved at ∼60 h in two conditions. However, when Mn2+ is added, a faster growth rate and a higher absorbance in the final state are observed. Interestingly, the kinetics are almost identical to the curves of the Trp FWHM indicator in Figure 3c, reminding us to associate this absorbance indicator with the HEWL tertiary structures. Thus, the absorbance at 350 nm of the supernatant is proposed as a new specific indicator for determining soluble aggregates (especially oligomers). As deduced above, Mn2+ efficiently accelerates the oligomer formations in the early stage of the denaturation process and promotes the transformation to amorphous aggregates rather than amyloid fibrils. The present UV–vis absorption spectroscopy assays provide extra evidence for the conclusions.
3.7. Influence of Mn2+ Itself on HEWL Denaturation
As a supplement, Figure 8 shows the Raman spectra of HEWL solutions with thermal treatment in the presence of Mn2+ ions to exhibit the influence of the Mn2+ ion itself on the denaturation of HEWL without the interaction of acid. After incubation for 144 h, only slight changes are observed for the four spectral indicators, mainly in scattering intensities. In comparison to the spectrum of native HEWL, the FWHM at 759 cm–1 is broadened a bit and the I1340/I1360 ratio is slightly increased to more than 1, as shown in Figure 8a,b, implying the extremely weak impact of Mn2+ on the unfolding of protein tertiary structures. In contrast, the amide I peak position and the N–Cα–C intensity at 933 cm–1 both remain unchanged except for slightly reduced intensities, indicative of the almost negligible influence of the metal ion itself on secondary structure transformation.
Figure 8.
Raman spectra of the native HEWL (in black) and the denatured state (in red) in the ranges of 720–800 (a), 1300–1400 (b), 910–1030 (c), and 1590–1730 cm–1 (d) with thermal (65 °C) treatment in the presence of Mn2+.
4. Conclusions
In this study, the effect of Mn2+ on the process of amyloid fibrillation in HEWL was investigated by combining Raman spectroscopy, AFM imaging, ThT fluorescence assays, and UV–vis absorption spectroscopy. In the absence of acids, insignificant changes were observed for protein after incubation for 144 h, indicating an extremely weak influence of Mn2+ on the HEWL denaturation. On the contrary, the remarkable effect of Mn2+ was validated to be associated with the protein amyloid fibrillation in the presence of acids.
With thermal and acid treatments, the unfolding of protein tertiary structures is efficiently accelerated by Mn2+ to form oligomers/protofibrils, as indicated in the AFM images. The inconsistent evolutionary kinetics of the two Raman Trp residue indicators provide additional evidence for the promotion effect. Moreover, the significant promotion effect of Mn2+ on the transformation from α-helix to β-sheets is confirmed by monitoring the kinetics of two Raman indicators of protein secondary structures. In addition, more amorphous aggregates are formed due to the influence of Mn2+. Considering that the amorphous aggregates might have similar toxicity to oligomers due to similar molecular structures, Mn2+ ions will increase toxicity to cells, providing useful clues to understand why excess exposure to manganese is associated with neurological diseases34 at the molecular level.
Acknowledgments
This work was financially supported by the National Natural Science Foundation of China (nos. 22073088, 21873089, and 22027801) and the China Postdoctoral Science Foundation (2019TQ0145).
Supporting Information Available
The Supporting Information is available free of charge at https://pubs.acs.org/doi/10.1021/acsomega.3c01531.
Curve fitting analyses of the amide I band profiles of HWEL after incubation for 144 h in thermal/acid and thermal/acid/Mn2+ conditions (PDF)
The authors declare no competing financial interest.
Supplementary Material
References
- Dobson C. M. Principles of protein folding, misfolding and aggregation. Semin. Cell Dev. Biol. 2004, 15, 3–16. 10.1016/j.semcdb.2003.12.008. [DOI] [PubMed] [Google Scholar]
- Uversky V. N.; Fink A. L. Conformational constraints for amyloid fibrillation: the importance of being unfolded. Biochim. Biophys. Acta 2004, 1698, 131–153. 10.1016/j.bbapap.2003.12.008. [DOI] [PubMed] [Google Scholar]
- Chiti F.; Dobson C. M. Protein misfolding, functional amyloid, and human disease. Annu. Rev. Biochem. 2006, 75, 333–366. 10.1146/annurev.biochem.75.101304.123901. [DOI] [PubMed] [Google Scholar]
- Goure W. F.; Krafft G. A.; Jerecic J.; Hefti F. Targeting the proper amyloid-beta neuronal toxins: a path forward for Alzheimer’s disease immunotherapeutics. Alzheimer’s Res. Ther. 2014, 6, 42. 10.1186/alzrt272. [DOI] [PMC free article] [PubMed] [Google Scholar]
- Guo Y.; Wang J. Spectroscopic evidence for polymorphic aggregates formed by amyloid-beta fragments. ChemPhysChem 2012, 13, 3901–3908. 10.1002/cphc.201200611. [DOI] [PubMed] [Google Scholar]
- Luo J.; Warmlander S. K.; Graslund A.; Abrahams J. P. Cross-interactions between the Alzheimer Disease Amyloid-beta Peptide and Other Amyloid Proteins: A Further Aspect of the Amyloid Cascade Hypothesis. J. Biol. Chem. 2016, 291, 16485–16493. 10.1074/jbc.r116.714576. [DOI] [PMC free article] [PubMed] [Google Scholar]
- Hakeem M. J.; Khan J. M.; Malik A.; Husain F. M.; Alresaini S. M.; Ahmad A.; Alam P. Molecular insight into the modulation of ovalbumin fibrillation by allura red dye at acidic pH. Int. J. Biol. Macromol. 2023, 230, 123254. 10.1016/j.ijbiomac.2023.123254. [DOI] [PubMed] [Google Scholar]
- Swaminathan R.; Ravi V. K.; Kumar S.; Kumar M. V. S.; Chandra N. Lysozyme: A model protein for amyloid research. Adv. Protein Chem. Struct. Biol. 2011, 84, 63–111. 10.1016/B978-0-12-386483-3.00003-3. [DOI] [PubMed] [Google Scholar]
- Faramarzian M.; Bahramikia S.; Dehghan Shasaltaneh M. In vitro investigation of the effect of mesalazine on amyloid fibril formation of hen egg-white lysozyme and defibrillation lysozyme fibrils. Eur. J. Pharmacol. 2020, 874, 173011. 10.1016/j.ejphar.2020.173011. [DOI] [PubMed] [Google Scholar]
- Hedoux A.; Ionov R.; Willart J. F.; Lerbret A.; Affouard F.; Guinet Y.; Descamps M.; Prevost D.; Paccou L.; Danede F. Evidence of a two-stage thermal denaturation process in lysozyme: a Raman scattering and differential scanning calorimetry investigation. J. Chem. Phys. 2006, 124, 014703. 10.1063/1.2139087. [DOI] [PubMed] [Google Scholar]
- Zou Y.; Hao W.; Li H.; Gao Y.; Sun Y.; Ma G. New insight into amyloid fibril formation of hen egg white lysozyme using a two-step temperature-dependent FTIR approach. J. Phys. Chem. B 2014, 118, 9834–9843. 10.1021/jp504201k. [DOI] [PubMed] [Google Scholar]
- Arnaudov L. N.; de Vries R. Thermally induced fibrillar aggregation of hen egg white lysozyme. Biophys. J. 2005, 88, 515–526. 10.1529/biophysj.104.048819. [DOI] [PMC free article] [PubMed] [Google Scholar]
- Ormeño D.; Romero F.; López-Fenner J.; Avila Á.; Martínez-Torres A.; Parodi J. Ethanol Reduces Amyloid Aggregation In Vitro and Prevents Toxicity in Cell Lines. Arch. Med. Res. 2013, 44, 1–7. 10.1016/j.arcmed.2012.12.004. [DOI] [PubMed] [Google Scholar]
- Xing L.; Fan W.; Chen N.; Li M.; Zhou X.; Liu S. Amyloid formation kinetics of hen egg white lysozyme under heat and acidic conditions revealed by Raman spectroscopy. J. Raman Spectrosc. 2019, 50, 629–640. 10.1002/jrs.5567. [DOI] [Google Scholar]
- Giri K.; Bhattacharyya N. P.; Basak S. pH-dependent self-assembly of polyalanine peptides. Biophys. J. 2007, 92, 293–302. 10.1529/biophysj.106.091769. [DOI] [PMC free article] [PubMed] [Google Scholar]
- Hakeem M. J.; Khan J. M.; Malik A.; Husain F. M.; Ambastha V. Role of salts and solvents on the defibrillation of food dye ″sunset yellow″ induced hen egg white lysozyme amyloid fibrils. Int. J. Biol. Macromol. 2022, 219, 1351–1359. 10.1016/j.ijbiomac.2022.08.199. [DOI] [PubMed] [Google Scholar]
- Fan W.; Xing L.; Chen N.; Zhou X.; Yu Y.; Liu S. Promotion Effect of Succinimide on Amyloid Fibrillation of Hen Egg-White Lysozyme. J. Phys. Chem. B 2019, 123, 8057–8064. 10.1021/acs.jpcb.9b06958. [DOI] [PubMed] [Google Scholar]
- Fan W.; Chen X.-d.; Liu L.-m.; Chen N.; Zhou X.-g.; Zhang Z.-h.; Liu S.-l. Concentration-dependent influence of silver nanoparticles on amyloid fibrillation kinetics of hen egg-white lysozyme. Chin. J. Chem. Phys. 2021, 34, 393–405. 10.1063/1674-0068/cjcp2104069. [DOI] [Google Scholar]
- Kim A. C.; Lim S.; Kim Y. K. Metal Ion Effects on Abeta and Tau Aggregation. Int. J. Mol. Sci. 2018, 19, 128. 10.3390/ijms19010128. [DOI] [PMC free article] [PubMed] [Google Scholar]
- Cilliers K. Trace element alterations in Alzheimer’s disease: A review. Clin. Anat. 2021, 34, 766–773. 10.1002/ca.23727. [DOI] [PubMed] [Google Scholar]
- Ma B.; Zhang F.; Wang X.; Zhu X. Investigating the inhibitory effects of zinc ions on amyloid fibril formation of hen egg-white lysozyme. Int. J. Biol. Macromol. 2017, 98, 717–722. 10.1016/j.ijbiomac.2017.01.128. [DOI] [PubMed] [Google Scholar]
- Wang H.; Wu J.; Sternke-Hoffmann R.; Zheng W.; Morman C.; Luo J. Multivariate effects of pH, salt, and Zn(2+) ions on Abeta(40) fibrillation. Commun. Chem. 2022, 5, 171. 10.1038/s42004-022-00786-1. [DOI] [PMC free article] [PubMed] [Google Scholar]
- Li Y.; Yu Y.; Ma G. Modulation Effects of Fe(3+), Zn(2+), and Cu(2+) Ions on the Amyloid Fibrillation of alpha-Synuclein: Insights from a FTIR Investigation. Molecules 2022, 27, 8383. 10.3390/molecules27238383. [DOI] [PMC free article] [PubMed] [Google Scholar]
- Ghosh S.; Pandey N. K.; Bhattacharya S.; Roy A.; Dasgupta S. Fibrillation of hen egg white lysozyme triggers reduction of copper(II). Int. J. Biol. Macromol. 2012, 51, 1–6. 10.1016/j.ijbiomac.2012.04.024. [DOI] [PubMed] [Google Scholar]
- Xing L.; Chen N.; Fan W.; Li M.; Zhou X.; Liu S. Double-edged effects of aluminium ions on amyloid fibrillation of hen egg-white lysozyme. Int. J. Biol. Macromol. 2019, 132, 929–938. 10.1016/j.ijbiomac.2019.04.009. [DOI] [PubMed] [Google Scholar]
- Kim E.; Di Censo D.; Baraldo M.; Simmons C.; Rosa I.; Randall K.; Ballard C.; Dickie B. R.; Williams S. C. R.; Killick R.; Cash D. In vivo multi-parametric manganese-enhanced MRI for detecting amyloid plaques in rodent models of Alzheimer’s disease. Sci. Rep. 2021, 11, 12419. 10.1038/s41598-021-91899-5. [DOI] [PMC free article] [PubMed] [Google Scholar]
- Mezzaroba L.; Alfieri D. F.; Colado Simao A. N.; Vissoci Reiche E. M. The role of zinc, copper, manganese and iron in neurodegenerative diseases. Neurotoxicology 2019, 74, 230–241. 10.1016/j.neuro.2019.07.007. [DOI] [PubMed] [Google Scholar]
- Harischandra D. S.; Ghaisas S.; Zenitsky G.; Jin H.; Kanthasamy A.; Anantharam V.; Kanthasamy A. G. Manganese-Induced Neurotoxicity: New Insights Into the Triad of Protein Misfolding, Mitochondrial Impairment, and Neuroinflammation. Front. Neurosci. 2019, 13, 654. 10.3389/fnins.2019.00654. [DOI] [PMC free article] [PubMed] [Google Scholar]
- Lucchini R. G.; Aschner M.; Kim Y.. Manganese. In Handbook on the Toxicology of Metals, 5th edn.; Nordberg G. F.; Costa M., Eds.; Academic Press: 2022; Chapter 21, pp 501–538. [Google Scholar]
- Lin G.; Li X.; Cheng X.; Zhao N.; Zheng W. Manganese Exposure Aggravates beta-Amyloid Pathology by Microglial Activation. Front. Aging Neurosci. 2020, 12, 556008. 10.3389/fnagi.2020.556008. [DOI] [PMC free article] [PubMed] [Google Scholar]
- Tong Y.; Yang H.; Tian X.; Wang H.; Zhou T.; Zhang S.; Yu J.; Zhang T.; Fan D.; Guo X.; Tabira T.; Kong F.; Chen Z.; Xiao W.; Chui D. High manganese, a risk for Alzheimer’s disease: high manganese induces amyloid-beta related cognitive impairment. J. Alzheimer’s Dis. 2014, 42, 865–878. 10.3233/jad-140534. [DOI] [PubMed] [Google Scholar]
- Budinger D.; Barral S.; Soo A. K. S.; Kurian M. A. The role of manganese dysregulation in neurological disease: emerging evidence. Lancet Neurol. 2021, 20, 956–968. 10.1016/s1474-4422(21)00238-6. [DOI] [PubMed] [Google Scholar]
- Kim H.; Harrison F. E.; Aschner M.; Bowman A. B. Exposing the role of metals in neurological disorders: a focus on manganese. Trends Mol. Med. 2022, 28, 555–568. 10.1016/j.molmed.2022.04.011. [DOI] [PMC free article] [PubMed] [Google Scholar]
- Bowman A. B.; Kwakye G. F.; Herrero Hernandez E.; Aschner M. Role of manganese in neurodegenerative diseases. J. Trace Elem. Med. Biol. 2011, 25, 191–203. 10.1016/j.jtemb.2011.08.144. [DOI] [PMC free article] [PubMed] [Google Scholar]
- Bahramikia S.; Yazdanparast R. Anti-amyloidogenic and fibril-destabilizing effects of two manganese-salen derivatives against hen egg-white lysozyme aggregation. Int. J. Biol. Macromol. 2012, 50, 187–197. 10.1016/j.ijbiomac.2011.10.018. [DOI] [PubMed] [Google Scholar]
- Xu B.; Huang S.; Liu Y.; Wan C.; Gu Y.; Wang D.; Yu H. Manganese promotes alpha-synuclein amyloid aggregation through the induction of protein phase transition. J. Biol. Chem. 2022, 298, 101469. 10.1016/j.jbc.2021.101469. [DOI] [PMC free article] [PubMed] [Google Scholar]
- Shashilov V. A.; Lednev I. K. 2D Correlation Deep UV Resonance Raman Spectroscopy of Early Events of Lysozyme Fibrillation: Kinetic Mechanism and Potential Interpretation Pitfalls. J. Am. Chem. Soc. 2008, 130, 309–317. 10.1021/ja076225s. [DOI] [PubMed] [Google Scholar]
- Krebs M. R.; Wilkins D. K.; Chung E. W.; Pitkeathly M. C.; Chamberlain A. K.; Zurdo J.; Robinson C. V.; Dobson C. M. Formation and seeding of amyloid fibrils from wild-type hen lysozyme and a peptide fragment from the beta-domain. J. Mol. Biol. 2000, 300, 541–549. 10.1006/jmbi.2000.3862. [DOI] [PubMed] [Google Scholar]
- Chen L.; Zhu W.; Lin K.; Hu N.; Yu Y.; Zhou X.; Yuan L. F.; Hu S. M.; Luo Y. Identification of alcohol conformers by Raman spectra in the C-H stretching region. J. Phys. Chem. A 2015, 119, 3209–3217. 10.1021/jp513027r. [DOI] [PubMed] [Google Scholar]
- Lin K.; Hu N.; Zhou X.; Liu S.; Luo Y. Reorientation dynamics in liquid alcohols from Raman spectroscopy. J. Raman Spectrosc. 2012, 43, 82–88. 10.1002/jrs.2997. [DOI] [Google Scholar]
- Rajan R.; Ahmed S.; Sharma N.; Kumar N.; Debas A.; Matsumura K. Review of the current state of protein aggregation inhibition from a materials chemistry perspective: special focus on polymeric materials. Mater. Adv. 2021, 2, 1139–1176. 10.1039/d0ma00760a. [DOI] [Google Scholar]
- Middaugh C. R.; Kehoe J. M.; Prystowsky M. B.; Gerber-Jenson B.; Jenson J. C.; Litman G. W. Molecular basis for the temperature-dependent insolubility of cryoglobulins—IV: Structural studies of the IgM monoclonal cryoglobulin McE. Immunochemistry 1978, 15, 171–187. 10.1016/0161-5890(78)90146-3. [DOI] [PubMed] [Google Scholar]
- Wang W.; Wang Y. J.; Wang D. Q. Dual effects of Tween 80 on protein stability. Int. J. Pharm. 2008, 347, 31–38. 10.1016/j.ijpharm.2007.06.042. [DOI] [PubMed] [Google Scholar]
- Eberlein G. A.; Stratton P. R.; Wang Y. J. Stability of rhbFGF as Determined by UV Spectroscopic Measurements of Turbidity. PDA J. Pharm. Sci. Technol. 1994, 48, 224–230. [PubMed] [Google Scholar]
- Kayed R.; Lasagna-Reeves C. A. Molecular mechanisms of amyloid oligomers toxicity. J. Alzheimer’s Dis. 2012, 33, S67–S78. 10.3233/jad-2012-129001. [DOI] [PubMed] [Google Scholar]
- Cizas P.; Budvytyte R.; Morkuniene R.; Moldovan R.; Broccio M.; Losche M.; Niaura G.; Valincius G.; Borutaite V. Size-dependent neurotoxicity of beta-amyloid oligomers. Arch. Biochem. Biophys. 2010, 496, 84–92. 10.1016/j.abb.2010.02.001. [DOI] [PMC free article] [PubMed] [Google Scholar]
- Lansbury P. T.; Lashuel H. A. A century-old debate on protein aggregation and neurodegeneration enters the clinic. Nature 2006, 443, 774–779. 10.1038/nature05290. [DOI] [PubMed] [Google Scholar]
- Caughey B.; Lansbury P. T. Protofibrils, pores, fibrils, and neurodegeneration: separating the responsible protein aggregates from the innocent bystanders. Annu. Rev. Neurosci. 2003, 26, 267–298. 10.1146/annurev.neuro.26.010302.081142. [DOI] [PubMed] [Google Scholar]
- Kurouski D.; Van Duyne R. P.; Lednev I. K. Exploring the structure and formation mechanism of amyloid fibrils by Raman spectroscopy: a review. Analyst 2015, 140, 4967–4980. 10.1039/c5an00342c. [DOI] [PubMed] [Google Scholar]
- Barth A.; Zscherp C. What vibrations tell about proteins. Q. Rev. Biophys. 2003, 35, 369–430. 10.1017/s0033583502003815. [DOI] [PubMed] [Google Scholar]
- Spiro T. G.; Gaber B. P. Laser Raman Scattering as a Probe of Protein Structure. Annu. Rev. Biochem. 1977, 46, 553–570. 10.1146/annurev.bi.46.070177.003005. [DOI] [PubMed] [Google Scholar]
- Hernández B.; Pflüger F.; Kruglik S. G.; Ghomi M. Characteristic Raman lines of phenylalanine analyzed by a multiconformational approach. J. Raman Spectrosc. 2013, 44, 827–833. 10.1002/jrs.4290. [DOI] [Google Scholar]
- Takeuchi H. Raman structural markers of tryptophan and histidine side chains in proteins. Biopolymers 2003, 72, 305–317. 10.1002/bip.10440. [DOI] [PubMed] [Google Scholar]
- Miura T.; Takeuchi H.; Harada I. Raman spectroscopic characterization of tryptophan side chains in lysozyme bound to inhibitors: role of the hydrophobic box in the enzymic function. Biochemistry 1991, 30, 6074–6080. 10.1021/bi00238a035. [DOI] [PubMed] [Google Scholar]
- Miura T.; Takeuchi H.; Harada I. Tryptophan Raman Bands Sensitive To Hydrogen-Bonding And Side-Chain Conformation. J. Raman Spectrosc. 1989, 20, 667–671. 10.1002/jrs.1250201007. [DOI] [Google Scholar]
- Rygula A.; Majzner K.; Marzec K. M.; Kaczor A.; Pilarczyk M.; Baranska M. Raman spectroscopy of proteins: a review. J. Raman Spectrosc. 2013, 44, 1061–1076. 10.1002/jrs.4335. [DOI] [Google Scholar]
- Kuhar N.; Sil S.; Umapathy S. Potential of Raman spectroscopic techniques to study proteins. Spectrochim. Acta, Part A 2021, 258, 119712. 10.1016/j.saa.2021.119712. [DOI] [PubMed] [Google Scholar]
- Maiti N. C.; Apetri M. M.; Zagorski M. G.; Carey P. R.; Anderson V. E. Raman Spectroscopic Characterization of Secondary Structure in Natively Unfolded Proteins: α-Synuclein. J. Am. Chem. Soc. 2004, 126, 2399–2408. 10.1021/ja0356176. [DOI] [PubMed] [Google Scholar]
- Barth A. Infrared spectroscopy of proteins. Biochim. Biophys. Acta 2007, 1767, 1073–1101. 10.1016/j.bbabio.2007.06.004. [DOI] [PubMed] [Google Scholar]
- Dolui S.; Roy A.; Pal U.; Saha A.; Maiti N. C. Structural Insight of Amyloidogenic Intermediates of Human Insulin. ACS Omega 2018, 3, 2452–2462. 10.1021/acsomega.7b01776. [DOI] [PMC free article] [PubMed] [Google Scholar]
- Huang K.; Maiti N. C.; Phillips N. B.; Carey P. R.; Weiss M. A. Structure-Specific Effects of Protein Topology on Cross-β Assembly: Studies of Insulin Fibrillation. Biochemistry 2006, 45, 10278–10293. 10.1021/bi060879g. [DOI] [PubMed] [Google Scholar]
- Mangialardo S.; Piccirilli F.; Perucchi A.; Dore P.; Postorino P. Raman analysis of insulin denaturation induced by high-pressure and thermal treatments. J. Raman Spectrosc. 2012, 43, 692–700. 10.1002/jrs.3097. [DOI] [Google Scholar]
- Chiti F.; Dobson C. M. Protein Misfolding, Amyloid Formation, and Human Disease: A Summary of Progress Over the Last Decade. Annu. Rev. Biochem. 2017, 86, 27–68. 10.1146/annurev-biochem-061516-045115. [DOI] [PubMed] [Google Scholar]
- Dolui S.; Mondal A.; Roy A.; Pal U.; Das S.; Saha A.; Maiti N. C. Order, Disorder, and Reorder State of Lysozyme: Aggregation Mechanism by Raman Spectroscopy. J. Phys. Chem. B 2020, 124, 50–60. 10.1021/acs.jpcb.9b09139. [DOI] [PubMed] [Google Scholar]
- Liu L.; Li X.; Chen N.; Chen X.; Xing L.; Zhou X.; Liu S. Influence of cadmium ion on denaturation kinetics of hen egg white-lysozyme under thermal and acidic conditions. Spectrochim. Acta, Part A 2023, 296, 122650. 10.1016/j.saa.2023.122650. [DOI] [PubMed] [Google Scholar]
- Qin Z.; Sun Y.; Jia B.; Wang D.; Ma Y.; Ma G. Kinetic Mechanism of Thioflavin T Binding onto the Amyloid Fibril of Hen Egg White Lysozyme. Langmuir 2017, 33, 5398–5405. 10.1021/acs.langmuir.7b00221. [DOI] [PubMed] [Google Scholar]
- Biancalana M.; Koide S. Molecular mechanism of Thioflavin-T binding to amyloid fibrils. Biochim. Biophys. Acta 2010, 1804, 1405–1412. 10.1016/j.bbapap.2010.04.001. [DOI] [PMC free article] [PubMed] [Google Scholar]
Associated Data
This section collects any data citations, data availability statements, or supplementary materials included in this article.


