Abstract
Background and Objectives
In clinical practice, it can be difficult to differentiate between intracranial calcifications related to primary familial brain calcification (PFBC) or aging. Also, little is known about the consequences of the amount of intracranial calcifications in patients with PFBC. Therefore, we aimed to compare the amount and distribution of intracranial calcifications in persons with PFBC with controls and between asymptomatic and symptomatic PFBC cases.
Methods
This was a case-control study including patients with PFBC and controls. Controls received a CT of the brain because of a trauma and had at least some basal ganglia calcification. The Nicolas score and volume of calcification were used to quantify intracranial calcifications on the CT scans. Receiver operating characteristic curves were obtained to calculate optimal cutoff points to discriminate between cases and controls. Mann-Whitney U tests and logistic regression, adjusted for age and sex, were used to compare the amount of calcification.
Results
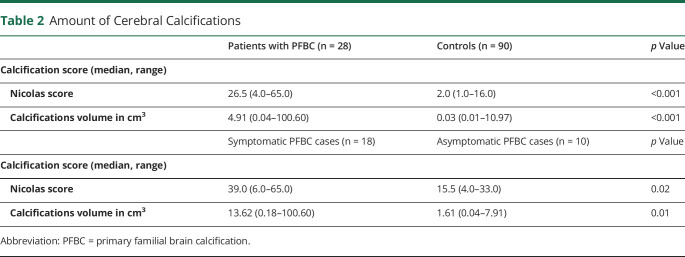
Twenty-eight cases (median age 65 years, 50.0% male) and 90 controls (median age 74 years, 46.1% male) were included. Calcification scores were higher in cases (median volume: 4.91 cm3 against 0.03 cm3, p < 0.001, median Nicolas score: 26.5 against 2.0, p < 0.001) than controls. Calcifications were also more diffusely distributed in cases. To differentiate between cases and controls, optimal cutoff points were ≥0.2 cm3 for the calcification volume and ≥6.0 for the Nicolas score. Calcification was higher for symptomatic than asymptomatic cases (calcification volume: 13.62 cm3 against 1.61 cm3, p = 0.01, Nicolas score: 39.0 against 15.5, p = 0.02). After adjustment for age and sex, the Nicolas score remained significantly higher in symptomatic patients, and the calcification volume did not.
Discussion
Patients with PFBC had more severe intracranial calcifications, and these calcifications were more diffusely distributed through the brain compared with controls. Symptomatic patients with PFBC might have more intracranial calcifications than asymptomatic persons.
Primary familial brain calcification (PFBC), also known as Fahr disease or idiopathic basal ganglia calcification, is a disease characterized by symmetrical calcifications of the basal ganglia and other subcortical nuclei.1 In case of PFBC, there is an idiopathic or genetic origin.2 Known causative variations include autosomal dominant inherited variations of SLC20A2, PDGFRB, PDGFB, and XPR1 genes and autosomal recessive inherited variations of MYORG and JAM2 genes.3 Besides PFBC, basal ganglia calcifications can also occur as a result of many secondary causes, with disorders in the calcium metabolism such as hypoparathyroidism or pseudo-hypoparathyroidism as the most common secondary causes.2 Furthermore, these calcifications can also occur as a process of aging with a prevalence up to 30% in older adults.4 In clinical practice, it can be difficult to differentiate between intracranial calcifications related to PFBC or aging.
PFBC can present with a range of symptoms. The most frequently described symptoms include movement disorders, mostly akinetic-hypertonic syndrome, psychiatric symptoms, mostly mood disorders, and cognitive impairment.5 There are also persons with PFBC who are asymptomatic. Only few studies reported the prevalence of asymptomatic PFBC cases, and it ranged from 29%–42%.5-7
Little is known about the consequences of the amount of intracranial calcifications in patients with PFBC. One study5 proposed a calcification score to quantify the amount of intracranial calcifications. In this study, patients with a higher calcification score were older and also more often symptomatic. There were also different calcification patterns across the genetic variations, with patients with an SLC20A2 variation having more total intracranial calcifications than patients with a PDGFRB variation. One other study also demonstrated a higher amount of intracranial calcification in symptomatic patients with PFBC compared with asymptomatic patients.6
The aim of the study was to quantify the amount and distribution of intracranial calcifications in patients with PFBC and compare this with a control group. Furthermore, we suggest a cutoff point for the amount of cerebral calcifications to differentiate between patients with PFBC and controls. Last, we assessed whether symptomatic patients with PFBC have more severe intracranial calcification than asymptomatic persons with PFBC.
Methods
We conducted this case-control study at the University Medical Center Utrecht in the Netherlands. This is an academic, tertiary hospital where persons with suspected PFBC are referred to, mostly for a second opinion. This study prospectively includes persons with PFBC who were referred to the geriatric outpatient clinic until August 2021. Of the 30 eligible persons with PFBC, 28 gave informed consent to be included. The diagnosis PFBC was made on earlier described and modified criteria consisting of (1) bilateral calcifications of the basal ganglia visualized on neuroimaging, usually a CT scan. Other brain regions may also be affected. (2) Clinical symptoms consistent with PFBC. (3) Absence of biochemical abnormalities or clinical features suggestive of metabolic, mitochondrial, infectious, toxic, or traumatic causes of calcifications. Supportive criterium is (4) a family history consistent with autosomal dominant inheritance.1,8-10 A known genetic variation (PDGFB, PDGFRB, SLC20A2, XPR1, MYORG, or JAM2) confirmed the diagnosis.3
Controls
Controls were included from a retrospective cohort of over 1,000 consecutive patients in the same hospital who had a thin-slice CT scan of the brain performed between 2009 and 2016 because of a traumatic event.11 Controls were excluded if they were younger than 18 years, as the cases with PFBC were all adults. Controls were also excluded when they were suspected of stroke and in case of large structural cerebral lesions, making it impossible to quantify the amount of calcification.11 There was no information on medical or family history for the controls. We only included controls that had at least some basal ganglia calcification to ensure that we would be able to calculate cutoff points of the amount of calcification to differentiate between PFBC and normal calcifications.
Imaging Variables
All cases and controls underwent a thin-slice CT scan of the brain. A variety of CT scanning protocols were used. The majority of CT scans were acquired in the UMC Utrecht with several multidetector CT scanners from Philips Healthcare (64–256 detector rows). Other scans were acquired in referring hospitals with possibly scanners from other vendors. Slice thickness ranged from 1 to 5 mm, 120 kilo voltage peak, milli-amperage varied. We used a rating scale developed by Nicolas et al.5 to quantify the amount of cerebral calcifications. This scale analyses the left and right lenticular nucleus, left and right caudate nucleus, left and right thalamus, left and right cerebral subcortical white matter, cerebral cortex, left and right cerebellar hemisphere, vermis, left and right midbrain, pons, and medulla. All locations are visually scored according to a 6-point rating scale: 0 = no calcification, 1 = punctate, 2 = faint, 3 = moderate, 4 = severe, and 5 = severe and confluent. The score can range from 0 to 80. CT scans were scored by a certified radiologist dedicated to neuroradiology, blinded for clinical variables (E.A.v.M.).
Furthermore, we used The Philips IntelliSpace Portal version 11.1 (Philips Medical Systems, Best, The Netherlands) to quantify the volume of calcifications, using tumor tracking. The software automatically proposes a segmentation for the calcifications in 3D, when an observer clicks on the calcification. Subsequently, the observer is able to perform manual corrections until the segmentation is visually correct. All volumes were independently scored by 2 raters (N.M.S.G. and E.M.), both were blinded for clinical variables and trained by a radiologist (P.A.d.J.) before the scoring.
Clinical Variables
Of all cases and controls, age and sex were noted. Cases were diagnosed by a multidisciplinary team, consisting of a geriatrician, neuropsychologist, radiologist, geneticist, nurse, physiotherapist, neurologist, and physical medicine and rehabilitation physician. Extensive laboratory and microbiology testing was performed to exclude any secondary causes. Additional genetic testing was performed in the majority of the patients after counseling, or the genetic results were requested in case of previous testing in a different hospital. Furthermore, all cases underwent neuropsychological assessment and assessment by a physiotherapist. Cases were considered symptomatic if there was current or past psychiatric disease, cognitive impairment, and/or movement disorder. Psychiatric diseases were classified with the use of the Diagnostic and Statistical Manual of Mental Disorders 5 (DSM-5). Cognitive impairment was concluded through neuropsychological assessment (including Montreal Cognitive Assessment and more extensive memory, attention, executive functioning, and visuospatial functioning assessment) with at least 2 tests in 1 cognitive domain below the 5th percentile. The exact neuropsychological tests differed between cases because of the development of a standardized protocol during the study. Examples of tests most patients received were the Rivermead Behavioural Memory Test, Visual Association Test, Rey complex figure, Stroop Test, Trail Making Test, fluency and Digit Span Test. A movement disorder was defined as having experienced more than 1 fall in the year before the baseline measurement or a Unified Parkison Disease Rating Scale (UPDRS) motor score of 11 or higher. The score of 11 or higher was chosen based on prior research.12 Cases that did not meet any of these criteria, as they had only mild symptoms, were considered asymptomatic.
Statistical Analyses
Baseline characteristics were analyzed with descriptive statistics. All continuous baseline characteristics were noted as mean and SD, or in case of a skewed distribution, as median and range. Categorical baseline characteristics were noted as numbers and percentages.
An intraclass correlation coefficient (ICC) between the 2 raters (N.M.S.G. and E.M.) was calculated for the calcifications volume to determine whether there was sufficient agreement between them. If the ICC was sufficient, the mean of the 2 measures was taken as the calcifications volume for that case. If the ICC was not sufficient, the calcifications volumes would be assessed by a third rater.
Furthermore, receiver operating characteristic curves (ROC curves) were obtained for both the calcifications volume and Nicolas score to calculate the area under the curve and the most optimal cutoff points to discriminate between cases and controls. With these cutoff points, the sensitivity, specificity, and positive and negative predictive values were calculated.
Last, the differences in calcification between cases and controls and between symptomatic and asymptomatic cases were analyzed. The Mann-Whitney U test was used because the calcification volume and Nicolas score were not normally distributed. Logistic regression models were performed with adjustment for age and sex. In the logistic regression, we used a natural log transformation of the calcifications volume to adjust for the distribution. For the Nicolas score, transformation was not necessary based on the Q-Q plot.
SPSS software, version 26.0.0.1 (SPSS Inc., Chicago, IL) was used for the analyses. A p value <0.05 was considered statistically significant.
Standard Protocol Approvals, Registrations, and Patient Consents
Written informed consent was acquired from all cases. For controls, written informed consent was waived with approval from a local medical research ethics committee. Approval for this study was also obtained from a local medical research ethics committee (number 21-170/C).
Data Availability
The data are not publicly available because participants did not consent for this availability.
Results
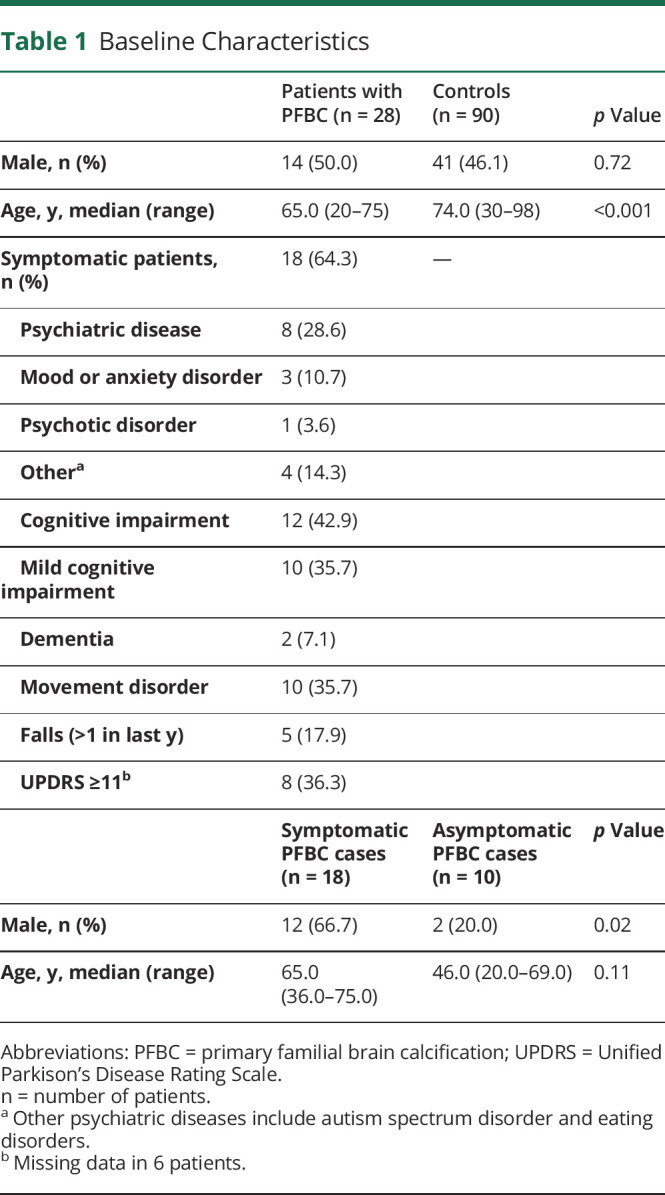
Twenty-eight cases and 90 controls were included in the analyses. Controls were older, median age 74 years against 65 years (p < 0.001). The percentage of males was comparable between cases and controls. Of the cases, 64.3% were symptomatic. For the baseline characteristics, see Table 1. The cases were all independent patients and not genetically related. In 23 cases, genetic analyses were performed, 14 had no known variation, 7 had a variation in the SLC20A2 gene, and 2 in the MYORG gene. Besides missing data in the results of genetical analyses as mentioned above, there were no missing data except in the UPDRS score as mentioned in Table 1.
Table 1.
Baseline Characteristics
The ICC for the calcifications volume was 0.99 between the 2 raters. Because of the high ICC, the mean of the scores of the 2 raters was used as the calcifications volume.
Both the median calcifications volume and the median Nicolas score were significantly higher for the cases compared with the controls (median volume: 4.91 against 0.03 cm3, p < 0.001, median Nicolas score: 26.5 against 2.0, p < 0.001). For these results, see Table 2. After adjustment for age and sex, the differences in calcifications remained significant (adjusted odds ratio [OR] 1.67, 95% CI 1.27–2.19 for the Nicolas score, adjusted OR 4.06, 95%-CI: 2.15–7.68 for the transformed calcifications volume) (Table 3). As an example of the amount of intracranial calcifications in patients with PFBC, Figure 1 shows the CT scans of 2 of the cases in this cohort.
Table 2.
Amount of Cerebral Calcifications
Table 3.
Association of Amount of Cerebral Calcification With Occurrence and Symptomatology of PFBC
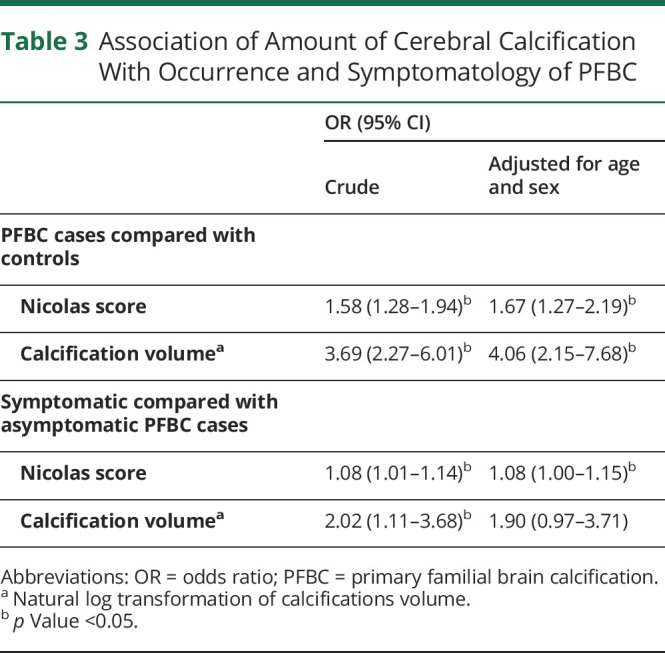
Figure 1. CT Scans of 2 PFBC Cases.
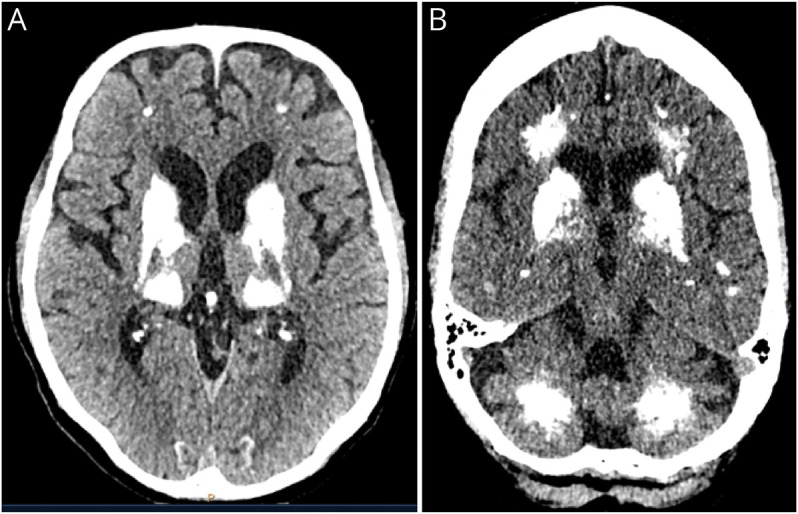
Axial planes of a CT scan showing the characteristic bilateral hyperintensity in the area of the basal ganglia (A), but also in the cerebellar and frontal areas (B). PFBC = primary familial brain calcification.
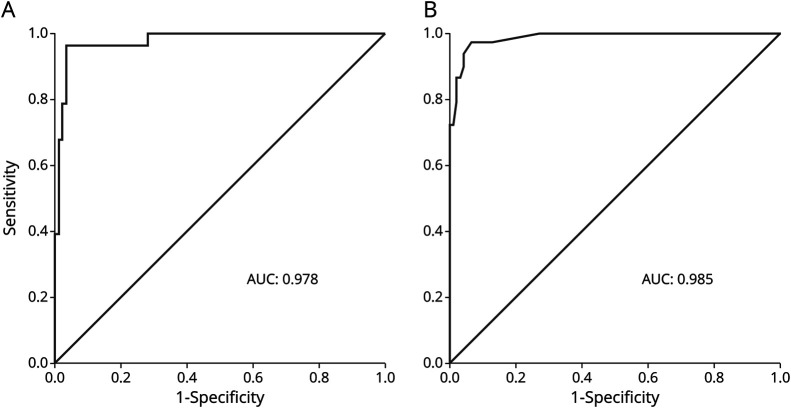
The ROC curve of the calcifications volume showed a high area under the curve of 0.98( Figure 2). With a cutoff point of <0.2 against ≥0.2 cm3, the sensitivity was 92.9% (95% CI 76.5–99.1), the specificity was 96.6% (95% CI 90.5–99.3), the positive predictive value was 89.7% (95% CI 73.9–96.4), and the negative predictive value was 97.7% (95% CI 91.9–99.4). The ROC curve of the Nicolas score also showed a high area under the curve of 0.99 (Figure 2). With a cutoff point of <6.0 against ≥6.0, the sensitivity was 96.4% (95% CI 81.7–99.9), the specificity was 93.3% (95% CI 85.9–97.5), the positive predictive value was 81.8% (95% CI 67.4–90.7), and the negative predictive value was 98.8% (95% CI 92.4–99.8).
Figure 2. ROC Curves of the Calcification Volume and Nicolas Score.
(A) Calcification volume. (B) Nicolas score. AUC = area under the curve; ROC = receiver operating characteristic curve.
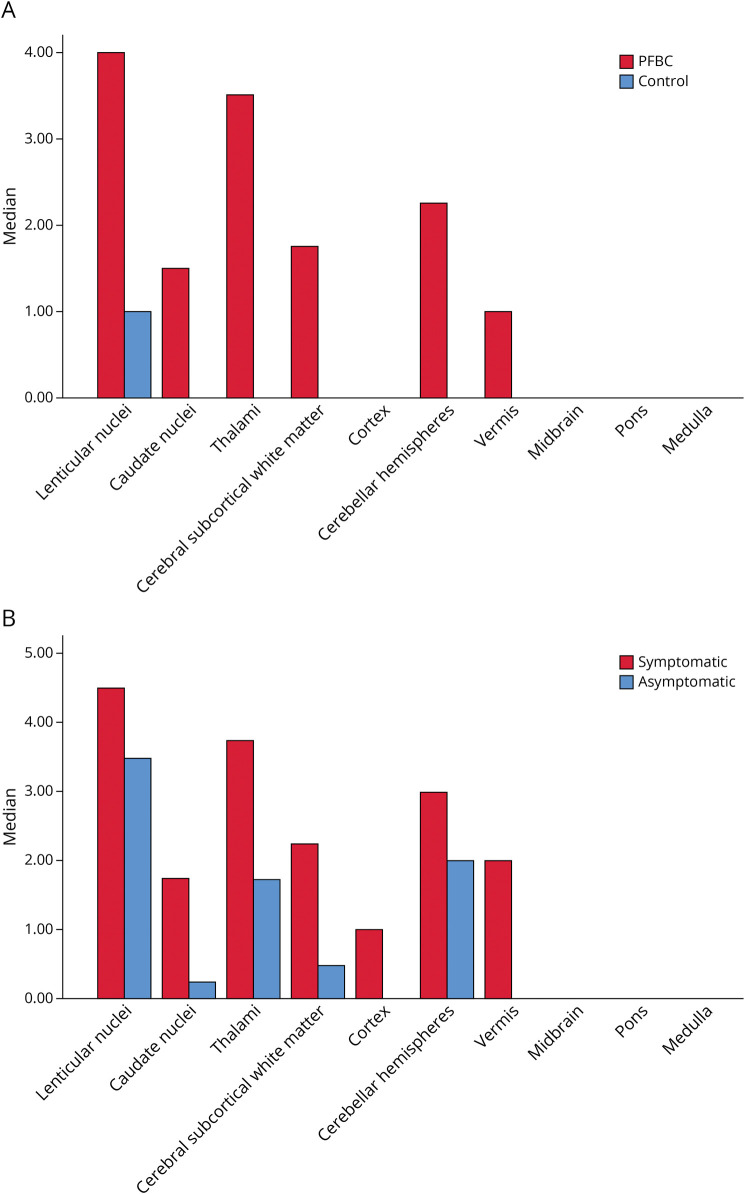
Figure 3A shows the median Nicolas scores per area of the brain. Calcifications for the controls were almost solely situated in the lenticular nuclei, and only 16 controls had calcifications beyond the lenticular nuclei. For the cases, the brain was more diffusely affected. Although the lenticular nuclei were also the most affected area, with one case solely having calcifications in this area, the thalamus and cerebellar hemisphere were frequently affected as well. In both groups, the cortex, medulla, pons, and mesencephalon were mostly unaffected.
Figure 3. Median Nicolas Scores per Area of the Brain.
PFBC cases and controls (A) and of symptomatic and asymptomatic PFBC cases (B). PFBC = primary familial brain calcification.
Symptomatic cases had higher median calcification volume (13.62 against 1.61 cm3, p = 0.02) and higher median Nicolas scores (39.0 against 15.5, p = 0.02) compared with asymptomatic cases (Table 2). The differences in Nicolas scores remained statistically significant after adjustment for age and sex (OR 1.08, 95% CI 1.00–1.15), but the differences in calcifications volume did not (Table 3).
Figure 3B shows the median Nicolas score per area of the brain between symptomatic and asymptomatic cases. Symptomatic cases have more affected areas than the asymptomatic cases. Especially, the caudate nuclei, cerebral subcortical white matter, cortex, and vermis were more often affected.
Discussion
This study showed that patients with PFBC have more severe intracranial calcifications than controls with basal ganglia calcifications. The Nicolas score and calcifications volume can be used to differentiate between patients with PFBC and controls, as cutoff points of ≥6.0 and ≥0.2 cm3, respectively, resulted in high positive and negative predictive values. Also, the distribution of intracranial calcifications can help to differentiate between patients with PFBC and controls. Whereas for the controls, calcifications were mainly situated in the lenticular nuclei, the brains of the patients with PFBC were more diffusely affected. The lenticular nuclei were also most affected in patients with PFBC, but the second and third most commonly affected places were calcifications in the thalamus and the cerebellar hemispheres. Because not all PFBC cases had calcifications beyond the lenticular nuclei and not all controls had solely calcifications in this area, it is important to measure the intracranial calcifications both qualitative and quantitative. In PFBC cases, the Nicolas score was also independently related to occurrence of symptoms. Volume of calcification was not significantly different after adjustment of age and sex.
The difference in the amount of intracranial calcification between controls and patients with PFBC measured with the Nicolas score was earlier described in 1 study.5 In this study, only patients with PFBC with variations SLC20A2 or PDGFRB were taken into account. This study found cutoff scores of 0 in <40 years, 4 in 40–60 years, and 5 in >60 years. Given the high predictive values of the current study, a single cutoff score seems appropriate and more easily applicable. The distribution of intracranial calcification in both controls and patients with PFBC is partly comparable to this previous study investigating the Nicolas score. The lenticular cortex was affected in all cases, followed by the subcortical white matter and thalamus. The cortex seemed to be more frequently affected in this previous study, but only in patients with an SLC20A2 variation.5 In our study, subgroup analysis according to the specific genetic variations was not possible because of the relatively small number of PFBC cases.
Earlier studies found more intracranial calcification in symptomatic patients with PFBC than asymptomatic cases.5,6 One study showed that symptomatic patients had significant higher volumes of calcification in all regions (dentate nucleus, centrum semiovale, and sum total) compared with asymptomatic cases (p < 0.05), but did not state the exact volumes of cerebral calcifications and did not correct for differences in age or sex.6 The other study described Nicolas scores of symptomatic and asymptomatic cases with a significantly higher median score in case of symptoms (33.6 vs 14.5, p < 0.0007), but the authors did not correct for age and sex.5 In our study, the amount of calcifications was significantly higher in symptomatic cases when the Nicolas score was used, also after correction for age and sex. When the calcification volume was used, the differences were not statistically significant after adjustment for age and sex. This might be explained because the Nicolas score also takes the distribution of calcifications into account to calculate the total score, whereas the total calcification volume does not. In the analyses, it did seem that symptomatic cases with PFBC have more areas affected than asymptomatic cases, and this information on distribution is included in the Nicolas score. There are large differences between (severity of) symptoms in patients with PFBC. It is important to determine the reason for these differences to be able to predict the expected symptomatology for an individual patient, but also to explore the pathophysiology of PFBC further and to discover clues for treatment. For example, whether a treatment focused on the reduction of calcifications is also expected to diminish symptoms.
There were several strengths of this study. First, our study adds to the limited number of described cases of PFBC, and externally validates the Nicolas score.5 With the updated cutoff point of the Nicolas score it can help to differentiate between controls and PFBC cases. Our results help clinicians in daily practice to detect patients who might have PFBC and perform further assessment. Second, the external validity of this study is high, as this study takes all PFBC patients into account, including cases with mild symptoms. Third, we also used volume measurements to assess the extent of calcification. The Nicolas score is relatively difficult to perform and may require neuroradiologic training. In contrast, the calcification volume is more straightforward to assess with limited knowledge and training and might be more simple to implement in clinical practice.
There were also limitations of this study. Although the total number of patients was large enough to perform the current analyses, it was not large enough to study the association between different types of symptoms and the pattern and amount of calcifications or to perform subgroup analysis according to genetic variation or other patient characteristics. Furthermore, there was limited information on the controls. Therefore, the results could not be adjusted for other possible confounders than age and sex. Because the medical and family history was not known for the controls, theoretically a person with PFBC could be included as a control. However, because the disease is rare, this is improbable.
Future research should focus on the differences between the amount and distribution of intracranial calcification according to the type of symptoms and genetic variation in PFBC cases. This could be performed using the Nicolas score or volumes of calcifications in specific areas. For these future studies, larger study populations of PFBC cases are needed. Furthermore, the cutoffs we generated to distinguish between cases and controls should be externally validated.
This study indicates that patients with PFBC have more severe intracranial calcifications and that these calcifications are more diffusely distributed through the brain than in controls. Furthermore, symptomatic PFBC cases might have more cerebral calcifications than asymptomatic cases.
Appendix. Authors
Study Funding
The authors report no targeted funding.
Disclosure
The authors report no relevant disclosures. Full disclosure form information provided by the authors is available with the full text of this article at Neurology.org/cp.
TAKE-HOME POINTS
→ Patients with primary familial brain calcification (PFBC) have more severe intracranial calcifications than controls.
→ Patients with PFBC have more diffusely distributed intracranial calcifications than controls.
→ Symptomatic patients with PFBC might have more intracranial calcifications than asymptomatic patients with PFBC.
References
- 1.Manyam BV. What is and what is not ‘Fahr's disease. Parkinsonism Relat Disord. 2005;11(2):73-80. doi: 10.1016/j.parkreldis.2004.12.001 [DOI] [PubMed] [Google Scholar]
- 2.Bonazza S, La Morgia C, Martinelli P, Capellari S. Strio-pallido-dentate calcinosis: a diagnostic approach in adult patients. Neurol Sci. 2011;32(4):537-545. doi: 10.1007/s10072-011-0514-7 [DOI] [PubMed] [Google Scholar]
- 3.Marinho WLVA, de Oliveira JRM. JAM2: a new culprit at the pathophysiology of primary familial brain calcification. J Mol Neurosci. 2021;71(9):1723-1724. doi: 10.1007/s12031-021-01816-8 [DOI] [PubMed] [Google Scholar]
- 4.de Brouwer EJ, Kockelkoren R, De Vis JB, et al. Prevalence and vascular risk factors of basal ganglia calcifications in patients at risk for cerebrovascular disease. J Neuroradiol. 2020;47(5):337-342. doi: 10.1016/j.neurad.2019.04.002 [DOI] [PubMed] [Google Scholar]
- 5.Nicolas G, Pottier C, Charbonnier C, et al. Phenotypic spectrum of probable and genetically-confirmed idiopathic basal ganglia calcification. Brain. 2013;136(11):3395-3407. doi: 10.1093/brain/awt255 [DOI] [PubMed] [Google Scholar]
- 6.Manyam BV, Walters AS, Narla KR. Bilateral striopallidodentate calcinosis: clinical characteristics of patients seen in a registry. Mov Disord. 2001;16(2):258-264. doi: 10.1002/mds/1049 [DOI] [PubMed] [Google Scholar]
- 7.Nicolas G, Charbonnier C, de Lemos RR, et al. Brain calcification process and phenotypes according to age and sex: lessons from SLC20A2, PDGFB, and PDGFRB mutation carriers. Am J Med Genet B: Neuropsychiatr Genet. 2015;168(7):586-594. doi: 10.1002/ajmg.b.32336 [DOI] [PubMed] [Google Scholar]
- 8.Saleem S, Aslam HM, Anwar M, et al. Fahr's syndrome: literature review of current evidence. Orphanet J Rare Dis. 2013;8(1):156. doi: 10.1186/1750-1172-8-156 [DOI] [PMC free article] [PubMed] [Google Scholar]
- 9.Moskowitz MA, WInickoff RN, Heinz ER. Familial calcification of the basal ganglions: a metabolic and genetic study. N Engl J Med. 1971;285(2):72-77. doi: 10.1056/NEJM197107082850202 [DOI] [PubMed] [Google Scholar]
- 10.Ellie E, Julien J, Ferrer X. Familial idiopathic striopallidodentate calcifications. Neurology. 1989;39(3):381-385. doi: 10.1212/wnl.39.3.381 [DOI] [PubMed] [Google Scholar]
- 11.Kockelkoren R, De Vis JB, de Jong PA, et al. Intracranial carotid artery calcification from infancy to old age. J Am Coll Cardiol. 2018;72(5):582-584. doi: 10.1016/j.jacc.2018.05.021 [DOI] [PubMed] [Google Scholar]
- 12.Shulman LM, Gruber-Baldini AL, Anderson KE, Fishman PS, Reich SG, Weiner WJ. The clinically important difference on the unified Parkinson's disease rating scale. Arch Neurol. 2010;67(1):64-70. doi: 10.1001/archneruol.2009.295 [DOI] [PubMed] [Google Scholar]
Associated Data
This section collects any data citations, data availability statements, or supplementary materials included in this article.
Data Availability Statement
The data are not publicly available because participants did not consent for this availability.


