Abstract
COVID-19 has expanded overall across the globe after its initial cases were discovered in December 2019 in Wuhan—China. Because the virus has impacted people's health worldwide, its fast identification is essential for preventing disease spread and reducing mortality rates. The reverse transcription polymerase chain reaction (RT-PCR) is the primary leading method for detecting COVID-19 disease; it has high costs and long turnaround times. Hence, quick and easy-to-use innovative diagnostic instruments are required. According to a new study, COVID-19 is linked to discoveries in chest X-ray pictures. The suggested approach includes a stage of pre-processing with lung segmentation, removing the surroundings that do not provide information pertinent to the task and may result in biased results. The InceptionV3 and U-Net deep learning models used in this work process the X-ray photo and classifies them as COVID-19 negative or positive. The CNN model that uses a transfer learning approach was trained. Finally, the findings are analyzed and interpreted through different examples. The obtained COVID-19 detection accuracy is around 99% for the best models.
Keywords: Classifies, X-ray images, Lung segmentation, Classification, COVID-19, Transfer learning, InceptionV3
Introduction
The severe acute respiratory syndrome coronavirus 2 (SARS-CoV-2) causes COVID-19 infection [1] through the lungs of human beings. Initially, the occurrences of COVID-19 were discovered in Wuhan City, China, in December 2019 [2]. COVID-19 was designated as a pandemic on March 11, 2021, by the world health organization (WHO) [3]. As of May 8, 2022, over 514 million cases have been confirmed, and over 6 million deaths have been reported globally [4]. These diseases result in respiratory issues, which can be cured without specialized equipment or medicine. Regardless, underlying conditions such as cancer, respiratory problems, diabetes, and cardiovascular disease may aggravate the sickness [5].
Once infected, a patient with COVID may have various infection signs and symptoms, including cough, fever, and respiratory disease. The infection can result in respiratory problems, pneumonia, heart failure, and even death in severe cases. The health systems of several wealthy countries are at risk of collapsing due to the quick and incrementing number of instances of COVID-19. They are now experiencing a need for more testing kits and ventilators. Many nations have declared absolute lockdown and encouraged their people to remain indoors and avoid mass gatherings as much as possible.
Screening infected persons effectively so that infected patients may be diagnosed and cured is critical in eliminating COVID-19. RT-PCR is now the preferred approach for identifying it. Pathologies in COVID-19 are similar to those found in pneumonic illness. According to other research in medical imaging, diseases in the chest are apparent. A study found a link between RT-PCR and chest X-ray [6], while others investigated its relationship with X-ray chest pictures [7]. Attenuation or usual opacities are the commonplace results in these pictures, with ground glass opacification accounting for roughly fifty-seven percent of occurrences [8], even after the fact that professional radiologists can identify the visual features in such pictures. This diagnostic technique is unworkable when financial resources at small-scale medical facilities are limited and the number of patients continues to rise. The researchers feel that a chest X-ray-based system may be helpful in the fast detection, assessment, and treatment of COVID-19 cases. Recent artificial intelligence research, notably in deep learning (DL) methods, displays the effectiveness with which these algorithms function when implemented in medical images.
Luz et al. [42] proposed a deep artificial neural network, renowned for its excellent accuracy and small footprints, as the foundation for a new family of models. Verma et al. [43] achieve better results; the SVM model is layered on top of the VGG16 model. The SVM model uses the CNN model's in-depth feature evaluation for a multi-model classification approach. Gour and Jain [44] proposed a stacking generalization strategy that postulates that several CNN sub-models acquire various layers of semantic image representation and different non-linear discriminative characteristics. Mousavi et al. [45] proposed network can assist radiologists in quickly and accurately identifying COVID-19 and other lung infectious illnesses utilizing chest X-ray imagery. Agrawal and Choudhary [46] used a small dataset; this paper aims to present a deep convolutional neural network-based model for automatic COVID-19 recognition from chest radiographs.
This research aims to introduce a novel method for utilizing current DL models. It focuses on improving the pre-processing step to produce precise and trustworthy findings when categorizing COVID-19 from chest radiology pictures. A network is used in the pre-processing stage to segregate the images depending on the lateral or frontal projection. Then there are other typical processes to decrease data variability have been utilized, such as normalization, standardization, resizing, etc. After that, a U-Net segmentation model is applied to remove the lung area that includes the critical information while excluding the data that might lead to false findings [9].
Following the pre-processing stage comes the classification model (InceptionV3). Transfer learning is employed, which uses a large dataset like ImageNet to get pre-trained weights and enhances the network's performance and computation time learning procedure. At least ten times larger dataset was used in this study than the datasets employed in other papers. With current deep learning models, this research introduces a novel strategy. It emphasizes improving pre-processing to provide precise and trustworthy results when classifying COVID-19 from chest X-ray images.
The primary contradiction of the study:
A convolutional neural network (CNN) model was presented, which employs chest X-ray images for COVID-19 identification.
With current deep learning models, this research introduces a novel strategy.
The proposed model using transfer learning on weighted VGG16, VGG19, InceptionV3, and U-Net models was implemented.
We compare our models' accuracies, losses, and various other parameters.
The metrics and other parameters of the proposed model are then compared with the existing state-of-the-art approaches and studies.
The remainder of the study is organized as follows: Sect. 1, the methodology used for these approaches. Section 2 explains the literature survey; Sect. 3 the experiments and findings achieved; Sect. 4, a discussion of the products and lastly, the conclusions.
Literature Review
There are just a few substantial databases of COVID-19 X-ray pictures available at present and released to the public. Hence, the amount of literature covered for this purpose is considerably little. Cohen et al. [10] collection of COVID-19 image data is used as a basis in most published investigations. This was created using photographs from COVID-19 reports or papers and a radiologist to validate pathologies in the images obtained. Numerous tactics were used to deal with tiny datasets, such as data augmentation, transfer learning, or integrating disparate datasets. The fast growth of COVID-19 cases and the preciseness and performance of AI-based approaches in automated detection in the medical area have forced the development of an AI-based automatic diagnostic system. In recent times, many scholars have used X-ray pictures to detect COVID-19.
Wang et al. [11] present a COVID-19 detection DL network (COVID-Net) which showed an accuracy of 83.5 percent in identifying COVID-19 along with three other classes. Civit-Masot et al. [12] give good results using acVGG16 with 86% accuracy. It performs well in identifying COVID-19, but its accuracy decreases when classifying pneumonia. Ozturket al. [13] organize three classes, including COVID-19 with a dark covid net, on end-to-end architecture without using feature extraction. They obtained 87% accuracy, which is low.
Apostol Poulos et al. [14] enhanced the findings using a VGG19-mobile net with an accuracy of 97.8 percent but have not checked pre-COVID images. Jain et al. [15] used a ResNet101 with a 98.95 percent accuracy. Still, they have used a small dataset for their study, which needs to be improved for the detailed analysis of numerous variants. Also, the work done by Khan et al. [16] used CoroNet and an exception-based model and obtained an excellent accuracy percent; however, their model obtains high accuracy, and the dataset they used is small. Nasiri et al. [17] used DNN, XGBoost, and DenseNet169 techniques to take out and classify image features, respectively. In two-class and multiple-class issues, they achieved average accuracies of 98.24 percent and 89.70 percent, respectively. They obtained high performance but used an unbalanced dataset for their experimentation.
Narin et al. [18] used CXR images to classify COVID-19 patients and pneumonia patients using five pre-trained models: InceptionV3, ResNet152, ResNet101, ResNet50, and Inception-ResNetV2. Singh et al. [19] describe an enhanced depth-wise convolution neural network for analyzing X-ray pictures of the chest. Wavelet decomposition is used in the network to combine multi-resolution analysis. It has a 95.83 percent accuracy achieved. Though their model attains better accuracy, the dataset used was very small. Dasare et al. [20] developed a computer-aided diagnosis based on deep learning that takes a patient's chest radiology photos and classifies it as non-pneumonia or pneumonia. Over 5,000 X-ray pictures were used in developing and training the model.
As a consequence, it has a 96.66% achieved. However, this approach does not guarantee medical accuracy because the data is not real-time. Regression was used to validate the training loss and accuracy and validation loss and accuracy plots.
Yang et al. [21] apply a residual network-based image classification technique to chest X-rays, achieving an accuracy of more than 94 percent in COVID-19 identification. They have classified the images into three classes for better understanding. But they need to obtain higher performance. Shah et al. [22] present a convolutional neural network and recurrent gated unit-based, hybrid deep learning model for detecting viral infection from chest X-ray images. Though their model obtains high accuracy, their dataset is small, which takes a long training. Ezzoddin et al. [23] used a deep neural network-based technique to identify corona disease from X-ray images automatically. It extracts visual characteristics and classifies them using the DenseNet169 and light GBM algorithms. In two-class and multiple-class issues, they achieved average accuracies of 99.20 percent and 94.22 percent, respectively. But their approach needs to check pre-COVID images to understand the cause better. Malla and Alphonse [41] proposed different machine-learning methods to identify the COVID-19 tweets messages.
Figure 1 shows a sample image reconstruction from the BIMCV-COVID19 + dataset for a particular type of image. Some images lack a lung portion even though U-Net 1 achieved a higher value of showing a sample image reconstruction from the BIMCV-COVID19 + dataset for a particular type of image. Some images lack a lung portion even though U-Net 1 achieved a higher Interception value over the union. For some of the well-predicted positive and negative cases in parts c, d, and e of the experiment, respectively, Fig. 2 displays heat maps of the final layers.
Fig. 1.

U-Net mask reconstructions of specific pictures from the BIMCV COVID-19 + dataset [38]
Fig. 2.
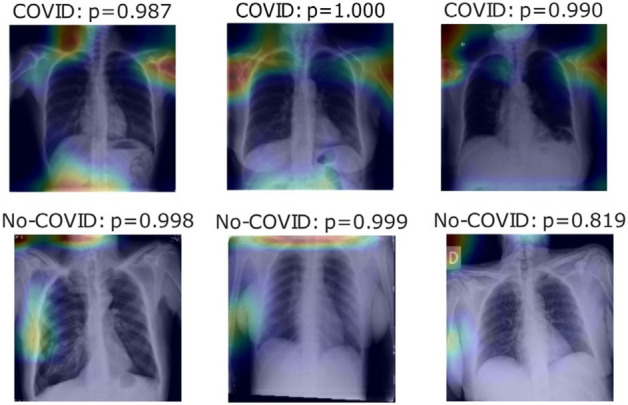
Heatmaps show the final layer in a few photographs for Experiment Part C experiment [38]
Anjum et al. [24] created a unique lightweight classification model for COVID-19 patients with a 97.33 percent accuracy. However, before it is ready for production, it must undergo extensive training and testing in the field on large datasets. Though they have implemented a lightweight model, they have considered limited training data. Some more details on CNN and its usage in various applications that are motivations to this work are detailed through research [48–51].
Though considerable research on the detection of COVID-19 using AI, etc., is available at present, there are still some limitations that need to be overcome. The primary research gaps and challenges are listed below.
Many studies use small datasets, which need to be improved to ensure their performance and accuracy on actual data.
Most studies only use standard chest X-ray images. So, there is a need to use segmented images for further improvement.
Many models take a lot of training and testing time, reducing the model's widespread usability.
Construction of the most significant X-ray image database for COVID-19 classification and experiments with the database. Thus, there is a need to use hybrid methods and multiple models further to improve the accuracy and reliability of the system.
The proposed method of this work processes photos and classifies them as COVID-19 negative or positive using current deep learning models (InceptionV3 & U-Net). A pre-processing stage involving lung segmentation is included in the proposed approach, eliminating the surrounding that does not provide essential information for the job and might lead to skewed outcomes. Hence, the CNN model was trained using the transfer learning approach. Further, the findings are analyzed and interpreted.
Proposed Methodology
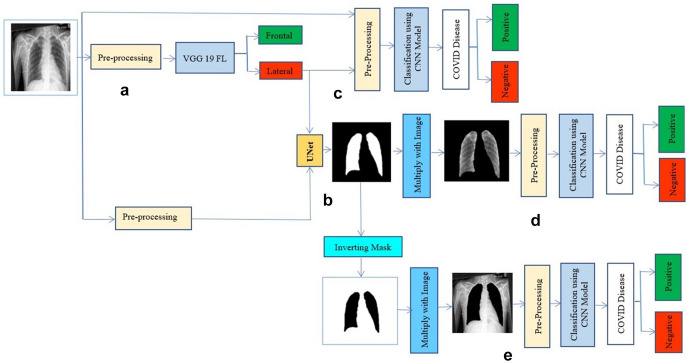
The proposed approach consists of 3 experiments that test the model’s performance and observe the impact of the various process stages. The process for each experiment is given in Fig. 3; the pre-processing layer is depicted in orange and consists of three steps: all photos should be resized to 224 by 224 pixels in a single channel (greyscale). The dataset utilized in each experiment is different. For COVID-positive cases, the same photos were utilized in all cases. Meanwhile, for negative situations, two separate datasets were employed. Experiments 1 and 2 evaluate positive vs. negative case datasets in that sequence, whereas Experiment 3 comprises photos from before the COVID-19 period (pictures between 2015 and 2017).
Fig. 3.
are an experiment figure in which a is the lateral and frontal classification, segmentation of lungs is represented by b, covid detection with normal photos is represented by c, and covid detection with the segmented pictures is represented by d, and e presents covid prediction without lungs in images
Datasets
Two different datasets were used at various stages of the experiment, as detailed in Sect. 3.1.1.
COVID-19 Classification Datasets
BIMCV-COVID [25, 26] and a dataset from the Spain pre-COVID period were utilized for training the classification models. The Valencia region's medical imaging databank has donated these datasets. We also employ two additional databases to compare these techniques to past work. Positive instances may be found in the Cohen et al. [10] COVID-19 image data collection dataset. Negative cases can be found in [27], available in [28].
Image Projection Filtration
The picture projections in the datasets of COVID-19 are labelled frontal and lateral, respectively. Given the discrepancy in the information available from the two perspectives and that not every patient had both views accessible, some mismatched labels were discovered during the human review, impacting model performance. A classification model was trained using a BIMCV-Pad chest dataset [29] containing 815 lateral images and 2481 frontal pictures. This methodology enabled us to quickly separate the frontal images from the COVID-19 datasets, which provide more info than lateral views. Finally, once filtered, the BIMCV-COVID19 + dataset containing positive images contains 12,802 frontal pictures for training COVID-19 classification models. In Experiment 1, 4610 negative frontal pictures were used from the BIMCV-COVID- dataset. This dataset needed to be more well-organized. Also, several of the images in this dataset were later proved to be COVID-19 positive. As a result of the false positives recognized by professionals, this data may result in a skewed or poor performance of the model trained. Experiment 2 employed a curated BIMCV-COVID-19. To minimize this defect, photos that correlated with the positive dataset were removed, resulting in a total of 1370 pictures being eliminated. Lastly, Experiment 3 employed photos gathered from European patients between 2015 and 2017 from a pre-COVID dataset. This dataset was received from BIMCV, although it has yet to be released. There are 5469 photos, 224 × 224 pixels in one channel (greyscale). Although it has not yet been released, this dataset was collected via BIMCV.
Lung Segmentation
Montgomery dataset [30] with 138 pictures, JSTR [31] with 240 images and NIH [32] with 100 images were utilized for lung segmentation training of the U-Net models. Despite the seeming lack of data, the volume and variety of the photos were sufficient to produce an effective model for segmentation.
Image Separation
For the classification task, the dataset was separated into three categories: train (60%), test (20%), and validation (20%). This split combination is one of the standard possible split combinations provided in [47]. All are based on clinical information to prevent having photos from the same individual in two distinct partitions, which might lead to model bias and overfitting. As a result, the following was the dataset distribution:
In this study, COVID-19 was diagnosed using X-ray pictures from two independent sources. Cohen JP [53] created a COVID-19 X-ray image database combining photos from other open-access sources. Researcher images from various places are posted in this database regularly. The COVID-19 database comprises 2480 X-ray pictures with COVID-19 diagnoses currently stored in the database. A few COVID-19 cases were taken from the database, and the experts' findings are shown in Fig. 2. Out of 2480 X-ray images, 1488, 496, and 496 for train, validation, and test partitions were used in the classification model to separate concepts based on lateral or frontal projection.
The BIMCV-COVID19 + dataset, which includes 2735 CXR pictures of COVID-19 patients obtained from digital X-ray (DX) and computerized X-ray (CX) equipment, is the largest available dataset. The COVID cases dataset contains 1286 photos for the train set, 96 for the test set, and 96 for the validation set to compare COVID-19 with earlier studies. Meanwhile, the BIMCV-COVID dataset is separated into 1549, 593, and 593 pictures for training, validation, and testing for the dataset of negative cases. The primary distinction between the COVID and non-COVID categories is the lung opacity in the CXR pictures caused by COVID-19 and other lung-related disorders, respectively.
Pre-processing
Since the pictures originate from various datasets with varying image sizes and collection settings, a pre-processing step is used to decrease or eliminate the impact of data variability on model performance. The BIMCV-Pad chest dataset, for example, was gathered from the same institution. COVID-19 files, on the other hand, contain photos mainly from the Valencia area of Spain and other portions of Spain and other European nations. On the other hand, the Montgomery and NIH segmentation datasets are based on photos from the United States. At the same time, the JSRT dataset is from Japan. This means that various X-ray equipment was utilized to capture the images, each with its technologies and resolutions. In Fig. 3, the pre-processing layer is depicted in orange and consists of 3 steps. With one channel, resize all photos to 224 × 224 pixels (grayscale). Equation (1) demonstrates the normalizing of datasets in the second stage, where x is the original picture, and P represents the normalized picture. Lastly, we standardized datasets using Eq. (2), with Q representing the standardized picture and P representing the normalized picture. When standardization was used, the data distribution in the validation and test sets was unified using the training set's mean and standard deviation (std).
| 1 |
| 2 |
Segmentation
This study utilizes a U-Net architecture [33]-based deep learning model. Previous research has shown that the U-Net design effectively segments medical pictures. The target is given to this model as a mask with one (1) in the reformation region and zeros (0) everywhere else. As a result, a chest X-ray picture is the model input, and the predicted mask is the output. To discover the best quantity of filters for this assignment, we evaluated three varying numbers of convolutional layer filters. The amount of contraction block filters are calculated using Eq. (3), where i is the number of contraction blocks, and F0 is the number of starting filters. Equation (4) specifies the amount of each expansion block: is the number of filters at the last contraction block, and i is the number of the corresponding expansion block. The transposed convolution layer employs the same filters as the expansion block's convolutional layers.
| 3 |
| 4 |
The models will be labelled as U-Net 1, U-Net 2, and U-Net 3, respectively, based on the F0 values of 16, 112, and 64.
Hyperparameters
With he-normal kernel initialization and padding, the kernel size in convolutional layers is 3 × 3. The pool size in the max-pooling layers is 2 × 2. Dropout rates are 0.1 in the first and second expansion and contraction blocks, 0.2 in the third and fourth, and 0.3 in the fifth contraction block. Kernel size is 2 × 2, strides are 2 × 2, and padding is the same in transposed convolutional layers. Finally, the final convolutional layer uses a single filter and a kernel size of 1 × 1.
Classification
This study is divided into two classification approaches. The first is to distinguish between lateral and frontal chest X-ray pictures. The 2nd is to tell the difference between COVID-19 negative and positive situations. VGG16, VGG19 [34], and InceptionV3 deep learning models were employed for both challenges. The networks were trained using pre-learned weights from the ImageNet dataset [35] using transfer learning [36]. These were trained to predict over 1000 classes using millions of photos. Using pre-trained models allows a new model to converge quicker and perform better on a smaller dataset using characteristics learned on a more extensive dataset [37]. The Tensor flow + Keras library provides pre-trained models, weights derived from three channels of pictures, and X-ray info in a single track. The RGB values were converted from three channels to one medium using Blue- 0.1140, Green- 0.5870, and Red- 0.2989.
Steps:
Import libraries (pandas, NumPy, Keras, etc.).
Define useful methods and functions:
def metrics (Y_validation, predictions, log_dir, model_name)defplot_graphs (history, metric, log_dir, model_name)defmin_max_preprocessing (images, labels)def ROC_PRC (models, weight_path, X_test, y_test, file_name)
-
3.
Import and declare models:def get_model_InceptionV3()def get_model_VGG19_gray ()
-
4.InceptionV3 FL:
- Prepare X-train, X_test, Y_train and Y_test dataset.
- Train the models up to 30 epochs.
- Separate datasets into frontal and lateral x-rays using a trained model.
-
5.U-net:
- Prepare the dataset of X-rays and their masks in X_train and Y_train.
- Train the models up to 100 epochs.
- Use the model to generate masks of the Covid19 dataset x-rays.
- Combine the predicted masks and original x-rays to create segmented images.
-
6.InceptionV3 COVID:
- For all experiments i
Load the datasets.
Perform min–max pre-processing and std normalization.
Train the models.
Save the weights and metrics.
-
b)
Generate result tables and plot graphs.
Result and Performance Evaluation
Experimental Setup
We look at the planned infrastructure in this area and present numerical facts and analysis. An InceptionV3 model filters the information in components ‘a’ of Fig. 3. If an X-ray picture of the chest is frontal or lateral, this model will be called InceptionV3 FL to differentiate it from the other models. Part ‘b’ included utilizing a U-Net model to separate the lungs, but only with pictures designated as frontal in the previous step. In parts ‘c’ and ‘d’, an InceptionV3 classification model was employed to check COVID-19 negative and positive instances. To distinguish it from the previous models, we name it InceptionV3 COVID. The records went through the classification procedure without lung segmentation in version c. Part b's estimated mask is multiplied by the original pictures in variation d; after that, use the InceptionV3 COVID classifier to categorize the segmented images; we can measure the relevance of the segmentation stage using these two versions, by providing the model with whole or partial information and determining which picture component contributes to the prediction.
Hardware and Software
This app was built with Python 3.8.1. Every model was built with Kera’s library and TensorFlow 2.2.0. For the majority of the trials, we used Google Collaboratory. The Tensor Processor Unit (TPU) was utilized in this scenario when possible. Otherwise, depending on the Collaboratory assignment, we employed the Graphic Processor Unit (GPU). For all instances total RAM available is 12.72 GB. Heatmaps for correct predictions in the COVID and No-COVID scenarios are shown in Figs. 4, 5, respectively, for parts d and e.
Fig. 4.
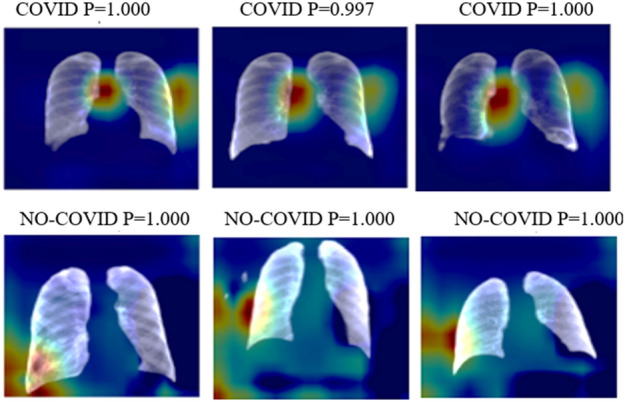
Heatmaps of the final layer in some images for the part d experiment
Fig. 5.
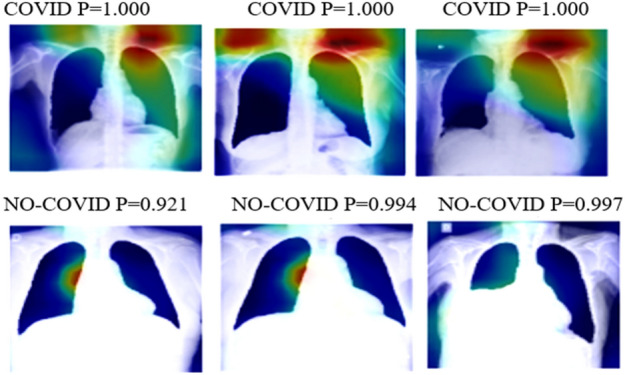
Heatmaps of the final layer in some images for part e experiment
InceptionV3 FL
The BIMCV-COVID two different databases were manually labelled to filter frontal and lateral pictures. The VGG16, VGG19, and InceptionV3 models were used in the tests, with the ImageNet dataset, which is already trained. The accuracy for these trials is shown in Table 1. With the best findings, InceptionV3 was chosen as the model for the remainder of the Experiment diagram. With a batch size of 64, every model was trained for 30 epochs.
Table 1.
Part A model accuracy
| Models | Training | Validation | Testing |
|---|---|---|---|
| VGG16 | 0.942 | 0.9 | 0.886 |
| VGG19 | 0.972 | 0.959 | 0.95 |
| InceptionV3 | 0.992 | 0.987 | 0.969 |
U-Net
Utilizing a combination of 3 datasets, a U-Net model was used to segment the lungs. Three alternative models were utilized. As discussed in segmentation (Sect. 3.4), each U-Net in its convolutional layer has a different filter number. Table 2 lists the Intersection over Union (IoU) and Dice values for assessing lung segmentation jobs for every model. Every model was trained for 100 epochs. These traits are only sometimes employed, as shown in Fig. 2. The results of Part E are comparable to those of the prior experiment, which excluded the lung zones missing from the immediate surroundings. The substantial lungs section is the focus of part D heatmaps for prediction, in contrast to the results of Experiment 1. As demonstrated by No-COVID photos, the model concentrates on images outside the lung area because there is no pertinent information inside; as a result, in these situations, the model focuses on lung pathologies. All the following procedures were performed using U-Net 3.
Table 2.
IoU and Dice coefficient for part b U-Net models
| Models | IoU | Dice | ||
|---|---|---|---|---|
| Training | Validation | Training | Validation | |
| U-Net 1 | 0.959 | 0.94 | 0.984 | 0.962 |
| U-Net 2 | 0.952 | 0.915 | 0.978 | 0.959 |
| U-Net 3 | 0.955 | 0.923 | 0.981 | 0.96 |
InceptionV3 COVID
COVID-19 case prediction was achieved for each of the three variants by picking the best model from VGG16, VGG19, and InceptionV3. Our model has been trained for 30 epochs, each having a batch size of 64.
Performance Evaluation
Experiment 1
The findings of section c, which shows data that has yet to be segmented, are presented in Table 3. Table 4 represents the results calculated in lung segmentation on this data for part d. VGG16, VGG19, and InceptionV3 were the models used in the tables above. Table 5 and Table 6 show the COVID-19 label of parts c and d accuracy, precision, recall, and with a P 0.5 F1 score. To forecast COVID-19 positive and negative cases, sections c, d, and e used a VGG16 and VGG19 classification model. We refer to the VGG16 and VGG19 COVID models to distinguish them from the other VGG16 and VGG19 models. The datasets underwent classification in variation c without lung segmentation. In variation d, the segmented images were fed through the VGG16 and VGG19 COVID classifier after being multiplied with the anticipated mask from part b and the original images. These three variations allowed us to evaluate the significance of the segmentation stage by providing the model with full or partial information and examining which part of the images contributes to the prediction. Finally, in variation e, the mask from part b was inverted and applied to the original images to be passed through VGG16 and VGG19 COVID classifiers.
Table 3.
Experiment 1 part c model accuracy
| Models | Training | Validation | Testing |
|---|---|---|---|
| VGG16 | 0.941 | 0.832 | 0.8 |
| VGG19 | 0.939 | 0.908 | 0.873 |
| InceptionV3 | 0.992 | 0.928 | 0.911 |
Table 4.
Experiment 1 part d model accuracy
| Models | Training | Validation | Testing |
|---|---|---|---|
| VGG16 | 0.969 | 0.909 | 0.858 |
| VGG19 | 0.978 | 0.913 | 0.89 |
| InceptionV3 | 0.994 | 0.933 | 0.919 |
Table 5.
Experiment 1 part c Performance metrics in COVID-19 label
| Models | Accuracy | Recall | Precision | F1-Score |
|---|---|---|---|---|
| VGG16 | 0.827 | 0.827 | 0.821 | 0.823 |
| VGG19 | 0.888 | 0.888 | 0.901 | 0.891 |
| InceptionV3 | 0.93 | 0.93 | 0.936 | 0.931 |
Table 6.
Experiment 1 part d Performance metrics in COVID-19 label
| Models | Accuracy | Recall | Precision | F1-Score |
|---|---|---|---|---|
| VGG16 | 0.917 | 0.916 | 0.915 | 0.916 |
| VGG19 | 0.915 | 0.915 | 0.914 | 0.913 |
| InceptionV3 | 0.938 | 0.937 | 0.936 | 0.937 |
Figure 6 shows the receiver operating characteristic (ROC) graph for part c, whereas the precision-recall (PR) curve for part c is presented in Fig. 7. The ROC curve for part d is displayed in Fig. 7, while the precision-recall curve for part d is given in Fig. 8.
Fig. 6.
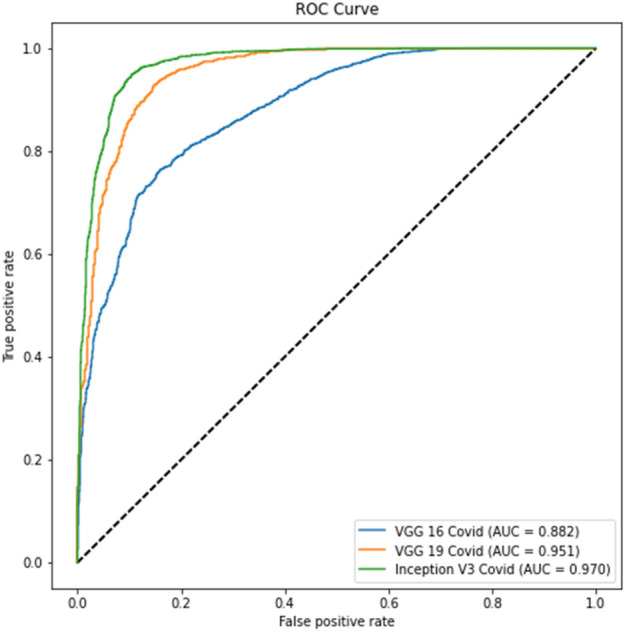
Experiment 1 part c ROC curve
Fig. 7.
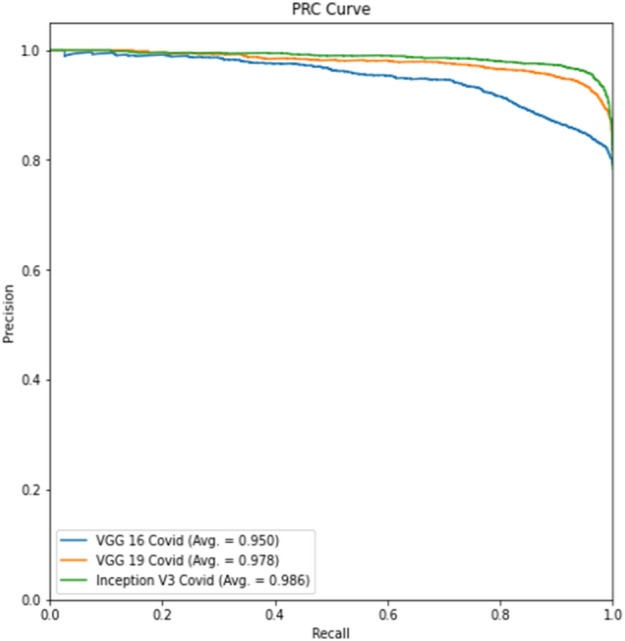
Experiment 1 part c Precision-Recall curve
Fig. 8.
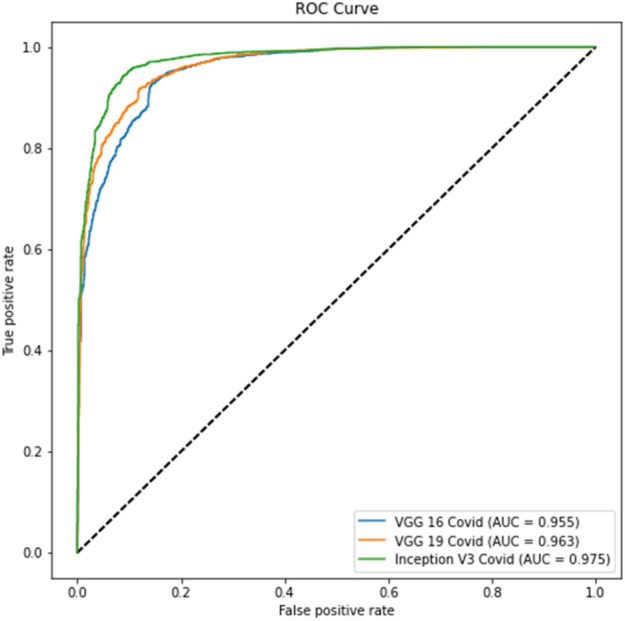
Experiment 1 part d ROC curve
Tables 4 and 6 show better results than Tables 3 and 5. Similarly, Fig. 6 displays the Receiver Operating Characteristic (ROC) curve for part c for the remaining thresholds, and Fig. 7 displays the precision-recall curve for the same parts for Experiment 1. The ROC curve of part d for the remaining criteria is shown in Fig. 8. The precision-recall curve for the same parts is shown in Fig. 9. In the meanwhile, both images are for Experiment 2. This indicates that lung segmentation is practical and improves the performance of models. Also, the InceptionV3 model shows the best performance among all the models.
Fig. 9.
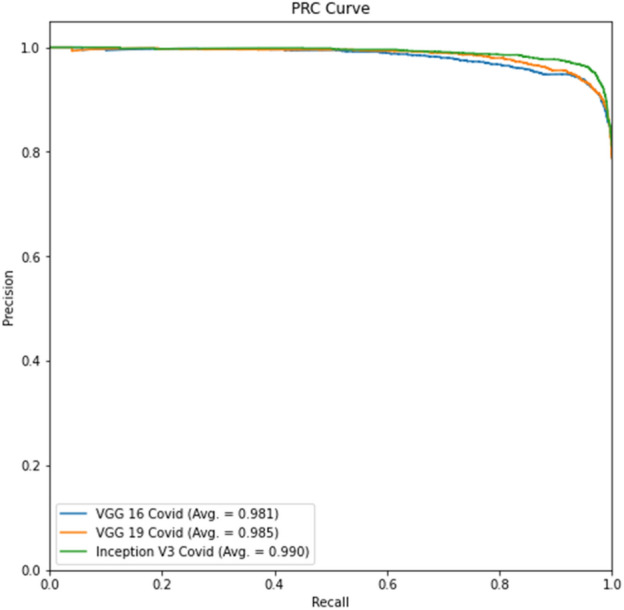
Experiment 1 part d Precision-Recall curve
Experiment 2
The findings of section c, which shows data that has yet to be segmented, are shown in Table 7. Table 8 represents the results of lung segmentation on this data for part d. VGG16, VGG19, and InceptionV3 were the models used in the tables above. To forecast COVID-19 positive and negative cases, sections c, d, and e used a VGG16 and VGG19 classification model. We refer to the VGG16 and VGG19 COVID models to distinguish them from the other VGG16 and VGG19 models. We explained the detailed analysis in Experiment 1 above.
Table 7.
Experiment 2 part c model accuracy
| Models | Training | Validation | Testing |
|---|---|---|---|
| VGG16 | 0.908 | 0.854 | 0.825 |
| VGG19 | 0.927 | 0.920 | 0.903 |
| InceptionV3 | 0.995 | 0.943 | 0.938 |
Table 8.
Experiment 2 part d model accuracy.
| Models | Training | Validation | Testing |
|---|---|---|---|
| VGG16 | 0.964 | 0.876 | 0.844 |
| VGG19 | 0.969 | 0.928 | 0.907 |
| InceptionV3 | 0.996 | 0.950 | 0.939 |
Tables 9 and Table 10 show the COVID-19 label of parts c and ds accuracy, precision, recall, and with a 0.5 F1 score.
Table 9.
Experiment 2 part c Performance metrics in COVID-19 label
| Models | Accuracy | Recall | Precision | F1-Score |
|---|---|---|---|---|
| VGG16 | 0.838 | 0.838 | 0.856 | 0.845 |
| VGG19 | 0.925 | 0.926 | 0.923 | 0.924 |
| InceptionV3 | 0.951 | 0.951 | 0.952 | 0.951 |
Table 10.
Experiment 2 part d Performance metrics in COVID-19 label
| Models | Accuracy | Recall | Precision | F1-Score |
|---|---|---|---|---|
| VGG16 | 0.882 | 0.882 | 0.889 | 0.885 |
| VGG19 | 0.932 | 0.932 | 0.931 | 0.931 |
| InceptionV3 | 0.956 | 0.956 | 0.955 | 0.955 |
The ROC curve for part c is displayed in Fig. 10, whereas the precision-recall curve for part c of Experiment 2 is presented in Fig. 11. The ROC curve for part d is depicted in Fig. 12, while the precision-recall curve for part d is given in Fig. 13.
Fig. 10.
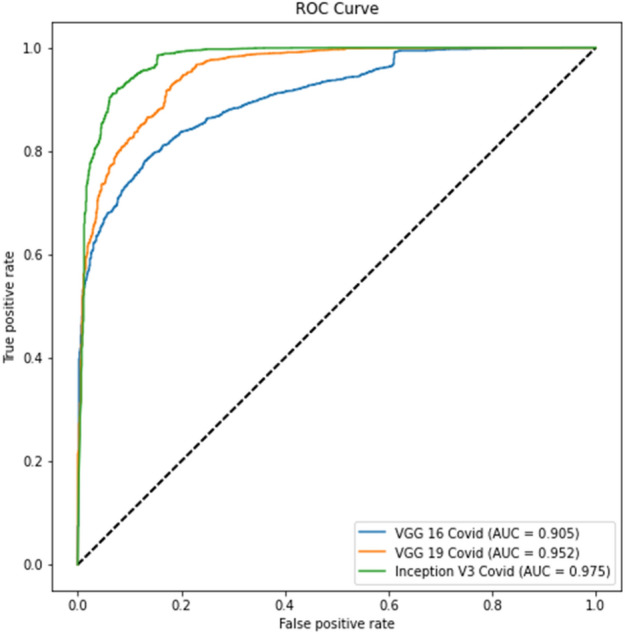
Experiment 2, Part c ROC curve
Fig. 11.
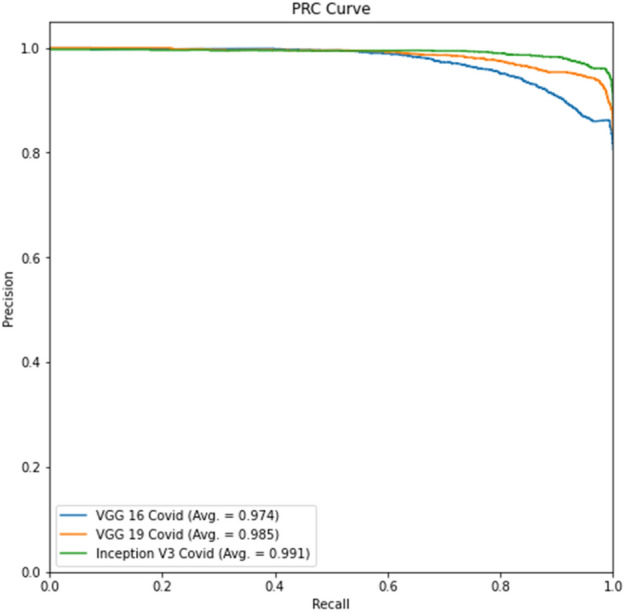
Experiment 2, Part c Precision-Recall curve
Fig. 12.
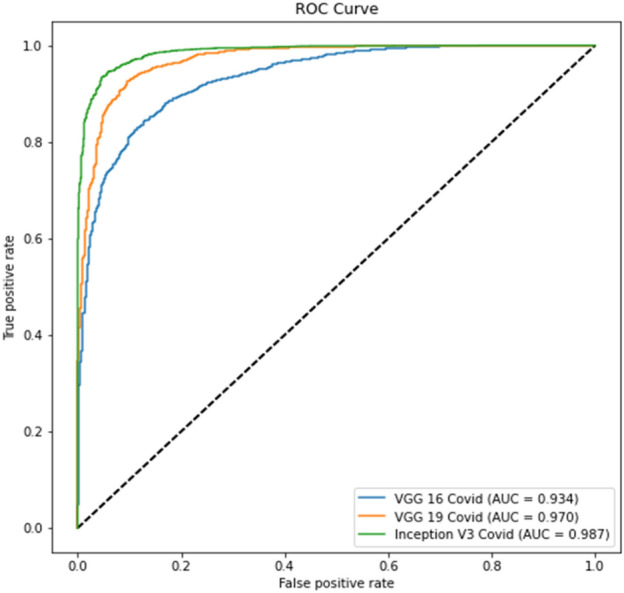
Experiment 2, Part d ROC curve
Fig. 13.
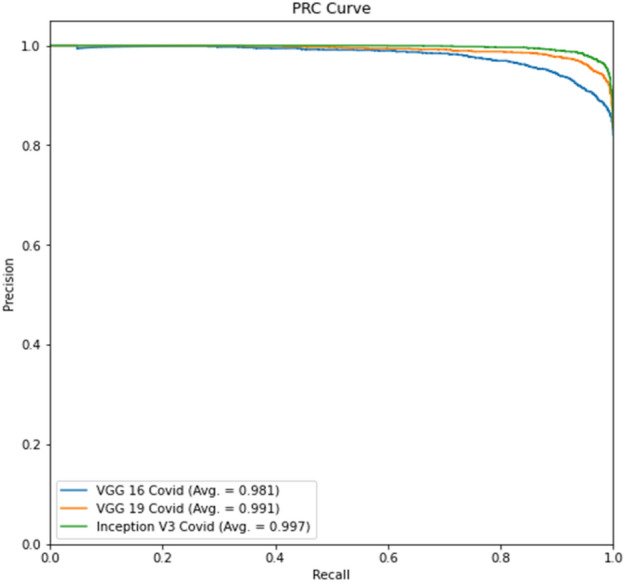
Experiment 2, Part d Precision-Recall curve
The tables for part d show better results than part c due to lung segmentation. Also, the ROC and PRC curves of part d have a greater area under the curve. There is a performance gain to Experiment 1 results which shows that a curated dataset can improve performance.
Experiment 3
The findings of section c, which shows data that has yet to be segmented, are displayed in Table 11. Table 12 represents the results of lung segmentation on this data for part d. VGG16, VGG19, and InceptionV3 were the models used in the tables above. Tables 13 and Tables 14 show the COVID-19 label of parts c and d accuracy, precision, recall, and with a 0.5 F1 score. To forecast COVID-19 positive and negative cases, sections c, d, and e used a VGG16 and VGG19 classification model. We refer to the VGG16 and VGG19 Covid models to distinguish them from the other VGG16 and VGG19 models. We explained the detailed analysis in experiment 1 above.
Table 11.
Experiment 3-part c model accuracy
| Models | Training | Validation | Testing |
|---|---|---|---|
| VGG16 | 0.967 | 0.884 | 0.84 |
| VGG19 | 0.972 | 0.915 | 0.893 |
| InceptionV3 | 0.994 | 0.865 | 0.858 |
Table 12.
Experiment 3-part d model accuracy
| Models | Training | Validation | Testing |
|---|---|---|---|
| VGG16 | 0.978 | 0.917 | 0.905 |
| VGG19 | 0.977 | 0.937 | 0.919 |
| InceptionV3 | 0.998 | 0.948 | 0.923 |
Table 13.
Experiment 3-part c performance metrics in COVID-19 label
| Models | Accuracy | Recall | Precision | F1-Score |
|---|---|---|---|---|
| VGG16 | 0.816 | 0.816 | 0.82 | 0.796 |
| VGG19 | 0.914 | 0.912 | 0.913 | 0.912 |
| InceptionV3 | 0.865 | 0.866 | 0.87 | 0.867 |
Table 14.
Experiment 3-part d performance metrics in COVID-19 label
| Models | Accuracy | Recall | Precision | F1-Score |
|---|---|---|---|---|
| VGG16 | 0.915 | 0.916 | 0.92 | 0.917 |
| VGG19 | 0.936 | 0.935 | 0.933 | 0.938 |
| InceptionV3 | 0.95 | 0.949 | 0.945 | 0.953 |
The ROC curve for part c is displayed in Fig. 14, whereas the precision-recall curve for part c of Experiment 3 is presented in Fig. 15. The ROC curve for part d is depicted in Fig. 14, while the precision-recall curve for part d is given in Fig. 17.
Fig. 14.
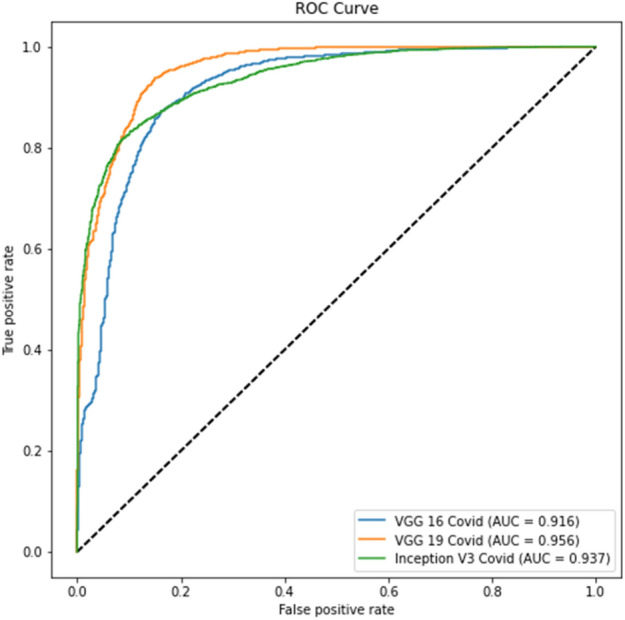
Experiment 3, Part c ROC curve
Fig. 15.
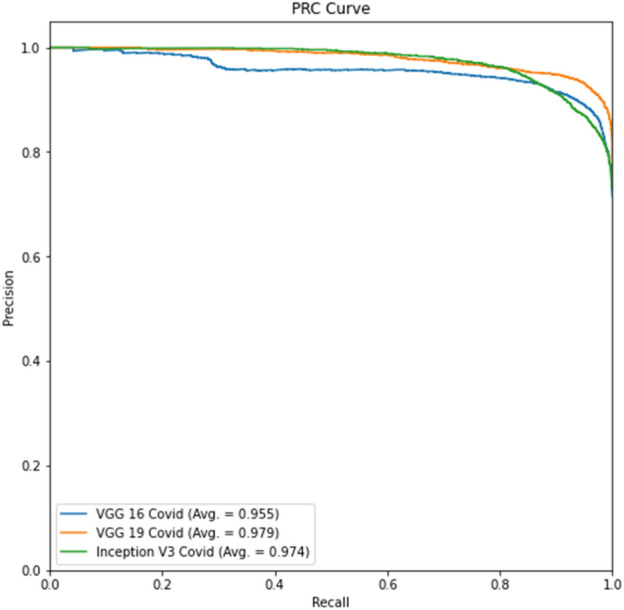
Experiment 3, Part c Precision-Recall curve
Fig. 17.
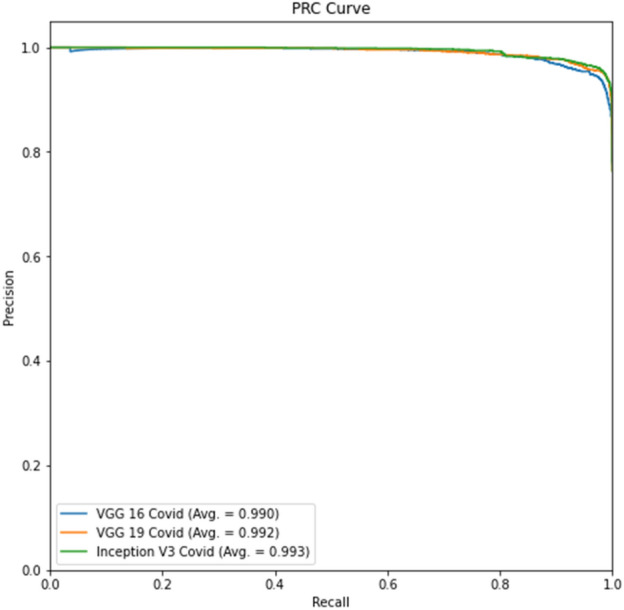
Experiment 3, part d Precision-Recall curve
Tables 12, 14 show better results than Tables 11 and 13. Similarly, Fig. 16 and Fig. 17 show better results than Fig. 14 and Fig. 15. This indicates that lung segmentation is practical and improves the performance of models. The results show the same trend as Experiment 2.
Fig. 16.
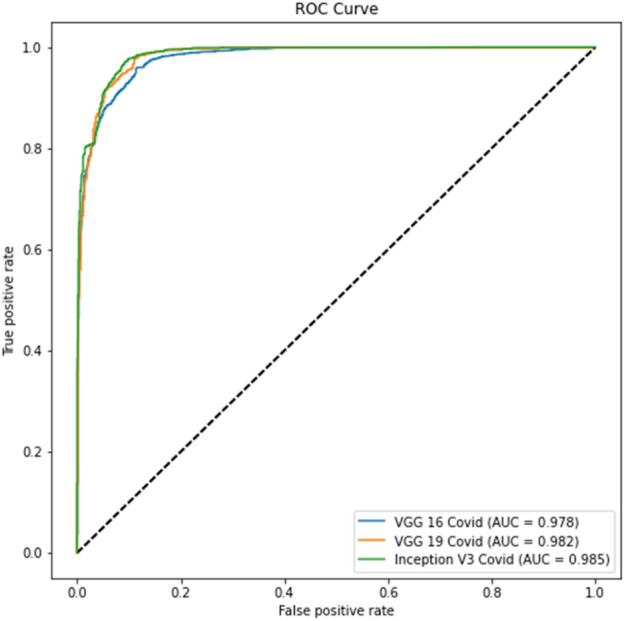
Experiment 3, part d ROC curve
Discussion
The model InceptionV3 produced higher outcomes for the categorization tasks provided in this research. The initial classification assignment was required to separate data since this was a genuine issue within the datasets, and manual pre-processing became unmanageable as the datasets grew in size. More than that, it's an excellent tool for preventing lateral Chest X-ray pictures from being fed into the model's training. It's fair to state that this categorization does not protect you against errors in images that are not lateral or frontal chest X-rays.
Following the experiment order in the initial study, it can be shown that for Experiment 1, Table 4 shows better results than Table 3, indicating that lung segmentation is effective. Because there are no pictures of the lungs in this scenario, models must rely on other image attributes to categorize the disease. The positive label of COVID-19 is more accurate for all sections, as demonstrated in Tables 5 and 6. On average, these models have more negative than positive mismatches. The ROC curve and Precision-Recall curve help to improve accuracy. Tables 3 and 4 demonstrate that the performance is better when component d continuously leads when a different threshold is used. Images for part c, watch the model categorize anything other than the lungs; instead of being beneficial for other applications, these types are rendered useless for this categorization assignment. Because correlation examples in the negative dataset are connected to the positive dataset in these tests, the model needs help detecting them. These can also cause mismatch forecasts for photos from outside datasets. To address these issues, correlation examples from the negative dataset were removed and placed in Experiment 2.
In virtually all studies, Experiment 2 produces better classification results than Experiment 1. The positive label of COVID-19 accuracy exhibits the identical pattern as the prior trial. The model mismatched more No-COVID patients. Compared to the previous experiment, the Precision-Recall and ROC curves have improved.
Finally, Experiment 3 depicts an incidence from the pre-2020 period in this paradigm. The first two tables depict distinct data from trials 1 and 2 with the same trend. As a result, segmentation improves categorization. In some circumstances, even the COVID-19 label's accuracy is superior in lung segmentation pictures. ROC and Precision-Recall curves, on the other hand, exhibit exceptional results for part c experiments, suggesting that they can perform better with a different threshold. The first experiment model incorporates information from within and outside the lungs to depict bias noise testing in other photos.
Experiments show how segmentation aids the model's focus on relevant data in general. Because lung features and distribution vary between datasets, the segmentation process offers shape and size information to sections d. As a result, just segmenting the lungs draws attention to essential characteristics in the photos, allowing for improved categorization. It is worth noting that lung segmentation is not always accurate, and tiny lung portions can result in certain circumstances. U-Net 3, the segmentation model utilized in all tests, is the same as the architecture described in the original study.
Finally, Table 15 compares our progress to that of other past studies. The findings are better when similar circumstances are used, as demonstrated. Meanwhile, it is a significant announcement that we now have more photographs since the Cohen dataset grew as a result of past efforts. The standard and pneumonia datasets exhibit a similar pattern; the photos were chosen randomly. Our model gives much better results due to segmented images and pre-processing of X-rays, which enhances model performance.
Table 15.
Comparison of performance metrics between a proposed model with other methods
Table 15 represents a compression of proposed and existing models and examined their accuracy results. To analyze the model performance, we have used two different datasets, that are COVID-19 and BIMCV-Padchest datasets. The COVID-19 classification model, the positive cases dataset, has 2480 chest X-ray scan samples collected from various repositories, out of which 1488 were used for training and 992 for validation and testing. Secondly, the BIMCV-COVID-19 dataset was curated; there were 1549 images, 593, and 593 for the train, test, and validation sets. The following datasets were used in earlier studies, and our analysis was also used in COVID-19 [14, 16, 39 & 40] and BIMCV-COVID-dataset [38]. This research does not claim medical accuracy and mainly considers potential classification schemes for COVID-19-infected patients.
Conclusion and Future Scope
This method demonstrates how existing models may be helpful in various tasks, even when the improved U-Net model performance still needs to be improved. The effects of visual noise on a model bias are also demonstrated. Most measures show that photos without segmentation are superior for identifying COVID-19 illness. Further investigation reveals that these models are still predicated on observable diseases across the lungs as unequivocal proof of COVID-19, even if the measures are improved. As a result, accurate models must focus on lung sections for the classification model. Segmentation is required to ensure consistent findings by decreasing bias. This approach requires between 20 and 30 epochs to train classification models. With no transfer learning, the segmentation models require around 200 epochs. A set of models were provided with an average of 95.20% accuracy in detecting COVID-19 in Chest X-ray pictures, categorizing COVID and no COVID images. However, with a threshold of 0.5 to 0.6, the approach has 98.34% accuracy for the COVID label in the testing dataset. The proposed model's accuracy improves by 99% with a threshold of 0.5. Consequently, the application of automated high-accuracy solutions based on AI can help doctors diagnose COVID-19. Despite the fact that the right course of treatment cannot be determined solely by an X-ray image, an initial screening of the cases would be beneficial for the prompt application of quarantine measures in the case of positive samples pending a more thorough examination, a particular course of treatment, or a follow-up procedure.
In all of the studies, the segmentation job demonstrates a high likelihood of delivering more information to part d, resulting in better outcomes by segmenting lungs and removing noise. Due to noise bias, future applications that employ models have more chance of mislabelling photographs without lungs. To verify that noise is not a cause of bias, more research is needed to differentiate diseases detected by expert radiologists. The results presented only sometimes suggest similar outcomes across all datasets. Primary datasets, for example, originate from European patients. Other patients worldwide may have minor data capture errors or disorders, necessitating a more accurate classification using global databases. Gender separation of the dataset will give you more info about the model's capabilities. If there is a bias in the model's prediction, it needs to be clarified because soft tissues may cover sections of the lungs in the chest.
Funding
It is not funded by any agency/organization, either technically or financially.
Data availability
The data supporting this study's findings are available on request from the corresponding author. The data are not publicly available due to privacy or ethical restrictions.
Declarations
Conflict of interest
All authors have participated in (a) conception and design, analysis, and interpretation of the data; (b) drafting the article or revising it critically for important intellectual content; and (c) approval of the final version. This manuscript has not been submitted to, nor is it under review at, another journal or other publishing venue. The authors have no affiliation with any organization with a direct or indirect financial interest in the subject matter discussed in the manuscript. The authors declare no potential conflict of interest.
Footnotes
Publisher's Note
Springer Nature remains neutral with regard to jurisdictional claims in published maps and institutional affiliations.
Contributor Information
Aman Gupta, Email: amang234284@gmail.com.
Shashank Mishra, Email: mishra1999shashank@gmail.com.
Sourav Chandan Sahu, Email: souravchandansahu71234@gmail.com.
Ulligaddala Srinivasarao, Email: ulligaddalasrinu@gmail.com.
K. Jairam Naik, Email: jnaik.cse@nitrr.ac.in.
References
- 1.Zhang W. Imaging changes of severe COVID-19 pneumonia in advanced stage. Intensive Care Med. 2020;46(5):841–843. doi: 10.1007/s00134-020-05990-y. [DOI] [PMC free article] [PubMed] [Google Scholar]
- 2.Xu Y, Li X, Zhu B, Liang H, Fang C, Gong Y, Guo Q, Sun X, Zhao D, Shen J, Zhang H, Liu H, Xia H, Tang J, Zhang K, Gong S. Characteristics of pediatric SARS-CoV-2 infection and potential evidence for persistent fecal viral shedding. Nat. Med. 2020;26(4):502–505. doi: 10.1038/s41591-020-0817-4. [DOI] [PMC free article] [PubMed] [Google Scholar]
- 3.Ducharme, J.. The WHO just declared coronavirus COVID-19 a pandemic | time. https://time.com/5791661/who-coronavirus-pandemic-declaration/ (Visited: 20/04/2022) (2020)
- 4.Worldometer . Coronavirus update (live): 55,912,871 cases and 1,342,598 deaths from COVID-19 virus pandemic - worldometer. https://www.worldometers.info/coronavirus/ (Visited: 20/04/2022). (2020)
- 5.World Health Organization. Coronavirus. https://www.who.int/health-topics/coronavirus#tab=tab_1 (Visited: 20/04/2022). (2020)
- 6.Ai T, Yang Z, Hou H, Zhan C, Chen C, Lv W, Tao Q, Sun Z, Xia L. Correlation of chest CT and RT-PCR testing for coronavirus disease 2019 (COVID-19) in China: a report of 1014 cases. Radiology. 2020;296(2):E32–E40. doi: 10.1148/radiol.2020200642. [DOI] [PMC free article] [PubMed] [Google Scholar]
- 7.Kanne JP, Little BP, Chung JH, Elicker BM, Ketai LH. Essentials for radiologists on COVID-19: an update—radiology scientific expert panel. RSNA. 2020;78(May):1–15. doi: 10.1148/radiol.2020200527. [DOI] [PMC free article] [PubMed] [Google Scholar]
- 8.Kong, W., Agarwal, P. P. Chest imaging appearance of COVID-19 infection. Radiology: Cardiothoracic Imaging, 2(1), Article e200028. (2020) [DOI] [PMC free article] [PubMed]
- 9.De Informática, I. T. . Early detection in chest images informe de ‘‘in search for bias within the dataset’’. ITI. (2020)
- 10.Cohen, J. P., Morrison, P., & Dao, L. COVID-19 image data collection. ArXiv, arXiv:2003.11597. (2020)
- 11.L. Wang, A. Wong, COVID-Net: A Tailored Deep Convolutional Neural Network Design for Detection of COVID-19 Cases from Chest Radiography Images. arXiv preprint arXiv:2003.09871. 2020 [DOI] [PMC free article] [PubMed]
- 12.Civit-Masot, J., Luna-Perejón, F., Morales, M. D., Civit, A. . Deep learning system for COVID-19 diagnosis aid using X-ray pulmonary images. Applied Sciences (Switzerland), 10 (13). (2020)
- 13.Ozturk, T., Talo, M., Yildirim, E. A., Baloglu, U. B., Yildirim, O., Rajendra Acharya, U. Automated detection of COVID-19 cases using deep neural networks with X-ray images. Computers in Biology and Medicine, 121, Article 103792. (2020) [DOI] [PMC free article] [PubMed]
- 14.Apostolopoulos ID, Mpesiana TA. Covid-19: automatic detection from Xray images utilizing transfer learning with convolutional neural networks. Phys Eng Scie Med. 2020;43(2):635–640. doi: 10.1007/s13246-020-00865-4. [DOI] [PMC free article] [PubMed] [Google Scholar]
- 15.Jain G, Mittal D, Thakur D, Mittal MK. A deep learning approach to detect Covid-19 coronavirus with X-Ray images. Biocybernetics Biomed Eng. 2020;40(4):1391–1405. doi: 10.1016/j.bbe.2020.08.008. [DOI] [PMC free article] [PubMed] [Google Scholar]
- 16.Khan, A. I., Shah, J. L., Bhat, M. M.:CoroNet: A deep neural network for detection and diagnosis of COVID-19 from chest x-ray images. Computer Methods and Programs in Biomedicine, 196, Article 105581. (2020) [DOI] [PMC free article] [PubMed]
- 17.Nasiri, Hamid, Hasani, Sharif: Automated detection of COVID-19 cases from chest X-ray images using deep neural network and XGBoost. (2021) [DOI] [PMC free article] [PubMed]
- 18.A. Narin, C. Kaya and Z. Pamuk, “Automatic detection of coronavirus disease (covid-19) using x-ray images and deep convolutional neural networks’, Pattern Anal. Appl., pp. 1–14, 2021. [DOI] [PMC free article] [PubMed]
- 19.Singh KK, Singh A. Diagnosis of COVID-19 from chest X-ray images using wavelets-based depthwise convolution network. Big Data Mining Analyt. 2021;4(2):84–93. doi: 10.26599/BDMA.2020.9020012. [DOI] [Google Scholar]
- 20.A. Dasare and H. S, "Covid19 Infection Detection and Classification Using CNN On Chest X-ray Images," 2021 IEEE International Conference on Distributed Computing, VLSI, Electrical Circuits and Robotics (DISCOVER), 2021, 10.1109/DISCOVER52564.2021.9663614.
- 21.X. Yang, P. Li and Y. Zhang, “Classification network of Chest X-ray images based on residual network in the context of COVID-19,” 2022 IEEE 2nd International Conference on Power, Electronics and Computer Applications (ICPECA), 2022, 10.1109/ICPECA53709.2022.9719204.
- 22.Shah PM, et al. Deep GRU-CNN model for COVID-19 detection from chest X-Rays data. IEEE Access. 2022;10:35094–35105. doi: 10.1109/ACCESS.2021.3077592. [DOI] [PMC free article] [PubMed] [Google Scholar]
- 23.Ezzoddin M, Nasiri H, Dorrigiv M. Diagnosis of COVID-19 cases from chest X-ray images using deep neural network and LightGBM. Internat Conference Machine Vision Image Proces (MVIP) 2022;2022:1–7. doi: 10.1109/MVIP53647.2022.9738760. [DOI] [Google Scholar]
- 24.T. Anjum, T. E. Chowdhury, S. Sakib and S. Kibria, “Performance Analysis of Convolutional Neural Network Architectures for the Identification of COVID-19 from Chest X-ray Images,” 2022 IEEE 12th Annual Computing and Communication Workshop and Conference (CCWC), 2022, 10.1109/CCWC54503.2022.9720862.
- 25.Vayá, M. d. l. I., Saborit, J. M., Montell, J. A., Pertusa, A., Bustos, A., Cazorla, M., Galant, J., Barber, X., Orozco-Beltrán, D., García-García, F., Caparrós, M., González, G., Salinas, J. M: BIMCV Covid-19+: a large annotated dataset of RX and CT images from COVID-19 patients. (pp. 1–22). ArXiv, arXiv:2006.01174. (2020)
- 26.Medical Imaging Databank of the Valencia region BIMCV (2020). BIMCV-Covid19 – BIMCV. bimcv.cipf.es/bimcv-projects/bimcv-covid19/1590859488150-48be708-c3f3 (Visited: 20/04/2022).
- 27.Daniel Kermany, A. S., Goldbaum, M., Cai, W., Anthony Lewis, M., Xia, H., Zhang Correspondence, K. (2018). Identifying medical diagnoses and treatable diseases by image-based deep learning. Cell, 172. [DOI] [PubMed]
- 28.COVID-19 X rays. Kaggle. https://www.kaggle.com/andrewmvd/convid19-Xrays (Visited: 20/04/2022). (2020)
- 29.Bustos, A., Pertusa, A., Salinas, J. M., & de la Iglesia-Vayá, M.. PadChest: A large chest x-ray image dataset with multi-label annotated reports. Medical Image Analysis, 66, Article 101797. (2020) [DOI] [PubMed]
- 30.Jaeger S, Candemir S, Antani S, Wáng Y-XJ, Lu P-X, Thoma G. Two public chest X-ray datasets for computer-aided screening of pulmonary diseases. Quant. Imaging Med. Surg. 2020;4(6):475–477. doi: 10.3978/j.issn.2223-4292.2014.11.20. [DOI] [PMC free article] [PubMed] [Google Scholar]
- 31.Shiraishi J, Katsuragawa S, Ikezoe J, Matsumoto T, Kobayashi T, Komatsu KI, Matsui M, Fujita H, Kodera Y, Doi K. Development of a digital image database for chest radiographs with and without a lung nodule: Receiver operating characteristic analysis of radiologists’ detection of pulmonary nodules. Am. J. Roentgenol. 2020;174(1):71–74. doi: 10.2214/ajr.174.1.1740071. [DOI] [PubMed] [Google Scholar]
- 32.Tang, Y. B., Tang, Y. X., Xiao, J., Summers, R. M. . Xlsor: A robust and accurate lung segmentor on chest x-rays using criss-cross attention and customized radiorealistic abnormalities generation. (pp. 457–467). ArXiv. (2020)
- 33.Ronneberger, O., Fischer, P., Brox, T: U-net: Convolutional networks for biomedical image segmentation in: Lecture notes in computer science (including subseries lecture notes in artificial intelligence and lecture notes in. Bioinformatics (2020) 10.1007/978-3-319-24574-4_28.
- 34.Simonyan, K., &Zisserman, A. (2020). Very deep convolutional networks for large-scale image recognition. in: 3rd International Conference on Learning Representations, ICLR 2015 - Conference track proceedings arXiv:1409.1556v6.
- 35.Deng, J., Dong, W., Socher, R., Li, L.-J., Li, K., Fei-Fei, L. (2020). ImageNet: A large-scale hierarchical image database. CVPR09, 20 (11).
- 36.Bravo Ortíz MA, Arteaga Arteaga HB, Tabares Soto R, Padilla Buriticá JI, Orozco-Arias S. Cervical cancer classification using convolutional neural networks, transfer learning and data augmentation. Revista EIA. 2021;18(35):1–12. [Google Scholar]
- 37.Aggarwal, CC., (2020). Neural networks and deep learning (pp. 351–352). 10.1201/b22400-15 (Visited: 20/04/2022).
- 38.Arias-Garzón, D., Alzate-Grisales, J. A., Orozco-Arias, S., Arteaga-Arteaga, H. B., Bravo-Ortiz, M. A., Mora-Rubio, A., Tabares-Soto, R: COVID-19 detection in X-ray images using convolutional neural networks. Machine Learning with Applications, 6, 100138. (2021). [DOI] [PMC free article] [PubMed]
- 39.Jain R, Gupta M, Taneja S, Hemanth DJ. Deep learning based detection and analysis of COVID-19 on chest X-ray images. Appl. Intell. 2021;51(3):1690–1700. doi: 10.1007/s10489-020-01902-1. [DOI] [PMC free article] [PubMed] [Google Scholar]
- 40.Hussain E, Hasan M, Rahman MA, Lee I, Tamanna T, Parvez MZ. CoroDet: A deep learning based classification for COVID-19 detection using chest X-ray images. Chaos, Solitons Fractals. 2021;142:110495. doi: 10.1016/j.chaos.2020.110495. [DOI] [PMC free article] [PubMed] [Google Scholar]
- 41.Malla, S., Alphonse, P. J. A. An improved machine learning technique for identify informative COVID-19 tweets. International Journal of System Assurance Engineering and Management, 1–12. (2022)
- 42.Luz E, Silva P, Silva R, Silva L, Guimarães J, Miozzo G, Menotti D. Towards an effective and efficient deep learning model for COVID-19 patterns detection in X-ray images. Res Biomed Eng. 2022;38(1):149–162. doi: 10.1007/s42600-021-00151-6. [DOI] [Google Scholar]
- 43.Verma SS, Prasad A, Kumar A. CovXmlc: High performance COVID-19 detection on X-ray images using Multi-Model classification. Biomed. Signal Process. Control. 2022;71:103272. doi: 10.1016/j.bspc.2021.103272. [DOI] [PMC free article] [PubMed] [Google Scholar]
- 44.Gour M, Jain S. Automated COVID-19 detection from X-ray and CT images with stacked ensemble convolutional neural network. Biocybernetics Biomed Eng. 2022;42(1):27–41. doi: 10.1016/j.bbe.2021.12.001. [DOI] [PMC free article] [PubMed] [Google Scholar]
- 45.Mousavi Z, Shahini N, Sheykhivand S, Mojtahedi S, Arshadi A. COVID-19 detection using chest X-ray images based on a developed deep neural network. SLAS Technol. 2022;27(1):63–75. doi: 10.1016/j.slast.2021.10.011. [DOI] [PMC free article] [PubMed] [Google Scholar]
- 46.Agrawal T, Choudhary P. FocusCovid: automated COVID-19 detection using deep learning with chest X-ray images. Evol. Syst. 2022;13(4):519–533. doi: 10.1007/s12530-021-09385-2. [DOI] [PMC free article] [PubMed] [Google Scholar]
- 47.Rahman, T., Khandakar, A., Qiblawey, Y., Tahir, A., Kiranyaz, S., Kashem, S. B. A., Chowdhury, M. E: Exploring the effect of image enhancement techniques on COVID-19 detection using chest X-ray images. Computers in biology and medicine (2021) [DOI] [PMC free article] [PubMed]
- 48.Jairam Naik K, Mishra A. Filter selection for speaker diarization using homomorphism: speaker diarization. Artificial Neural Network Applications Business Eng. 2020 doi: 10.4018/978-1-7998-3238-6.ch005. [DOI] [Google Scholar]
- 49.Jairam Naik K, Soni A. Video Classification using 3D convolutional neural Network. Advancements Security Privacy initiatives Multimedia images. 2020 doi: 10.4018/978-1-7998-2795-5.ch001. [DOI] [Google Scholar]
- 50.K Jairam Naik, Mounish Pedagandham, Amrita Mishra:“Workflow Scheduling Optimization for Distributed Environment using Artificial Neural Networks and Reinforcement Learning (WfSo_ANRL)”, International Journal of Computational Science and Engineering (IJCSE) (2021)
- 51.Jairam Naik K, Chandra S, Agarwal P. Dynamic workflow scheduling in the cloud using a neural network-based multi-objective evolutionary algorithm. J. Communicat Net Distributed Syst. 2021 doi: 10.1504/IJCNDS.2021.10040231. [DOI] [Google Scholar]
Associated Data
This section collects any data citations, data availability statements, or supplementary materials included in this article.
Data Availability Statement
The data supporting this study's findings are available on request from the corresponding author. The data are not publicly available due to privacy or ethical restrictions.


