Abstract
The ring-like cohesin complex mediates sister chromatid cohesion by encircling pairs of sister chromatids. Cohesin also extrudes loops along chromatids. Whether the two activities involve similar mechanisms of DNA engagement is not known. We implemented an experimental approach based on isolated nuclei carrying engineered cleavable RAD21 proteins to precisely control cohesin ring integrity so that its role in chromatin looping could be studied under defined experimental conditions. This approach allowed us to identify cohesin complexes with distinct biochemical, and possibly structural properties, that mediate different sets of chromatin loops. When RAD21 is cleaved and the cohesin ring is opened, cohesin complexes at CTCF sites are released from DNA and loops at these elements are lost. In contrast, cohesin-dependent loops within chromatin domains and that are not anchored at pairs of CTCF sites are more resistant to RAD21 cleavage. The results show that the cohesin complex mediates loops in different ways depending on genomic context and suggests that it undergoes structural changes as it dynamically extrudes and encounters CTCF sites.
The cohesin complex plays major roles in mediating sister chromatid cohesion from S-phase to mitosis, and in folding chromosomes during interphase. Cohesin consists of two SMC proteins (SMC1 and SMC3) and a kleisin subunit (RAD21). Additional subunits include SA1/SA2, NIPBL, and PDS5A/B1–5. Previous studies have shown that the cohesin complex forms a ring-like structure that can entrap two sister chromatids5–7. During the metaphase-to-anaphase transition, separase cleaves RAD21 which opens the cohesin ring and releases sister chromatids for segregation to daughter cells8–11. Besides its role in sister chromatid cohesion, cohesin is an ATP-dependent motor protein that extrudes chromatin loops during interphase12–14. Interestingly, CTCF-bound sites block cohesin-mediated loop extrusion15–20, through interactions between the N-terminal domain of CTCF and the SA2 and kleisin subunits of cohesin21.
Cohesin-mediated loop extrusion and blocking at CTCF sites produce chromosome structures that have been detected by Hi-C. Cohesin-dependent chromatin loops are visible as dots of enriched interaction on Hi-C contact maps12–13. Cohesin loops occur along chromosomes but are most frequently found between pairs of convergent CTCF sites or within regions delineated by CTCF boundaries18–21,23,25. These regions of elevated contacts form topologically associating domains (TADs). Loops rarely cross these boundaries, because they block loop extrusion and the depletion of contacts across boundaries is referred to as insulation26. Additionally, loops anchored with one CTCF site and a range of distant sites form stripes on Hi-C maps. All these Hi-C features disappear when RAD21 is depleted from cells using an auxin-inducible degron approach23,25. On the other hand, other aspects of chromosome folding such as compartmentalization remain.
An open question is whether cohesin employs the same mechanism(s) to engage chromatin when it mediates interactions between sister chromatids, maintains stalled loops between CTCF sites, or when it actively extrudes loops within TADs. In an earlier study, it was found that cleaving RAD21, which is sufficient to dissolve sister chromatid cohesion, has much milder effects on chromatin folding than complete degradation of RAD21 using a degron20, 22, 23. This suggests different mechanisms are at play for cohesion and extrusion respectively. Here we use a semi-in vitro approach using isolated nuclei expressing engineered cohesin subunits to study the effect of cohesin ring opening on chromosome folding. We find that cohesin occurs in different biochemical, and possibly different conformational states when it mediates loops between CTCF sites, or when it mediates loops throughout TADs.
Results
Cell cycle masks effects of RAD21 loss on chromatin folding
Degradation of RAD21 using auxin-inducible degron systems (Extended Data Fig. 1a and 1b) eliminates all loop and TAD structures20, 22. However, during auxin incubation cells continue to progress through the cell cycle and after 6 hours many cells are in G2/M phase, likely arrested in mitosis (Fig. 1a)24. In mitotic cells, condensins compact chromosomes, and TADs and CTCF-CTCF loops are lost25–27. Therefore, mitotic cells may contribute to the observed changes in chromosome conformation upon RAD21 degradation (Fig. 1a). We sorted and collected HCT116-RAD21-mAC G1 cells after RAD21 degradation and performed Hi-C analysis. Additionally, we did the same analysis using non-synchronized and G1/S synchronized HCT116-RAD21-mAC cells treated with IAA for 2 or 6 hours, as previously reported22. Hi-C maps show that after IAA treatment, local features of chromosome structure become weaker or disappear (Extended Data Fig. 1f, 2a, cell cycle profiles in Extended Data Fig. 1c–e).
Fig. 1. RAD21 degradation in G1 cells eliminates CTCF-CTCF loops and TADs, but enhances compartmentalization.
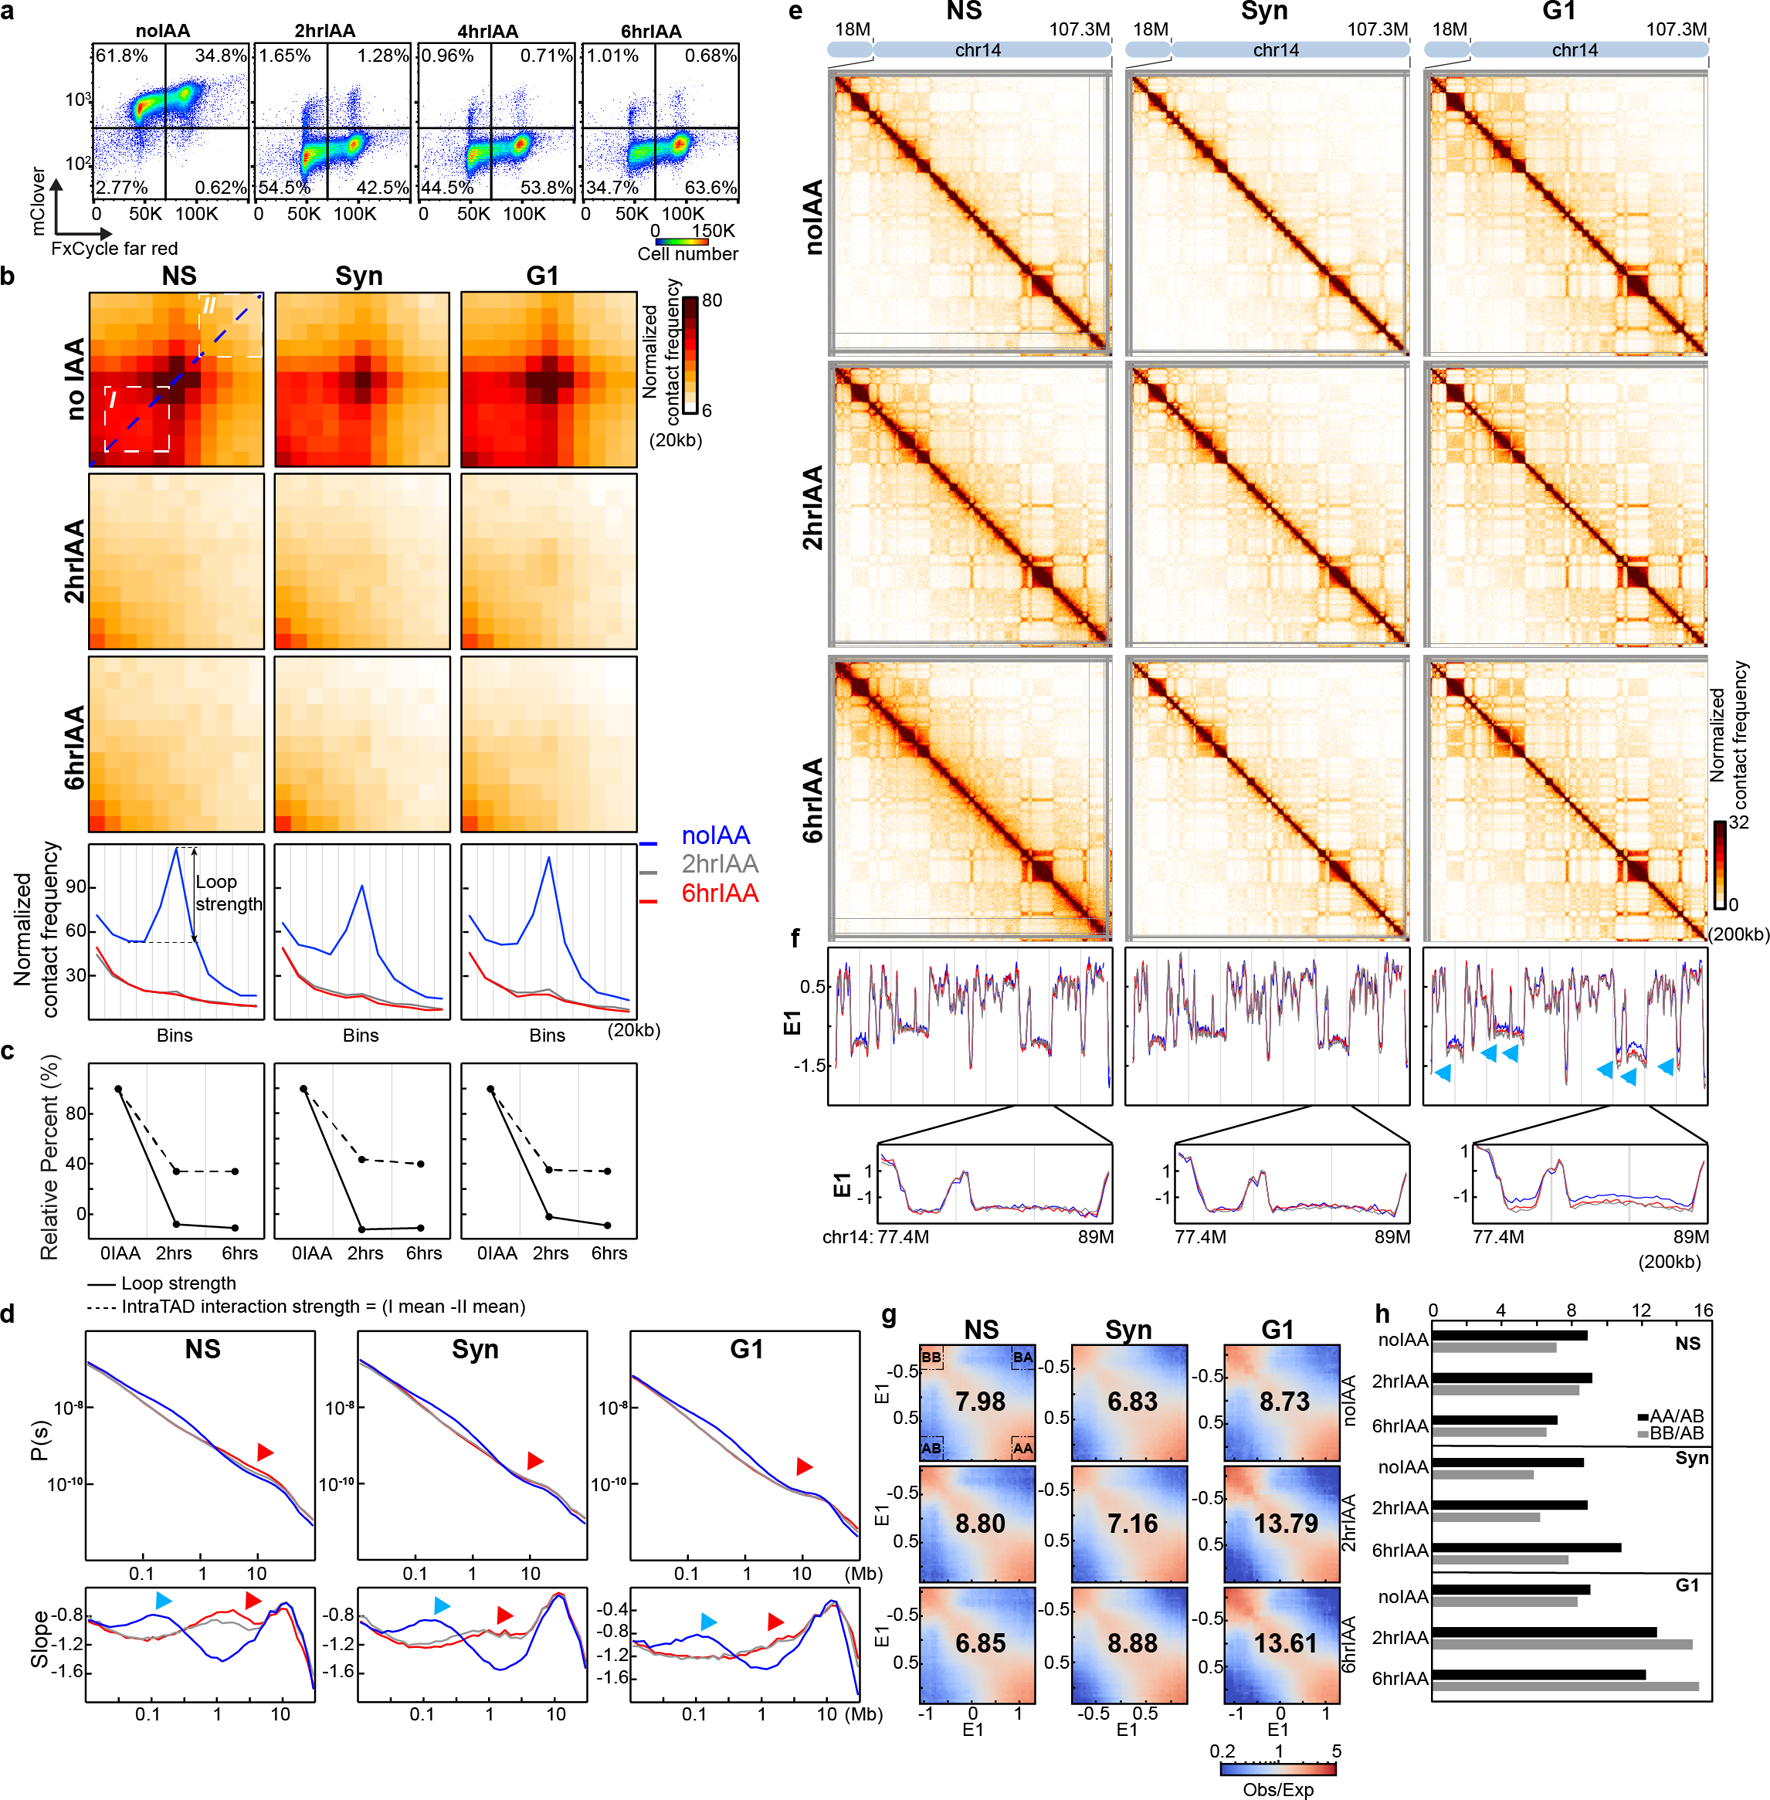
(a) FACS analysis of HCT116-RAD21-mAC cells treated with 500uM IAA as shown. The percentages in four squares indicate G1 cells with high (top left), or low RAD21 levels (bottom left), G2/M cells with high (top right), or low RAD21 levels (bottom right). (b) Aggregated Hi-C data at 3169 loops in HCT116-RAD21-mAC cells by22. Plots at the bottom show average Hi-C signals along the dotted blue lines representing signals from the bottom-left corner to the top-right corner of the loop aggregated heatmaps shown in upper panels (c) Loop strength and intra-TAD interaction strength. (d) P(s) plots (upper panels) and the derivative from P(s) plots (lower panels) for Hi-C obtained from cells grown as indicated. The red arrows indicate the increased interaction frequency at s=10Mb (upper panels) and the appearance of condensin loop arrays structures (lower panels). The blue arrows indicate the signature of cohesin loops in each condition without IAA. NS and Syn experiments were repeated once as confirmation of previous studies. Hi-C experiments for G1 cells were repeated independently three times and the results in Fig. 1 and Extended Data Fig. 1 are from the pool of three replicates. (e) Hi-C interaction maps for NS, Syn, and G1 cells treated with IAA as shown. Data is for the 18–107.3 Mb regions of chromosome 14. (f) Eigenvector value E1 across the same region as in e. The blue, grey and red lines represent: 0, 2 and 6hour IAA treatments, respectively. Bottom, E1 for the 77.4–89Mb region. Blue arrows indicate changes of E1. (g) Saddle plots treated with IAA as shown. Saddle plots for each condition were calculated using the E1 from the Hi-C data obtained with cells grown without IAA. The numbers at the center of the saddle plots indicate compartment strength (see methods). (h). Interaction strength of compartments. Dark and grey bars indicate strength of A-A and B-B interaction respectively (see methods). See source data for numerical data.
To quantify loss of domanial features we calculated insulation profiles. Domain boundaries display local minima in insulation28. We observed weakening and loss of many boundaries upon RAD21 degradation (Extended Data Fig. 1g, 2b;), whereas compartment profiles remained unaffected (Extended Data Fig.1g).
We examined the effect of RAD21 depletion on loop formation. In untreated cells we readily detect the strong focal enrichment of interactions between the loop bases (Fig. 1b, Extended Data Fig. 2d). After IAA treatment, this focal enrichment is completely lost (Fig. 1b and Extended Data Fig. 2d). To quantify loop strength, we plot the Hi-C data along the diagonal line of loop aggregation heatmaps (Fig. 1b, blue dashed line in the top left panel). The resulting plots reveal peaks at the position of the looping interaction (Fig. 1b, blue lines in the bottom panels). The relative height of these peaks is a measure for loop strength. Loop strength is reduced to below zero after RAD21 depletion, in all conditions (Fig. 1c). The negative loop strength is the result of the general distance-dependent decay in interaction frequency in the absence of looping interactions.
To quantify enrichment of intra-TAD interactions, we calculated the average intra-TAD interaction frequency (indicated by white square number I in the top right panel of Fig. 1b) and the average interaction between loci outside the domain (indicated by white square number II in the top right panel of Fig. 1b). The difference between these averages is a metric for intra-TAD interaction strength. In untreated cells interactions within TADs are strongly enriched, and are greatly reduced upon RAD21 depletion (Fig. 1c). The remaining intra-TAD strength (~35% of the initial strength; Fig. 1c) represents the base line level in the absence of TADs and is due to the general distance-dependent decay in interaction frequency. We conclude that RAD21 depletion leads to loss of all positioned loops (at CTCF sites) as well as all extruding loops positions throughout TADs.
Finally, we calculated how interaction frequency (P) decayed with genomic distance (s). From the shape of P(s) we can learn about the presence of cohesin-mediated loops, among other things29, 30. In untreated cells we observe the typical shape of P(s), with a relative shoulder where interactions decay more slowly for loci separated by ~100 kb (Fig. 1d, top plots). The derivative of P(s) highlights this shoulder as a local peak (Fig. 1d bottom plots blue arrows). Previous work has established that this shoulder represents the average loop size29. Upon RAD21 depletion this shoulder disappears entirely (Fig. 1d) in all three conditions reflecting the loss of cohesin-mediated loops31. However, we observed that in non-synchronized, and to some extent in synchronized cells, interactions between loci separated by 1–2 Mb increased (Fig. 1d, upper plots, red arrows). This is observed in the derivative of P(s) where a new peak is observed at around 1 Mb (Fig. 1d lower plots, red arrows). This is reminiscent of what is observed in mitotic cells25, 31. In G1-sorted cells we did not detect this phenomenon. Therefore, at least a sub-population of cells was arrested in mitosis during RAD21 depletion. In G1-sorted cells this confounding factor is not present, making the interpretation and quantification of effects of RAD21 depletion more accurate.
RAD21 degradation did not lead to changes of compartment boundaries as determined by the E1 eigenvector (Fig. 1e–f, Extended Data Fig 2f–g). E1 is the first Eigenvector from principal component analysis of the Hi-C interaction matrix and is routinely used to identify the positions of A and B compartments32.
E1 values for B compartment domains became more negative in G1-sorted cells after RAD21 depletion (Fig. 1f, arrow heads). To quantify compartmentalization strength, i.e., the preference of compartment domains to interact with other domains of the same type, we calculated saddle plots19. Loci are ranked by their E1 value and pairwise interactions are calculated and normalized for their expected interaction frequency given their genomic distance. Compartment strength is then calculated as the ratio of AA and BB to AB and BA interactions (see Methods). A slight increase of compartment strength was observed in non-synchronized cells after RAD21 was degraded for 2 hours (Fig. 1g), whereas compartment strength decreased after RAD21 was degraded for 6 hours for non-synchronized cells (Fig. 1g). In both synchronized and G1-sorted cells, compartment strength increased after RAD21 depletion, with the largest increase in G1-sorted cells (Fig. 1g, right column and Extended Data Fig. 2h). Increased compartmentalization strength is consistent with previous studies that found that knocking out of the cohesin loading factor, Nipbl increases compartmentalization33.
In G1 cells, loss of RAD21 led to increased compartmentalization for both A-A and B-B interactions, with B-B interactions becoming the strongest (Fig. 1h). In synchronized cells the effect on compartmentalization is more modest. In non-synchronized cells both A and B compartmentalization strength is reduced after 6 hours of RAD21 depletion, and preferential B-B interactions are the weakest. One explanation for the quantitatively different effect of RAD21 depletion in non-synchronized cells is that in those cell cultures many cells progress through the cell cycle and arrest in mitosis, as shown in (Fig. 1a,1d). Mitotic cells do not display compartmentalization26. Therefore, the effect of RAD21 depletion on compartmentalization is obscured by the fact that cells progress through the cell cycle during the auxin treatment. Cell cycle dynamics need to be taken into consideration when performing depletion experiments.
A system for controlled cohesin perturbation
We established an alternative biochemical experimental system for analysis of cohesin perturbation on chromosome folding using purified nuclei. Previously, we have shown that chromosome folding in purified nuclei is comparable to that in intact cells34. An advantage of nuclei is that they do not progress through the cell cycle during experiments, avoiding the confounding factors described above.
To allow for controlled perturbation of RAD21, we used CRISPR/Cas9 to edit the RAD21 gene in HAP1 cells so that they express a RAD21 protein that contains three repeats of the TEV protease recognition motif (HAP1-RAD21TEV cells). TEV motifs were inserted in an unstructured region of RAD21, between Pro471 and Pro472 in exon 11. This insertion has no effects on regions of RAD21 that interact with cohesin subunits (Fig. 2a and Extended Data Fig. 3a)35. HAP1-RAD21TEV cells proliferate normally. The unstructured region in which the TEV sites were inserted contains one of two naturally occurring separase cleavage sites8. Previous work has shown that cleaving RAD21 (or Scc1) by separase, or by TEV, in this region suffices to disrupt sister chromatid cohesion8–11. Comparison of HAP1 cells to HAP1-RAD21TEV nuclei showed that RAD21 protein levels, RAD21 and CTCF chromatin binding, and loop formation were unaffected by insertion of TEV cleavage sites (Fig 2b and Supplementary Fig. 6d–i).
Fig. 2. Cleaving RAD21 reduces CTCF-CTCF loop interactions.
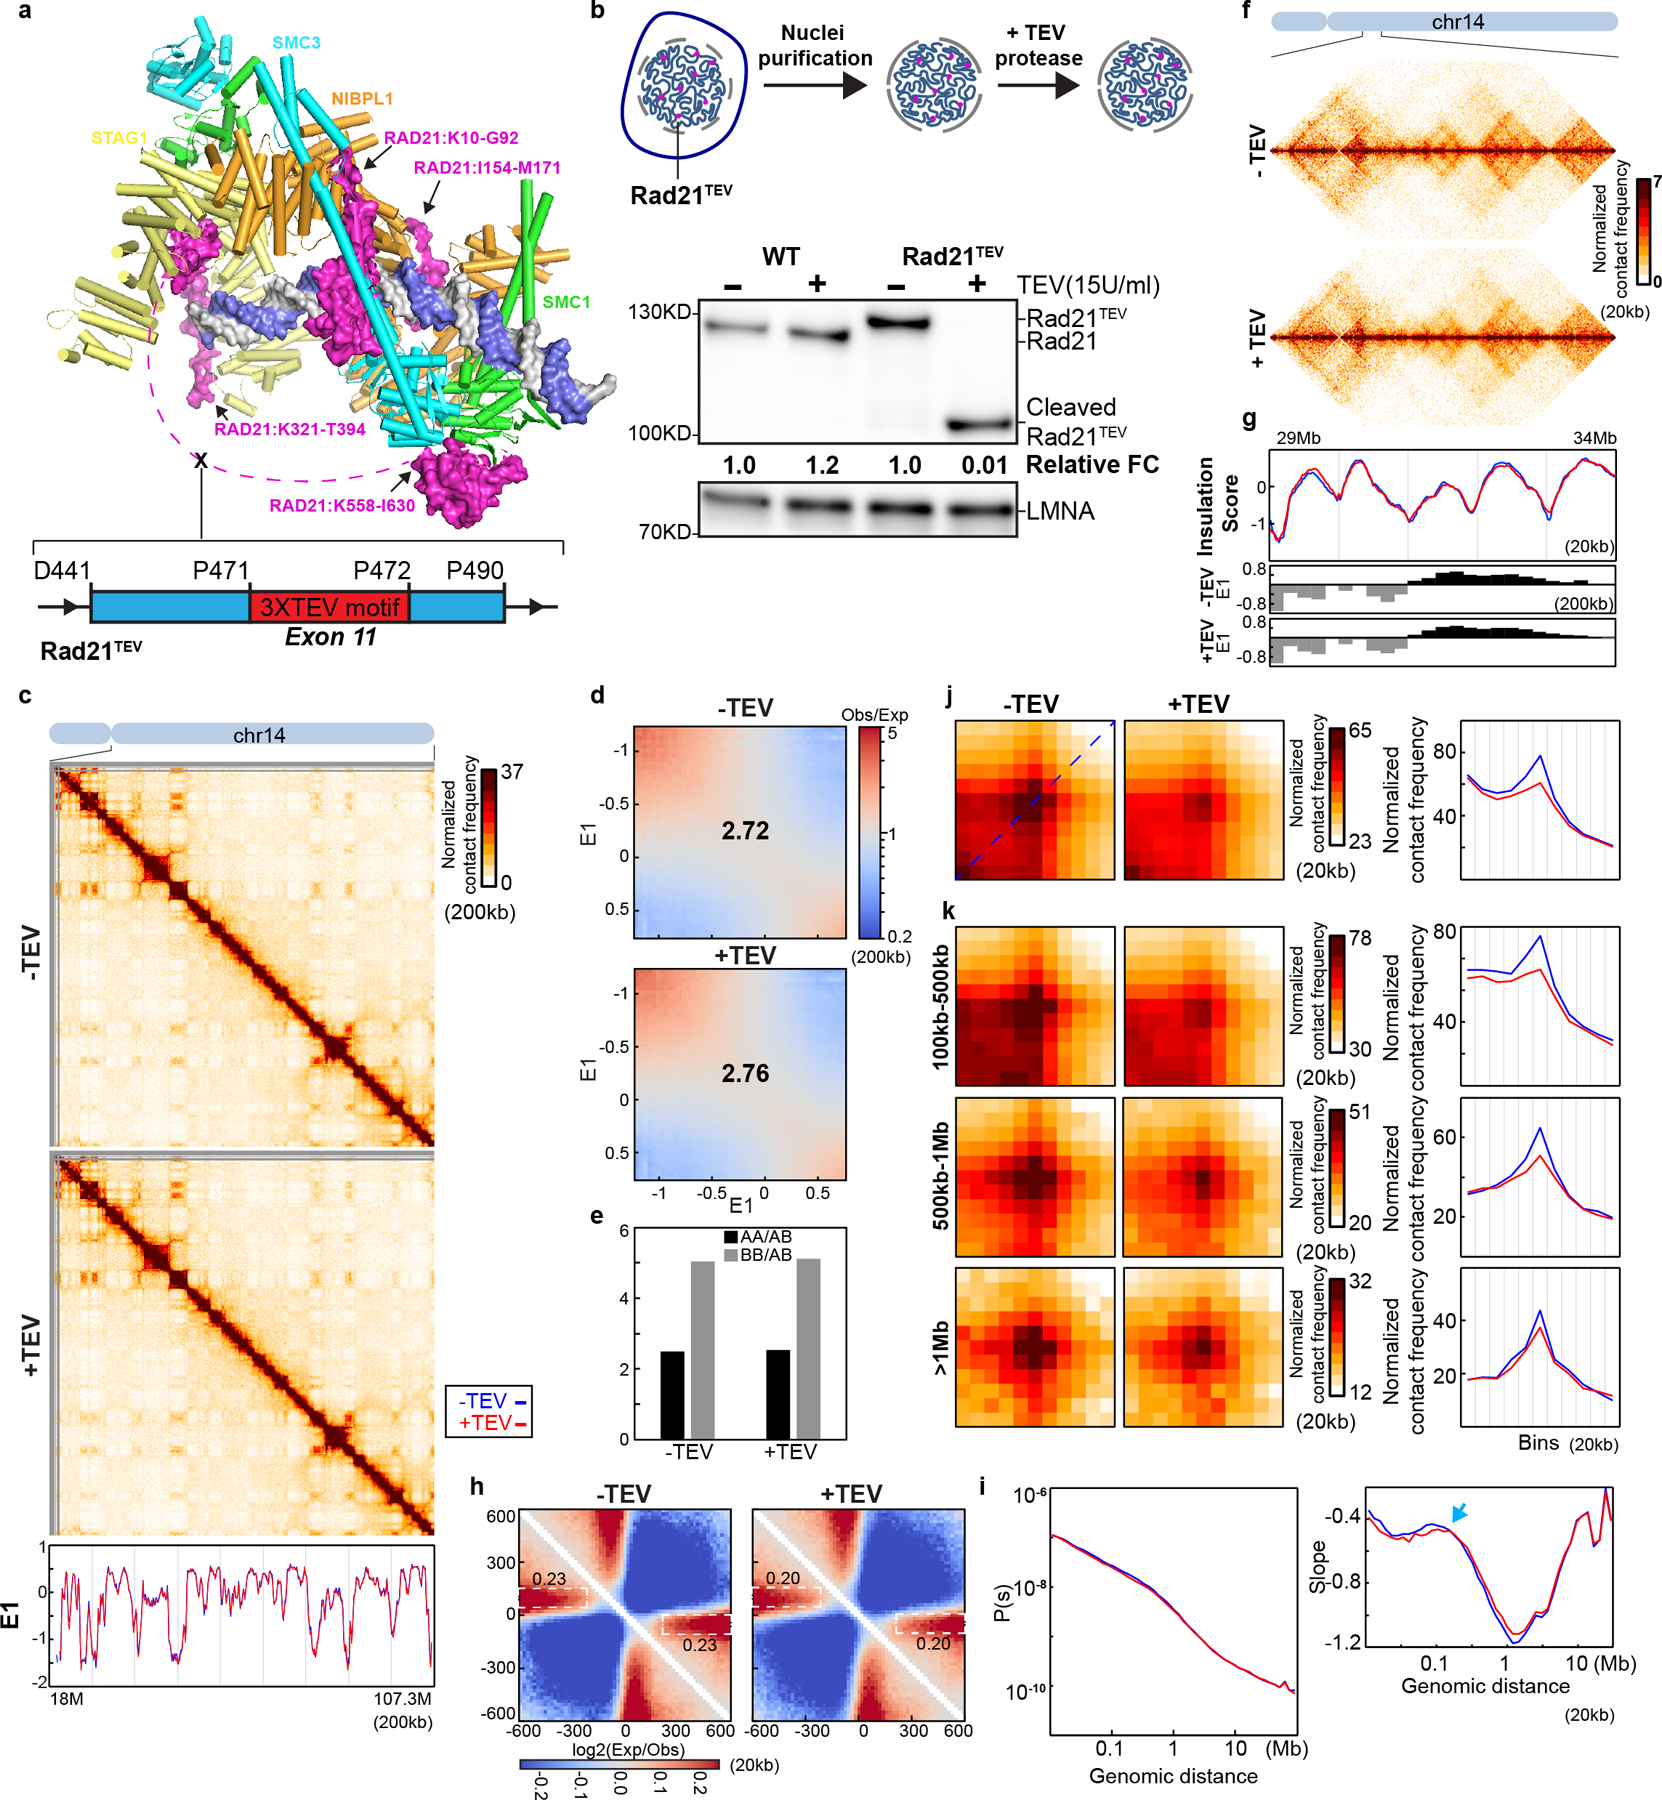
(a) Structure of the cohesin complex in association with DNA, drawn using 6WG3 from Protein Data Bank as published35. The schematic at the bottom illustrates TEV recognition motifs insertion site on RAD21. (b) TEV cleavage assay using purified nuclei (Upper panel). Lower panel, western blot analysis of RAD21 from wild-type and RAD21TEV nuclei treated with TEV as shown. LMNA was used as the loading control. Numbers indicate the relative amount of intact RAD21. (c) Hi-C interaction maps for RAD21TEV nuclei treated with TEV as shown. Data for the 18–107.3 Mb region of chromosome 14. Bottom, eigenvector E1 across the same region. (d) Saddle plots for RAD21TEV nuclei treated with TEV as shown. (e). Interaction strength of compartments. The bars represent the strength of compartment interactions as described in Fig. 1h. (f) Hi-C interaction maps for RAD21TEV nuclei treated with TEV as shown. Data for the 29–34 Mb region of chromosome 14 is shown. (g) Insulation profiles for the same region as in (f). The blue and red lines for panels (g) and (i-k) are as described in (c). The lower panels indicate compartment Eigenvector value E1 across the same region. (h) Aggregate Hi-C data at TAD boundaries identified in the sample in NB buffer without TEV. The numbers at the sides of the cross indicate the strength of boundary-anchored stripes using the mean values of interaction frequency within the white dashed boxes. (i) P(s) plots (upper panels), and the derivatives of P(s) plots (lower panels) for Hi-C data from nuclei treated with TEV as shown. The arrow indicates the signature of cohesin loops. (j) Aggregated Hi-C data at 8334 loops identified in HAP1 cells by14. Right panel: average Hi-C signals along the blue dashed line shown in the left Hi-C panel. (k) Aggregated Hi-C data at chromatin loops of three different loop sizes, 100–500kb, 500kb-1Mb, and >1Mb. Right panel: average Hi-C signals along the blue dashed line shown in the left Hi-C map in (j). See source data for numerical data and unprocessed blots.
We purified nuclei from HAP1-RAD21TEV cells and incubated them overnight with TEV protease at 4°C (Fig. 2b). Western blotting confirmed efficient cleavage of RAD21 (Fig. 2b, Extended Data Fig. 3b). Wildtype RAD21 in nuclei purified from parental HAP1 cells was not cleaved.
RAD21 cleavage reduces CTCF-CTCF loops in isolated nuclei
We performed Hi-C on HAP1-RAD21TEV nuclei without and with TEV protease treatment in low salt nuclear isolation buffer (NB buffer, see methods). Hi-C maps did not reveal obvious effects after RAD21 cleavage (Fig. 2c and Extended Data Fig. 3c). Compartment domains and compartmentalization strength did not change (Fig. 2d–e; Extended Data Fig. 3d–e). Surprisingly, both TADs and TAD boundary positions, which are dependent on cohesin, showed no changes after cleavage of RAD21 as reflected in near-identical insulation profiles (Fig. 2f–g; Extended Data Fig. 3f–g). To quantify insulation strength, we aggregated interactions at and around TAD boundaries. We find the characteristic pattern of depletion of interactions across boundaries and line-like features (Fig. 2h). Cleavage of RAD21 did not quantitatively affect these features (Fig. 2h and Extended Data Fig. 3h). We also plotted P(s) and found no quantitative effects (Fig. 2i and Extended Data Fig. 3i). The derivative of P(s) was also unaffected and indicated the presence of ~100 kb loops even after RAD21 cleavage (arrows in Fig. 2i and Extended Data Fig. 3i). We conclude that TAD insulation and chromosome folding in general, including formation of intra-TAD cohesin-mediated loops is largely intact after RAD21 cleavage.
To directly assess the effect of RAD21 cleavage on looping between pairs of CTCF sites, we used a list of 8,334 loops previously detected in HAP1 cells14, and aggregated Hi-C data obtained with nuclei in which RAD21 was cleaved and with control nuclei (Fig. 2j and Extended Data Fig. 3j). CTCF-CTCF loops appeared weakened. We plotted the Hi-C data along the diagonal line of loop aggregation heatmap as in Fig.1b. In control nuclei a clear peak is observed that is reduced (~50%) upon RAD21 cleavage. We observed that all CTCF-CTCF loops are weakened, but that longer-range loops (e.g. >0.5–1 Mb) are less affected (Fig. 2k and Extended Data Fig. 3k).
In summary, cleavage of RAD21 in a low salt buffer leads to reduced looping interactions between pairs of CTCF sites but does not affect compartmentalization, boundary insulation, and most cohesin-dependent loops within TADs that are not positioned at CTCF sites.
Nuclear retention of cohesin subunits
The limited effect of RAD21 cleavage under low salt conditions suggested that cohesin remains associated with chromatin. We tested this using a nuclear retention assay followed by Western blotting. We find that several cohesion subunits remain stably associated with purified nuclei with either an intact or cleaved RAD21 (Fig. 3a, and Extended Data Fig. 4a–d).
Fig. 3. Cleaving RAD21 in NBS1 dissociates cohesin, eliminates CTCF-CTCF loops and reduces intra-TAD interactions.
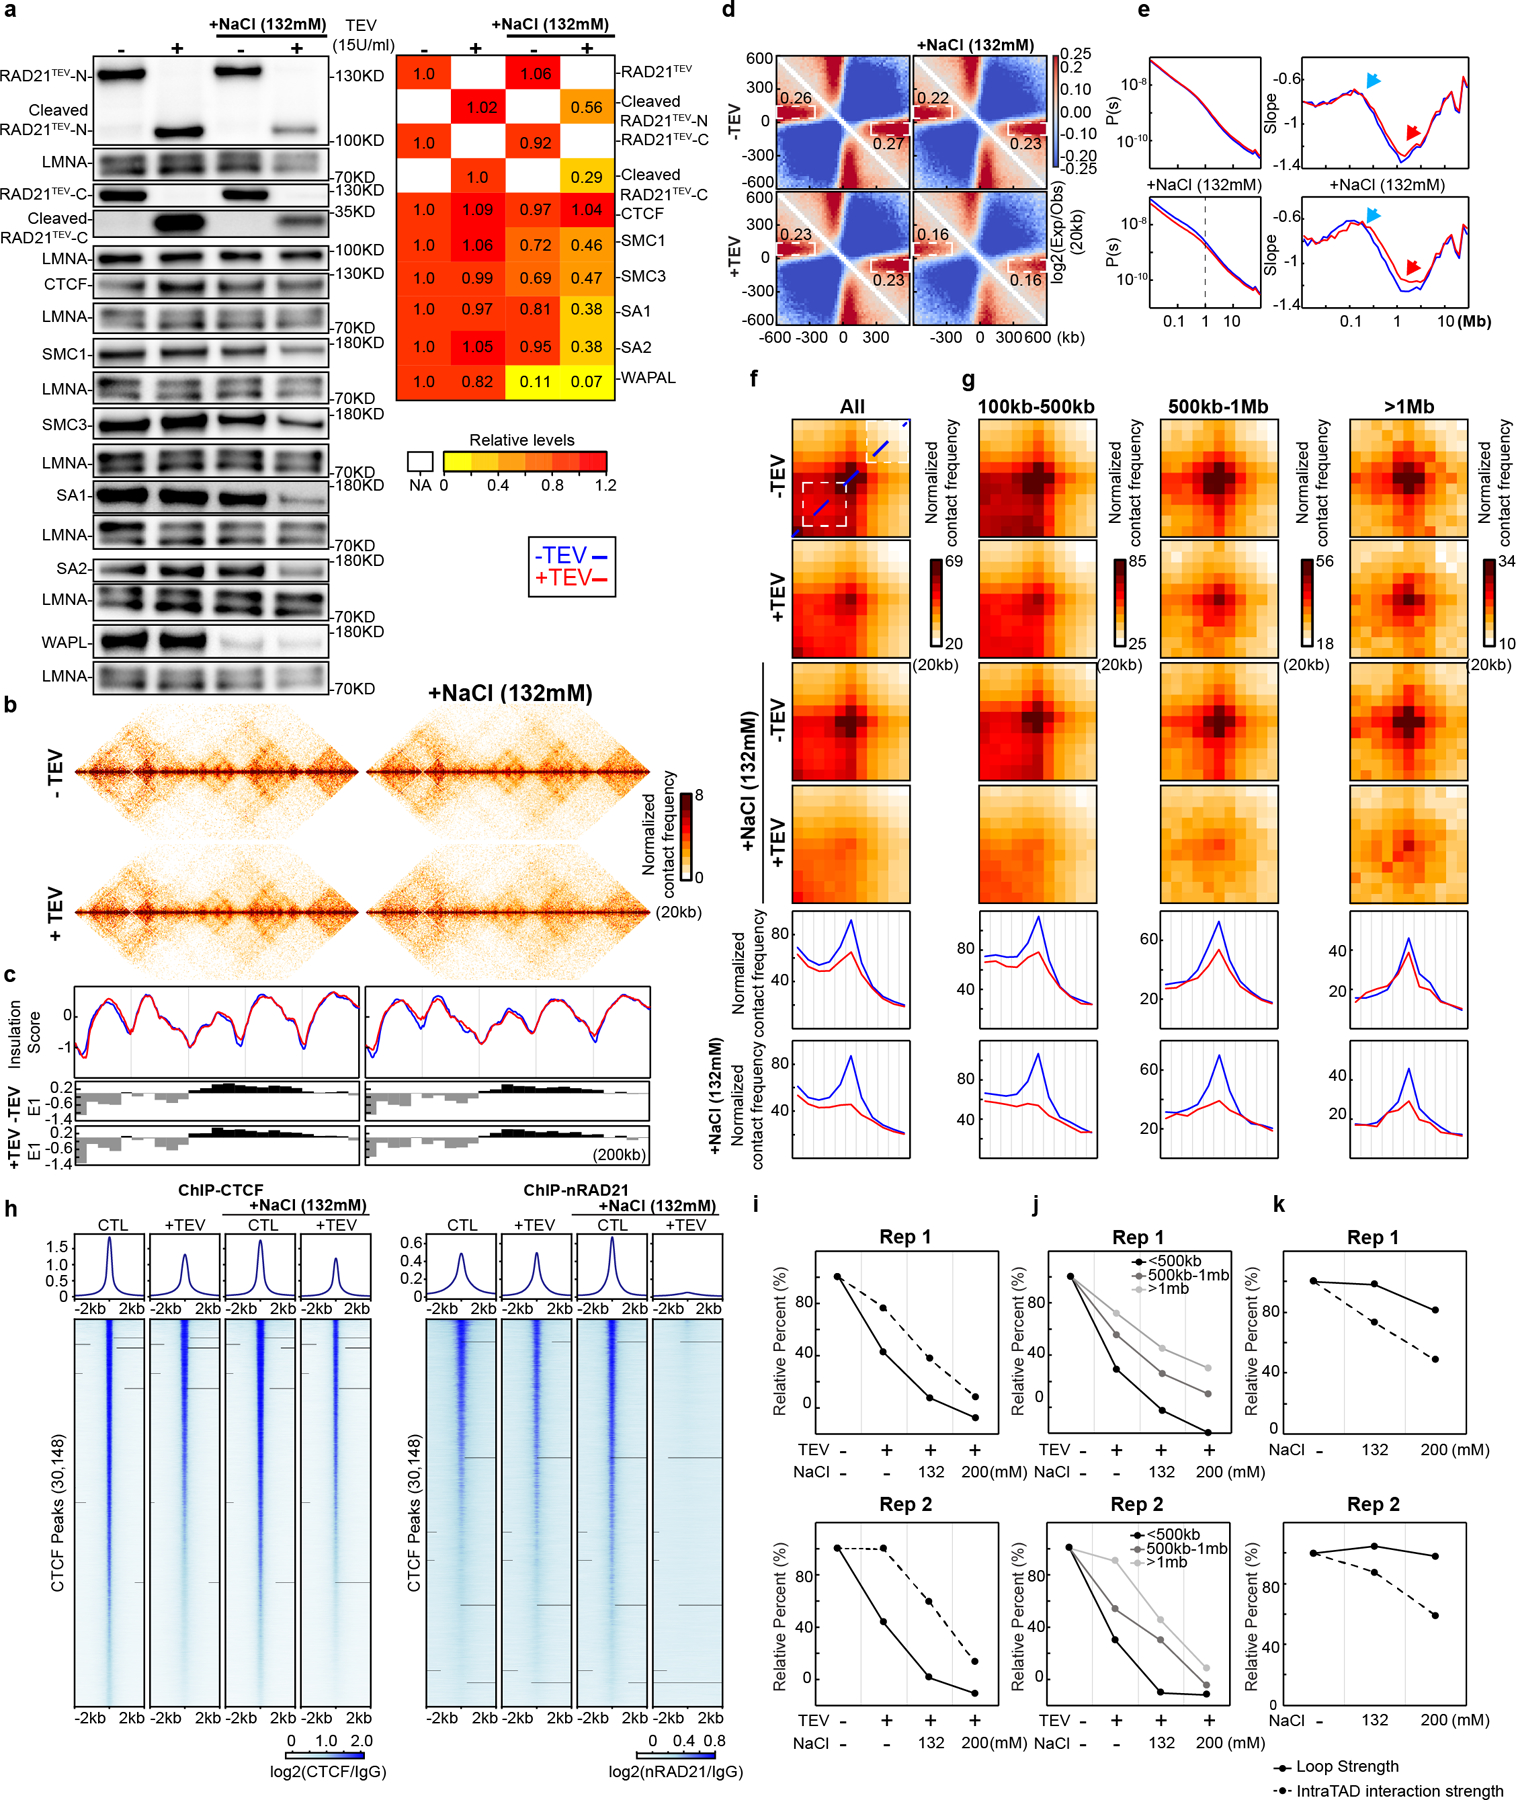
(a) Western blot of cohesin subunit nuclear retention in HAP1-RAD21TEV nuclei treated with TEV in specified buffers as shown. LMNA was used for normalization. Levels of cohesin subunits in each condition were normalized to their levels in nuclei in NB without TEV treatment. Heatmap: average relative levels of nuclear retained subunits. (b) Examples of Hi-C maps obtained with HAP1-RAD21TEV nuclei treated with TEV in specified buffers as shown. (c) Insulation profiles for the same region as in (b). For (c) and (e-g), the blue line is -TEV, red line is +TEV. Lower panels indicate compartment Eigenvector value E1. (d) Aggregate Hi-C data at TAD boundaries identified in NB buffer without TEV treatment. Numbers at the sides of the cross indicate boundary strength (calculated as in Fig. 2h). (e) P(s) plots (left), and derivative of P(s) plots (right) for Hi-C data from nuclei treated with TEV in the specified buffers as shown. Blue arrows indicate the signature of cohesin loops. Red arrows indicate changes in relative contact frequencies at ~2Mb reflecting loop density29. (f) Aggregate Hi-C data at loops identified in HAP1 cells (as in Fig. 2j). Lower panels: average Hi-C signals along the blue dashed line shown in the upper Hi-C panels. (g) Aggregate Hi-C data at chromatin loops of different sizes (as in Fig. 2j). Lower panels, average Hi-C signals along the blue dashed line shown in the upper Hi-C map in panel (f). (h) ChIP-seq signals of CTCF and RAD21 at CTCF binding sites. Upper panel, average CTCF and RAD21 ChIP-seq signals in each condition for 30,148 CTCF binding sites identified from the CTCF ChIP data from nuclei without TEV treatment in NB. Lower panel, heatmap of CTCF and RAD21 ChIP-seq signals for each condition at each CTCF binding sites. (i) Loop strength and intra-TAD interaction strength treated with TEV in the specified buffer as shown (two biological replicates). (j) Quantification of loop strength for different loop sizes treated with TEV in the specified buffers. (k) Quantification of loop strength and intra-TAD interaction strength without TEV treatment in the specified buffers. Loop strength and intra-TAD interaction strength from nuclei in NB without TEV treatment were used to normalize, respectively in (i-k). See source data for numerical data and unprocessed blots.
We next tested cohesin retention under conditions that resemble physiological ionic conditions. We repeated the RAD21 cleavage experiments with nuclei incubated in NB buffer containing an additional 132mM NaCl (NBS1 buffer). TEV protease cleaved efficiently under these conditions (Fig. 3a, Extended Data Fig. 4a–c). We then performed Western blot analysis to assess nuclear retention of cohesin subunits. In the absence of TEV protease, we observed up to an ~20% reduction in retention of multiple cohesin subunits with a larger loss of WAPL (85%). Interestingly, upon RAD21 cleavage we observed an increased loss of nuclear retention of cohesin subunits, and an increase in the soluble fraction (Fig. 3a, Extended Data Fig. 4a–d). However, even under these conditions a sizable fraction of cohesin (~50%) remains within nuclei. Notably, CTCF is stably retained in low and physiological salt conditions, and no CTCF was detected in the soluble fraction. We confirmed these results using quantitative SILAC Mass Spectrometry in physiological buffer (Supplementary Fig. 11b).
Cleaving RAD21 under physiological salt abolishes CTCF loops
Since cohesin nuclear retention and association with chromosomes was affected by RAD21 cleavage under physiological salt conditions, we examined chromosome folding by Hi-C under these same conditions. E1 was unaffected by RAD21 cleavage. As compared to low salt conditions, compartmentalization was slightly reduced (Extended Data Fig. 4e–g and Supplementary Fig. 1a–c). Insulation profiles were largely unaffected, but local minima appeared reduced (Fig. 3bc and Supplementary Fig. 1d). We observed that insulation at boundaries, and the strength of stripe-like features (Extended Data Fig. 10b–c), was weakened upon RAD21 cleavage in NBS1 buffer, while in nuclei with intact RAD21 insulation was comparable to that detected under low salt conditions (Fig. 3d and Supplementary Fig. 1e).
Interestingly, P(s) revealed a decrease in interaction frequency for loci separated by less than 1 Mb (Fig. 3e and Supplementary Fig. 1f). The typical cohesin-dependent shoulder in P(s) for loci separated by ~100 kb (Fig. 1d) was still observed, which was confirmed by plotting the derivative of P(s): a peak at around ~100 kb was obviously present (Fig. 3e; Supplementary Fig. 1f, blue arrows). This indicates that most cohesin-mediated loops are unaffected. We did note that the minimum of the derivative of P(s) at around 2 Mb is less deep (Fig. 3e, Supplementary Fig. 1f, red arrows), which has been interpreted to reflect a reduced density of loops29. Possibly, some loops are lost.
Finally, we quantified CTCF-CTCF loops (Fig. 3f; Supplementary Fig. 1g). In NBS1 buffer, RAD21 cleavage led to complete loss of CTCF-CTCF loops. After RAD21 cleavage, loop strength decreased to ~40% in low salt buffer (as shown in Fig. 2j) and was entirely lost in NBS1 buffer (Fig. 3i). Large loops (>500 kb) were detected though their interaction frequency was also greatly reduced (Fig. 3g, 3j). We found that after RAD21 cleavage, enrichment of intra-TAD interactions (calculated as shown in Fig. 1b, and normalized for the baseline level of 35%) was slightly reduced in low salt buffer, and only reduced to ~40–60% in NBS1 buffer (Fig. 3i, two biological replicates). We conclude that RAD21 cleavage under physiological salt conditions leads to complete loss of CTCF-CTCF loops, while enriched interactions within TADs are lost to a much smaller degree.
Our results predict that under physiological salt conditions, cleaving RAD21 results in specific loss of cohesin associated with CTCF sites, while cleaved cohesins at other locations within TADs remain chromatin-associated and continue to maintain loops. To analyze cohesin association at CTCF sites directly, we performed chromatin immunoprecipitation using antibodies against CTCF and RAD21 (Fig. 3h; Extended Data Fig. 5a). We find that CTCF binding to CTCF sites is not affected by RAD21 cleavage at low salt and at physiological salt concentrations (NBS1 buffer). In contrast, cleaving RAD21 in NBS1 buffer results in nearly complete loss of RAD21 ChIP signal at CTCF-bound sites (Fig. 3h, right panel, Extended Data Fig. 5a middle and right panels). At low salt, RAD21 cleavage did not result in loss of RAD21 association at CTCF-bound sites.
Cohesin also associated with active promoters (Extended Data Fig. 5b–e). Interestingly, when we examined RAD21 binding to active promoters that do not bind CTCF we find that upon cleavage RAD21 is no longer enriched at promoters even at low salt concentrations (NB buffer). This indicates that association of RAD21 with promoters is even more sensitive to RAD21 cleavage than its association with CTCF sites.
Intra-TAD interactions are sensitive to salt concentrations
Cleaving RAD21 in NBS1 buffer eliminated CTCF-CTCF looping interactions while cohesin-dependent elevated intra-TAD interactions were reduced only 40–60% (Fig. 3i). Given that 50% of SMC1, SMC3 and RAD21 remain on chromosomes, these (cleaved) cohesin complexes may be able to continue to maintain the elevated intra-TAD interactions. We tested whether higher salt concentrations would dissociate the remaining cohesion components resulting in loss of elevated intra-TAD interactions. We repeated the RAD21 cleavage experiments in NB buffer containing 200 mM NaCl (NBS2 buffer). We found that even without RAD21 cleavage, up to 50% of RAD21, SMC1 and SMC3 could be dissociated (Extended Data Fig. 6ab). After RAD21 cleavage, the majority of cohesin subunits were no longer retained in the nucleus (Extended Data Fig. 6a) and these components were found in the supernatant (Extended Data Fig. 6a, right panel). CTCF remained bound and was undetectable in the supernatant indicating that CTCF remains stably chromosome-associated in NBS2 buffer.
Next, we performed Hi-C on nuclei incubated in NBS2 in the absence or presence of TEV protease. Incubation of nuclei in NBS2 buffer, without TEV protease treatment, did not alter the compartment profile (Extended Data Fig. 7a–b, Supplementary Fig. 2a–b;), but compartmentalization strength was slightly reduced (Extended Data Fig. 7b–c, Supplementary Fig. 2b–c). Insulation profiles did not change (Extended Data Fig. 7d, Supplementary Fig. 2d), but insulation strength at boundaries was slightly reduced (Extended Data Fig. 7e, Supplementary Fig. 2e). P(s) showed a decrease in interaction frequency for loci separated by up to ~1Mb (Extended Data Fig. 7f, Supplementary Fig. 2f). Analysis of the derivative of P(s) showed evidence that in NBS2 buffer there was loss of loops (as seen by the reduced local minimum at around 1 Mb, Extended Data Fig.7f, Supplementary Fig. 2f, red arrows; see above and29). Cleavage of RAD21 led to further weakening of insulation at boundaries (Extended Data Fig. 7e, Supplementary Fig. 2e), and loss of more loops as inferred from the derivative of P(s).
We then investigated CTCF-CTCF loops specifically (Extended Data Fig. 7g, Supplementary Fig. 2g). In the presence of 200 mM NaCl, and with RAD21 intact, CTCF-CTCF loops were slightly reduced (up to 20% in different replicates, Fig. 3k). As expected, cleavage of RAD21 completely eliminated the remaining CTCF-CTCF loops.
In NBS2 buffer, and without TEV protease treatment, enrichment of intra-TAD interactions was reduced by ~50% (Fig. 3k). Thus, while CTCF-CTCF loops show only very minor sensitivity to salt concentration, enrichment of intra-TAD interactions was much more sensitive. After RAD21 cleavage enrichment of intra-TAD interactions was strongly reduced. As shown in Extended Data Fig. 6a–b, the majority of cohesin was lost from chromosomes under these conditions. The derivative of P(s) suggests many, but not all loops are lost (Extended Data Fig. 7f, Supplementary Fig 2f). The small number of cohesin complexes (10–30%) that are still retained may mediate these.
We conclude that RAD21 cleavage and increased salt concentration both contribute to loss of cohesin complexes from chromatin, and that these two parameters contribute differently to the loss of distinct classes of loops.
In the experiments described above, nuclei were purified from non-synchronized cell cultures, and therefore included nuclei in G1, S and G2. During S and G2 cohesin mediates interactions between sister chromatids. Some CTCF-CTCF interactions can be contacts between sister chromatids that are mediated by cohesive cohesin complexes36. Previous studies had shown that RAD21 cleavage can result in loss of inter-sister interactions8–11. To rule out that any of our results are due to loss of inter-sister interactions, we sorted G1 nuclei after TEV treatment and formaldehyde fixation of HAP1-RAD21TEV nuclei. Hi-C analysis shows highly concordant results with those obtained with unsorted nuclei and demonstrate that inter-sister interactions were not a major confounding factor (Extended Data Fig. 8, Supplementary Fig.3).
Intra-TAD interactions are stable upon chromatin expansion
We wondered whether RAD21 cleavage, and concomitant cohesin ring opening, would render intra-TAD interactions sensitive to mechanical disruption. We recently developed an experimental approach in which chromatin within nuclei can be made to swell extensively by incubating nuclei in a buffer containing 1 mM EDTA. Nuclei can then be shrunk to their original size by replacing the buffer with HBSS which will cause the chromatin fiber to condense. We reported that chromosome folding is elastic during expansion and contraction cycles37.
Expansion and contraction involve chromatin movement and therefore physical forces may be exerted on looping interactions mediated by cohesin. We used this approach to determine whether dramatic expansion of chromatin would irreversibly disrupt cohesin-dependent enriched intra-TAD interactions when RAD21 is cleaved. We plated HAP1-RAD21TEV nuclei on poly-D-lysine coated plates in HBSS buffer at 4°C (Fig. 4a, Supplementary Fig.4a). When we replaced the buffer with Expansion Buffer (EB) we observed that the cross-sectional area of nuclei increased ~7-fold, representing a ~18-fold increase in nuclear volume (Fig. 4b). When we then replaced the buffer with HBSS, nuclei contracted to close to their original size (1–1.2x their original size). We repeated these experiments after overnight incubation with TEV and found that expansion and contraction of nuclei was unaffected. Chromatin association of RAD21 and CTCF is not affected by expansion contraction cycles (Supplementary Fig.8c).
Fig. 4. Compartmentalization remains after nucleus expansion and contraction.
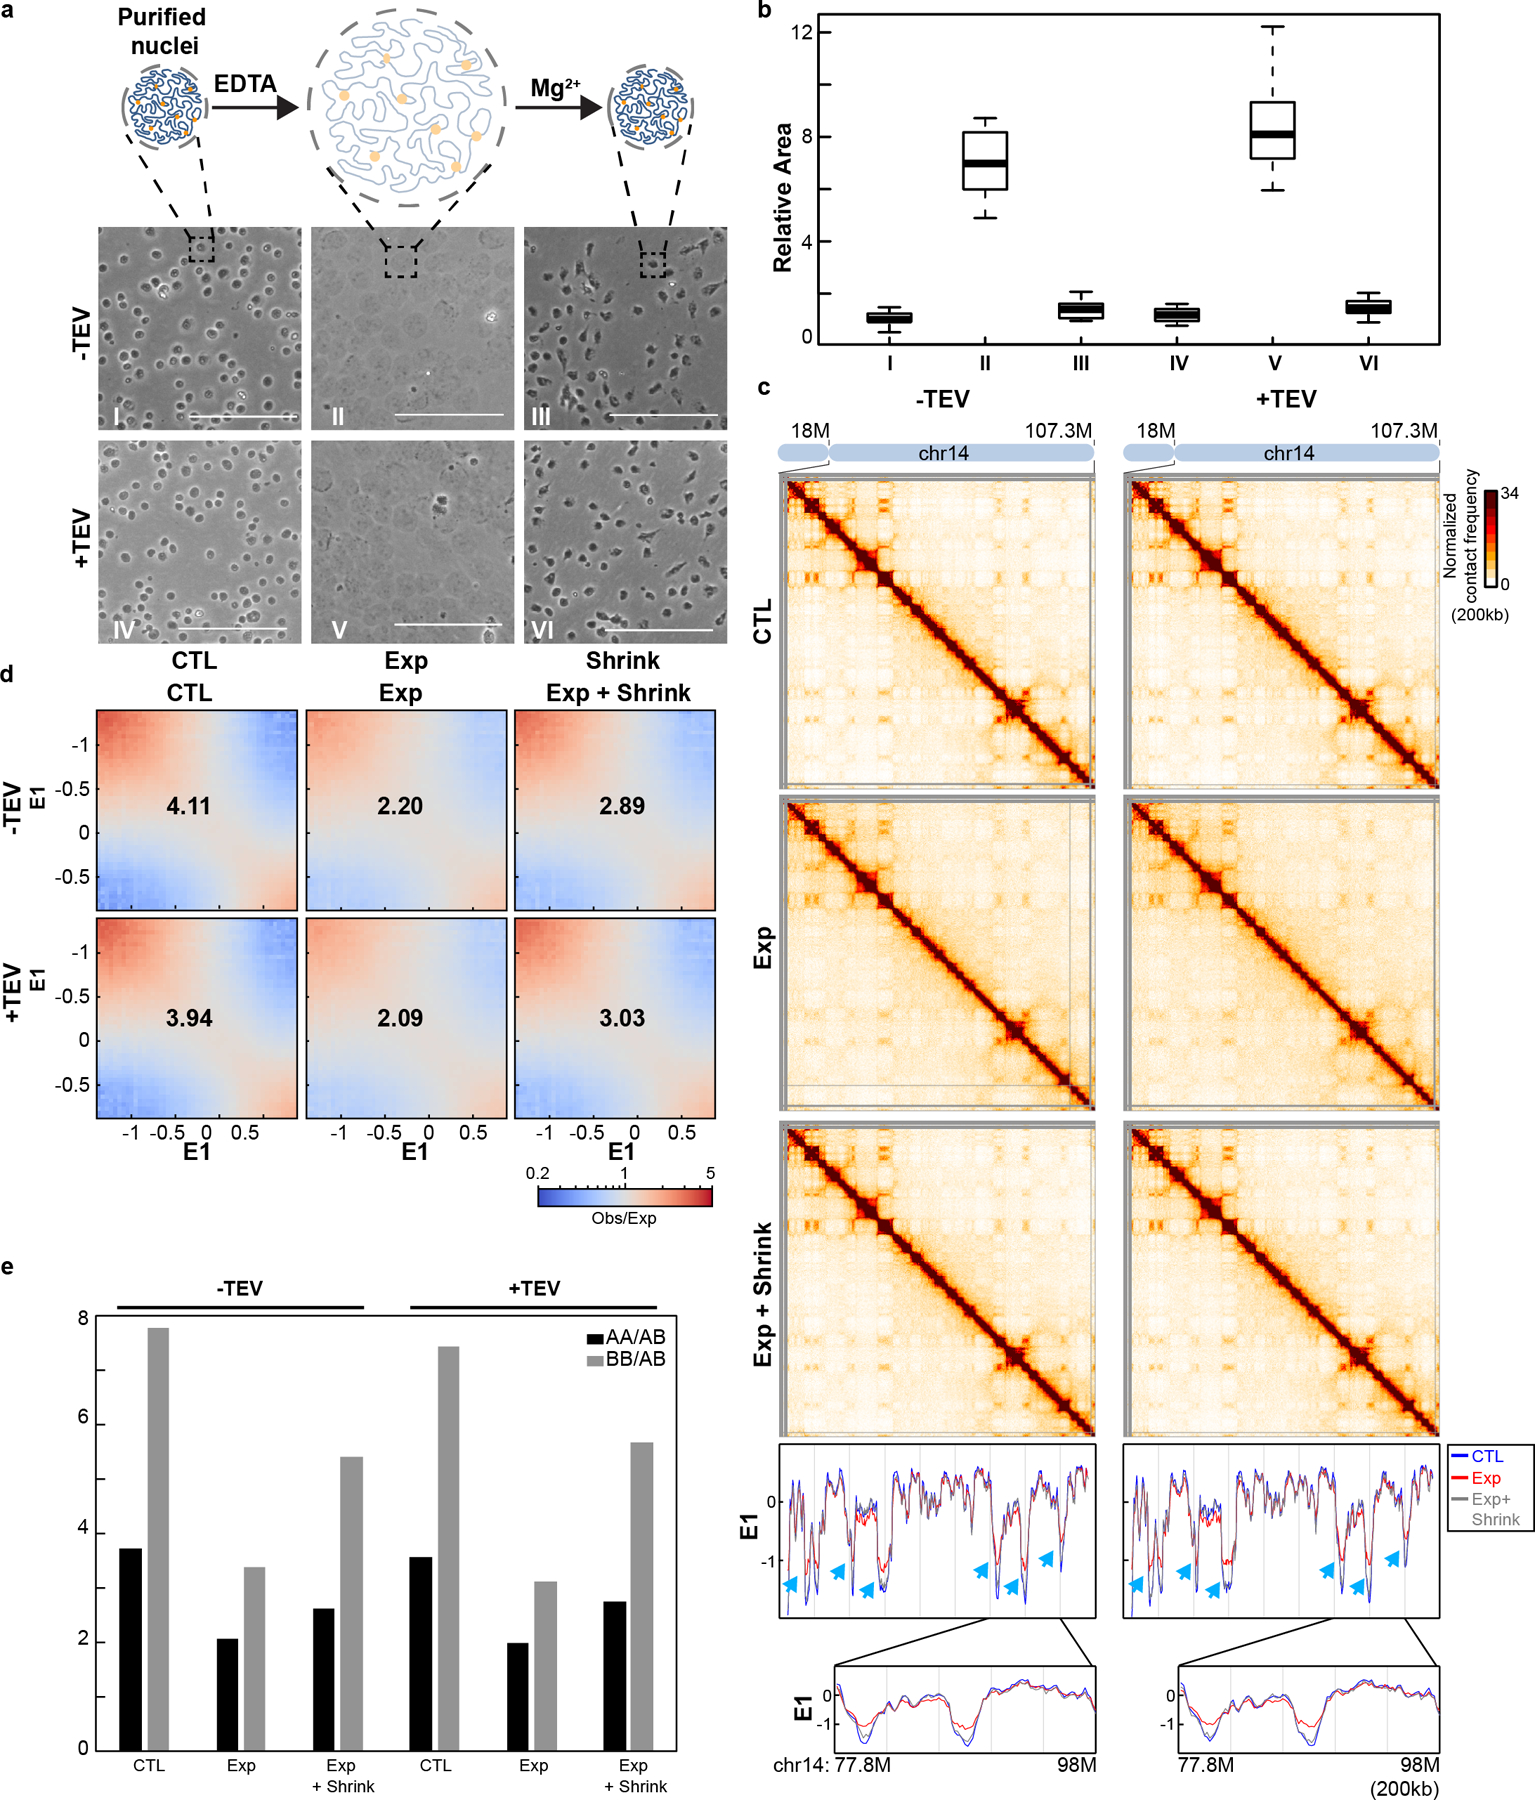
(a). Changes of nucleus morphology upon expansion and contraction of chromatin (see Methods). Upper, a schematic to show how nuclear morphology changes during chromatin expansion and contraction. Middle and bottom, expansion and contraction for HAP1-RAD21TEV nuclei treated with TEV as shown (Scalebar =100μm). (b) Nuclear cross-sectional area changes during the expansion and contraction. The area of 30 nuclei in each condition was measured and plotted using image J and R from the pictures in (a). Median cross-sectional area was set at 1, and fold change in area is shown for expanded and contracted nuclei. This panel represents biological replicate (n=1). (c) Hi-C interaction maps for HAP1-RAD21TEV nuclei before expansion, after expansion, and after expansion followed contraction treated with TEV as shown. Data for the 18–107.3 Mb regions of chromosome 14 is shown. Bottom panels: Eigenvector E1 across the 18–107.3 Mb regions of chromosome 14. The blue, red and grey lines represent control, expansion and contraction treatments, respectively. Blue arrows indicate E1 changes. Bottom, E1 across the 77.8–98Mb regions of chromosome 14. (d) Saddle plots for HAP1-RAD21TEV nuclei before expansion, after expansion, and after expansion followed contraction treated with TEV as shown. The numbers indicate compartment strength. (e) Interaction strength of compartments. The bars represent the strength of compartment interactions for each sample as described in Fig. 1h. See source data for numerical data.
Although HBSS and NBS1 are comparable in terms of their ionic strength we ensured that all results on the effects of RAD21 cleavage described above in NBS1 buffer were reproduced when nuclei were incubated in the HBSS buffer used for the expansion – contraction experiments (Extended Data Fig.9).
We then performed Hi-C on nuclei without expansion, on expanded nuclei, and on nuclei that we were first expanded then contracted (Fig. 4, see Supplementary Fig. 4 for a biological replicate). In these experiments RAD21 is intact. E1 profiles did not change, but compartmentalization strength was reduced when nuclei were expanded (Fig. 4c–e and Supplementary Fig.4b–d). When nuclei were contracted again, compartmentalization became stronger but did not reach the full strength observed before expansion. Insulation profiles were mostly unchanged, but we noticed a slight loss of insulation at domain boundaries (Fig. 5ab and Supplementary 5ab, left panels; Fig. 5c and Supplementary 5c, top panels). CTCF-CTCF loops, and enriched intra-TAD interactions became weaker upon expansion, and both regained full strength after nuclei were contracted again (Fig. 5d and Supplementary Fig.5d, upper panels). This weakening of interactions in expanded nuclei is likely the result of a general decrease in interaction frequency of loci separated by up to 1 Mb, as observable in P(s) plots (Fig. 5e and Supplementary Fig.5e, left panels). This general decrease in interaction frequencies can be explained by the fact that the contour length of the chromatin fiber (nm/kb) increases in expansion buffer37–39. Given that CTCF-CTCF looping interactions as well as enriched intra-TAD interactions regain full strength after contraction of nuclei, it is likely that these interactions were never lost upon expansion.
Fig. 5. Intra-TAD interactions remain after nuclear expansion and contraction.
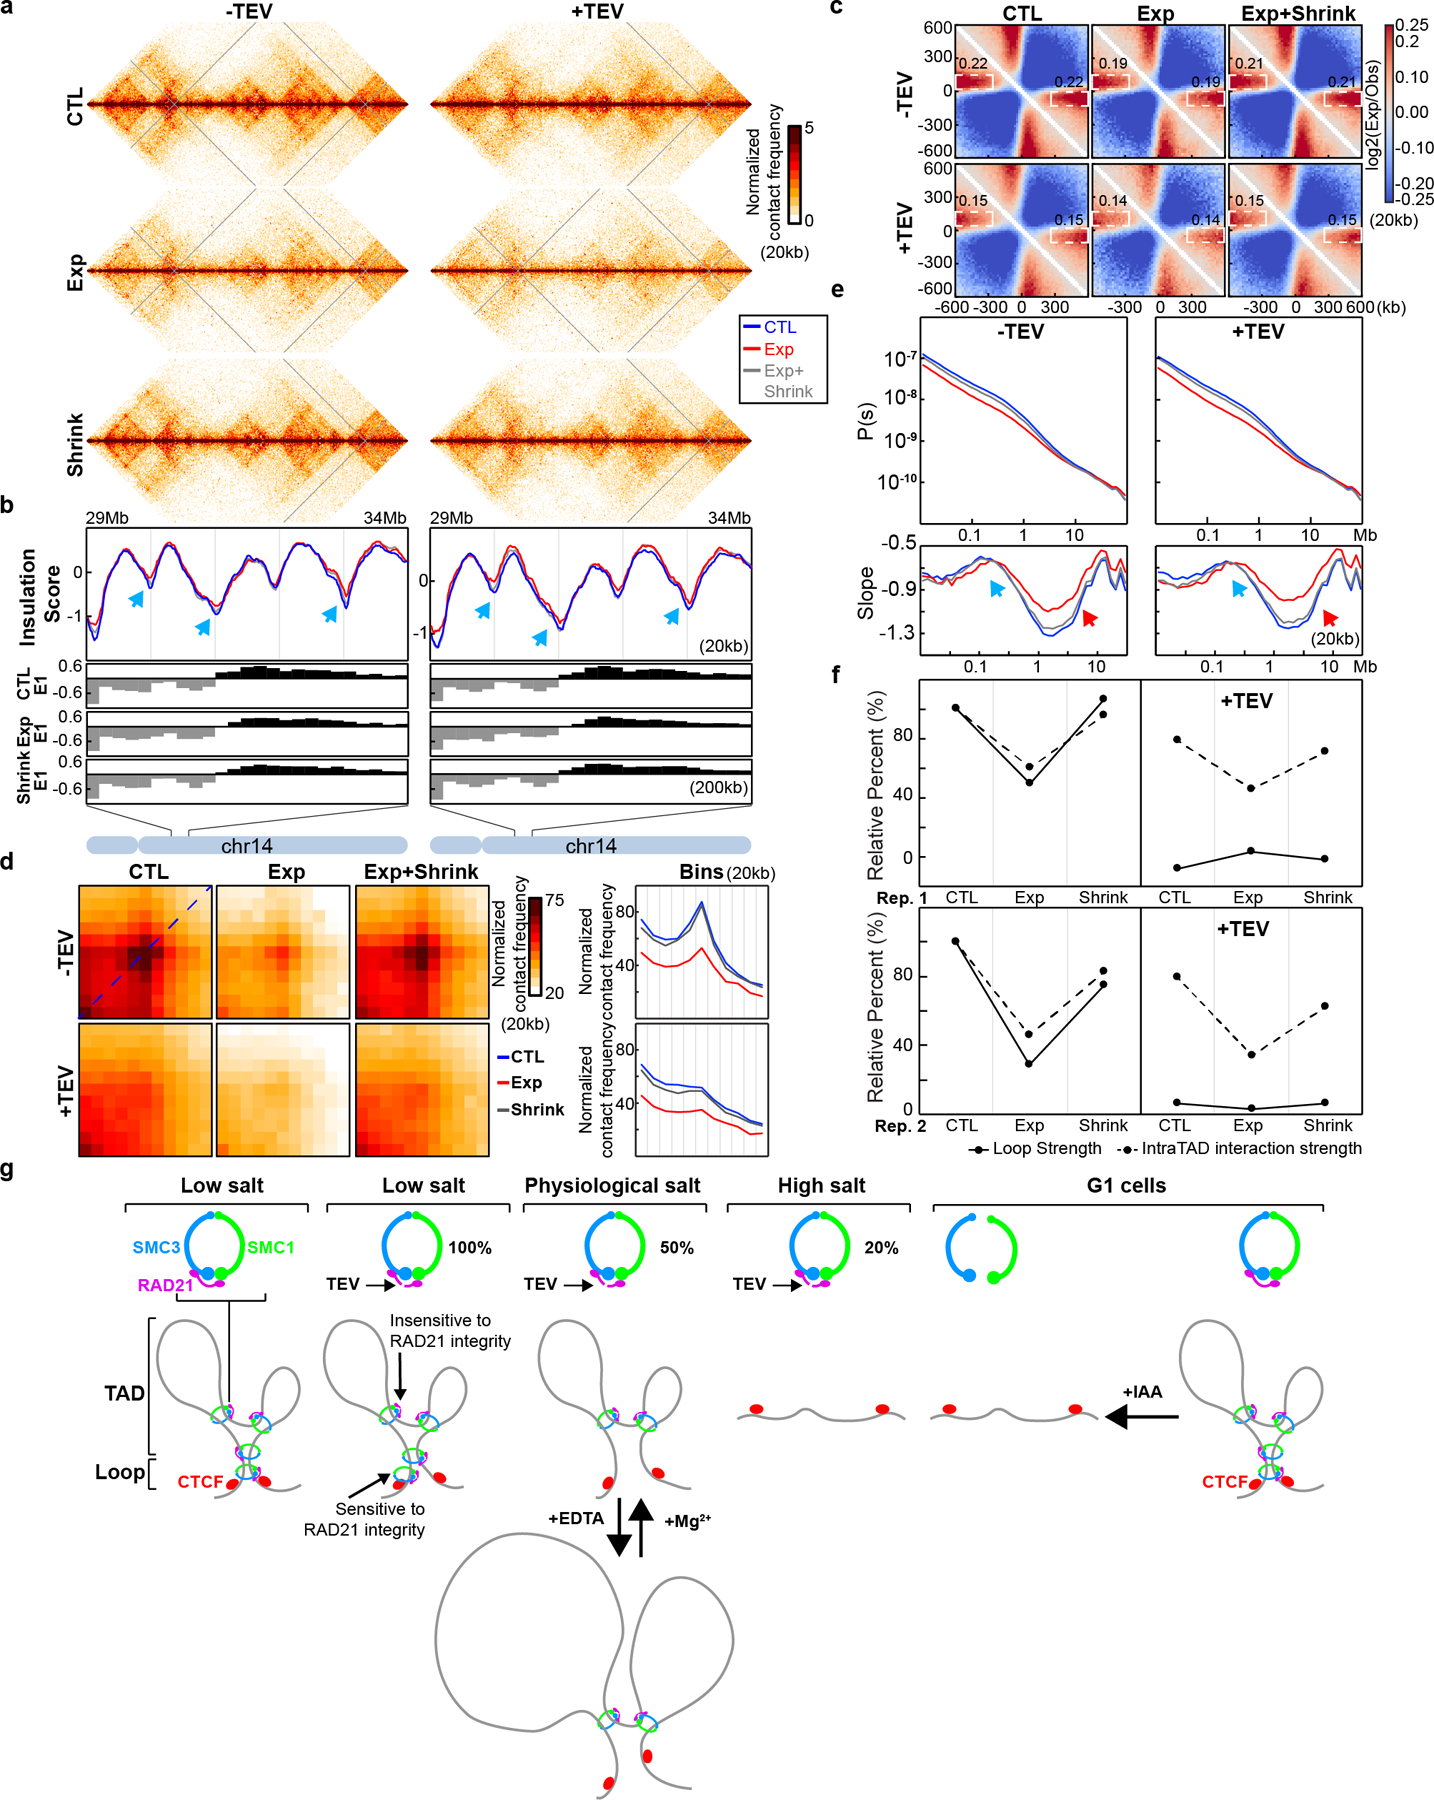
(a) Hi-C interaction maps for HAP1-RAD21TEV nuclei before expansion, after expansion, and after expansion followed contraction treated with TEV as shown. Data for the 29–34 Mb regions of chromosome 14 is shown. (b) Insulation profiles for the same region as in a. The blue, red and grey lines represent control, expansion, and expansion followed by compaction treatments, respectively. The blue arrows indicate weakened insulation boundaries as nuclei were expanded. The lower panels indicate compartment Eigenvector value E1 across the same region. (c) Aggregate Hi-C data at TAD boundaries identified in control sample (before expansion) without TEV treatment. Numbers at the sides of the cross indicate boundary strength (calculated as in Fig. 2h). (d) Aggregated Hi-C data at loops as used in Fig. 2j. Right panels: average Hi-C signals along the blue dashed line shown in the left upper Hi-C panel. (e) P(s) plots (upper panels), and the derivatives of P(s) plots (lower panels) for Hi-C data from the various conditions treated with TEV as shown. The blue arrows indicate the signature of cohesin loops in each condition. The red arrows indicate the changes of contact frequency at 2Mb. The reduced minimum in P(s) at ~2 Mb may be due to general loss of interaction for loci up to several Mb, as seen in P(s), and not due to loss of cohesin loops. (f) Quantification of loop strength and intra-TAD interaction strength in the various conditions treated with TEV as shown. Loop strength and intra-TAD interaction strength were calculated as in Fig. 1c. Loop strength and intra-TAD interaction strength from nuclei in NB buffer without TEV treatment was used to normalize. However, distance decay (36%) was not used to normalize intra-TAD interaction strength since distance decay of expanded nuclei in the complete absence of cohesin cannot be calculated here. Two biological replicates were shown. See source data for numerical data. (g) Illustration of two biochemically and possibly structurally distinct cohesin complexes at positioned CTCF-CTCF loops (dependent on RAD21 integrity) and at loops within TADs (not dependent on RAD21 integrity).
We performed the same analyses on nuclei in which RAD21 was cleaved before nuclei were expanded and contracted again. As described above for NBS1 buffer, after RAD21 cleavage in HBSS buffer before expansion insulation at boundaries is reduced and CTCF-CTCF loops were lost, while enriched intra-TAD interactions were still detected (Fig. 5d and Supplementary Fig.5d, lower panels). In expanded nuclei enriched intra-TAD interactions were reduced, but these were restored when nuclei were contracted again (Fig. 5d and Supplementary Fig.5d lower panels, and 5f right panels). Derivative of P(s) plots confirm that during expansion and contraction of nuclei the signature of cohesin-dependent loops remains present (Fig. 5e and Supplementary Fig.5e, bottom panels, arrows). We conclude that intra-TAD interactions are maintained upon extensive nuclear expansion and contraction even when RAD21 is cleaved.
DISCUSSION
We show that cohesins associate with chromatin and mediate looping interactions in different ways dependent on their genomic location (Fig. 5g). At CTCF sites, stable loops require closed cohesin rings that may (pseudo-)topologically embrace DNA. Within TADs, cohesin complexes can maintain loops even when the ring is opened by RAD21 cleavage. The results point to structural alterations of the complex, and possibly subunit exchanges, as cohesin loads on chromatin, travels along chromatin to extrude loops, and encounters CTCF-bound sites.
In recent years it has become evident that besides its role in sister chromatid cohesion, the cohesin complex has additional roles in chromosome folding. Cohesin extrudes chromatin loops all along chromosomes. While many loops are dynamically formed and not positioned at specific reproducible genomic positions, blocking of extrusion at CTCF sites results in a subset of loops that are specifically anchored at CTCF sites. How cohesin mediates loop formation, and whether it interacts with DNA similar to when it mediates cohesion is unknown. Recent single molecule experiments using covalently closed cohesin rings suggest that loop extrusion can occur without the need for ring opening at any point during the loading and extrusion process, pointing to potential differences in cohesin-DNA interactions during cohesion and extrusion40. Several structures of (parts of) the cohesin complex in association with DNA have been solved, and together with loop extrusion simulations these suggest that the cohesin ring may not need to open during loop formation35, 41, 42.
We show that cohesin ring opening through RAD21 cleavage results in loss of positioned loops at pairs of CTCF sites, while other cohesin-dependent loops within TADs and loops anchored at only one CTCF site (producing stripes) are maintained (Extended Data Fig. 10). When RAD21 was cleaved in low salt buffer, CTCF-CTCF loops were reduced by about 50%. Chromatin binding assays showed minimal loss of cohesin subunits from chromatin. Interestingly, ChIP showed that after cleavage, RAD21 binding to CTCF sites was not reduced under low salt conditions. This indicates that CTCF-CTCF looping interactions are more sensitive to RAD21 cleavage than RAD21 chromatin binding at CTCF sites. Possibly the interaction between cohesin and CTCF is stable enough under low salt conditions to maintain cohesin at CTCF sites even after RAD21 is cleaved. Direct co-IP experiments confirmed that CTCF and RAD21 directly interact, and this interaction is reduced at higher salt and after RAD21 cleavage (Supplementary Fig. 8h). Under physiological salt conditions, cleavage of RAD21 results in complete loss of CTCF-CTCF loops, loss of RAD21 binding at CTCF sites and ~50% decrease in chromatin bound cohesin complexes. Previously we showed that fragmenting chromatin with a restriction enzyme results in loss of CTCF-CTCF loops and loss of ~50% of chromatin-bound cohesin complexes34. Therefore, CTCF-CTCF loops and cohesin association with CTCF sites are abolished when either the DNA is fragmented, or the cohesin complex is cleaved. Taken together these observations suggest that at CTCF sites, and possibly promoters, DNA is passing through the cohesin ring. CTCF-CTCF loops and cohesion are both sensitive to RAD21 cleavage, pointing to similarities in the way cohesin associates with DNA as it stabilizes loops at CTCF sites, and when it mediates sister chromatids cohesion.
Cohesin-dependent interactions within TADs were maintained after RAD21 cleavage but, in contrast to CTCF-CTCF loops were salt sensitive even when RAD21 was intact. This suggests that when cohesin extrudes loops within TADs, it is associated with DNA in a different way, at least during some steps of the extrusion process, as compared to when it mediates positioned loops between pairs of CTCF sites. The salt sensitivity of DNA binding of this subpopulation of cohesin complexes suggests they do not encircle DNA. A cryo-EM structure of the cohesin complex in the presence of NIPBL, which is required for extrusion40, shows that DNA is tightly held between NIPBL, RAD21 and the SMC head domains41. Modeling suggests cohesin’s tight grip on DNA is part of a cycle of dynamic changes in cohesin that drives loop extrusion41, 42. A tight binding to DNA can explain why cleaved cohesin can still maintain loops within TADs even after nuclear expansion and contraction. Our results that dynamically extruding cohesin complexes within TADs maintain loops after RAD21 cleavage and possibly do not entrap DNA are consistent with recent finding in S. cerevisiae: Srinivasan and co-workers showed that a mutant cohesin complex (smc1DDsmc3AAA) that cannot entrap DNA can still load onto and move along chromatin7. Our interpretation that cohesin can associate with DNA in two ways, one dependent on ring integrity (at CTCF-CTCF loops) and one that does not (within TADs), is consistent with Srinivasan’s conclusion that cohesin in yeast can associate topologically (to mediate cohesion) and non-topologically (to associate and move along chromatin). Finally, our data unify and explain apparently disparate results in the literature where complete RAD21 degradation or RAD21 cleavage have quantitatively different effects on chromatin looping22, 23.
Assuming that cohesin that mediates loops within TADs is actively extruding until it encounters CTCF sites, our data suggest that extruding cohesin initially holds DNA tightly but then alters its conformation and the manner in which it associates with DNA upon engaging with CTCF. Possibly this involves subunit exchange and/or ring opening and closing to establish cohesin complexes that hold pairs of CTCF sites together in a manner that is related to how cohesin holds pairs of sister chromatids. Future studies can address this aspect of cohesin dynamics.
Methods
Cell culture
HCT-116-RAD21-mAID-mClover cells were kindly provided by Natsume et al., 20161. These cells were cultured in McCoy’s 5A medium, GlutaMAX supplement (Gibco, 36600021) supplemented with 10% FBS (Gibco, 16000044) and 1% penicillin-streptomycin (Gibco, 15140) at 37°C in 5% CO2. HAP1 cells were purchased from Horizon Genomics (Cambridge, UK, C859). Both HAP1 and HAP1RAD21-TEV cells were cultured in IMDM medium, GlutaMAX supplement (Gibco, 31980097) supplemented with 10% FBS (Gibco, 16000044) and 1% penicillin-streptomycin (Gibco, 15140) at 37°C in 5% CO2.
Cell cycle analysis and G1 cell sorting
For cell cycle analysis, cells were washed using 1xPBS once and fixed in 90% ethanol at −20°C for at least 24 hours. Fixed cells were washed in 1xPBS and then resuspended in PBS containing 2mM MgCl2, 0.5mg/ml RNase A(Roche, 10109169001), 0.2uM FxCycle far red (200uM stock in DMSO, Thermo Fisher F10348). The samples were incubated at 20°C for 30min and then analyzed using an LSRII flow cytometry instrument with red and green channels to monitor DNA contents and GFP signals for RAD21 levels, respectively.
To arrest cells in G1 phase, we first treated the cells with 2mM thymidine for 12 hours to arrest cells in S phase, then fresh medium was added after washing the cells with PBS twice. After growing in fresh medium for 12 hours, the cells were treated with 400uM mimosine for 12 hours, and the cells were arrested at the boundary of G1/S. To sort G1 cells for Hi-C analysis, cells were fixed following the Hi-C protocol using 1% FA. Fixed cells were washed in 1xPBS and then resuspended in PBS containing 2mM MgCl2, 0.1% Saponin, 0.5mg/ml RNase A (Roche, 10109169001), 0.2uM FxCycle far red (200uM stock in DMSO, Thermo Fisher #F10348). The samples were incubated at 20°C for 30min then analyzed using an BD FACS Aria II flow cytometry instrument with red and green channels to monitor DNA content and RAD21 levels, respectively. To avoid obtaining any cells in S phase, only the cells in left part of G1 peak were collected (red dashed box in Supplementary Figure 3). FACS data were processed and analyzed using FlowJo v.3. Viability gates using forward and side scatter were set on each sample. DNA content was plotted as a histogram of the red channel while RAD21 level was plotted as a histogram of the green channel.
Creation of HAP1-RAD21TEV cells
The pSpCas9(BB)-2A-Puro (PX459) v.2.0 plasmid (F. Zhang lab) was obtained from Addgene (#62988) and used to construct the CRISPR/Cas vector according to the protocol of Ran et al.2 The sequence of the gRNA used to generate HAP1-RAD21TEV is CTCATCTATGTTTGTTCTGC.
To construct a donor plasmid for insertion of tandem TEV motifs, a pCMV-based plasmid was constructed using the following three templates:
As below, the sequence including three TEV motifs was inserted between chr8: 117,864,243 and 117, 864, 244. This sequence was obtained from3
AGGGCTAGAGAGAATTTGTATTTTCAGGGTGCTTCTGAAAACCTTTACTTCCAAGGAGAGCTCGAAAATCTTTATTTCCAGGGAGCTAGC
5’ homology arm of insert site (2,027bp, chr8:117,862, 217 – chr8:117,864,243),
3’ homology arm of insert site (2,032bp, chr8: 117,864,244 – chr8: 117, 866, 275)
The genomic co-ordinates are from hg19, and T at chr8:117,864,244 was mutated to A to create the AvrII digestion site for cloning and genotyping purpose. This changes codon CCA (Proline) to CCT (proline).
Genomic DNA from HFF1 cells was used as template for homology arms, which were amplified using Q5 High-Fidelity DNA Polymerase (New England Biolabs, #M0491). Both homology arms and TEV motif sequence were cloned into pCMV plasmid by Gibson assembly using NEBuilder HiFi DNA Assembly Master Mix (NEB, #E2621) and the sequence was confirmed by Sanger sequencing.
To generate stable cell lines, 0.5 × 10⁶ cells were plated and transfected with CAS9-gRNA and linearized donor plasmids using TurboFectin 8.0 (OriGene, USA), following the instructions. Before transfection the medium was changed with antibiotics-free medium containing 0.1uM SCR74. Twenty four hours after transfection, 2 μg/ml of puromycin was added and, 2 days later, the surviving cells were diluted in 96-well plates to obtain single cell derived colonies for further screening. HAP1-RAD21TEV cells genotyped by PCR and were further confirmed using a TEV cleavage assay (see below).
Nucleus purification and TEV cleavage
Nuclei were purified according to Sanders et al5. Briefly, HAP1-RAD21TEV cells were trypsinized, collected in medium, and counted. Around 100million cells were collected and washed in cold PBS twice, and once in NB buffer (10mM PIPES pH 7.4, 2mM MgCl2, 10mM KCl, protease inhibitor (PI, ThermoFisher, #78438)). The cells were then re-suspended in NB buffer with 0.1% NP-40, 1mM DTT, and protease inhibitors, and incubated on ice for 10mins. The cells were lysed using a Dounce homogenizer with pestle A and then loaded onto a sucrose cushion (NB buffer + 30% sucrose + 1mM DTT and 5ml of cell lysis for 20ml sucrose cushion), and finally centrifuged at 800g for 10mins. The nucleus pellets were washed once in cold NB buffer, then resuspended in NB and counted. Around 4 or 10 million nuclei were plated onto 60mm or 100mm poly-D-lysine culture dishes, respectively (Corning BioCoat, #356469 and #354468), and incubated at 4°C overnight. For the TEV cleavage assay, 150 units of TEV enzyme (AcTEV Protease, Thermo Scientific, 12575–015) were added to 10 million nuclei in 10ml buffer (15U/ml TEV) before the nuclei were plated onto the dishes and kept at 4°C overnight. Control plates contained no TEV, otherwise TEV concentrations were as indicated in Figures.
Hi-C for sorted G1 nuclei
Nuclei were purified as described above. Around 30 millions of nuclei were resuspended in 14ml NB or NB + 132mM (NBS1) buffers in 15ml falcon tubes. To the samples where RAD21 was to be cleaved, 15U/ml of TEV protease was added. All tubes were gently mixed well and incubated at 4C overnight. After fixation in 1% formaldehyde (FA), nuclei were washed once with PBS and then stained using propidium iodide (PI). G1 nuclei were then sorted using an BD FACS Aria II flow cytometry instrument with red channel to monitor PI (DNA content). To avoid obtaining any S phase cells, only the cells in left part of the G1 peak were collected as described above. Around 1million G1 nuclei were collected and washed twice using 500ul cold NEBuffer 3.1. Cautions should be taken when nuclei were spun down at 1000g for 5minutes. After wash, nuclei were resuspended in 300ul NEBuffer 3.1 with 0.1% SDS and incubated in 65°C for 10min. The following steps are the same as below for DpnII digestion.
Hi-C for expanded and contracted nuclei
Nucleus expansion experiments were performed as described in5. Briefly, after nuclei were attached to poly-D-lysine coated dishes overnight at 4°C, nuclei were washed once with HBSS, then quickly washed twice with Expansion Buffer (EB: 1mM EDTA, 10mM HEPES, pH 7.4). After washing, nuclei were kept in 10ml EB at room temperature for 4 hours before nuclei were fixed in 1% FA for Hi-C analysis. In the control plates, the nuclei were also washed for 4 times using HBSS buffer and kept in HBSS buffer for 4 hours. For nuclei contraction experiments, nuclei were first expanded in EB buffer for 4 hour as described above, then EB buffer was exchanged for HBSS buffer and nuclei kept at room temperature for another 1 hour before fixation with 1% FA for Hi-C analysis.
Hi-C experiments
Hi-C for fixed cells was performed as described previously6. For the nuclei treated as described above, Hi-C protocol was modified. Briefly, for the nuclei attached on the plate, the buffer used in each condition was replaced with the same buffer but containing 1% FA, then the plates were kept at room temperature for 10mins with a few times of gently shaking. After 10 minutes, 2% of 2.5M glycine was added to quench FA for 5 minutes, and the plates were kept on ice for at least 15 minutes. The fixed nuclei were then scratched from the plates and washed twice using NEBuffer 2. For the nuclei using HindIII digestion, from this point, the following steps are the same with that for the cells. Briefly, 35ul of 1% SDS was added to 312ul nuclei in NEBuffer 2 and the tube was gently mixed. The tube was then incubated in 65°C for 10min and then put on ice immediately. Before 400U HindIII was added, 40ul of 10% Triton X-100 was added and gently mixed. HindIII digestion was performed at 37°C overnight with gently rocking. For the nuclei using DpnII digestion, after cold NEBuffer 3.1 washing twice, 300ul NEBuffer 3.1 with 0.1% SDS was added and then the nuclei were scratched off the plate and collected. The nuclei in NEBuffer 3.1 + 0.1%SDS were then directly incubated in 65°C for 10mins and the n put on ice immediately. Before 400U DpnII was added, 40ul of 10% Triton X-100 was added and gently mixed. DpnII digestion was performed in 37°C for overnight with gently rocking. Once enzyme digestion was done, the reaction was incubated at 65°C for 10mins to inactivate HindIII or DpnII. After this, the DNA overhanging ends were filled in with biotin-14-dCTP for HindIII digested chromatin, or biotin-14-dATP for DpnII digested chromatin, at 23 °C for 4 hours and then ligated with T4 DNA ligase at 16 °C for 4 hours. DNA was treated with proteinase K at 65 °C overnight to remove cross-linked proteins. Ligation products were purified, fragmented by sonication to an average size of ~200 bp and size-selected to fragments of 100–350 bp. We then performed end repair and dA-tailing and selectively purified biotin-tagged DNA using streptavidin beads. Illumina TruSeq adapters were added to form the final Hi-C ligation products, samples were amplified and the PCR primers were removed. Hi-C libraries were then sequenced using PE50 bases on an Illumina HiSeq 4000 instrument.
Hi-C and data analysis
Hi-C PE50 fastq raw sequencing files were mapped onto hg19 human reference genome using distiller-nf mapping pipeline (https://github.com/mirnylab/distiller-nf). After mapping, aligned reads were further processed to remove duplicates (https://github.com/mirnylab/pairtools) to obtain a set of filtered reads defined as valid pairs. Valid pairs were then binned into contact matrices at 20 kb and 200 kb resolutions using cooler50. Intrinsic Hi-C biases were removed using the Iterative Correctionm and Eigenvector decompositiom (ICE) procedure7 was applied to all of the matrices, ignoring the first two diagonals to avoid short-range ligation artefacts at a given resolution, and bins with low coverage were removed using the MADmax filter with default parameters. Contact matrices were stored in ‘.cool’ files and used in downstream analyses.
For downstream analyses using cWorld scripts, (https://github.com/dekkerlab/cworld-dekker) cooler files were first converted to matrix files using cooltools dump_cworld (https://github.com/mirnylab/cooltools). The matrix files were then scaled to 1 million reads using cworld scaleMatrix before other analyses. For contact matrix visualization of a region, the matrix of this region was first extracted using cworld extractSubMatrices and the heat map of the region was generated using cworld heatmap.
For aggregation of loop interactions, the previously identified sets of HCT-116-RAD21-mAC and HAP1 looping interactions were used, respectively8, 9. In total, 3169 and 8334 looping interactions are on the structurally intact chromosomes of HCT-116-RAD21-mAC and HAP1, respectively. To visualize the looping interactions, we aggregated 20 kb binned data at all loops using cworld interactionPileUp. We also aggregated 20kb binned data at different sizes of loops, 100kb-500kb, 500kb-1Mb and greater than 1Mb. The size of a loop refers to the distance between the two loop anchors.
For P(s) plots and derivatives, the cis reads from the valid pairs files were used to calculate the contact frequency (P) as a function of genomic separation (s) (cooltools). All of the P(s) curves were normalized for the total number of valid interactions in each dataset. Corresponding derivative plots were calculated from each P(s) plot.
For interaction aggregation at TAD boundaries, we first calculated observed/expected Hi-C matrices of each sample for 20 kb binned data, correcting for average distance decay as observed in the P(s) plots (cooltools compute-expected). We then aggregated the observed/expected Hi-C matrices of each sample at the TAD boundaries that were identified from the sample without any treatments, covering 600kb up and downstream of each boundary, and then generated a pileup heatmap of TAD boundaries for each sample.
For compartment analysis, compartment boundaries were identified in cis using eigen vector decomposition on 200 kb binned data with the cooltools call-compartments function. A and B compartment identities were assigned by gene density tracks such that the more gene-dense regions were labelled A compartments, and the PC1 sign was positive. Changes in compartment type therefore occur at locations where the value of PC1 changes sign. Compartment boundaries were defined at these locations, except for when the sign change occurred within 400 kb of another sign change. We noticed that translocation between chr9 and chr22 in HAP1 cells affects compartment assignment on chr9, thus we excluded chr9 for the subsequent compartment analysis for all HAP1 cells.
To measure compartmentalization strength, we calculated observed/expected Hi-C matrices for 200 kb binned data, correcting for average distance decay as observed in the P(s) plots (cooltools compute-expected). We then arranged observed/expected matrix bins according to their PC1 values of the sample without any treatments in each replicate. We aggregated the ordered matrices for each chromosome within a dataset and then divided the aggregate matrix into 50 bins and plotted, yielding a saddle plot (cooltools compute-saddle). Strength of compartmentalization was defined as the ratio of (A–A + B–B)/(A–B + B–A) interactions. Strength of A-A and B-B interactions were separately calculated using AA/AB and BB/BA, respectively. The values used for this ratio were determined by calculating the mean value of the 10 bins in each corner of the saddle plot.
For Stripes analysis, the Stripenn pipeline was used to de novo detect the stripe structures10. Briefly, Hi-C data from six replicates without or with TEV protease treatment in NB buffer, were pooled together and mapped onto hg19 using Distiller pipeline. Then the stripes were called at 10kb with the default settings, -m 0.95,0.96,0.97,0.98,0.99. In total, 2614 stripes were identified and 1,069 of 2,614 stripes have p values < 0.05 and Stripiness >0 and were selected for aggregation analysis. For interaction aggregation at Stripes, we first calculated observed/expected Hi-C matrices of each sample for 20 kb binned data, correcting for average distance decay as observed in the P(s) plots (cooltools compute-expected). We then aggregated the observed/expected Hi-C matrices of each sample at the 506 3’-stripes and 563 5-stripes, respectively, covering 2mb up and downstream of each stripe, and then generated a pileup heatmap of stripes for each sample.
Western blot for cohesin components
For each condition, 4 millions of nuclei were plated on 60mm poly-Lysine coated plates in 4ml buffer at 4°C for overnight. To analyze released cohesin proteins, 3ml buffer was collected and spun at 800g for 10 minutes to remove unattached nuclei. The supernatants were then concentrated using Amicon columns (3KDa, #UFC500396). After concentration, the final volume of each concentrated sample was adjusted to 200ul and 50ul of 5x sample buffer (ThermoFisher, #39000) was added. The samples were then boiled at 100°C for 5 minutes before western blot analysis. To analyze cohesin proteins retained in nuclei, all buffers were completely removed from each plate and 200ml RIPA buffer (Thermo Fisher, #89900) containing protease inhibitor and TurboNuclease (Accelagen, #N0103M) were added to each plate. All the plates were then incubated at 4°C for 10minutes and the lysed nuclei were scratched and collected. After spun at 8000g for 10 minutes, the supernatant was transferred to a new tube and 5x sample buffer was added. After mixing, the lysis was boiled at 100°C for 5mins for western blot analysis.
The volume for approximately the same number of cells or nuclei for each sample was loaded into each lane of a protein gel for separation. Two types of protein gel and buffer were used. To separate small proteins (MW<50KD), NuPAGE 4–12% Bis-Tris protein gels (Thermo Fisher, #NP0322BOX) was used with NuPAGE MOPS SDS Running Buffer (Thermo Fisher, #NP0001). For large proteins (MW > 100kD), NuPAGE 3–8% Tris-Acetate protein gels (Thermo Fisher, #EA03752BOX) were used in NuPAGE Tris-Acetate SDS running buffer (Thermo Fisher, #LA0041). Proteins were transferred to nitrocellulose membranes (Bio-Rad, #1620112) at 30 V for 2 h in 1× transfer buffer (Thermo Fisher, #35040) in the cold room. The membranes were blocked with 5% milk in TBST (20mM Tris-HCl, pH 7.4, 150mM NaCl and 0.1% Tween-20) for 30 minutes at room temperature. The membranes were then incubated with the specified primary antibodies diluted 1:1,000 in TBST overnight at 4°C. The membranes were washed three times with TBST for 10 min at room temperature each, then incubated with secondary antibodies (anti-rabbit IgG HRP-linked, Cell Signaling, 7074) diluted 1:5,000 in TBST for 2 hours at room temperature. The membranes were then washed three times with PBS-T for 10 min each. Then, the membranes were developed and imaged using SuperSignal West Dura Extended Duration Substrate (Thermo, #34076) and Bio-Rad ChemiDoc with Image Lab 6.0.1.
Nucleus ChIP-seq experiments
ChIP-seq experiments were based on the protocol in our recent work with some minor modifications11. Briefly, for each condition, 40 millions of nuclei were plated on two 100mm poly-Lysine plates. After FA fixed, nuclei were washed twice using washing buffer (20mM TrisHCl pH8.0 + protease inhibitor), then 900ul sonication buffer (20mM Tri-HCl pH 8.0, 0.2% SDS, 0.5% sodium deoxycholate, and protease inhibitor) was added to each plate and the nuclei were scraped and collected. The chromosomes were sonicated to fragments around 200–500bp using BioRaptor Pico (30sec ON, 30sec OFF, 8 cycles). After spinning at 16,000g for 10min, the fragmented chromatin in the supernatant was split into aliquots of 5 millions nuclei per tube and diluted in 1200ul IP buffer with final 0.1% SDS concentration (20mM Tri-HCl pH 8.0, 150mM NaCl, 2mM EDTA, 0.1% SDS, 1% Triton-100, and protease inhibitor). For each tube, around 4ug of antibody was added and for each antibody, 10 million nuclei were used for ChIP. The primary antibodies used in this study included, CTCF (Millipore, #07–729), RAD21 (Abcam, #ab154769, recognizes N-terminal of RAD21), RAD21 (Abcam, #ab992, recognizes C-terminal of RAD21), and Rabbit IgG (Sigma, #I-5006). Chromatin was incubated with primary antibodies on a rocker at 4°C for overnight. After rewashing with IP buffer, 20ul of Dynabeads Protein G (Thermo Fisher, #10004D) were added to each tube followed by incubation on a rocker at 4°C for 2 hours. After the beads were washed for three times, immunoprecipitated DNA was eluted and 5ng ChIP DNA was used to prepare sequencing libraries in the same way as described for Hi-C above.
ChIPseq data analysis
Sequencing reads were mapped onto hg19 using Bowtie 2. HOMER 4.6 was used to clean mapped reads, examine quality of ChIP experiments, call peaks and generate visualization files12. Both profile and cluster plots of ChIPseq signals were generated using Deeptools 3.0.213. Lists of active TSSs in HAP1 cells were obtained from our recent work11. Briefly, publicly available active mark H3K4me3 ChIP-seq signal was used to rank annotated TSSs from the most active to inactive14, 15. Top 13, 412 TSS were selected as Active TSSs in HAP1. For stacking analysis in Extended Fig. 7b and 7c, TSSs overlapped with CTCF peaks were used as TSS with CTCF peaks, while TSSs that are at least 2kb away from a CTCF sites were used as TSS with no CTCF peaks.
Boxplot
All the boxplots were drawn using the boxplot() function in R with default settings, the box starts in the first quartile (25%) and ends in the third quartile (75%) with the line in the box indicating the median. The whiskers show that the data extends to maximum (upper) and minimum (lower) without outliers. The outliers are the data points that are greater than Q3+1.5*IQR (upper outlier), or less than Q1–1.5*IQR (lower outlier). Q1 and Q3 refers to the first and third quartile, respectively. IQR refers to internal-quartile range. The outliers are shown as solid square.
Statistics and Reproducibility
No statistical method was used to predetermine sample size. Unless specified in the legends, Western blot analyses have been performed at least three times. Nucleus morphology analyses have been performed for at least two replicates. All Hi-C and ChIPseq analyses have been performed for two biological replicates.
Extended Data
Extended Figure 1. Cell cycle profiles of the HCT-RAD21-mAC cells in different conditions for Hi-C experiments.
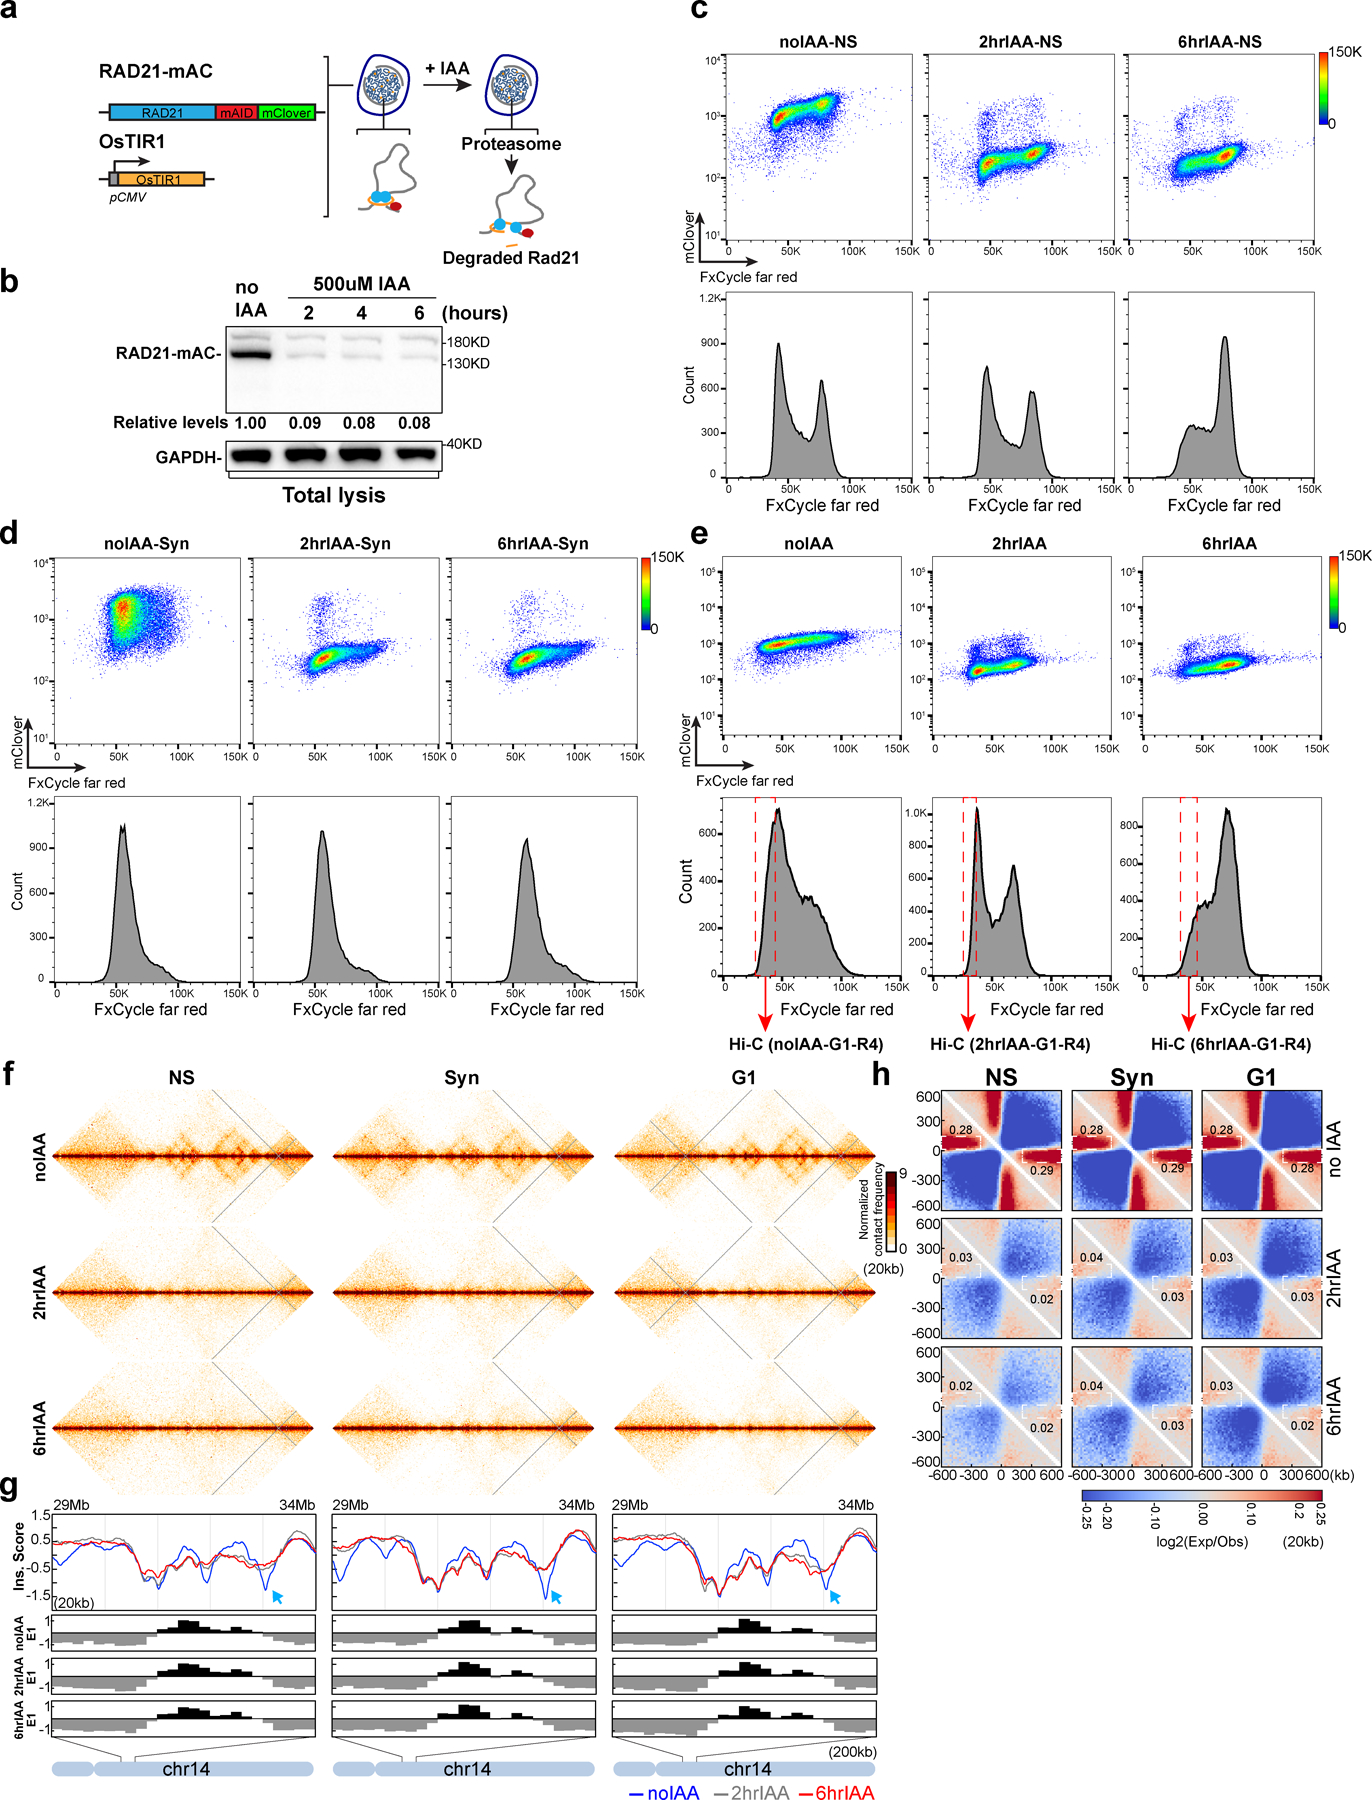
(a) Schematic of HCT-RAD21-mAC cells (a gift from Dr. Kanemaki’s lab)48. After treatment with 500uM IAA, RAD21-mAC was degraded. (b) Western blot analysis of RAD21 degradation in HCT116-RAD21-mAC cells after 500uM IAA treatments for various times as indicated. GAPDH was used as loading control. Numbers indicate the relative level of intact RAD21. (c) FACS analysis of non-synchronous HCT116-mAC cells treated with IAA as shown. DNA was stained using fxCycle-far red and RAD21 was tagged with mClover. Upper panels are 2D scatter plots indicating DNA content and RAD21 levels before and after IAA treatment. Lower panels, histograms indicating cell cycle stage distributions for cultures with and without IAA treatment. The same staining method was used for (d) and (e). (d) FACS analysis of G1 synchronized HCT116-mAC cells treated with IAA as shown. Upper panels: plots of DNA contents vs RAD21 levels treated with IAA as shown. Lower panels: cell cycle stage distributions treated with IAA as shown. (e) FACS analysis of non-synchronous HCT116-mAC cells treated with IAA as shown. G1 cells were sorted from these non-synchronous cells for Hi-C analysis. Upper panels are 2D scatter plots DNA content and RAD21 levels treated with IAA as shown. Lower panels, histogram graphics indicate cell cycle profiles treated with IAA as shown. Red dashed boxes indicate the G1 population that were sorted and collected for Hi-C analysis. (f) Hi-C interaction maps for non-synchronous (NS), synchronous (Syn), and G1 cells treated with IAA as shown. Data for the 29–34 Mb region of chromosome 14 are shown. (g) Insulation profiles for the same region as in f. The blue, grey and red lines represent 0, 2 and 6 hour IAA treatment, respectively. The lower panels indicate compartment Eigenvector value E1 across the same region. (h) Aggregate Hi-C data at TAD boundaries that were identified in each condition without IAA treatments. The numbers at the sides of the cross indicate the boundary strength.
Extended Figure 2. Three replicates of Hi-C analysis of G1 cells without and with IAA treatment.
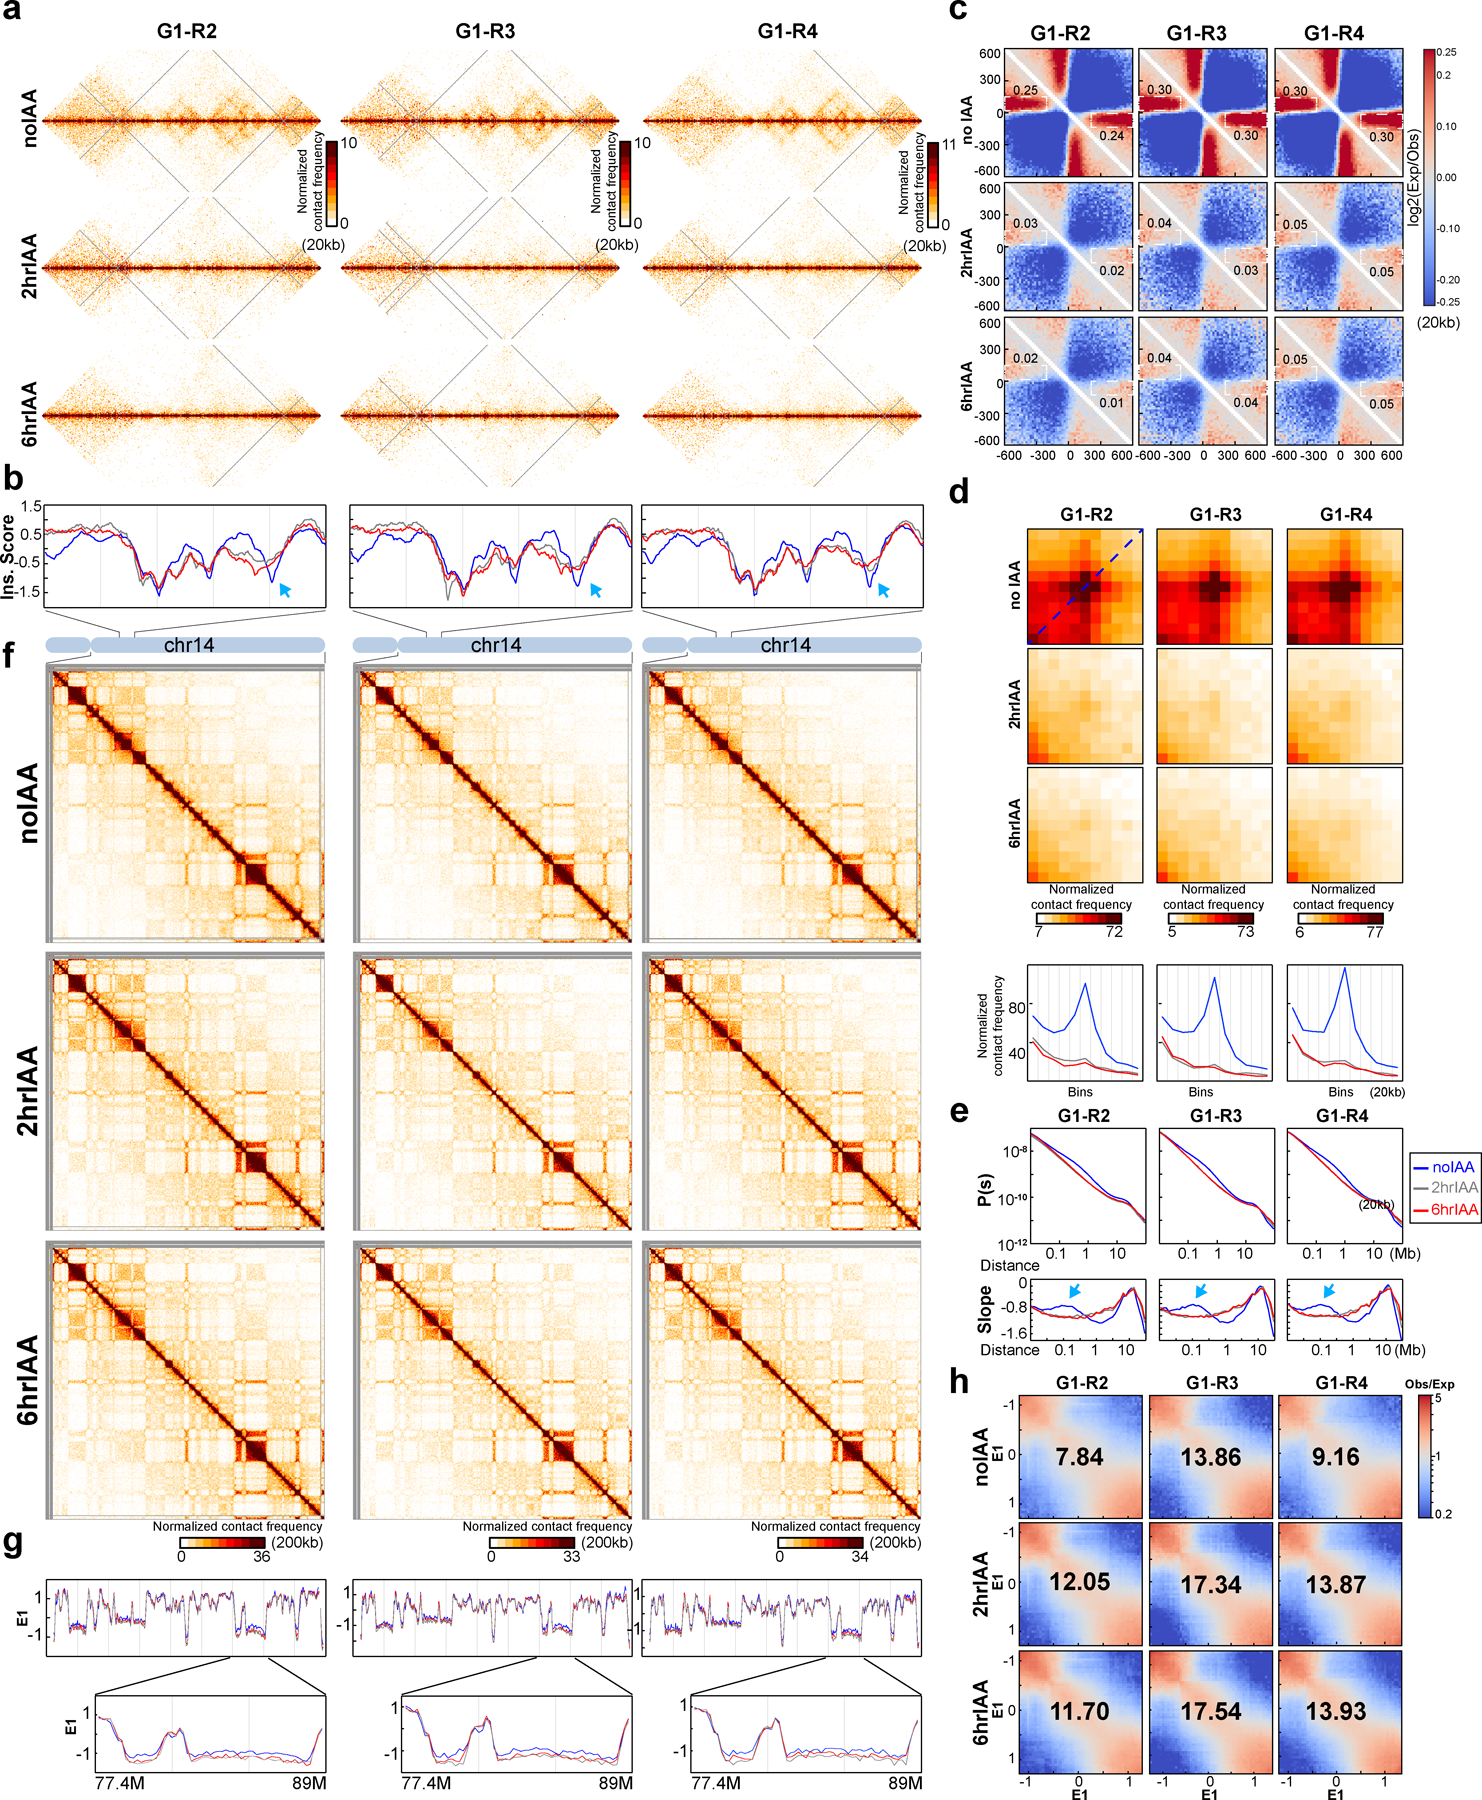
(a) Hi-C interaction maps for three independent Hi-C experiments using G1-sorted cells treated with IAA as shown. Data for the 29–34 Mb regions of chromosome 14 is shown. (b) Insulation profiles for the same region as in (a). The blue, grey and red lines represent 0, 2 and 6hour IAA treatments, respectively. Blue arrow shows weakened insulation at boundaries (c). Aggregate Hi-C data at TAD boundaries that were identified in each replicate without IAA treatments. The numbers at the sides of the cross indicate the strength of boundary-anchored stripes using the mean values of interaction frequency within the white dashed boxes. (d). Aggregated Hi-C data at a set of 3169 loops identified in HCT116-RAD21-mAC cells with intact RAD21 identified by22. Plots at the bottom show average Hi-C signals along the dotted blue lines representing signals from the bottom-left corner to the top-right corner of the loop aggregated heatmaps shown in upper panels. (e). P(s) plots (upper panels) and derivative from P(s) plots (lower panels) for Hi-C data as indicated. The arrows on the derivative plots indicate cohesin loops. (f). Hi-C interaction maps for three independent Hi-C experiments using G1-sorted cells treated with IAA as shown. Data for the 18–107.3 Mb regions of chromosome 14 is shown. (g). E1 across the same region as in (f). Bottom panels, E1 for the 77.4-89Mb region is shown and the color assignments for the lines are the same as for the other panels. (h). Saddle plots for three independent Hi-C experiments using G1-sorted cells treated with IAA as shown. Saddle plots for each cell condition were calculated using the E1 calculated from the Hi-C data obtained with G1 cells grown without IAA treatments. The numbers indicate compartment strength.
Extended Figure 3. A replicate Hi-C analysis of nuclei with RAD21 cleaved in NB buffer.
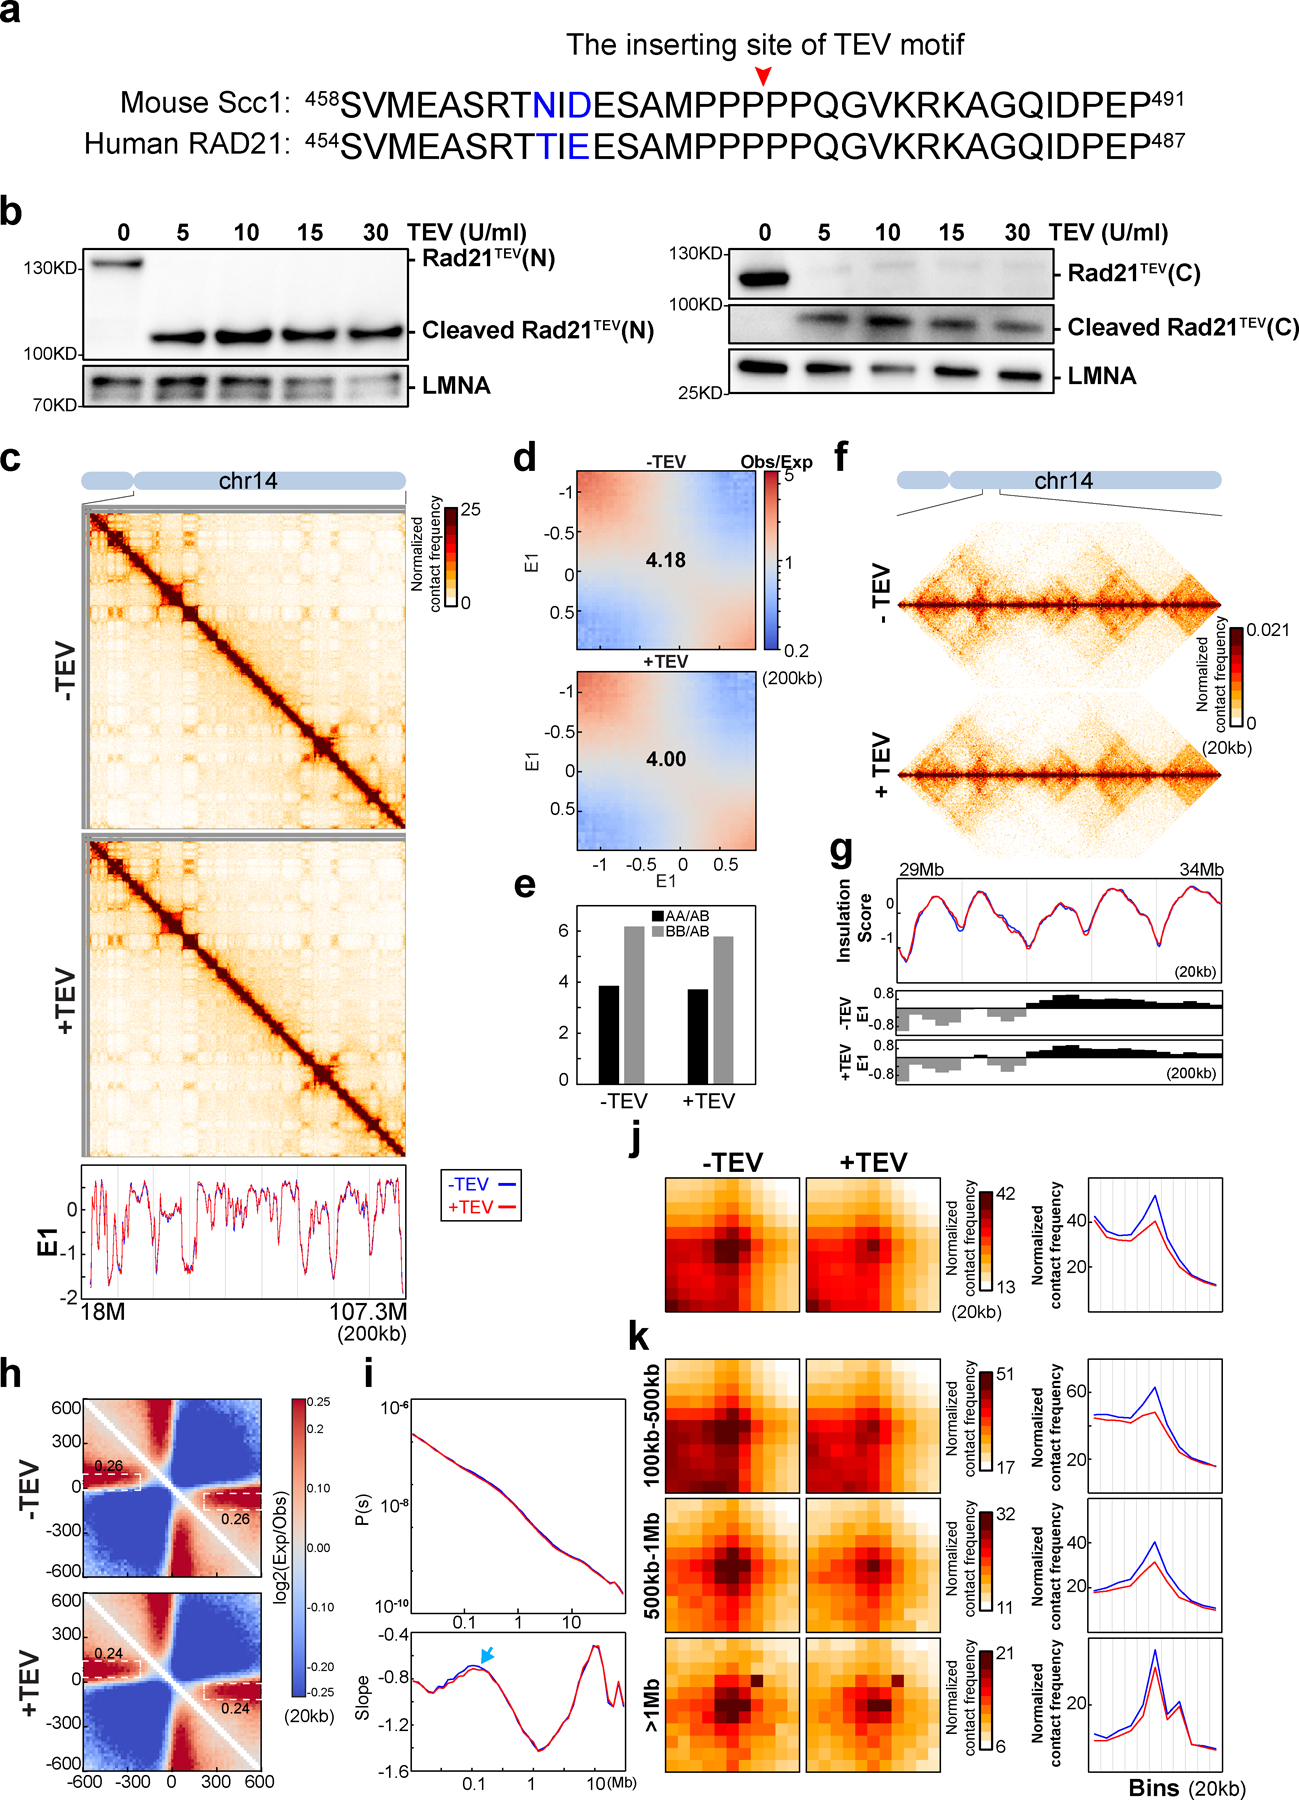
(a) The TEV motif insertion site is conserved between human and mouse. Amino acid sequences flanking TEV motif insertion sites in mouse Scc1 and human RAD21 are shown. (b) TEV proteases at different concentrations cleave RAD21 from HAP1-RAD21TEV purified nuclei. Left panels, RAD21TEV and cleaved fragments were detected using an antibody recognizing the N-terminus of RAD21TEV. Right panels, RAD21TEV and cleaved fragments were detected using an antibody recognizing C-terminus of RAD21TEV. LMNA was a loading control. (c). Hi-C maps for HAP1-RAD21TEV nuclei treated with TEV as shown. Data for the 18–107.3 Mb region of chromosome 14 is shown. Bottom panel, E1 across the same region as in (c). (d). Saddle plots for HAP1-RAD21TEV nuclei treated with TEV as shown. Numbers indicate compartment strength. (e) Interaction strength of compartments. Bars represent strength of compartment interactions for each sample as described in Fig1h. (f). Hi-C maps for HAP1-RAD21TEV nuclei treated with TEV as shown. Data for the 29–34 Mb region of chromosome 14 is shown. (g) Insulation profiles for the same region as in f. Blue and red lines represent without and with TEV protease treatment, respectively. Lower panels indicate E1 across the same region. (h) Aggregate Hi-C data at TAD boundaries identified in the sample in NB buffer without TEV treatment. Numbers at the sides of the cross indicate boundary strength. (i) P(s) plots (upper panels), and derivatives of P(s) plots (lower panels) for Hi-C data from nuclei treated with TEV as shown. Blue arrows indicate the signature of cohesin loops in each condition. (j) Aggregated Hi-C data at loops as in Fig. 2j. Right panel: average Hi-C signals along the blue dashed line shown in the left Hi-C panel. (k) Aggregated Hi-C data at chromatin loops of three different loop sizes, 100–500kb, 500kb-1Mb, and >1Mb. Right panels: average Hi-C signals along the blue dashed line shown in the left Hi-C map in panel Fig. 2j. See source data for numerical data and unprocessed blots.
Extended Figure 4. Cleaving RAD21 in NBS1 dissociates and releases cohesin components.
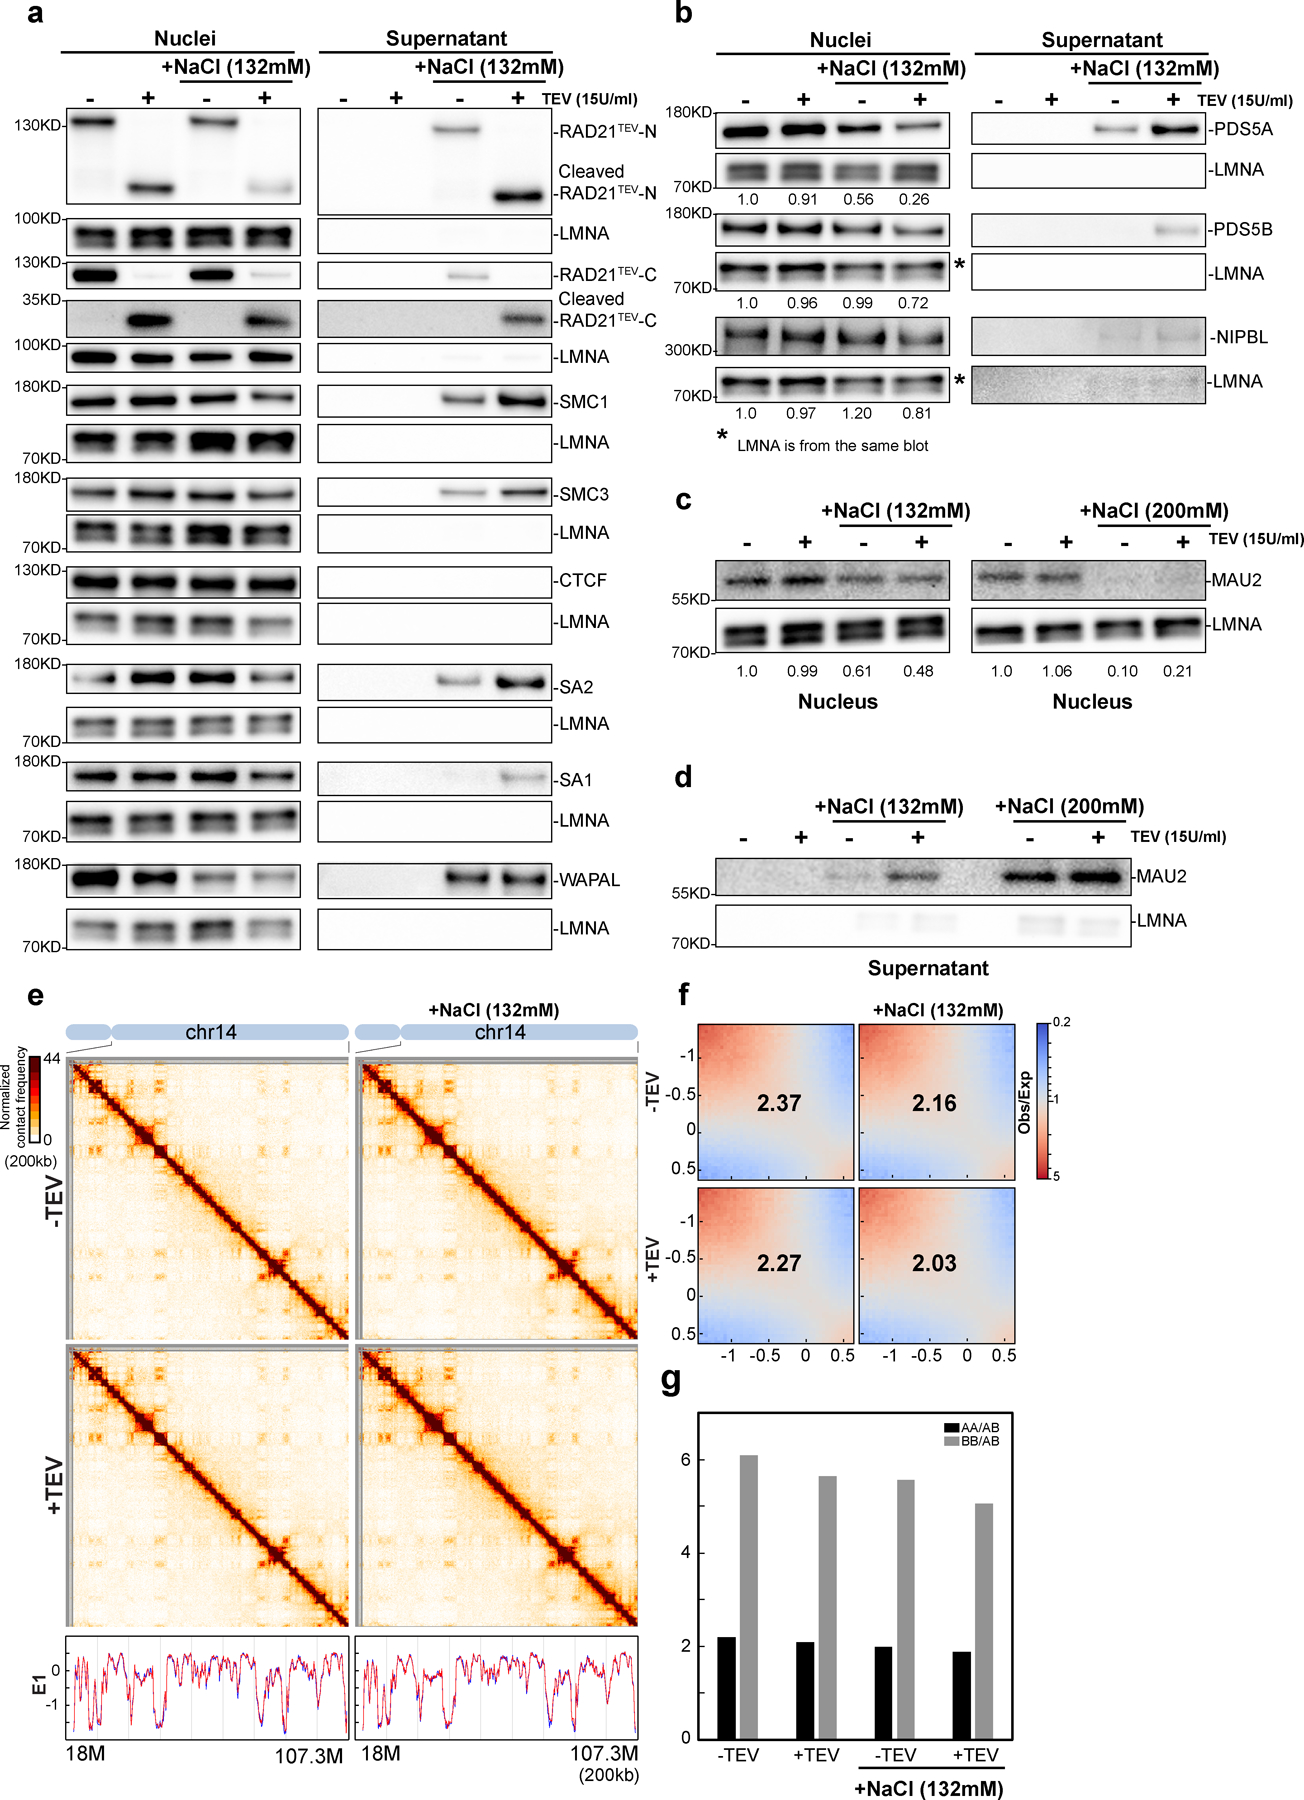
Western blot analysis of nuclear retention of cohesin in RAD21TEV nuclei treated with TEV in the specified buffer as shown. Left panels indicated as nuclei show cohesin components in nuclei detected using antibodies as described in the right panels of a-c. Right panels show supernatant of released cohesin components. Cohesin components from supernatants were separated and detected using the same antibodies as used for the Western blots shown on the right panels of a-c. For all western blot analyses, LMNA was used as the loading controls. (a) A biological replicate of cohesin subunits retained in nuclei or released to the supernatant treated with TEV in specified buffer as shown. The antibodies used here are the same as Fig. 3a. (b) Western blot analysis of PDS5A, PDS5B and NIPBL retained in nuclei or released to the supernatant treated with TEV in specified buffer as shown. (c) and (d) Western analysis of MAU2 (SCC4) retained in nuclei (c) and released to the supernatant (d) treated with TEV in the specified buffer as shown. Cleaving RAD21 in NBS1 has little effects on compartmentalization and CTCF binding (e) Hi-C interaction maps for HAP1-RAD21TEV nuclei treated with TEV as shown. Data for the 18–107.3 Mb region of chromosome 14 is shown. Bottom, eigenvector E1 profiles across the same region. (f) Saddle plots for HAP1-RAD21TEV nuclei treated with TEV as shown. The numbers indicate compartment strength. (g) Interaction strength of compartments. The bars represent the strength of compartment interactions for each sample as described in Fig1h. Source numerical data and unprocessed blots are available in source data.
Extended Figure 5. A replicate of ChIP analysis of the nuclei with cleaved RAD21 in NBS1.
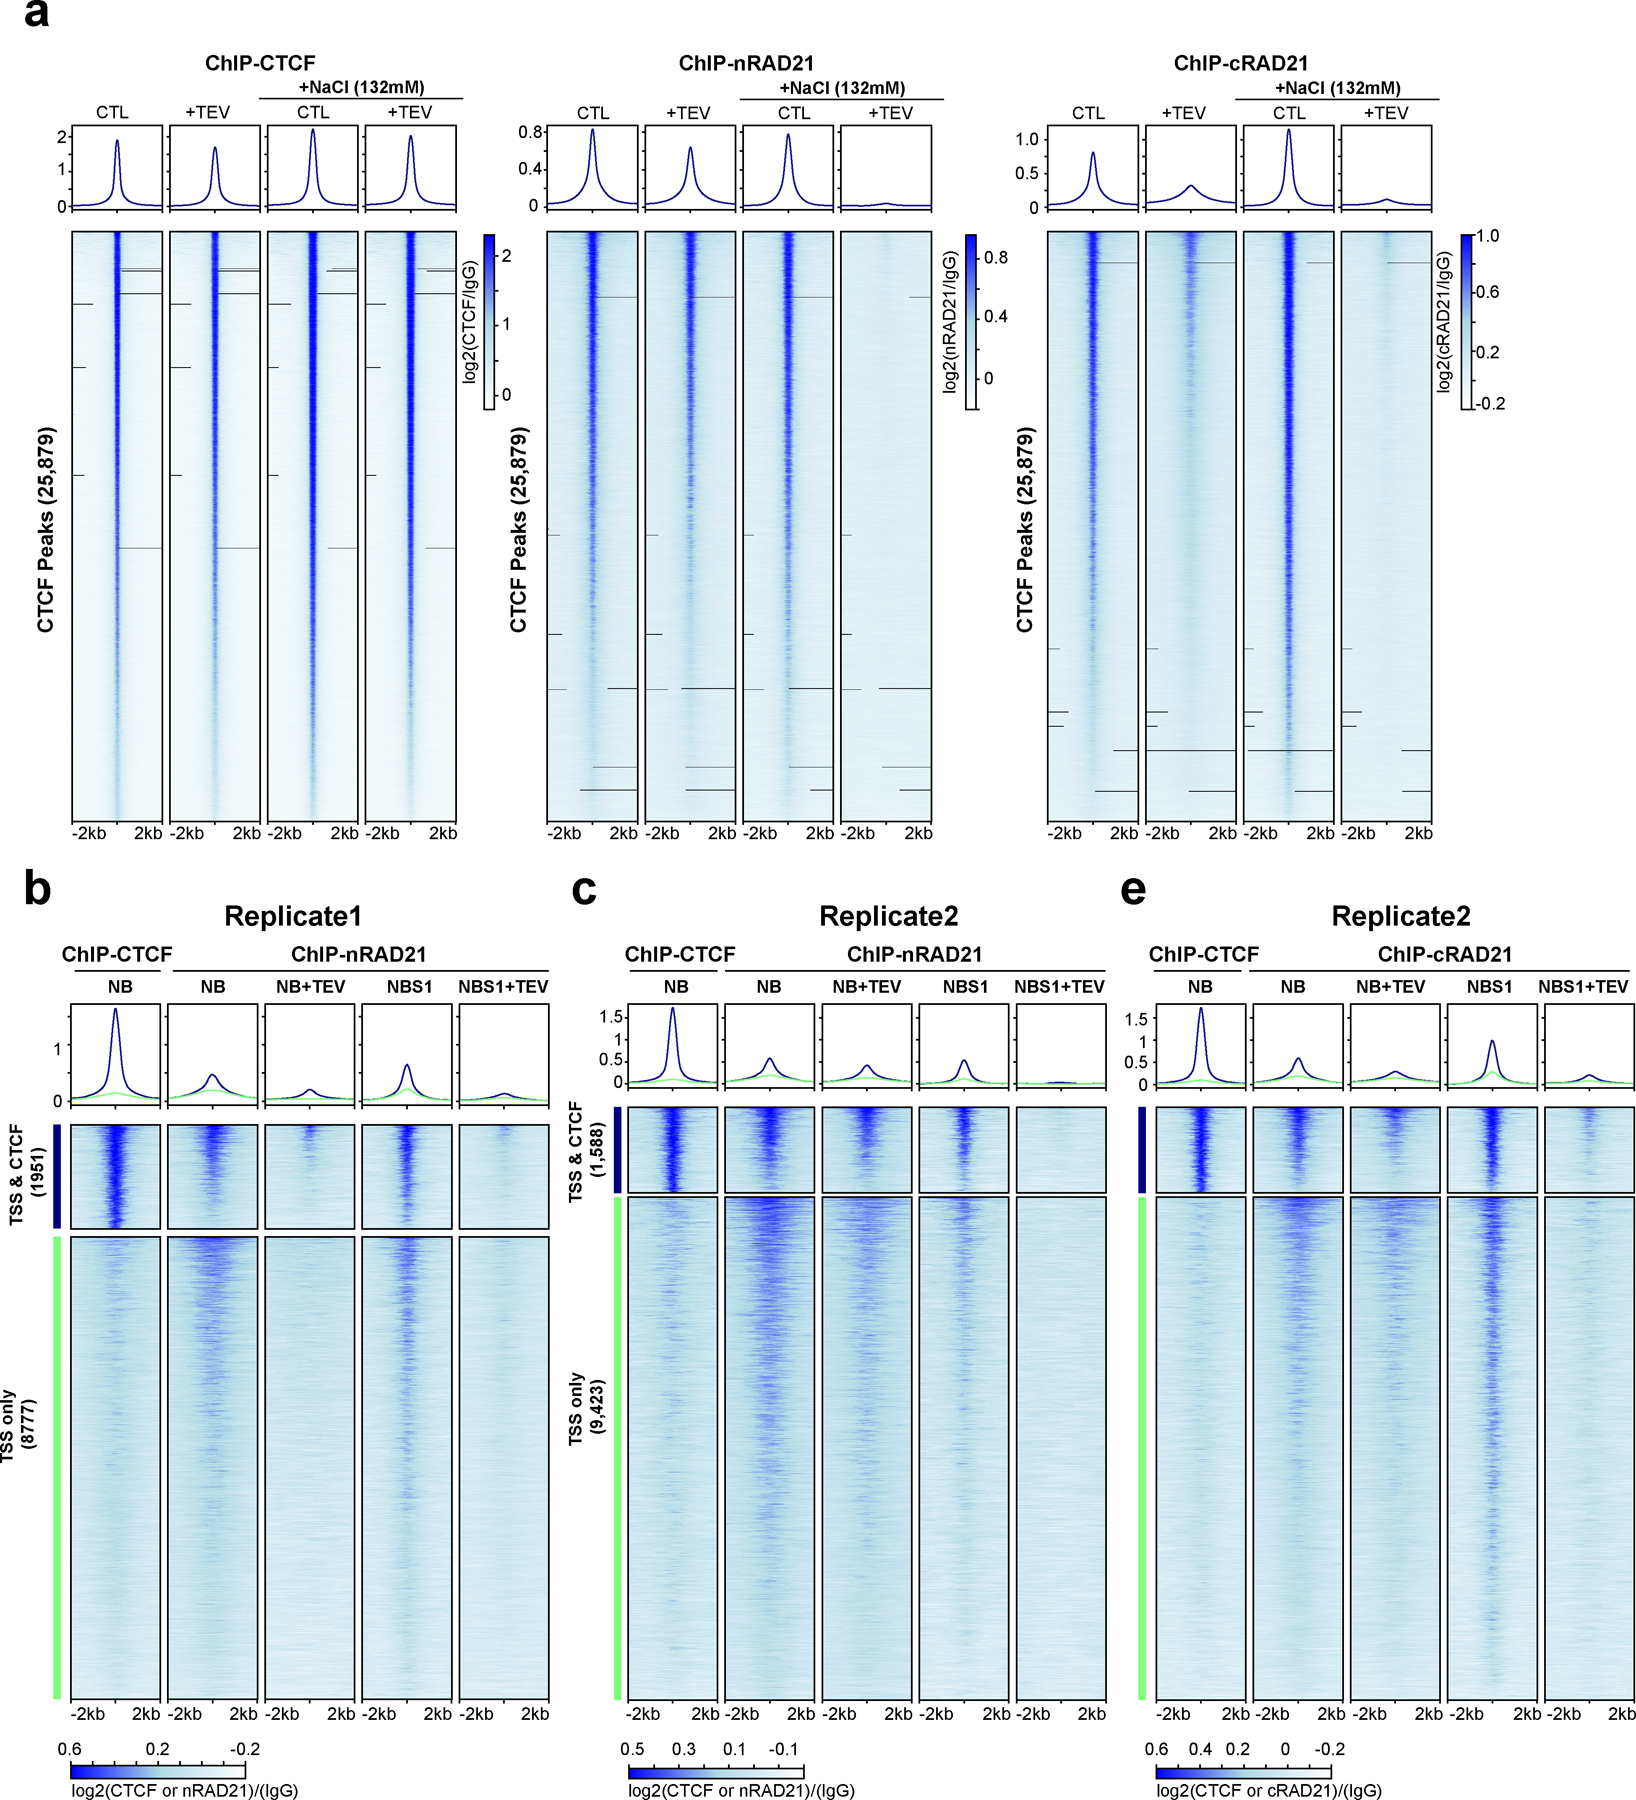
(a) Profiles of ChIP signals of CTCF and RAD21 at CTCF binding sites, from nuclei treated with TEV in the specified buffers as shown. Data shown are for biological replicate 2, an independent replicate is shown in Fig. 3h. 25,879 CTCF binding sites were identified from CTCF ChIP data of nuclei without TEV treatment in NB. Upper panel, average CTCF and RAD21 ChIP-seq signals for each condition for the set of 25,879 CTCF binding sites. Two different RAD21 antibodies were used, nRAD21 recognizes the N-terminal domain of RAD21, as used in Fig. 3h; cRAD21 recognizes C-terminal domain of RAD21. Lower panel, heatmap of CTCF and RAD21 ChIP-seq signals of each condition at each of the 25,879 CTCF binding sites. (b) Profiles of ChIP signals of CTCF and RAD21 at active transcription start sites (TSS) treated with TEV in the specified buffers as shown. Of 13,412 active TSS of HAP1 cells, 1,951 overlapped with CTCF binding sites while 8,777 did not overlap with CTCF binding sites (2kb away from CTCF binding sites). Both average ChIP signals (upper panels) and heatmap of ChIP signals of CTCF and RAD21 for these two groups of TSS sites are shown. (c) Biological replicate of the experiment shown in panel b. Of 13412 active TSS sites, 1,588 were overlapped with CTCF binding sites while 9,423 did not overlap with CTCF binding sites. Dark blue and orange lines indicate TSSs that overlapped or did not overlap with CTCF binding sites, respectively. Both average ChIP signals (upper panels) and heatmap of ChIP signals of CTCF and RAD21 on these two groups of TSS sites are shown. Right panel includes a RAD21 ChIP data using the RAD21 antibody that recognizes C-terminal of RAD21. Dark blue and orange lines indicate TSS that overlapped or did not overlap with CTCF binding sites, respectively.
Extended Figure 6. Cleaving RAD21 in NBS2 dissociates and releases cohesin components.
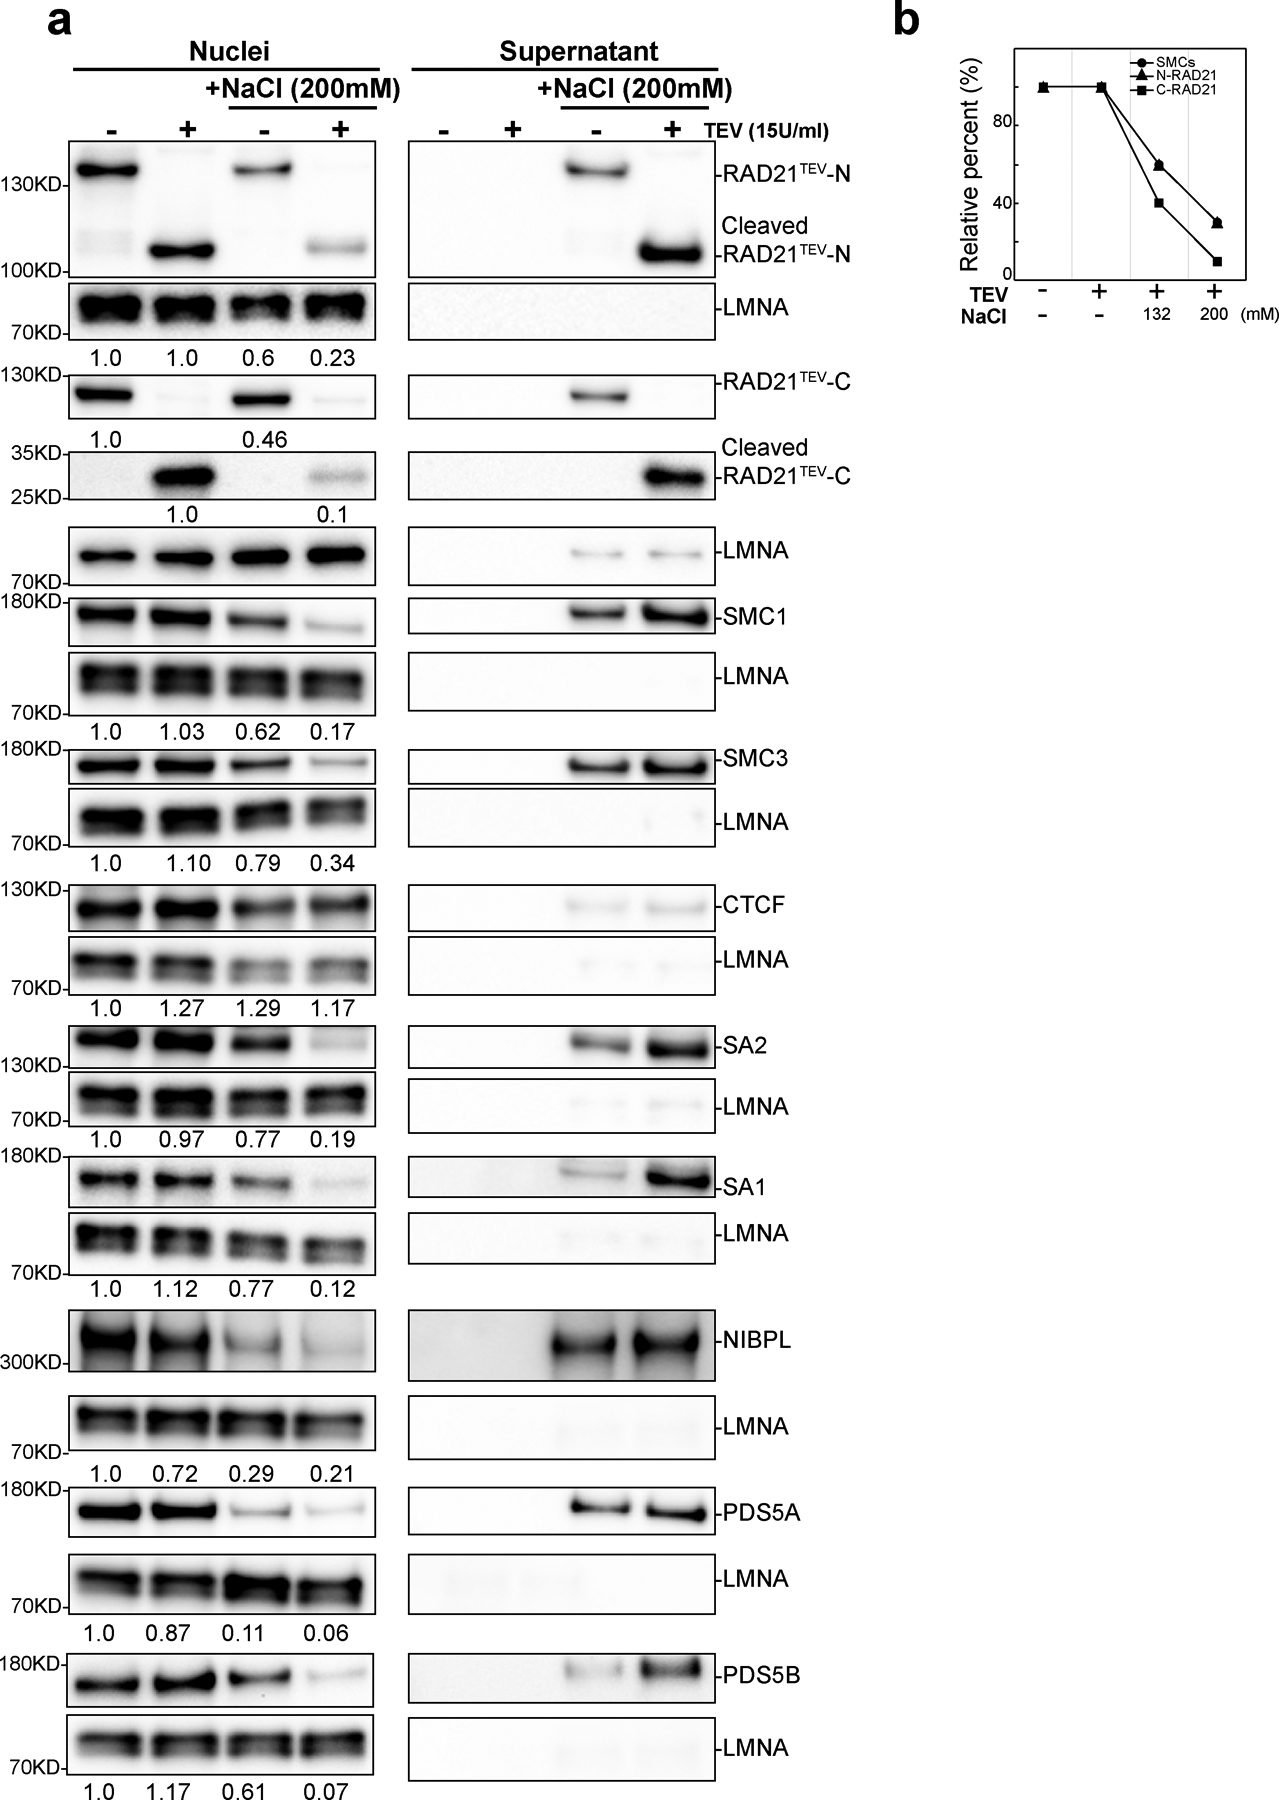
(a) Western blot analysis of salt effects on nuclear retention of cohesin complex subunits in HAP-1RAD21TEV nuclei treated with TEV as shown. Western blot analysis was performed as indicated in Extended Data Fig. 4ab except that 200mM NaCl was used, instead of 132mM. (b) Quantification of levels of SMC1/3, N-terminal cleaved RAD21 and C-terminal cleaved RAD21. The levels of indicated proteins or fragments were normalized to LMNA as loading controls first, then the ratio was normalized to the same protein or fragments in NB without TEV treatment. For SMC proteins, the average relative percentage of SMC1 and SMC3 levels, from panel (a) and Fig. 3a, is presented. See source data for numerical data and unprocessed blots.
Extended Figure 7. Two biological replicates of Hi-C analysis of nuclei with RAD21 cleaved in NBS2 buffer (with Supplementary Fig. 2).
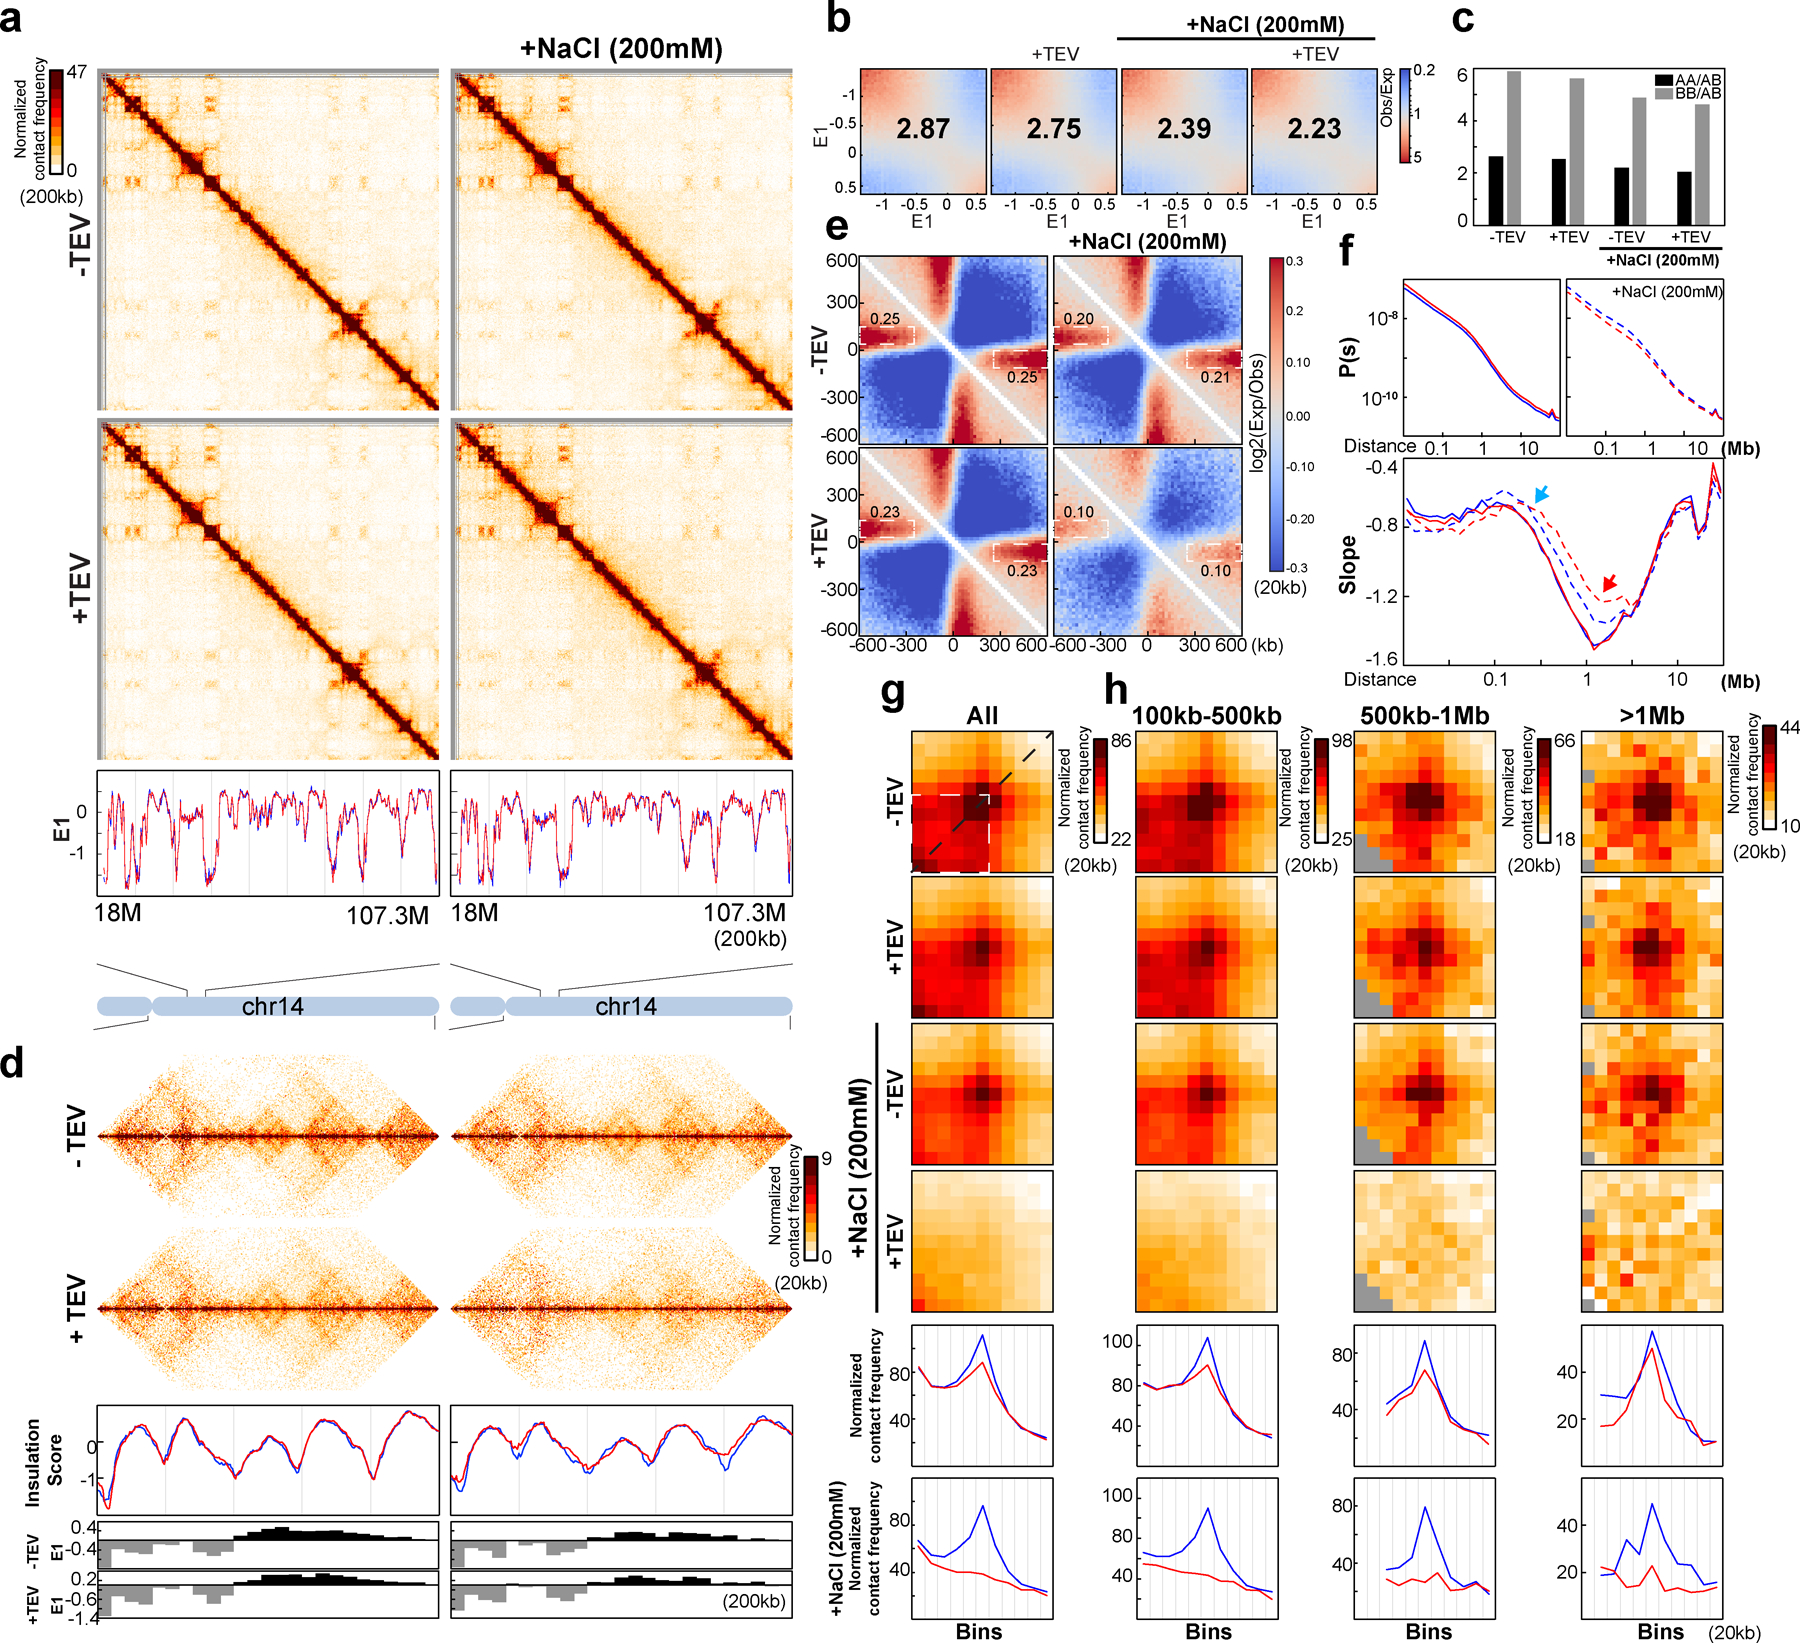
(a) Hi-C maps for HAP1-RAD21TEV nuclei treated with TEV in specified buffer sas shown. Data for the 18–107.3 Mb region of chromosome 14 is shown. Bottom, E1 across the 18–107.3 Mb region of chromosome 14. (b) Saddle plots for HAP1-RAD21TEV nuclei treated with TEV in specified buffers as shown. Numbers indicate compartment strength. (c) Interaction strength of compartments. Bars represent strength of compartment interactions for each sample as described in Fig1h. (d) Hi-C maps for HAP1-RAD21TEV nuclei treated with TEV in specified buffers as shown. Data for the 29–34 Mb region of chromosome 14 is shown. Middle panels indicate insulation profiles for the 29–34 Mb regions of chromosome 14. Blue and red lines represent without and with TEV protease treatment, respectively, as in panel a. Lower panels indicate E1 across the same region. (e) Aggregate Hi-C data at TAD boundaries identified in the sample in NB buffer without TEV treatment. Numbers at the sides of the cross indicate strength of boundary-anchored stripes using the mean values of interaction frequency within the white dashed boxes. (f) P(s) plots (left panels), and derivatives of P(s) plots (right panels) for Hi-C data from nuclei treated with TEV as shown. Blue arrows indicate the signature of cohesin loops in each condition. Red arrows indicate changes of contact frequency at 2Mb. (g) Aggregated Hi-C data at loops as in Fig. 2j. Lower panels: average Hi-C signals along the blue dashed line shown in the upper left Hi-C panel. (h) Aggregated Hi-C data at chromatin loops of three different loop sizes as indicated. Lower panels: average Hi-C signals along the blue dashed line shown in the left Hi-C map in Fig. 2j. See source data for numerical data.
Extended Figure 8. Two biological replicates of Hi-C analysis of G1-sorted nuclei with RAD21 cleaved in NBS1 (with Supplementary Fig. 3).
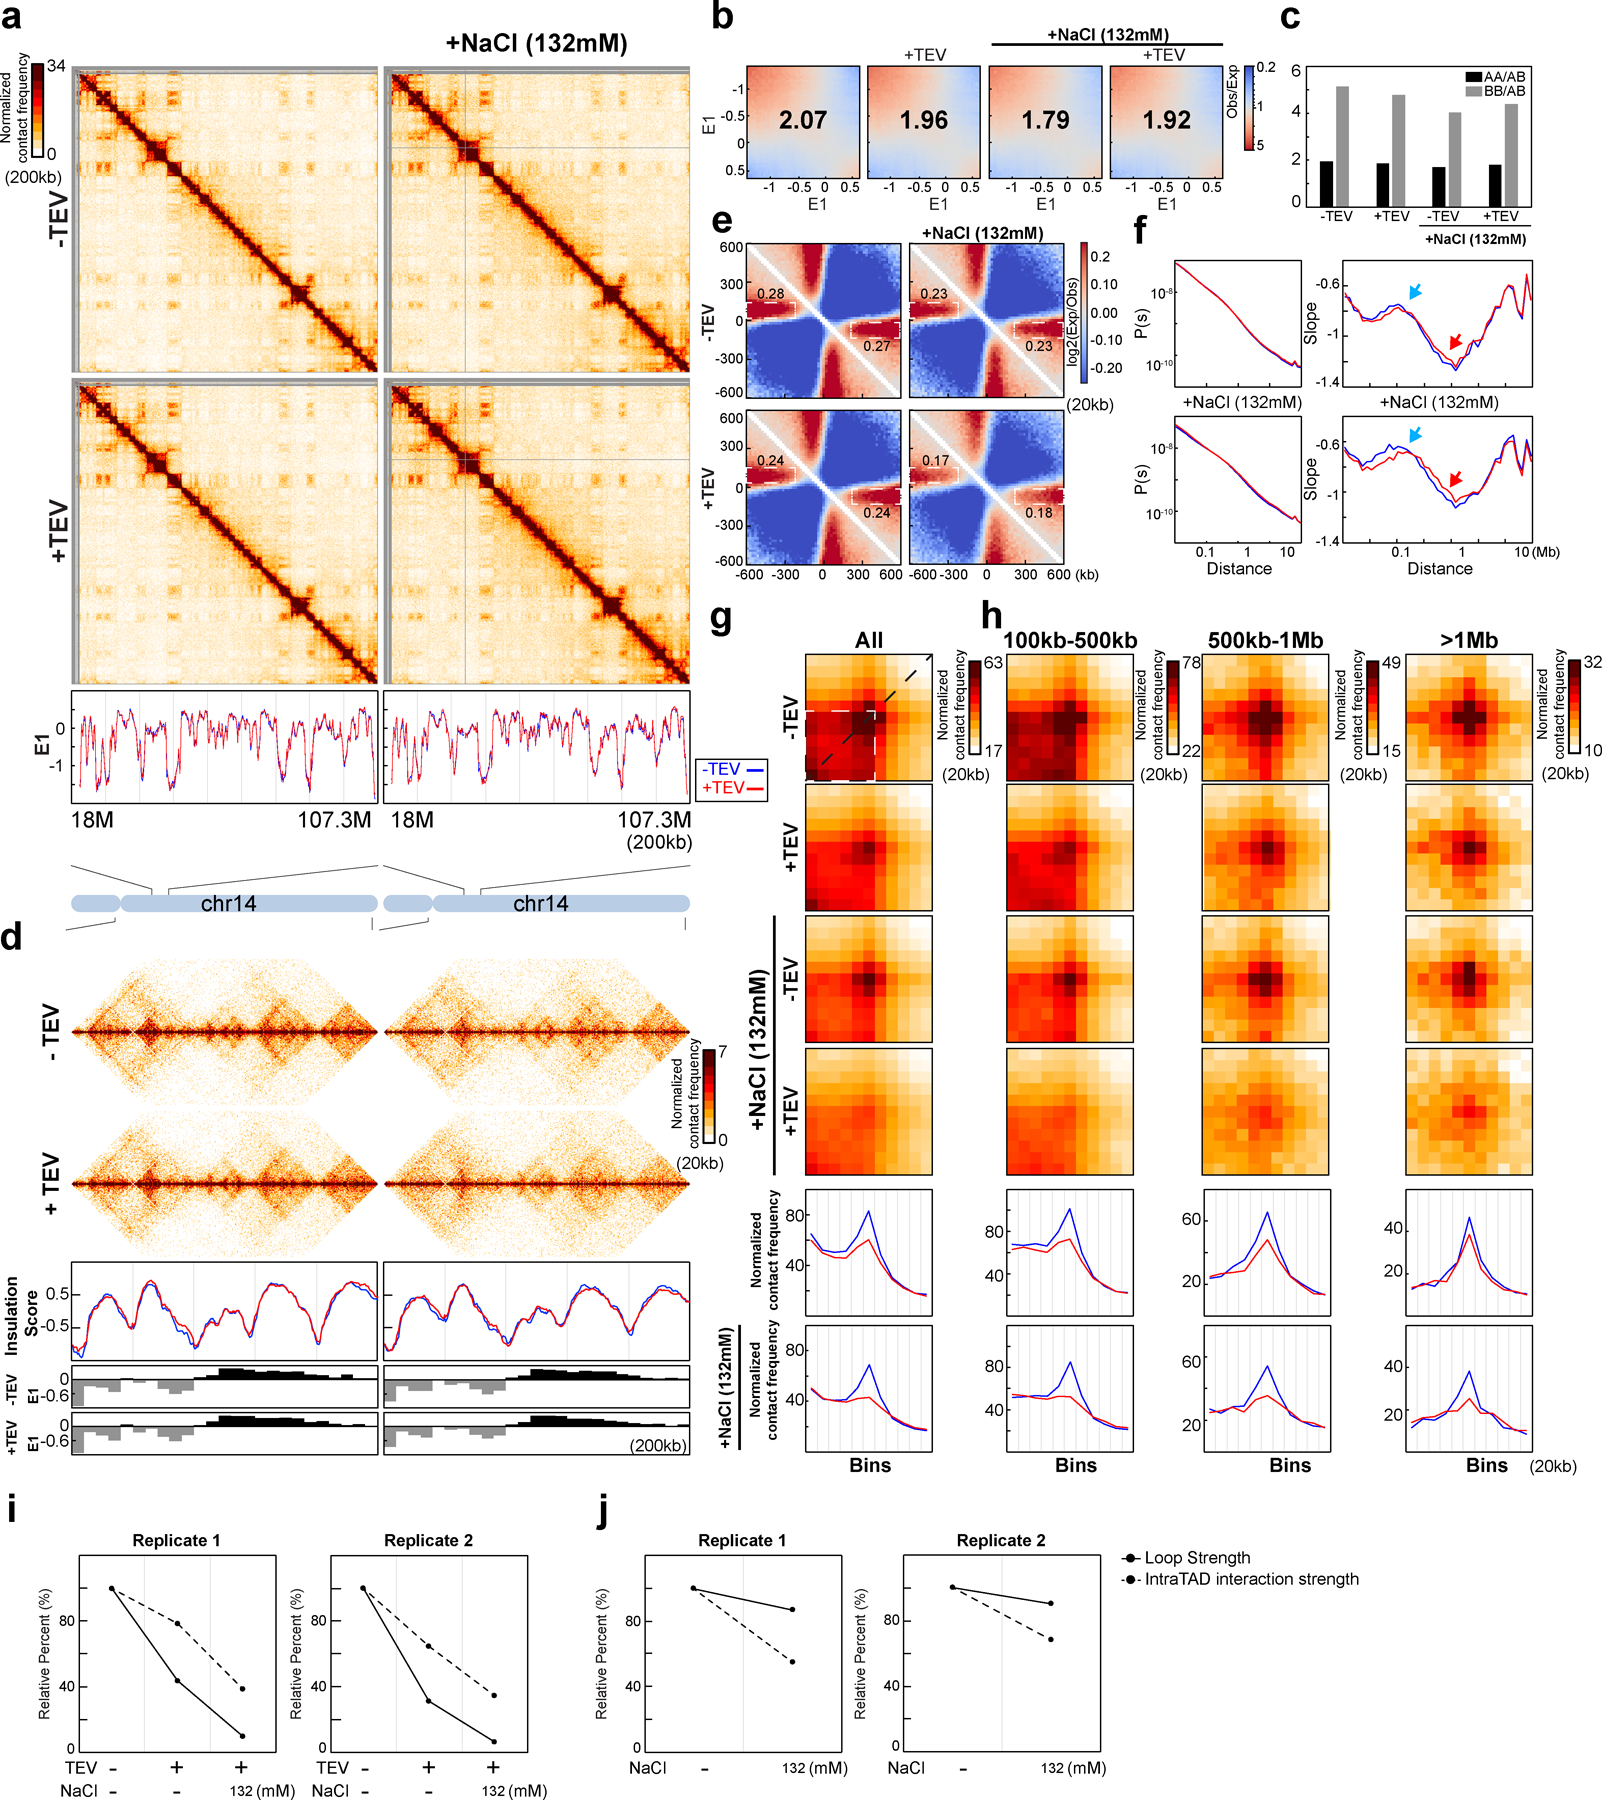
(a) Hi-C maps for G1-sorted HAP1-RAD21TEV nuclei treated with TEV in specified buffers as shown. Data for the 18–107.3 Mb region of chromosome 14 is shown. Bottom, E1 cross the same region. (b) Saddle plots for G1-sorted HAP1-RAD21TEV nuclei treated with TEV in specified buffer as shown. Numbers indicate compartment strength. (c) Interaction strength of compartments. Bars represent strength of compartment interactions for each sample as described in Fig. 1h. (d) Hi-C interaction maps for G1-sorted HAP1-RAD21TEV nuclei treated with TEV in specified buffers as shown. Data for the 29–34 Mb region of chromosome 14 is shown. Middle panels indicate insulation profiles for the 29–34 Mb regions of chromosome 14. Blue and red lines represent without and with TEV protease treatment, respectively. The lower panels indicate compartment E1 across the region. (e) Aggregate Hi-C data at TAD boundaries identified in each condition as shown. Numbers at the sides of the cross indicate strength of boundary-anchored stripes using the mean values of interaction frequency within the white dashed boxes. (f) P(s) plots (left panels), and derivatives of P(s) plots (right panels) for Hi-C data from nuclei treated with TEV as shown. Blue arrows indicate the signature of cohesin loops in each condition. Red arrows indicate changes of contact frequency at 2Mb. (g) Aggregated Hi-C data at loops as in Fig. 2j. Lower panel: average Hi-C signals along the blue dashed line shown in the left Hi-C panel. (h) Aggregated Hi-C data at chromatin loops of three different loop sizes as shown. Lower panels: average Hi-C signals along the blue dashed line shown in the left Hi-C map in Fig. 2j. (i) Quantification of loop strength and intra-TAD interaction strength obtained with G1-sorted HAP1-RAD21TEV nuclei treated with TEV in specified buffer as shown (two biological replicates). (j) Quantification of loop strength and intra-TAD interaction strength in each condition as shown. Loop strength and intra-TAD interaction strength were normalized as in Fig. 3i. See source data for numerical data.
Extended Figure 9. Two replicates of Hi-C analysis of the nuclei with RAD21 cleaved in HBSS buffer.
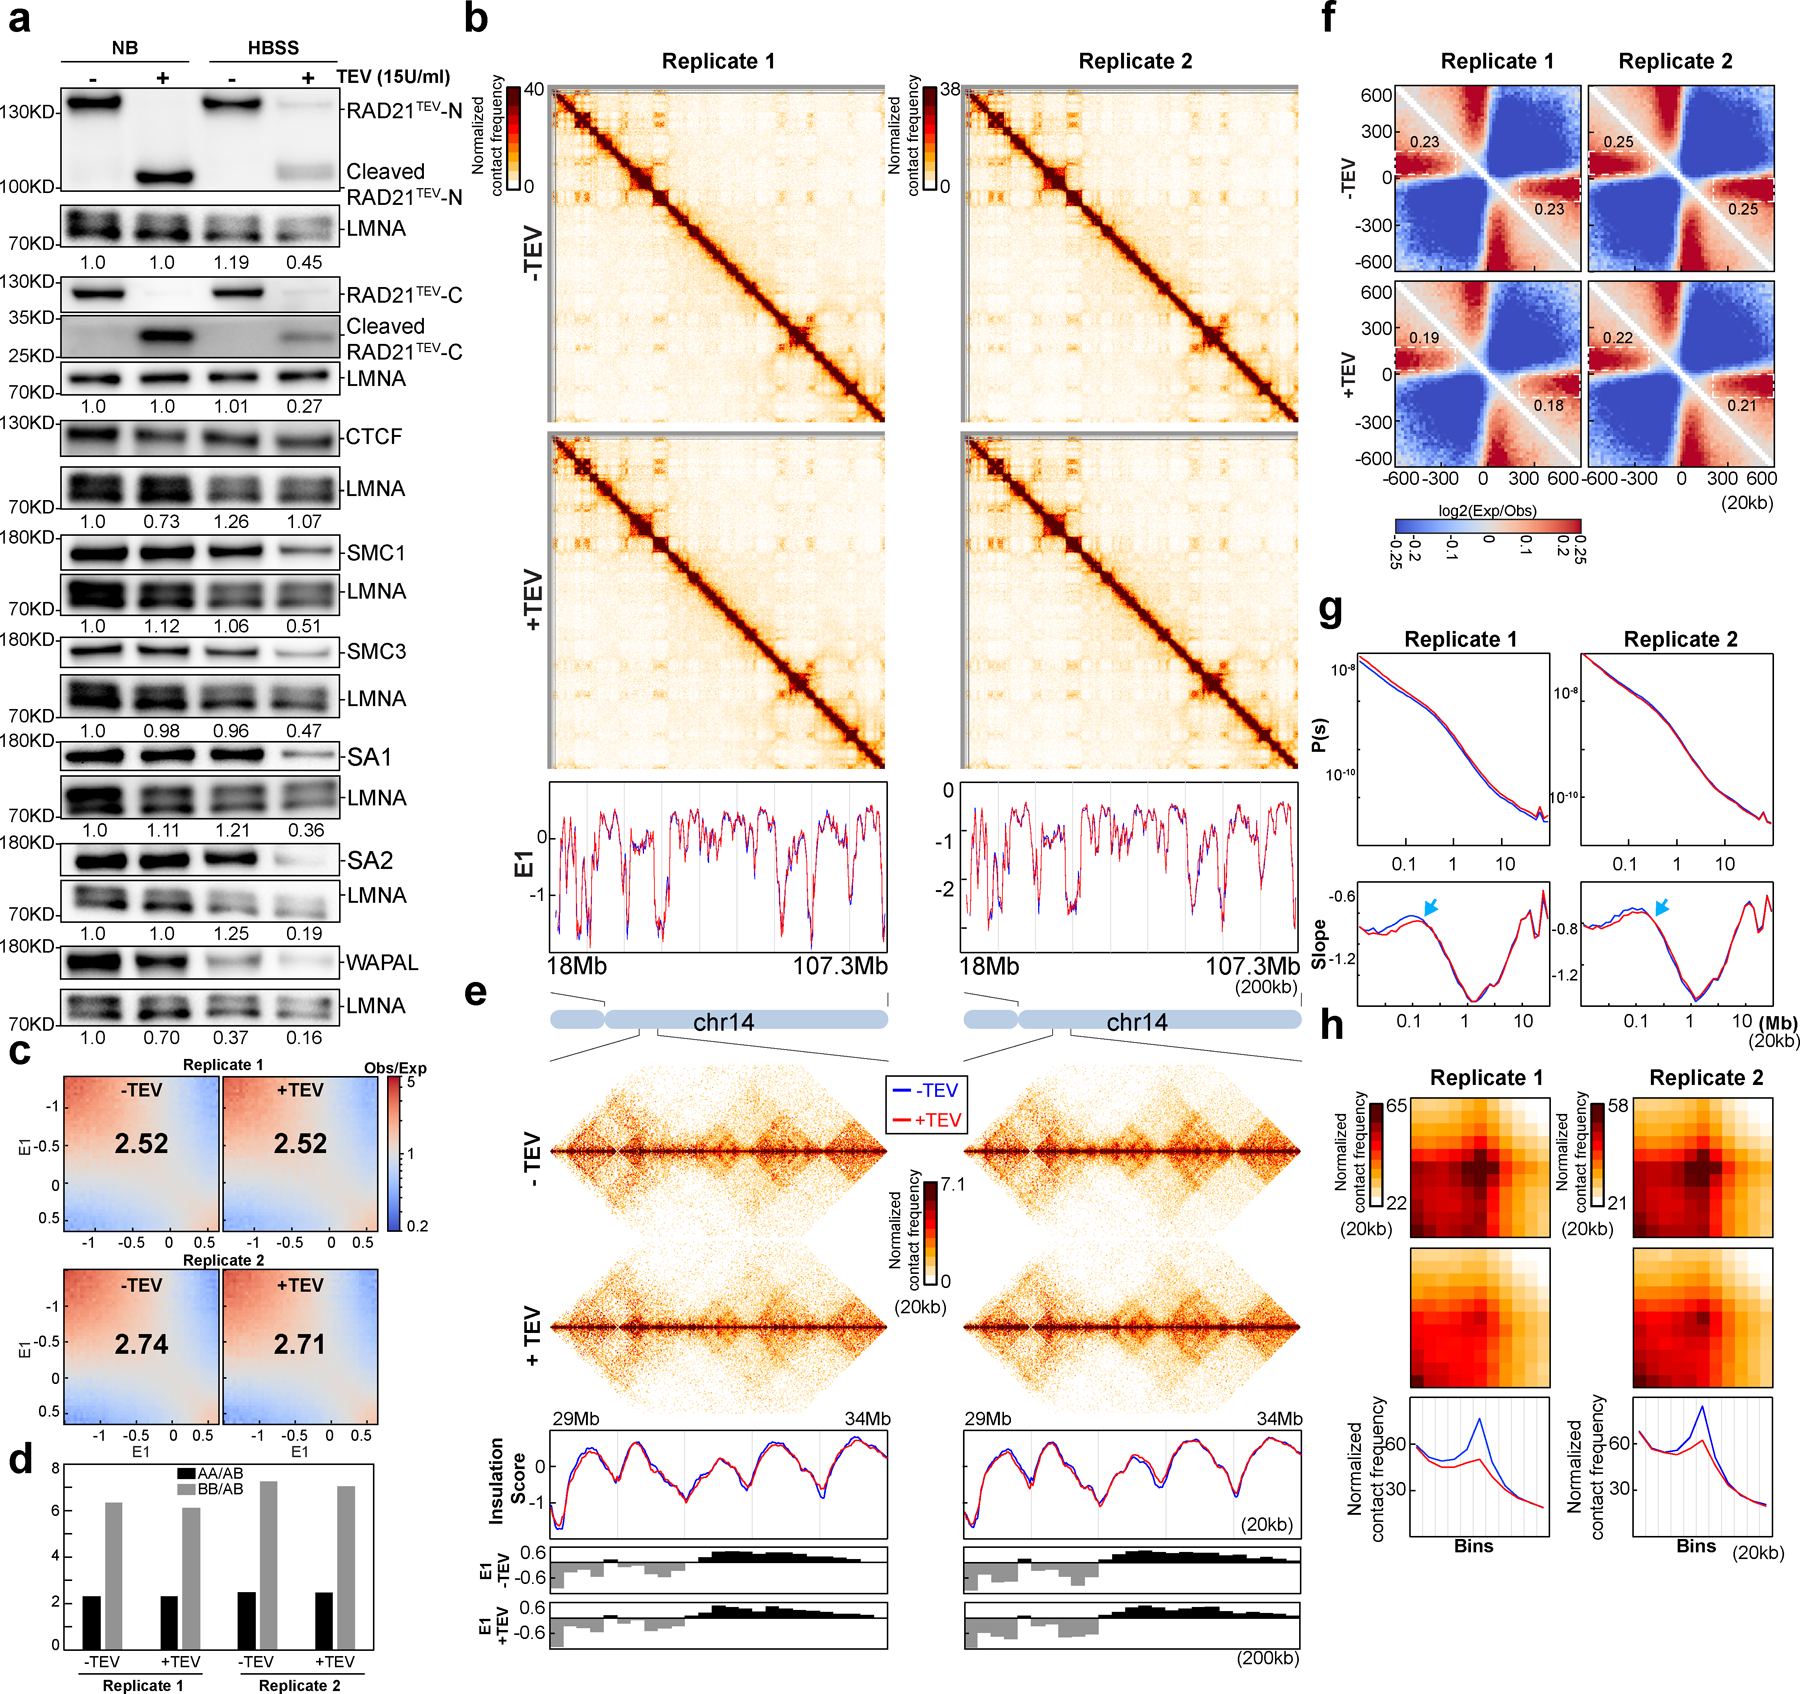
(a) Western blot analysis of RAD21 and cohesin components treated with TEV in specified buffer as shown. (b) Hi-C interaction maps for HAP1-RAD21TEV nuclei without and with TEV protease treatment in HBSS buffer, respectively. Data for the 18–107.3 Mb region of chromosome 14 is shown. Bottom, eigenvector E1 cross the same region. (c) Saddle plots for HAP1-RAD21TEV nuclei treated with TEV in specified buffer as shown. The numbers indicate compartment strength. (d) Interaction strength of compartments. The bars represent the strength of compartment interactions for each sample as described in Fig. 1h. (e) Hi-C interaction maps for HAP1-RAD21TEV nuclei treated with TEV in HBSS buffer as shown. Data for the 29–34 Mb region of chromosome 14 is shown. Middle panels indicate insulation profiles for the same region. The blue and red lines represent without and with TEV protease treatments, respectively, as in panel b. The lower panels indicate compartment Eigenvector value E1 across the same region. (f) Aggregate Hi-C data at TAD boundaries identified in the sample without TEV treatment in each replicate. The numbers at the sides of the cross indicate the boundary strength. (g) P(s) plots (upper panels), and the derivatives of P(s) plots (lower panels) for Hi-C data from nuclei treated with TEV as shown. The blue arrows indicate the signature of cohesin loops in each condition. (h) Aggregated Hi-C data at loops as in Fig. 2j. Lower panel: average Hi-C signals along the blue dashed line shown in the left Hi-C panel. See source data for numerical data and unprocessed blots.
Extended Figure 10. Responses of stripes to RAD21 cleavage in different salt buffers.
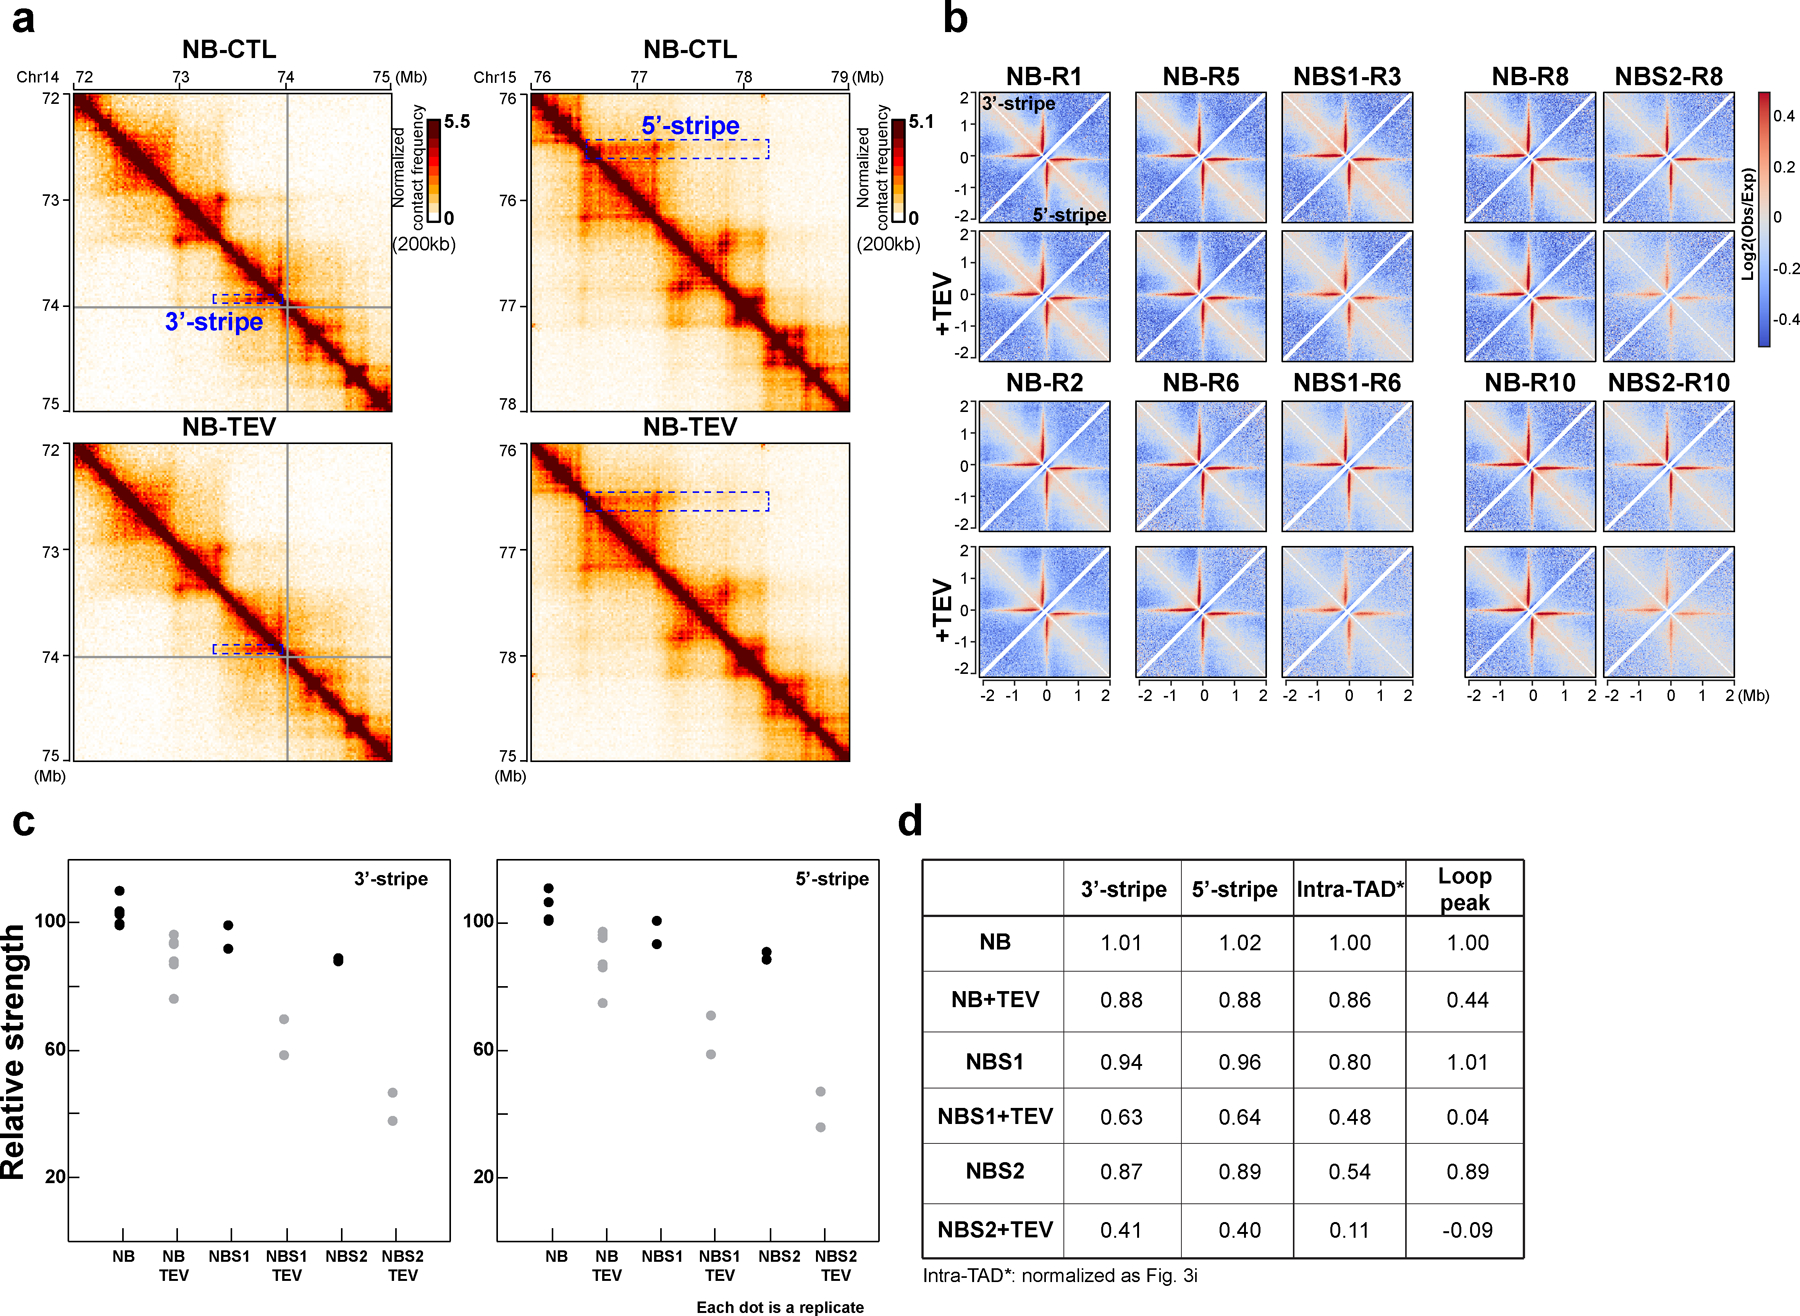
(a) The examples of 3′- and 5′-stripes treated with TEV as shown. The left and right columns of the Hi-C interaction maps showed the 72–75 Mb region of chromosome 14 and the 76–79 Mb region of chromosome 15 at 10kb resolution, respectively. On each Hi-C interaction map, the boxes with blue dashed lines highlighted the stripes. The upper and lower Hi-C interaction maps of each column are treated with TEV as shown. (b) Aggregate Hi-C data binned at 10kb resolution at both 3′- and 5′-stripes identified in the sample in NB buffer without TEV treatment. The first two rows indicated the first replicate including Hi-C data without and with TEV treatment in NB, NBS1 and NBS2 as indicated. The third and fourth rows are the second replicate across all the conditions as shown. (c) The relative strength of 3′- and 5′-stripes for all the samples in (b). The median of six replicates without TEV protease treatment in NB buffer was used for normalization. (d) Comparison of stripe strength to the strength of intra-TAD and CTCF-CTCF loop interactions in all samples. The strength of intra-TAD and CTCF-CTCF loop interactions are averages of all replicates in each condition as indicated and were calculated as in Fig. 3i. See source data for numerical data.
Supplementary Material
Acknowledgements
We thank all the members of the Dekker laboratory for discussion, and Rachel McCord for advice on the nuclear expansion assay. We thank the Deep Sequencing Core and the Flow Cytometry Core (supported by the grant S10 OD028576) at UMass Chan Medical School. We thank Caryn Navarro for help with editing the manuscript. We acknowledge support from the National Institutes of Health Common Fund 4D Nucleome Program (DK107980, HG011536) and the National Human Genome Research Institute (HG003143). J.D. is an investigator of the Howard Hughes Medical Institute.
Footnotes
Competing Interests Statement
The authors have no competing interests.
Code Availability
Both cWorld scripts and cooltools (0.3.0) used in this study are public available in GitHub:
https://github.com/dekkerlab/cworld-dekker; https://github.com/mirnylab/cooltools.
No other customized codes were developed for this study.
Data Availability
Deep-sequencing data that support the findings of this study have been deposited in the Gene Expression Omnibus (GEO) under accession codes GSE182500.
All Hi-C and ChIP-seq libraries are listed in Supplemental Table 2 and 3.
Source data have been provided in Source Data. Protein structure in Fig.2 was drawn from PDB-ID-6WG3. All other data supporting the findings of this study are available from the corresponding author on reasonable request.
REFERENCES
- 1.Haering CH, Lowe J, Hochwagen A & Nasmyth K Molecular architecture of SMC proteins and the yeast cohesin complex. Mol Cell 9, 773–788 (2002). [DOI] [PubMed] [Google Scholar]
- 2.Haering CH et al. Structure and stability of cohesin’s Smc1-kleisin interaction. Mol Cell 15, 951–964 (2004). [DOI] [PubMed] [Google Scholar]
- 3.Peters JM, Tedeschi A & Schmitz J The cohesin complex and its roles in chromosome biology. Genes Dev 22, 3089–3114 (2008). [DOI] [PubMed] [Google Scholar]
- 4.Gruber S, Haering CH & Nasmyth K Chromosomal cohesin forms a ring. Cell 112, 765–777 (2003). [DOI] [PubMed] [Google Scholar]
- 5.Yatskevich S, Rhodes J & Nasmyth K Organization of Chromosomal DNA by SMC Complexes. Annu Rev Genet 53, 445–482 (2019). [DOI] [PubMed] [Google Scholar]
- 6.Haering CH, Farcas AM, Arumugam P, Metson J & Nasmyth K The cohesin ring concatenates sister DNA molecules. Nature 454, 297–301 (2008). [DOI] [PubMed] [Google Scholar]
- 7.Srinivasan M et al. The Cohesin Ring Uses Its Hinge to Organize DNA Using Non-topological as well as Topological Mechanisms. Cell 173, 1508–1519 e1518 (2018). [DOI] [PMC free article] [PubMed] [Google Scholar]
- 8.Hauf S, Waizenegger IC & Peters JM Cohesin cleavage by separase required for anaphase and cytokinesis in human cells. Science 293, 1320–1323 (2001). [DOI] [PubMed] [Google Scholar]
- 9.Tachibana-Konwalski K et al. Rec8-containing cohesin maintains bivalents without turnover during the growing phase of mouse oocytes. Genes Dev 24, 2505–2516 (2010). [DOI] [PMC free article] [PubMed] [Google Scholar]
- 10.Uhlmann F, Lottspeich F & Nasmyth K Sister-chromatid separation at anaphase onset is promoted by cleavage of the cohesin subunit Scc1. Nature 400, 37–42 (1999). [DOI] [PubMed] [Google Scholar]
- 11.Uhlmann F, Wernic D, Poupart MA, Koonin EV & Nasmyth K Cleavage of cohesin by the CD clan protease separin triggers anaphase in yeast. Cell 103, 375–386 (2000). [DOI] [PubMed] [Google Scholar]
- 12.Fudenberg G, Abdennur N, Imakaev M, Goloborodko A & Mirny LA Emerging Evidence of Chromosome Folding by Loop Extrusion. Cold Spring Harb Symp Quant Biol 82, 45–55 (2017). [DOI] [PMC free article] [PubMed] [Google Scholar]
- 13.Fudenberg G et al. Formation of Chromosomal Domains by Loop Extrusion. Cell Rep 15, 2038–2049 (2016). [DOI] [PMC free article] [PubMed] [Google Scholar]
- 14.Sanborn AL et al. Chromatin extrusion explains key features of loop and domain formation in wild-type and engineered genomes. Proc Natl Acad Sci U S A 112, E6456–6465 (2015). [DOI] [PMC free article] [PubMed] [Google Scholar]
- 15.Rao SS et al. A 3D map of the human genome at kilobase resolution reveals principles of chromatin looping. Cell 159, 1665–1680 (2014). [DOI] [PMC free article] [PubMed] [Google Scholar]
- 16.de Wit E et al. CTCF Binding Polarity Determines Chromatin Looping. Mol Cell 60, 676–684 (2015). [DOI] [PubMed] [Google Scholar]
- 17.Guo Y et al. CRISPR Inversion of CTCF Sites Alters Genome Topology and Enhancer/Promoter Function. Cell 162, 900–910 (2015). [DOI] [PMC free article] [PubMed] [Google Scholar]
- 18.Vietri Rudan M et al. Comparative Hi-C reveals that CTCF underlies evolution of chromosomal domain architecture. Cell Rep 10, 1297–1309 (2015). [DOI] [PMC free article] [PubMed] [Google Scholar]
- 19.Nora EP et al. Targeted Degradation of CTCF Decouples Local Insulation of Chromosome Domains from Genomic Compartmentalization. Cell 169, 930–944 e922 (2017). [DOI] [PMC free article] [PubMed] [Google Scholar]
- 20.Wutz G et al. Topologically associating domains and chromatin loops depend on cohesin and are regulated by CTCF, WAPL, and PDS5 proteins. EMBO J 36, 3573–3599 (2017). [DOI] [PMC free article] [PubMed] [Google Scholar]
- 21.Li Y et al. The structural basis for cohesin-CTCF-anchored loops. Nature 578, 472–476 (2020). [DOI] [PMC free article] [PubMed] [Google Scholar]
- 22.Rao SSP et al. Cohesin Loss Eliminates All Loop Domains. Cell 171, 305–320 e324 (2017). [DOI] [PMC free article] [PubMed] [Google Scholar]
- 23.Zuin J et al. Cohesin and CTCF differentially affect chromatin architecture and gene expression in human cells. Proc Natl Acad Sci U S A 111, 996–1001 (2014). [DOI] [PMC free article] [PubMed] [Google Scholar]
- 24.Bintu B et al. Super-resolution chromatin tracing reveals domains and cooperative interactions in single cells. Science 362 (2018). [DOI] [PMC free article] [PubMed] [Google Scholar]
- 25.Gibcus JH et al. A pathway for mitotic chromosome formation. Science 359 (2018). [DOI] [PMC free article] [PubMed] [Google Scholar]
- 26.Naumova N et al. Organization of the mitotic chromosome. Science 342, 948–953 (2013). [DOI] [PMC free article] [PubMed] [Google Scholar]
- 27.Oomen ME, Hansen AS, Liu Y, Darzacq X & Dekker J CTCF sites display cell cycle-dependent dynamics in factor binding and nucleosome positioning. Genome Res 29, 236–249 (2019). [DOI] [PMC free article] [PubMed] [Google Scholar]
- 28.Crane E et al. Condensin-driven remodelling of X chromosome topology during dosage compensation. Nature 523, 240–244 (2015). [DOI] [PMC free article] [PubMed] [Google Scholar]
- 29.Gassler J et al. A mechanism of cohesin-dependent loop extrusion organizes zygotic genome architecture. EMBO J 36, 3600–3618 (2017). [DOI] [PMC free article] [PubMed] [Google Scholar]
- 30.Polovnikov K, Belan S, Imakaev M, Brandão HB & Mirny LA Fractal polymer with loops recapitulates key features of chromosome organization. bioRxiv (2022). [DOI] [PMC free article] [PubMed] [Google Scholar]
- 31.Abramo K et al. A chromosome folding intermediate at the condensin-to-cohesin transition during telophase. Nat Cell Biol 21, 1393–1402 (2019). [DOI] [PMC free article] [PubMed] [Google Scholar]
- 32.Lieberman-Aiden E et al. Comprehensive mapping of long-range interactions reveals folding principles of the human genome. Science 326, 289–293 (2009). [DOI] [PMC free article] [PubMed] [Google Scholar]
- 33.Schwarzer W et al. Two independent modes of chromatin organization revealed by cohesin removal. Nature 551, 51–56 (2017). [DOI] [PMC free article] [PubMed] [Google Scholar]
- 34.Belaghzal H et al. Liquid chromatin Hi-C characterizes compartment-dependent chromatin interaction dynamics. Nat Genet 53, 367–378 (2021). [DOI] [PMC free article] [PubMed] [Google Scholar]
- 35.Shi Z, Gao H, Bai XC & Yu H Cryo-EM structure of the human cohesin-NIPBL-DNA complex. Science (2020). [DOI] [PubMed] [Google Scholar]
- 36.Mitter M et al. Conformation of sister chromatids in the replicated human genome. Nature 586, 139–144 (2020). [DOI] [PMC free article] [PubMed] [Google Scholar]
- 37.Sanders JT et al. Loops, TADs, Compartments, and Territories are Elastic and Robust to Dramatic Nuclear Volume Swelling. bioRxiv (2021). [DOI] [PMC free article] [PubMed] [Google Scholar]
- 38.Widom J Physicochemical studies of the folding of the 100 A nucleosome filament into the 300 A filament. Cation dependence. J Mol Biol 190, 411–424 (1986). [DOI] [PubMed] [Google Scholar]
- 39.Dekker J Mapping in vivo chromatin interactions in yeast suggests an extended chromatin fiber with regional variation in compaction. J Biol Chem 283, 34532–34540 (2008). [DOI] [PMC free article] [PubMed] [Google Scholar]
- 40.Davidson IF et al. DNA loop extrusion by human cohesin. Science 366, 1338–1345 (2019). [DOI] [PubMed] [Google Scholar]
- 41.Higashi TL et al. A Structure-Based Mechanism for DNA Entry into the Cohesin Ring. Mol Cell 79, 917–933 e919 (2020). [DOI] [PMC free article] [PubMed] [Google Scholar]
- 42.Higashi TL, Pobegalov G, Tang M, Molodtsov MI & Uhlmann F A Brownian ratchet model for DNA loop extrusion by the cohesin complex. Elife 10, 2021.2002.2014.431132 (2021). [DOI] [PMC free article] [PubMed] [Google Scholar]
REFERENCES
- 1.Natsume T, Kiyomitsu T, Saga Y & Kanemaki MT Rapid Protein Depletion in Human Cells by Auxin-Inducible Degron Tagging with Short Homology Donors. Cell Rep 15, 210–218 (2016). [DOI] [PubMed] [Google Scholar]
- 2.Ran FA et al. Genome engineering using the CRISPR-Cas9 system. Nat Protoc 8, 2281–2308 (2013). [DOI] [PMC free article] [PubMed] [Google Scholar]
- 3.Pauli A et al. Cell-type-specific TEV protease cleavage reveals cohesin functions in Drosophila neurons. Dev Cell 14, 239–251 (2008). [DOI] [PMC free article] [PubMed] [Google Scholar]
- 4.Chu VT et al. Increasing the efficiency of homology-directed repair for CRISPR-Cas9-induced precise gene editing in mammalian cells. Nat Biotechnol 33, 543–548 (2015). [DOI] [PubMed] [Google Scholar]
- 5.Sanders JT et al. Loops, TADs, Compartments, and Territories are Elastic and Robust to Dramatic Nuclear Volume Swelling. bioRxiv (2021). [DOI] [PMC free article] [PubMed] [Google Scholar]
- 6.Belaghzal H, Dekker J & Gibcus JH Hi-C 2.0: An optimized Hi-C procedure for high-resolution genome-wide mapping of chromosome conformation. Methods 123, 56–65 (2017). [DOI] [PMC free article] [PubMed] [Google Scholar]
- 7.Imakaev M et al. Iterative correction of Hi-C data reveals hallmarks of chromosome organization. Nat Methods 9, 999–1003 (2012). [DOI] [PMC free article] [PubMed] [Google Scholar]
- 8.Sanborn AL et al. Chromatin extrusion explains key features of loop and domain formation in wild-type and engineered genomes. Proc Natl Acad Sci U S A 112, E6456–6465 (2015). [DOI] [PMC free article] [PubMed] [Google Scholar]
- 9.Rao SSP et al. Cohesin Loss Eliminates All Loop Domains. Cell 171, 305–320 e324 (2017). [DOI] [PMC free article] [PubMed] [Google Scholar]
- 10.Yoon S, Chandra A & Vahedi G Stripenn detects architectural stripes from chromatin conformation data using computer vision. Nat Commun 13, 1602 (2022). [DOI] [PMC free article] [PubMed] [Google Scholar]
- 11.Valton A-L et al. A cohesin traffic pattern genetically linked to gene regulation. bioRxiv (2021). [DOI] [PMC free article] [PubMed] [Google Scholar]
- 12.Heinz S et al. Simple combinations of lineage-determining transcription factors prime cis-regulatory elements required for macrophage and B cell identities. Mol Cell 38, 576–589 (2010). [DOI] [PMC free article] [PubMed] [Google Scholar]
- 13.Ramirez F et al. deepTools2: a next generation web server for deep-sequencing data analysis. Nucleic Acids Res 44, W160–165 (2016). [DOI] [PMC free article] [PubMed] [Google Scholar]
- 14.Campagne A et al. BAP1 complex promotes transcription by opposing PRC1-mediated H2A ubiquitylation. Nat Commun 10, 348 (2019). [DOI] [PMC free article] [PubMed] [Google Scholar]
- 15.McHaourab ZF, Perreault AA & Venters BJ ChIP-seq and ChIP-exo profiling of Pol II, H2A.Z, and H3K4me3 in human K562 cells. Sci Data 5, 180030 (2018). [DOI] [PMC free article] [PubMed] [Google Scholar]
Associated Data
This section collects any data citations, data availability statements, or supplementary materials included in this article.
Supplementary Materials
Data Availability Statement
Deep-sequencing data that support the findings of this study have been deposited in the Gene Expression Omnibus (GEO) under accession codes GSE182500.
All Hi-C and ChIP-seq libraries are listed in Supplemental Table 2 and 3.
Source data have been provided in Source Data. Protein structure in Fig.2 was drawn from PDB-ID-6WG3. All other data supporting the findings of this study are available from the corresponding author on reasonable request.


