

Abstract
Background:
The cyclin-dependent kinase 4 and 6 (CDK4/6) inhibitors palbociclib, ribociclib, and abemaciclib are standard-of-care agents for patients with hormone receptor-positive human epidermal growth factor receptor 2-negative metastatic breast cancer. In support of therapeutic drug monitoring (TDM) and clinical pharmacokinetic (PK) studies, a liquid chromatography coupled with tandem mass spectrometry (LC-MS/MS) assay for the simultaneous quantitation of CDK4/6 inhibitors and the major active metabolite M2 of abemaciclib in human plasma has been developed.
Methods:
Analytes were extracted from 50 μL of human plasma by precipitating proteins with methanol and then collecting the supernatant. Reversed-phase high-performance liquid chromatography was performed for analyte separation using a biphasic gradient at a flow rate of 0.25–0.5 mL/min. The total run time was 9.5 min. The analytes were detected using MS/MS with electrospray ionization operating in positive ion mode.
Results:
Validation according to the U.S. Food and Drug Administration’s (FDA) guidance showed that the new assay produced accurate (94.7–107%) and precise (within-run: 1.2–8.2%; between-run: 0.6–7.5%) measurements of all analytes over a concentration range of 5–2000 ng/mL. Overall analyte recoveries were consistent (mean values: 110–129%). The analytes were also stable in human plasma and the final extract under various storage conditions. Finally, the clinical applicability of the assay was confirmed by quantitation of all analytes in plasma samples obtained from patients treated with CDK4/6 inhibitors. Reproducibility of the measured analyte concentrations in study samples was confirmed successfully by incurred sample reanalysis.
Conclusions:
A sensitive LC-MS/MS method to measure CDK4/6 inhibitors was developed and validated according to FDA criteria. Quantitation of all analytes in clinical plasma samples confirmed that the assay is suitable for TDM and clinical PK studies of CDK4/6 inhibitors.
Keywords: CDK4/6 inhibitors, breast cancer, palbociclib, ribociclib, abemaciclib
INTRODUCTION
The cyclin-dependent kinase 4 and 6 (CDK4/6) inhibitors palbociclib, ribociclib, and abemaciclib in combination with endocrine therapy (i.e., aromatase inhibitors or fulvestrant) are important components of standard clinical care for patients with hormone receptor (HR)-positive human epidermal growth factor receptor 2 (HER2)-negative metastatic breast cancer.1 CDK4/6 are key regulators of cell cycle progression from the G1 phase to the S phase by phosphorylation of retinoblastoma (Rb). In breast cancer cells, overactivity of CDK4/6 causes Rb hyperphosphorylation, which in turn increases the release of transcription factors and G1/S transition; these processes ultimately accelerate tumor growth.2 Selective inhibition of CDK4/6 by palbociclib, ribociclib, and abemaciclib can reduce this tumor proliferation and improve survival.3–6
Exposure-response relationships for safety endpoints have been established for all three CDK4/6 inhibitors.7–9 In addition, the pharmacokinetics of these agents have been characterized, and the results show wide inter-patient variability in clearance with a coefficient of variation (CV) of 29–66%.7–9 Therefore, a reliable method to measure the plasma concentrations of CDK4/6 inhibitors would be of immense value. This method would guarantee adequate drug exposure and minimize the risk of toxicities (e.g., neutropenia, QT interval prolongation), which could potentially lead to dose reductions, treatment interruptions, or even discontinuation. In other words, therapeutic drug monitoring (TDM) of CDK4/6 inhibitors could be a promising tool to improve safety. The feasibility of TDM of palbociclib has been demonstrated in clinical practice where pharmacokinetically guided interventions successfully reduced the number of patients with palbociclib plasma trough concentrations (Cmin) below the target Cmin of 61 ng/mL (success rate: 80%).10 Target Cmin values of abemaciclib (200–210 ng/mL) and ribociclib (711 ng/mL) for TDM have also been proposed but require confirmation in prospective studies.11 In addition to TDM, a bioanalytical assay for CDK4/6 inhibitors would also be useful for pharmacogenetic studies. As reported most recently for palbociclib, polymorphisms could be associated with the pharmacokinetics and/or pharmacodynamics of CDK4/6 inhibitors.12 Ongoing and future pharmacogenetic studies of CDK4/6 inhibitors at our cancer center require sensitive and rapid measurements of palbociclib, ribociclib, abemaciclib, and abemaciclib-M2 (the major active metabolite of abemaciclib) in human plasma. Hence, we developed an appropriate technique that could be used to measure all analytes simultaneously. Although several bioanalytical assays for CDK4/6 inhibitors have been published, these assays do not allow for proper measurement of all said analytes simultaneously.13–18 In particular, abemaciclib-M2 is not measured in conjunction with all CDK4/6 inhibitors by existing assays; thus, our assay, capable of measuring this active metabolite, represents an important and novel contribution. During clinical use, the possibility of monitoring abemaciclib-M2 plasma concentrations would be a major advantage for the following reasons: 1) abemaciclib-M2 is a major systemic metabolite accounting for 25% of the total circulating analytes in plasma; 2) abemaciclib-M2 is pharmacologically equipotent to the parent drug; 3) abemaciclib-M2 is formed through cytochrome P450 3A (CYP3A)-mediated metabolism of abemaciclib and is itself a CYP3A substrate. Hence, both compounds are prone to interactions with CYP3A4-modulating drugs, warranting careful monitoring.9 In addition to measuring all U.S. Food and Drug Administration (FDA) approved CDK4/6 inhibitors and abemaciclib-M2, we aimed to address issues of certain other CDK4/6 inhibitor assays, such as the lack of use of internal standards,18 lengthy run times,18 high plasma sample volumes,13 or narrow working ranges for one or more analytes.14,15 Here, we describe our efforts to develop and validate a novel liquid-chromatography coupled with tandem mass spectrometry (LC-MS/MS) assay for the simultaneous quantitation of CDK4/6 inhibitors plus abemaciclib-M2 in human plasma that addresses these issues and can optimally support TDM, pharmacogenetic studies, and future clinical trials that require bioanalyses of these drugs.
Materials and Methods
CHEMICALS AND REAGENTS
Reference standards for ribociclib, palbociclib, and abemaciclib, as well as internal standards for ribociclib-d6, palbociclib-d8, and abemaciclib-d8, were purchased from Alsachim (Illkirch-Graffenstaden, France). Abemaciclib-M2 was obtained from Accela ChemBio (San Diego, CA, USA). Ammonium bicarbonate and anhydrous dimethyl sulfoxide (DMSO) were purchased from Sigma-Aldrich (St. Louis, MO, USA). Ammonium hydroxide was obtained from Thermo Fisher Scientific (Waltham, MA, USA). Formic acid, LC-MS grade methanol, and LC-MS grade water were obtained from EMD Millipore Corporation (Billerica, MA, USA). Sodium ethylenediaminetetraacetic acid (EDTA) plasma was purchased from Bioreclamation IVT (Westbury, NY, USA).
DRUG SOLUTIONS, CALIBRATION, AND QUALITY CONTROL SAMPLES
Stock solutions (1 mg/mL) of ribociclib, abemaciclib, abemaciclib-M2, ribociclib-d6, and abemaciclib-d8 were prepared in DMSO. For palbociclib and palbociclib-d8, a 1 mg/mL stock solution was prepared in 0.1% formic acid in water. Subsequently, 180 μL of each of the four analyte stock solutions were combined and added to 780 μL of 100% methanol to obtain a working solution of 120 μg/mL (WS1). WS1 was diluted further in 100% methanol to obtain calibrator spiking solutions at concentrations of 100, 200, 400, 800, 2000, 5000, 20000, 32000, and 40000 ng/mL. Additionally, the internal standard stock solutions were diluted individually in 100% methanol to obtain working solutions of 10 μg/mL (WIS1). WIS1 solutions were then combined and added to 100% methanol to obtain a second working solution (WIS2) of the analytes at a final concentration of 35 ng/mL (abemaciclib-d8 and palbociclib-d8) or 7 ng/mL (ribociclib-d6). All stock and working solutions were stored at −20°C.
Calibration samples were prepared by adding 100 μL of the calibrator spiking solution to 1.9 mL of human sodium EDTA plasma. The final nominal concentrations of the analytes in the calibration samples were 5, 10, 20, 40, 100, 250, 1000, 1600, and 2000 ng/mL.
Quality control (QC) samples of human sodium EDTA plasma were prepared by diluting WS1 with 100% methanol to obtain QC spiking solutions at concentrations of 100, 300, 3000, and 30000 ng/mL for each of the four analytes. Next, these spiking solutions were added to the EDTA-human plasma blanks to obtain QC plasma concentrations with final analyte concentrations of 5, 15, 150, and 1500 ng/mL. Both the calibrator and QC plasma samples were aliquoted and stored at −80°C.
SAMPLE PREPARATION
Under yellow light, 450 μL of WIS2 was added to 50 μL of a plasma sample. After vortexing for 10 s, the proteins in the samples were allowed to precipitate for 10 min at room temperature (20–25°C). The samples were then vortexed for 10 s and centrifuged for 10 min at 17,110 × g at 4°C. Subsequently, 18 μL of supernatant was added to 1500 μL of sample diluent (75% methanol containing 0.005 mol/L ammonium bicarbonate) in an autosampler vial. After vortexing for 10 s, 4 μL of the sample was injected into the LC-MS/MS system.
CHROMATOGRAPHIC AND MASS SPECTROMETRIC CONDITIONS
The high-performance liquid chromatography (HPLC) Prominence system (Shimadzu Corporation, Kyoto, Japan) consisted of an LC-20AD binary pump system, DGU-20A3 degasser, CBM-20A system controller, CTO-20AC column oven, and SIL-20AC HT autosampler set at 4°C. Analytes were separated by reversed-phase HPLC using a 2 mm × 50 mm Gemini NX C18 column with a particle size of 3 μm (Phenomenex, Torrance, CA, USA), protected by a 4 mm × 20 mm Gemini NX C18 SecurityGuard Cartridge (Phenomenex). The column temperature was maintained at 50°C. Mobile phase A consisted of 60% methanol containing 0.01 mol/L ammonium bicarbonate (pH ~10.5), and mobile phase B consisted of 90% methanol containing 0.01 mol/L ammonium bicarbonate (pH ~10.5). The flow rate remained constant at 0.5 mL/min, and the total run time was 9.5 min, during which a biphasic gradient was applied. From 0.01 to 2 min, %B was gradually increased from 0 to 100% A, and from 2 to 3 min, the %B was reduced from 100% to 0% and held until 3.5 min. From 3.5 to 4 min, the flow rate was reduced to 0.25 mL/min while still holding at 100% A. From 4 to 5 min, the %B was increased to 100% while increasing the flow rate to 0.5 mL/min and then holding until 5.5 min. Next, the %B was decreased to 0% from 5.5 to 6 min. From 6 to 6.5 min, the flow rate was reduced to 0.25 mL/min while still holding at 100% A, after which the %B was increased to 100% until 7.5 min while increasing the flow rate to 0.5 mL/min. From 7.5 to 8 min, the %B was kept at 100%. Finally, the %B was decreased to 0% until 8.5 min, and this condition did not change until the end of the run at 9.5 min.
The HPLC system was connected to a SCIEX 5500 QTRAP mass spectrometer with an electrospray ion source operated in positive ion mode (Framingham, MA, USA). The analytes were detected via multiple reaction monitoring. Analyst software (version 1.6.2, SCIEX) was used for data acquisition and processing. Mass spectrometry settings are detailed in Table 1.
TABLE 1.
Mass spectrometry settingsa
| Parameter | Palbociclib | Ribociclib | Abemaciclib | Abemaciclib-M2 | Palbociclib-d8 | Ribociclib-d6 | Abemaciclib-d8 |
|---|---|---|---|---|---|---|---|
| Precursor ion (m/z) | 448.138 | 435.135 | 507.148 | 479.280 | 456.212 | 441.210 | 515.231 |
| Product ion (m/z) | 380.139 | 322.100 | 393.100 | 393.200 | 388.206 | 322.123 | 393.131 |
| Collision energy (V) | 41 | 45 | 31 | 31 | 41 | 45 | 31 |
| Declustering potential (V) | 90 | 90 | 80 | 56 | 90 | 90 | 80 |
| Collision cell exit potential (V) | 16 | 12 | 14 | 16 | 18 | 14 | 18 |
| Dwell time (ms) | 50 | 50 | 50 | 50 | 30 | 30 | 30 |
| Retention time (min) | 2.58 | 2.36 | 3.06 | 2.83 | 2.58 | 2.34 | 3.04 |
Instrument parameters: ionspray voltage = 2500 V; entrance potential = 10 V; nebulizer gas/ion source gas 1 = 40 psi; turbo heater gas/ion source gas 2 = 70 psi; curtain gas = 20 psi; and temperature = 700°C.
METHOD VALIDATION
Validation of the assay was performed according to the standard operating procedures of the Roswell Park Bioanalytical, Metabolomics, and Pharmacokinetics Shared Resource, based on a 2018 document published by FDA titled “Bioanalytical Method Validation: Guidance for Industry.”19 Validation parameters included linearity, accuracy, precision, selectivity, recovery, stability, and carryover.
Linearity.
A single-matrix calibration curve consisting of nine non-zero calibrators ranging from 5 to 2000 ng/mL was included in each validation run (n = 3). The validation criteria were as follows: for each calibration curve, individual and mean back-calculated concentrations for each of the calibrators must have accuracy results equal to or within the range of ±15% from the nominal value or ±20% at the lower limit of quantitation (LLOQ), and data must have a relative standard deviation (RSD) of ≤15% with ≤20% RSD being allowed at the LLOQ. At least 75% of the calibrators should meet these criteria. The overall mean accuracy for all calibrator concentrations must be equal to or within the range of 100 ±15%, with a mean overall precision of ≤15% RSD.
Accuracy and precision.
The accuracy and precision were validated by measuring four levels of QC samples in three validation runs. The analyte concentrations were 5 (LLOQ), 15 (Low), 150 (Middle), and 1500 (High) ng/mL (n = 5 at each level). In one validation run, the accuracy and precision of a diluted out-of-range QC sample (6000 ng/mL) were determined in five identical copies. Within and between the three validation runs, individual back-calculated concentrations of the QCs should be equal to or within ±15% (or ±20% at the LLOQ) from the nominal value. For LLOQ and low and high QCs, between-run accuracy was calculated by dividing the average concentrations for all runs combined by the respective nominal concentrations. For in-range QCs samples, within-run and between-run precisions were determined by one-way analysis of variance (ANOVA).20 Precision of the out-of-range QC samples was expressed as the RSD. Precision values should be ≤15% for each concentration, except for the LLOQ, for which values ≤20% are acceptable. In addition, two-thirds of the QCs must pass in each run with greater than or equal to 50% of the QCs passing at each concentration level.
Selectivity.
Six batches of blank human plasma from individual donors were tested for potential interference from endogenous matrix components. Each batch was analyzed as a blank (no analyte, no internal standard) and as a sample spiked with a solution of the analytes at the LLOQ (including internal standards). Passing selectivity criteria were as follows: 1) in the blanks, the response of components co-eluted at the retention time of the analytes did not exceed 20% of the LLOQ response; 2) the internal standard response in the blanks did not exceed 5% of the average internal standard response from all passing calibrators and QCs; 3) back-calculated concentrations in the spiked samples deviated no more than 20% from the nominal concentrations.
Recovery and Matrix Factors.
In one of the validation runs, recoveries of the analytes and internal standards were determined by dividing the mean peak area response of extracted QC samples at three concentrations (15, 150, 1500 ng/mL, n = 5 per concentration) by the mean peak area response in neat solutions containing analyte concentrations representing 100% recovery. The matrix factor (MF) was determined for each analyte and internal standard in six lots of blank human plasma from individual donors. After protein precipitation, blank plasma from each lot was spiked with QC working solution to reach final analyte concentrations of 15 ng/mL (QC Low) and 1500 ng/mL (QC High). To calculate the MF for each analyte, the peak area of the analyte in these samples was divided by the peak area of the analytes in the absence of the matrix (i.e., QC working solutions diluted with organic solvents). Similarly, the MF of the internal standards was calculated at their concentrations in WIS2. In addition, the internal standard-normalized MF was calculated by dividing the MF of the analyte by that of the internal standard. The % RSD of the internal standard-normalized MF should not be greater than 15%.21
Stability.
The stability of all analytes stored in polypropylene tubes was tested in a human matrix or final extract under various conditions. Pre-processed stability in human plasma was assessed for high and low QC samples (n = 3 each) kept under yellow light at room temperature for 2.5 h and in the dark at 37°C for 2.5 h. Reinjection stability in the final extract was determined by reinjecting high-, middle-, and low QC samples (n = 3 each) after storage in the original autosampler vials for 25.95 h at 4°C. The processed sample stability in the final extracts at high and low QC levels (n = 3 each) was tested in autosampler vials stored for 25.1 h under autosampler conditions (4°C). The freeze-thaw stability of unprocessed samples was determined by analyzing QCs at high and low QC concentrations (n = 3 each) after three freeze (-80°C)-thaw cycles. The long-term stability of unprocessed high, middle, and low QC samples was tested after 3, 7, and 12 months of storage at −80°C.
For all stability experiments, individual back-calculated concentrations should be equal to or within ±15% of the nominal value, with an overall precision of ≤15% (% RSD). In addition, deviations from the mean concentrations of normally processed QCs should be no greater than 10% for pre-processed, reinjected, processed, and freeze-thaw stability samples, whereas long-term stability samples should deviate no more than 15% from the mean concentrations of freshly prepared QCs.
Carryover.
In each validation run (n = 3), carryover was investigated by injecting a sample containing the sample dilution solvent after the highest matrix calibrator. The carryover effect was considered acceptable when the analyte and internal standard responses in the dilution solvent sample were less than 20% of the analyte response of the lowest calibrator and less than 5% of the average internal standard response in calibrator and QC samples, respectively.
CLINICAL PHARMACOKINETIC APPLICATION
Plasma samples were collected from patients with breast cancer treated with CDK4/6 inhibitors at the Roswell Park Breast Clinic. These patients participated in a non-interventional pharmacogenetic study approved by the Roswell Park Institutional Review Board (BDR-122719). All plasma samples were collected at steady state (i.e., days 8–21 for palbociclib and ribociclib and after day 5 for abemaciclib).
INCURRED SAMPLE REANALYSIS
Incurred sample reanalysis was performed on steady-state samples from the BDR-122719 study to demonstrate assay reproducibility and stability of the analytes in study samples within 12 months of storage at −80°C. In compliance with the FDA recommendation to reanalyze 10% of the first 1000 study samples, six samples for palbociclib (total number of analyzed samples: 55) were reanalyzed. For ribociclib, abemaciclib, and abemaciclib-M2, one sample for each analyte was reanalyzed because no additional study samples from patients treated with ribociclib and abemaciclib were collected thus far. The percentage difference between the results from the original analysis and the reanalysis was calculated by the equation: (reanalyzed concentration – original concentration) / mean of both concentrations × 100%. For each drug, at least 67% of the samples should be within 20% of their mean concentration.
Results
METHOD DEVELOPMENT
MS/MS settings were optimized by infusing 100 ng/mL solutions of each analyte and adjusting each analyte-specific parameter to yield the best response for each analyte. Source parameters were optimized for the highest abemaciclib response because it had the lowest sensitivity for all analytes.
Several LC gradients were tested to optimize chromatography and minimize carryover. Initial LC conditions were based on a previously published method.14 Other acidic mobile phase compositions using ammonium formate and formic acid were tested; however, peak tailing and carryover were reduced after switching to a mobile phase system with ammonium bicarbonate at pH 10.5. The addition of two wash gradients in the LC method after the elution of all analytes also reduced the carryover load. Moreover, the incorporation of a flow rate gradient in these wash steps further reduced the carryover.
All analytes showed a decrease in concentration after exposure to natural light during the development of the assay. Therefore, the sample preparation steps were carried out under yellow lighting to prevent any loss during this stage. Figure 1 shows the representative chromatograms of plasma samples spiked at the LLOQ.
FIGURE 1.
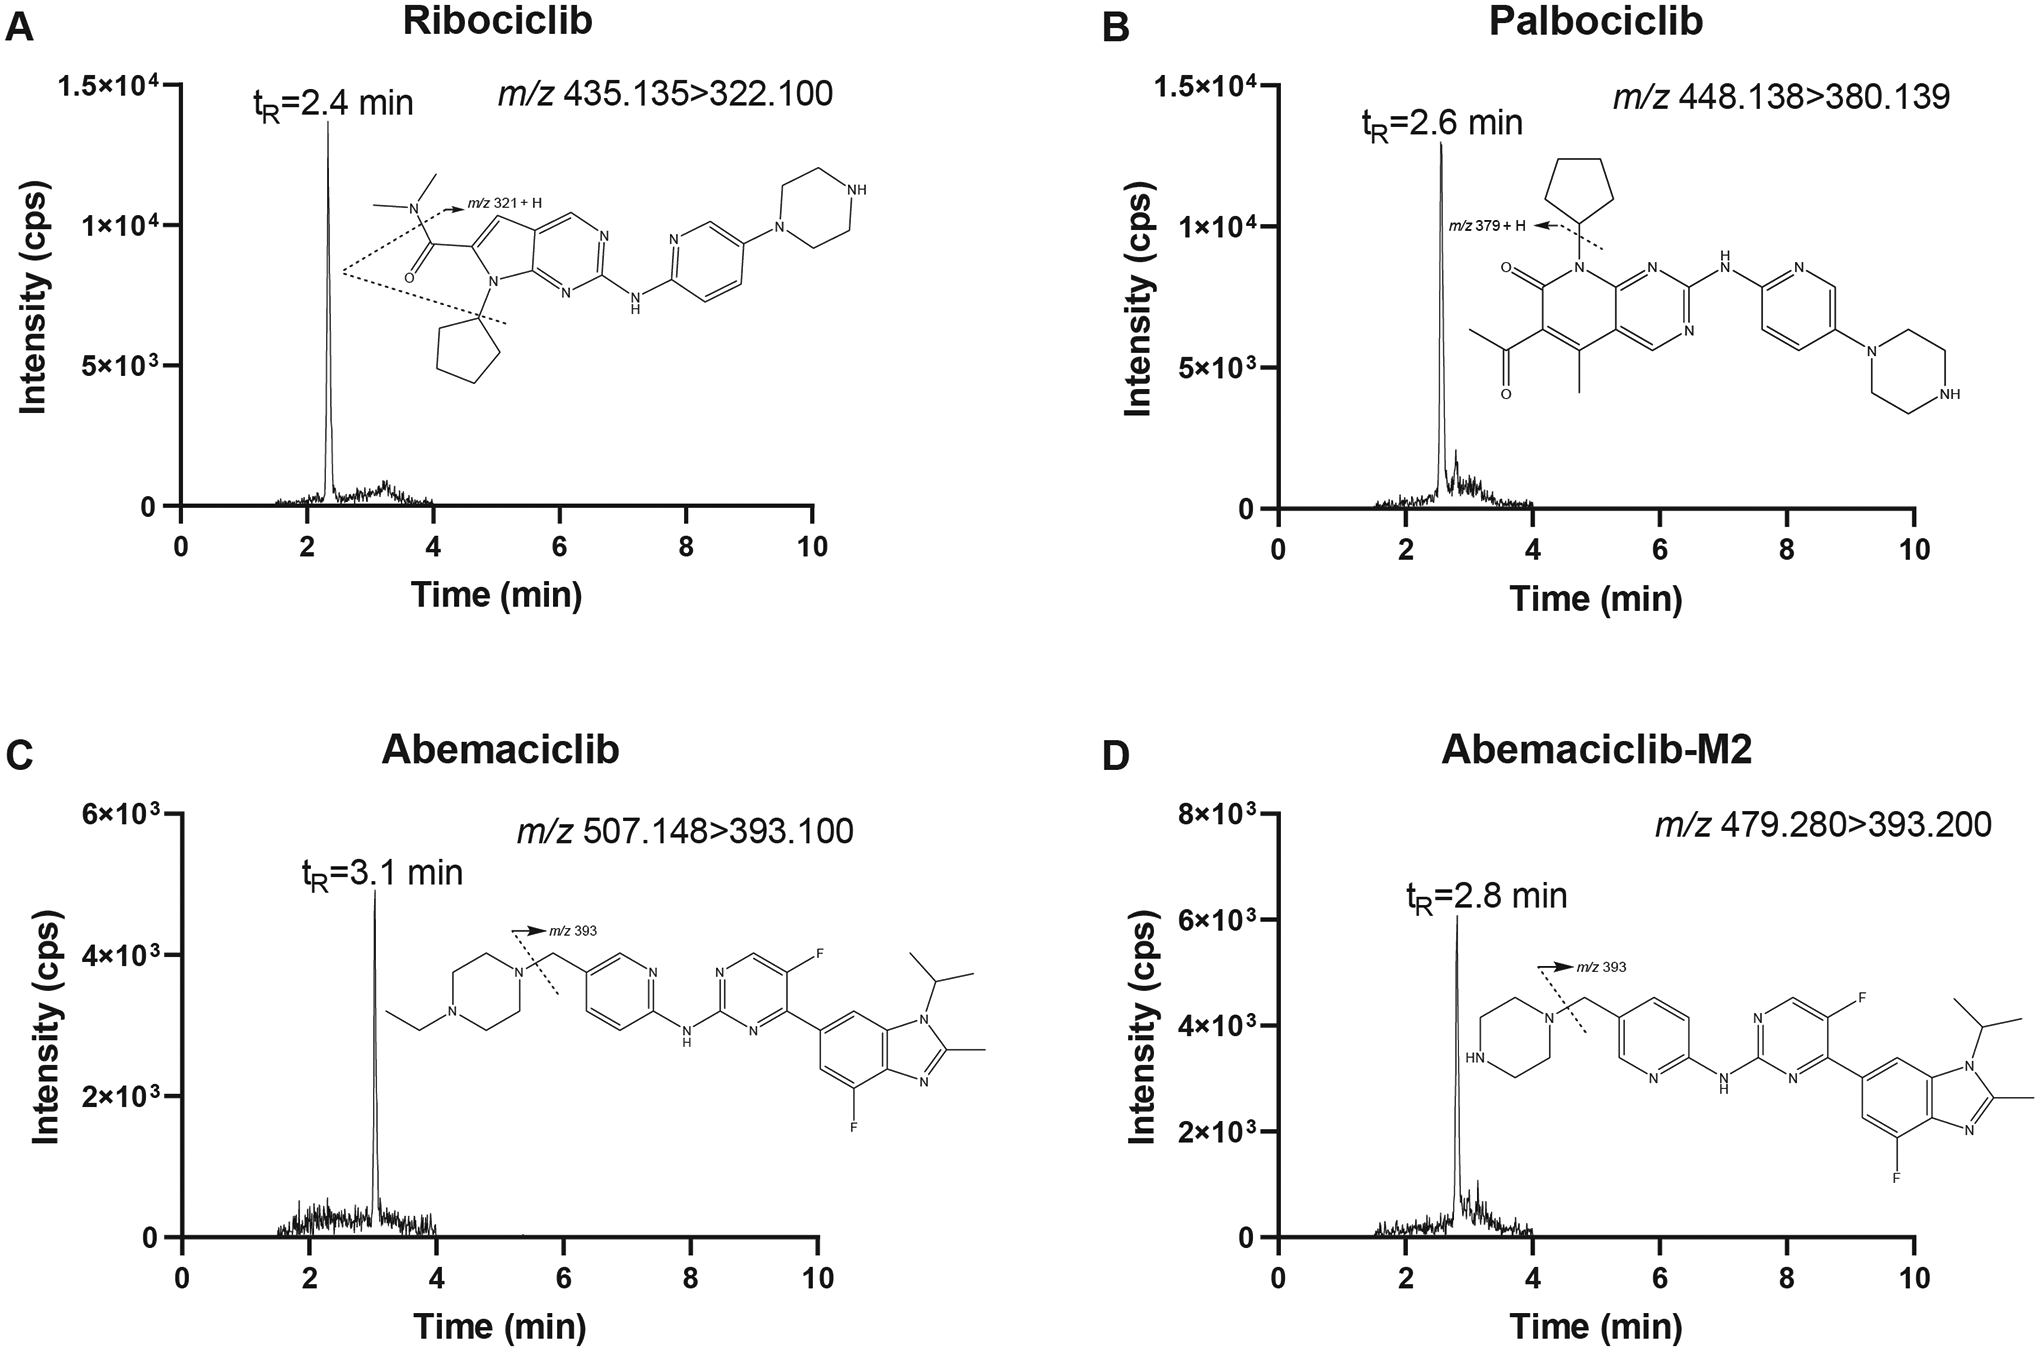
Representative ion chromatograms of blank human plasma spiked at the lower limit of quantitation (5 ng/mL) with ribociclib (A), palbociclib (B), abemaciclib (C), and abemaciclib-M2 (D). The figure inserts show the proposed fragmentation patterns of the analytes.
METHOD VALIDATION
Linearity.
The assay was linear over a concentration range of 5–2000 ng/mL for abemaciclib, abemaciclib-M2, ribociclib, and palbociclib in the human plasma. Linear regression was applied with a weighting factor of 1/x2. For all analytes, the mean correlation coefficient (r) was ≥0.999 in the three individual runs.
For all analytes, all calibrators met the accuracy criterion of deviating ≤15% (or ≤20% at the LLOQ) from nominal concentrations. Mean accuracy values obtained from three validation runs were 94.2–103.4% for ribociclib, 93.8–103.9% for palbociclib, 98.0–103.5% for abemaciclib, and 97.5–104.2% for abemaciclib-M2.
Precision criteria (% RSD ≤15% or ≤20% at the LLOQ) were met at all calibration levels and for all analytes, as shown by the % RSD values obtained: 0.2–3.4% for ribociclib, 0.8–3.6% for palbociclib, 0.6–7.1% for abemaciclib, and 0.0–6.7% for abemaciclib-M2.
Accuracy and precision.
The assay performance data for the CDK4/6 inhibitors in human plasma are shown in Table 2. For all analytes and at all QC levels, values for between-run accuracy, within-run precision, and between-run precision passed the ±15% criterion (±20% at the LLOQ). Diluted out-of-range QCs (6000 ng/mL) also met the accuracy (103–104%) and precision criteria (1.2–1.6% RSD).
TABLE 2.
Assay performance data for CDK4/6 inhibitors in human plasma (n = 15 in three validation runs)
| Analyte | Nominal concentration (ng/mL) | Within-run precision (%) | Between-run accuracy (%) | Between-run precision (%) |
|---|---|---|---|---|
| Ribociclib | 5 | 3.7 | 97.0 | 2.6 |
| 15 | 4.8 | 107 | 3.1 | |
| 150 | 1.6 | 105 | 2.2 | |
| 1500 | 1.2 | 99.3 | 0.8 | |
| Palbociclib | 5 | 4.0 | 94.7 | 1.5 |
| 15 | 4.6 | 106 | 3.0 | |
| 150 | 1.8 | 106 | 2.4 | |
| 1500 | 1.3 | 98.0 | a | |
| Abemaciclib | 5 | 5.6 | 101 | 7.3 |
| 15 | 5.7 | 105 | 5.5 | |
| 150 | 1.7 | 103 | 2.2 | |
| 1500 | 2.0 | 99.3 | a | |
| Abemaciclib-M2 | 5 | 8.2 | 101 | 7.5 |
| 15 | 7.5 | 105 | a | |
| 150 | 1.4 | 105 | 2.7 | |
| 1500 | 2.2 | 100 | 0.6 |
Mean square within groups > mean square between groups, indicating that there was no significant additional variation due to assay performance in different runs.
Selectivity.
In the six batches of blank plasma, no co-eluting components at >20% of the analyte response at the LLOQ level or >5% of the average internal standard response of the calibrators and QCs were measured. After spiking the six batches with analytes at the LLOQ, mean accuracies were 102% for ribociclib, 97.2% for palbociclib, 101%, for abemaciclib, and 98.8% for abemaciclib-M2. Thus, the accuracy requirement of deviating no more than 20% from the nominal concentration was met for all analytes. In addition, no interfering peaks were observed at the retention times of the analytes or internal standards in blank samples.
Recovery and Matrix Factors.
Mean recoveries for all analytes were greater than 100% and consistent at the three QC levels tested, with specific values of 129% (range, 124–136%) for ribociclib, 118% (range, 114–124%) for palbociclib, 111% (range, 110–112%) for abemaciclib, and 110% (range, 108–113%) for abemaciclib-M2. The internal standards exhibited recoveries greater than 100%, with specific values of 118% for ribociclib-d6, 110% for palbociclib-d8, and 104% for abemaciclib-d8. Recovery values greater than 100% indicate ion enhancement, which was confirmed in our matrix effect experiments. The average internal standard-normalized MF for each analyte was 1.40 for ribociclib, 1.31 for palbociclib, 1.10 for abemaciclib, and 1.11 for abemaciclib-M2. At both the low and high QC levels, the % RSD of the internal standard-normalized MF did not exceed 9.79%; hence, the criterion for MF was met. The absolute and normalized MF values for each analyte and internal standard at both QC levels are shown in Supplementary Table S1.
Stability.
All analytes were stable in the human plasma and final extract under various storage conditions (Table 3). Unprocessed samples remained stable for at least 12 months when stored at −80°C, after three freeze (-80°C)-thaw cycles, for at least 2.5 h at room temperature under yellow light and 37°C in the dark. In addition, reinjection and processed sample stability in the final extract were confirmed after storage at 4°C for at least 25 h.
TABLE 3.
Stability data for CDK4/6 inhibitors
| Analyte | Matrix | Stability conditions | Nominal concentration (ng/mL) | Mean measured concentration (ng/mL) | Accuracy vs. nominal concentration (%) | Accuracy vs fresh QCs (%) | Precision (% RSD) |
|---|---|---|---|---|---|---|---|
| Ribociclib | Human plasma | RT,a yellow light, 2.5 h | 15 | 15.9 | 106 | 98.0 | 0.7 |
| 1500 | 1503 | 100 | 102 | 2.8 | |||
| 37°C, dark, 2.5 h | 15 | 15.9 | 106 | 97.8 | 2.3 | ||
| 1500 | 1500 | 100 | 102 | 1.8 | |||
| Final extract, reinjected | 4°C, autosampler, 25.95 h | 15 | 16.5 | 110 | 97.8 | 7.6 | |
| 150 | 161 | 107 | 101 | 2.5 | |||
| 1500 | 1503 | 100 | 101 | 0.4 | |||
| Final extract | 4°C, autosampler, 25.1 h | 15 | 16.7 | 112 | 99.2 | 5.7 | |
| 1500 | 1480 | 98.7 | 99.8 | 2.4 | |||
| Human plasma | 3 freeze (-80°C)-thaw cycles | 15 | 15.0 | 100 | 98.3 | 1.7 | |
| 1500 | 1457 | 97.1 | 97.1 | 1.6 | |||
| Human plasma | −80°C, 3 months | 15 | 15.3 | 102 | 106 | 2.6 | |
| 150 | 148 | 98.7 | 105 | 1.8 | |||
| 1500 | 1413 | 94.2 | 104 | 1.8 | |||
| −80°C, 7 months | 15 | 14.8 | 98.4 | 90.3 | 2.0 | ||
| 150 | 160 | 106 | 86.0 | 1.0 | |||
| 1500 | 1403 | 93.6 | 88.8 | 2.7 | |||
| −80°C, 12 months | 15 | 15.7 | 105 | 107 | 1.0 | ||
| 150 | 161 | 108 | 105 | 1.3 | |||
| 1500 | 1613 | 108 | 101 | 2.2 | |||
| Palbociclib | Human plasma | RT, yellow lights, 2.5 h | 15 | 15.5 | 104 | 95.6 | 2.6 |
| 1500 | 1493 | 99.6 | 102 | 1.0 | |||
| 37°C, dark, 2.5 h | 15 | 15.4 | 103 | 94.8 | 2.0 | ||
| 1500 | 1490 | 99.3 | 102 | 1.3 | |||
| Final extract, reinjected | 4°C, autosampler, 25.95 h | 15 | 16.7 | 112 | 100 | 6.0 | |
| 150 | 160 | 106 | 99.0 | 1.9 | |||
| 1500 | 1473 | 98.7 | 100 | 1.2 | |||
| Final extract | 4°C, autosampler, 25.1 h | 15 | 16.5 | 110 | 99.0 | 6.0 | |
| 1500 | 1480 | 98.7 | 100 | 0.7 | |||
| Human plasma | 3 freeze (-80°C)-thaw cycles | 15 | 15.0 | 99.8 | 98.1 | 2.4 | |
| 1500 | 1453 | 96.9 | 98.7 | 2.0 | |||
| Human plasma | −80°C, 3 months | 15 | 15.0 | 99.8 | 94.0 | 2.2 | |
| 150 | 153 | 102 | 92.8 | 2.3 | |||
| 1500 | 1440 | 96.0 | 92.8 | 0.7 | |||
| −80°C, 7 months | 15 | 15.2 | 101.3 | 92.1 | 4.6 | ||
| 150 | 163 | 109 | 85.7 | 3.9 | |||
| 1500 | 1383 | 92.2 | 91.6 | 0.4 | |||
| −80°C, 12 months | 15 | 15.6 | 104 | 96.4 | 2.3 | ||
| 150 | 157 | 105 | 95.3 | 1.6 | |||
| 1500 | 1613 | 108 | 87.0 | 2.0 | |||
| Abemaciclib | Human plasma | RT, yellow lights, 2.5 h | 15 | 15.7 | 105 | 99.4 | 2.3 |
| 1500 | 1550 | 103 | 105 | 2.3 | |||
| 37°C, dark, 2.5 h | 15 | 15.4 | 103 | 97.5 | 4.6 | ||
| 1500 | 1527 | 102 | 103 | 2.7 | |||
| Final extract, reinjected | 4°C, autosampler, 25.95 h | 15 | 16.4 | 109 | 98.2 | 8.0 | |
| 150 | 155 | 104 | 98.7 | 5.6 | |||
| 1500 | 1527 | 102 | 103 | 1.0 | |||
| Final extract | 4°C, autosampler, 25.1 h | 15 | 15.9 | 106 | 95.6 | 6.2 | |
| 1500 | 1510 | 101 | 102 | 2.4 | |||
| Human plasma | 3 freeze (-80°C)-thaw cycles | 15 | 15.1 | 101 | 103 | 1.8 | |
| 1500 | 1480 | 98.7 | 98.8 | 0.7 | |||
| Human plasma | −80°C, 3 months | 15 | 14.7 | 97.8 | 98.6 | 3.2 | |
| 150 | 149 | 99.3 | 95.5 | 1.3 | |||
| 1500 | 1437 | 95.8 | 95.6 | 2.4 | |||
| −80°C, 7 months | 15 | 14.1 | 93.8 | 112 | 2.7 | ||
| 150 | 156 | 104 | 98.9 | 3.2 | |||
| 1500 | 1443 | 96.2 | 97.5 | 3.5 | |||
| −80°C, 12 months | 15 | 15.2 | 102 | 112 | 2.3 | ||
| 150 | 164 | 109 | 99.0 | 1.8 | |||
| 1500 | 1583 | 106 | 96.6 | 2.4 | |||
| Abemaciclib-M2 | Human plasma | RT, yellow lights, 2.5 h | 15 | 15.3 | 102 | 96.6 | 0.4 |
| 1500 | 1557 | 104 | 104 | 2.3 | |||
| 37°C, dark, 2.5 h | 15 | 15.1 | 101 | 95.8 | 6.1 | ||
| 1500 | 1540 | 103 | 103 | 3.3 | |||
| Final extract, reinjected | 4°C, autosampler, 25.95 h | 15 | 16.9 | 113 | 103 | 3.8 | |
| 150 | 155 | 104 | 96.5 | 5.2 | |||
| 1500 | 1557 | 104 | 103 | 1.3 | |||
| Final extract | 4°C, autosampler, 25.1 h | 15 | 16.5 | 110 | 100 | 5.4 | |
| 1500 | 1537 | 102 | 102 | 3.1 | |||
| Human plasma | 3 freeze (-80°C)-thaw cycles | 15 | 15.0 | 100 | 98.2 | 5.2 | |
| 1500 | 1493 | 99.6 | 98.2 | 1.4 | |||
| Human plasma | −80°C, 3 months | 15 | 14.6 | 97.6 | 107 | 3.2 | |
| 150 | 150 | 100 | 104 | 1.0 | |||
| 1500 | 1503 | 100 | 98.7 | 0.8 | |||
| −80°C, 7 months | 15 | 14.5 | 96.9 | 102 | 7.4 | ||
| 150 | 154 | 102 | 92.4 | 2.5 | |||
| 1500 | 1403 | 93.6 | 93.8 | 1.8 | |||
| −80°C, 12 months | 15 | 15.1 | 101 | 111 | 2.3 | ||
| 150 | 166 | 110 | 95.6 | 4.7 | |||
| 1500 | 1567 | 104 | 96.8 | 2.6 |
RT, room temperature (20–25°C)
Carryover.
In the sample dilution solvent that was injected immediately after the highest matrix calibrator, all analyte responses were below 20% of the LLOQ response. Average carryover percentages (n = 3) were 3.6% for ribociclib, 6.5% for palbociclib, 12.5% for abemaciclib, and 15.6% for abemaciclib-M2. In addition, all internal standard peak areas in the carryover samples (n = 3) were less than 5% of the average internal standard peak areas in calibrators and QCs in three validation runs: 0.5% for ribociclib-d6, 0.3% for palbociclib-d8, and 0.4% for abemaciclib-d8. In conclusion, the carryover effects were considered acceptable.
CLINICAL PHARMACOKINETIC APPLICATION
The validated assay was used to measure plasma trough concentrations of CDK4/6 inhibitors in patients receiving the drugs as a standard of care. Figure 2 shows the ion chromatograms of the representative patient samples (n = 1 per drug). The measured concentrations (ribociclib: 857 ng/mL, palbociclib: 84.9 ng/mL, abemaciclib: 56.6 ng/mL, abemaciclib-M2: 15.4 ng/mL) fell well within the calibration range, indicating that this assay can be readily used to support TDM and pharmacokinetic studies.
FIGURE 2.
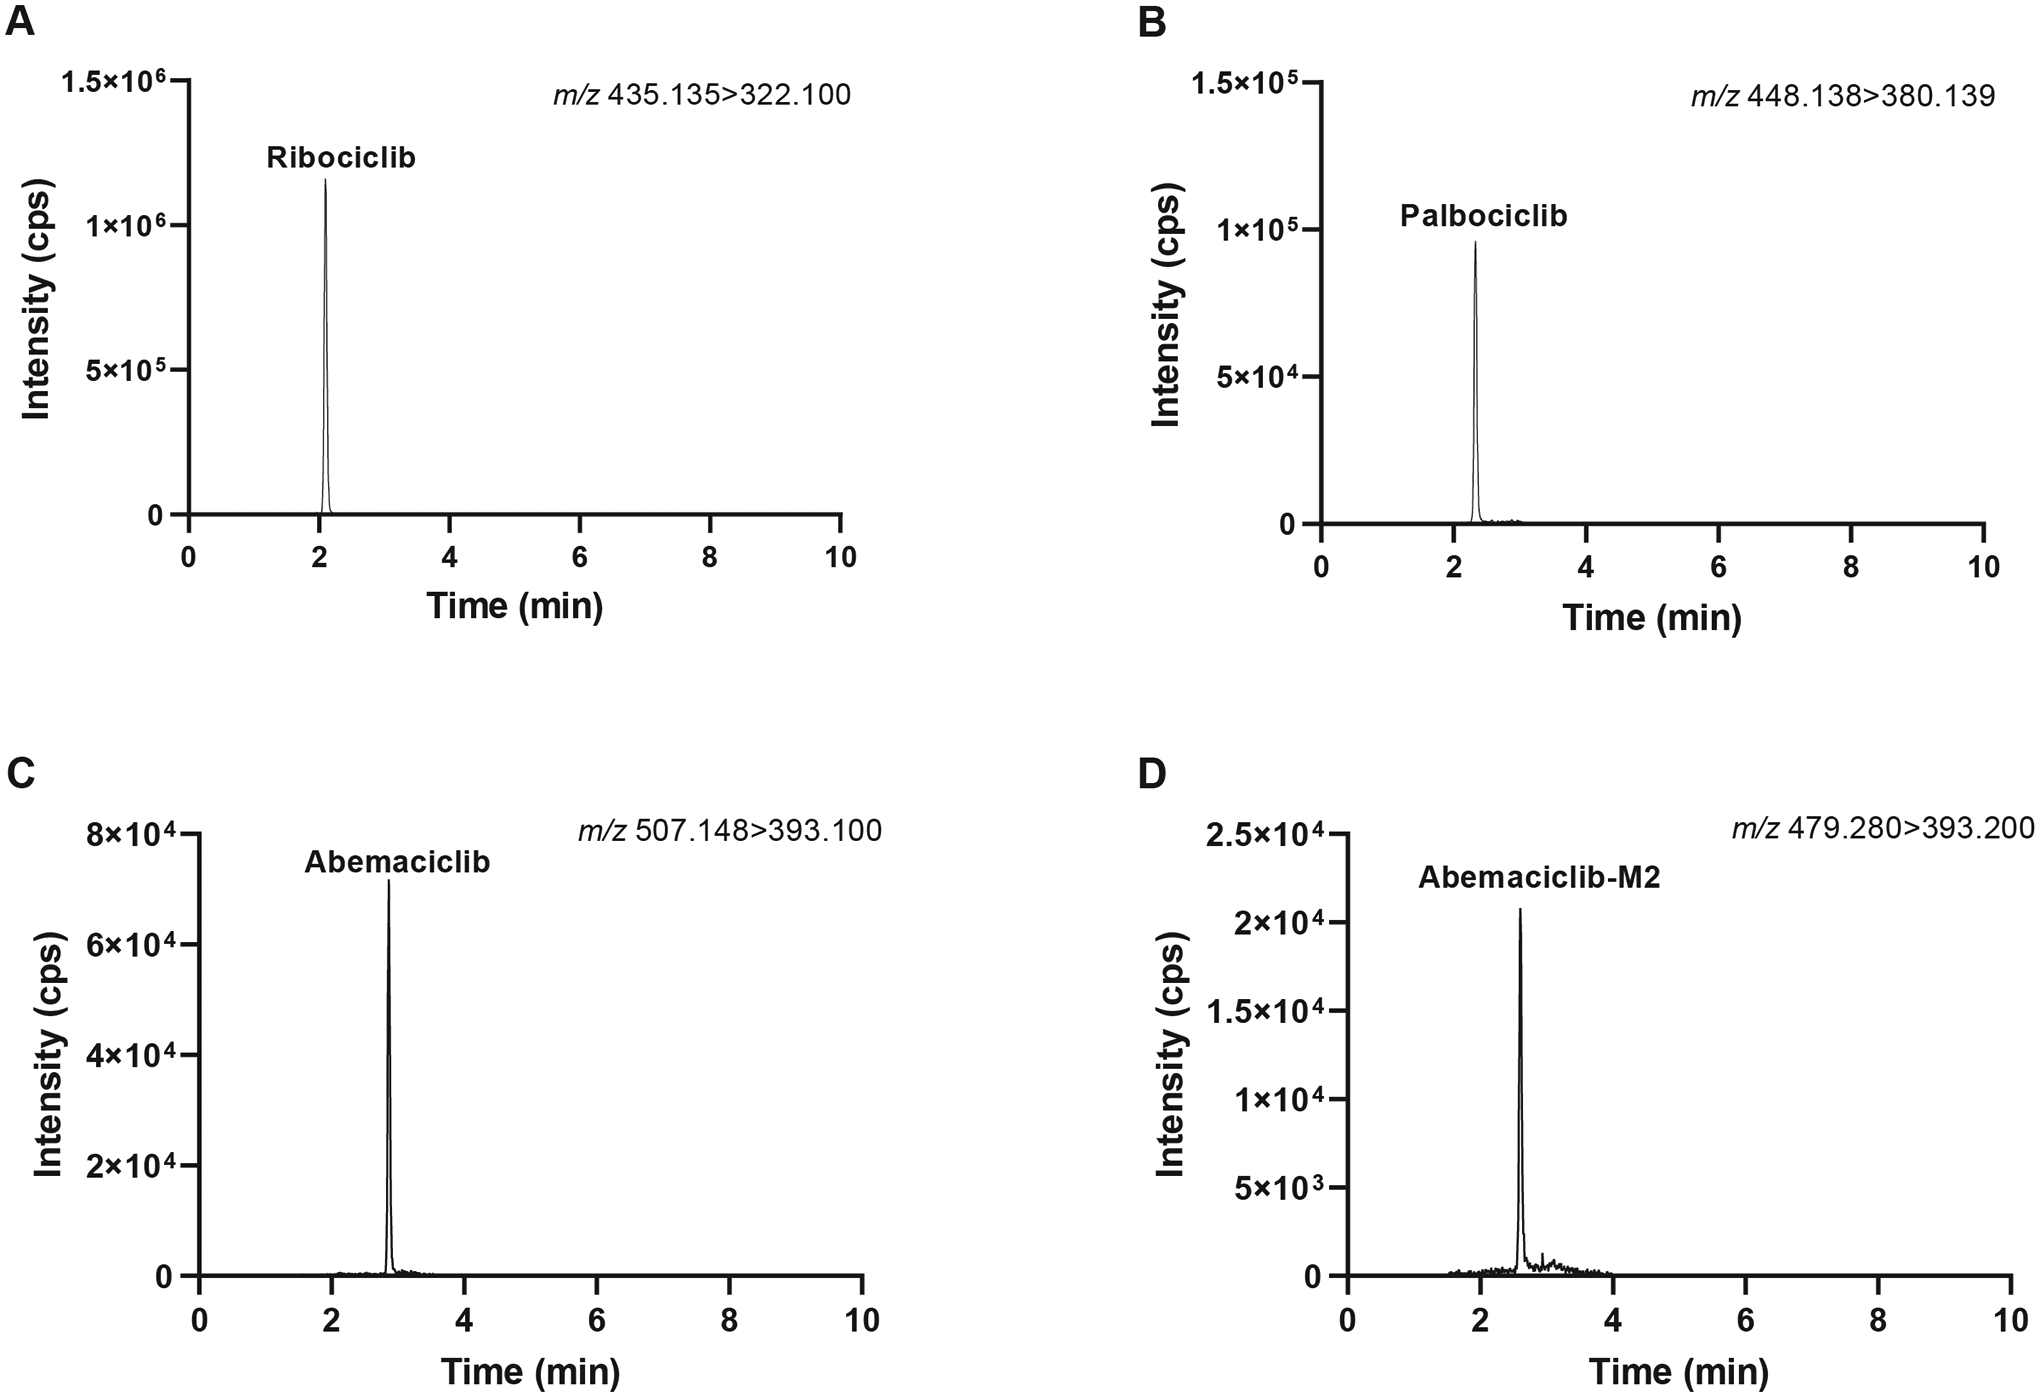
Ion chromatograms of representative steady-state plasma samples from patients treated with ribociclib (200 mg tid), palbociclib (125 mg qd), or abemaciclib (100 mg bid) as the standard of care (n = 1 per drug). The measured concentrations of ribociclib (A), palbociclib (B), abemaciclib (C), and abemaciclib-M2 (D) were 857, 84.9, 56.6, and 15.4 ng/mL, respectively. Abbreviations: tid, ter in die or 3 times per day; qd, quaque die or every day; bid, bis in die or 2 times per day.
INCURRED SAMPLE REANALYSIS
Incurred sample reanalysis showed that for all analytes, 100% of the reanalyzed samples showed percentage differences that were within 20% of the mean. The percentage difference for palbociclib (n = 6) ranged between −4.64% and 6.38%. Despite the low number of available study samples for ribociclib (n = 1) and abemaciclib/abemaciclib-M2 (n = 1), the percentage difference of 16.4% for ribociclib, 13.5% for abemaciclib, and 17.8% for abemaciclib-M2 indicated good reproducibility.
Discussion
A sensitive LC-MS/MS assay for the quantitation of CDK4/6 inhibitors in human plasma was successfully developed and validated in accordance with the current guidance of the FDA for Bioanalytical Method Validation. The successful measurement of all analytes in patient samples proved that the assay can be implemented in clinical practice. A few other bioanalytical assays for CDK4/6 inhibitors have been published. However, many of them did not measure all three CDK4/6 inhibitors,13,15–17 limiting their clinical applicability. In comparison to the published methods that combined all CDK4/6 inhibitors in one assay,14,18,22 our method has the widest working range (5–2000 ng/mL), implying that it has the best applicability for measuring highly variable plasma concentrations in clinical practice. In addition, the working range was kept constant for all analytes, which should lead to fewer errors when preparing the working solutions, calibrators, and QCs. Unlike many other assays, our validated assay also includes the major active metabolite of abemaciclib, abemaciclib-M2, which is equipotent to the parent compound and is relevant to monitor in addition to the parent compound. Although meeting the 20% validation criterion for carryover, abemaciclib and abemaciclib-M2 showed moderate carryover that will be monitored closely during analytical runs. Due to the lack of available reference standards, the major metabolites of palbociclib (e.g., M16) and ribociclib (e.g., M4) were not included in this assay. However, this limitation could be addressed by monitoring virtual parent-product ion transitions based on the expected fragmentation patterns of ribociclib and palbociclib.23,24 This strategy will be applied to the ongoing pharmacogenetic study (BDR-122719).
CONCLUSIONS
We successfully developed and validated a sensitive LC-MS/MS assay for the simultaneous quantitation of palbociclib, ribociclib, abemaciclib, and abemaciclib-M2 in human plasma. The assay requires only 50 μL of plasma sample, which is subjected to a simple protein precipitation step before measuring the analytes in the supernatant. The assay can accurately and precisely measure all analytes over a wide concentration range, from 5 to 2000 ng/mL within 9.5 min. Clinical applicability was demonstrated by measuring real-life plasma samples from patients treated with CDK4/6 inhibitors. Incurred sample reanalysis indicated that the analyte concentrations measured in the study samples were reproducible. In summary, the assay described herein is suitable for TDM and clinical studies that require pharmacokinetic analysis of CDK4/6 inhibitors.
Supplementary Material
Acknowledgments
This work was supported by a Developmental Therapeutics Grant from the Roswell Park Alliance Foundation and by the National Cancer Institute (NCI) grant P30CA016056, involving the use of the Roswell Park Comprehensive Cancer Center’s Bioanalytics, Metabolomics, and Pharmacokinetics Shared Resource and Scientific Editing and Research Communications Core Resource.
Footnotes
Conflicts of Interest
All authors declare that they have no conflicts of interest.
References
- 1.Burstein HJ, Somerfield MR, Barton DL, et al. Endocrine treatment and targeted therapy for hormone receptor-positive, human epidermal growth factor receptor 2-negative metastatic breast cancer: ASCO guideline update. J Clin Oncol. 2021;39(35):3959–3977. [DOI] [PMC free article] [PubMed] [Google Scholar]
- 2.Choi YJ, Anders L. Signaling through cyclin D-dependent kinases. Oncogene. 2014;33(15):1890–1903. [DOI] [PubMed] [Google Scholar]
- 3.Finn RS, Martin M, Rugo HS, et al. Palbociclib and letrozole in advanced breast cancer. N Engl J Med. 2016;375(20):1925–1936. [DOI] [PubMed] [Google Scholar]
- 4.Turner NC, Slamon DJ, Ro J, et al. Overall survival with palbociclib and fulvestrant in advanced breast cancer. N Engl J Med. 2018;379(20):1926–1936. [DOI] [PubMed] [Google Scholar]
- 5.Hortobagyi GN, Stemmer SM, Burris HA, et al. Updated results from MONALEESA-2, a phase III trial of first-line ribociclib plus letrozole versus placebo plus letrozole in hormone receptor-positive, HER2-negative advanced breast cancer. Ann Oncol. 2018;29(7):1541–1547. [DOI] [PubMed] [Google Scholar]
- 6.Goetz MP, Toi M, Campone M, et al. MONARCH 3: abemaciclib as initial therapy for advanced breast cancer. J Clin Oncol. 2017;35(32):3638–3646. [DOI] [PubMed] [Google Scholar]
- 7.Center for Drug Evaluation and Research, US Food and Drug Administration. Clinical Pharmacology and Biopharmaceutics Review(s) Palbociclib [website] Submitted 2014. Available at: https://www.accessdata.fda.gov/drugsatfda_docs/nda/2015/207103Orig1s000ClinPharmR.pdf. Accessed Oct 12, 2022.
- 8.Center for Drug Evaluation and Research, US Food and Drug Administration. Clinical Pharmacology and Biopharmaceutics Review Ribociclib [website] Submitted 2016. Available at: https://www.accessdata.fda.gov/drugsatfda_docs/nda/2017/209092Orig1s000MultidisciplineR.pdf. Accessed Oct 12, 2022.
- 9.Center for Drug Evaluation and Research, US Food and Drug Administration. Multi-Discipline Review Abemaciclib [website] Submitted 2017. Available at: https://www.accessdata.fda.gov/drugsatfda_docs/nda/2017/208716Orig1s000MultidisciplineR.pdf. Accessed Oct 12, 2022.
- 10.Groenland SL, van Eerden RAG, Westerdijk K, et al. Therapeutic drug monitoring-based precision dosing of oral targeted therapies in oncology: a prospective multicenter study. Ann Oncol. 2022;33(10):1071–1082. [DOI] [PubMed] [Google Scholar]
- 11.Roušarová J, Šíma M, Slanař O. Therapeutic drug monitoring of protein kinase inhibitors in breast cancer patients. Prague Med Rep. 2021;122(4):243–256. [DOI] [PubMed] [Google Scholar]
- 12.Iwata H, Umeyama Y, Liu Y, et al. Evaluation of the association of polymorphisms with palbociclib-induced neutropenia: pharmacogenetic analysis of PALOMA-2/-3. Oncologist. 2021;26(7):e1143–e1155. [DOI] [PMC free article] [PubMed] [Google Scholar]
- 13.Jolibois J, Schmitt A, Royer B. A simple and fast LC-MS/MS method for the routine measurement of cabozantinib, olaparib, palbociclib, pazopanib, sorafenib, sunitinib and its main active metabolite in human plasma. J Chromatogr B Analyt Technol Biomed Life Sci. Nov 2019;1132:121844. [DOI] [PubMed] [Google Scholar]
- 14.Martínez-Chávez A, Rosing H, Hillebrand M, Tibben M, Schinkel AH, Beijnen JH. Development and validation of a bioanalytical method for the quantification of the CDK4/6 inhibitors abemaciclib, palbociclib, and ribociclib in human and mouse matrices using liquid chromatography-tandem mass spectrometry. Anal Bioanal Chem. 2019;411(20):5331–5345. [DOI] [PMC free article] [PubMed] [Google Scholar]
- 15.Janssen JM, de Vries N, Venekamp N, Rosing H, Huitema ADR, Beijnen JH. Development and validation of a liquid chromatography-tandem mass spectrometry assay for nine oral anticancer drugs in human plasma. J Pharm Biomed Anal. Sep 2019;174:561–566. [DOI] [PubMed] [Google Scholar]
- 16.Bao X, Wu J, Sanai N, Li J. Determination of total and unbound ribociclib in human plasma and brain tumor tissues using liquid chromatography coupled with tandem mass spectrometry. J Pharm Biomed Anal. Mar 2019;166:197–204. [DOI] [PMC free article] [PubMed] [Google Scholar]
- 17.Posocco B, Buzzo M, Poetto AS, et al. Simultaneous quantification of palbociclib, ribociclib and letrozole in human plasma by a new LC-MS/MS method for clinical application. PLoS One. 2020;15(2):e0228822. [DOI] [PMC free article] [PubMed] [Google Scholar]
- 18.Turković L, Bočkor L, Ekpenyong O, et al. Development and validation of a novel LC-MS/MS method for the simultaneous determination of abemaciclib, palbociclib, ribociclib, anastrozole, letrozole, and fulvestrant in plasma samples: a prerequisite for personalized breast cancer treatment. Pharmaceuticals (Basel). 2022;15(5):614. [DOI] [PMC free article] [PubMed] [Google Scholar]
- 19.US Food and Drug Administration. Bioanalytical Method Validation - Guidance for Industry [website] 2018. Available at: https://www.fda.gov/files/drugs/published/Bioanalytical-Method-Validation-Guidance-for-Industry.pdf. Accessed Oct 12, 2022.
- 20.Rosing H, Man WY, Doyle E, Bult A, Beijnen JH. Bioanalytical liquid chromatographic method validation. A review of current practices and procedures Journal of Liquid Chromatography & Related Technologies. 2000;23(3):329–354. [Google Scholar]
- 21.European Medicines Agency. Guideline on bioanalytical method validation [website] 2011. Available at: https://www.ema.europa.eu/en/documents/scientific-guideline/guideline-bioanalytical-method-validation_en.pdf. Accessed Oct 9, 2022. [DOI] [PubMed]
- 22.Sato Y, Shigeta K, Hirasawa T, et al. Establishment of an analytical method for simultaneous quantitation of CDK4/6 inhibitors, aromatase inhibitors, and an estrogen receptor antagonist in human plasma using LC-ESI-MS/MS. J Chromatogr B Analyt Technol Biomed Life Sci. Mar 2021;1173:122655. [DOI] [PubMed] [Google Scholar]
- 23.Liu N, Liu H, Zhang W, Yao H. Metabolic profiles of ribociclib in rat and human liver microsomes using liquid chromatography combined with electrospray ionization high-resolution mass spectrometry. Biomed Chromatogr. 2020;34(3):e4783. [DOI] [PubMed] [Google Scholar]
- 24.Yao J, Jiang X, Liu Q, et al. An available strategy based on accurate mass by ultra high performance liquid chromatography coupled to Fourier transform ion cyclotron resonance mass spectrometry technology to characterization of metabolic profile of palbociclib in rat urine, feces and bile. J Chromatogr B Analyt Technol Biomed Life Sci. Aug 2019;1124:37–46. [DOI] [PubMed] [Google Scholar]
Associated Data
This section collects any data citations, data availability statements, or supplementary materials included in this article.