Abstract
Purpose:
The main goal of this work is to describe a phantom design, data acquisition and data analysis methodology enabling comparison of small lesion detectability between PET imaging systems and reconstruction algorithms. Several methods are currently available to characterize intrinsic and image quality performance, but none focus exclusively on small lesion detectability.
Methods:
We previously developed a small-lesion detection phantom and described initial results using a head-size phantom [1]. Unlike most fillable nuclear medicine phantoms, this phantom offers a semi-realistic heterogenous background and wall-less contrast features. In this work, the methodology is extended to include a) the use of both head- and body- sized phantoms and b) a multi-scan data collection and analysis method. We present an example use case of the phantom and detection estimation methodology, comparing the small-lesion detection performance across four commercial PET/CT systems.
Results:
Repeat acquisitions of the phantom enabled estimation of model observer performance and surrogates of detectability. As anticipated, estimated detectability increased with the square root of system sensitivity and TOF offered marked improvement in detectability, especially for the body sized object. The proposed approach characterizing detectability at different times during the decay of the phantom enabled comparison of small lesion detectability at matched activity concentrations (and scan durations) across different scanners.
Conclusion:
The proposed approach offers a reproducible tool for evaluating relative tradeoffs of system performance on small lesion detectability.
Keywords: image quality, positron emission tomography (PET), detection
Introduction
In oncological imaging using positron emission tomography (PET), a common clinical goal is to detect cancer or to determine if an existing cancer has spread to other locations. For modern PET/CT or PET/MR systems, the limit of tumor detectability is impacted by a complex combination of observer performance, system sensitivity, resolution, random and scatter coincidence fractions, and timing resolution, as well as patient- and scan-based factors including habitus, motion, injected activity, and scan duration. Data processing, including quantitative corrections and image reconstruction methods (and settings), can also play important roles in detection.
Fillable phantoms have played an important role in understanding these relationships. Early works with hot and cold rods phantoms [2], [3] led to understanding of high contrast feature separability with early tomographic imaging systems, and continue to be used in accreditation standards today (for instance the ACR PET methodology at https://www.acraccreditation.org/modalities/nuclear-medicine-and-pet). Extension of the analysis to include an automated, quantitative analysis of minimum detectable rod diameter based on the Rose criterion [4] has been done for the standard ACR phantom by DiFillipo [5]–[7] and using a low contrast version of the ACR phantom by Wollenweber [8]. Other phantoms using multiple fillable spheres and body-like geometries were investigated by Wilson [9] with the focus on signal-to-noise (SNR) as well as body size itself for time-of-flight (ToF) [10]. More complex measures, with multiple anthropomorphic phantoms including several contrast features have been used to compare lesion detectability, most extensively by Kadrmas et al. with comparisons between PET/CT systems [11], as a function of scan duration [12] and between reconstruction methods and settings [13], [14]. Simpler forms of this type of anthropomorphic phantom use have been adapted by the Society of Nuclear Medicine and Molecular Imaging (SNMMI) as the Clinical Trials Network (CTN) phantom [15]. An advantage of the CTN phantom is the ability to fill the phantom and contrast features as a single fill, as separate filling of multiple small contrast features is difficult and time consuming.
In this work, we extend a previously developed phantom, featuring a semi-realistic lumpy background and wall-less contrast features, to include a second body-size phantom that is applicable to evaluating whole-body hot-feature detection performance. We also extend the data acquisition, processing and analysis methods to enable comparison of small lesion detectability at matched scan durations and activity concentrations.
Methods
Details of the 12-sided, dodecahedral 3D printed nylon cages and the creation of concentration-based contrast features are described in [1]. These nylon cages serve as features that create voids in a background of 4mm random close-packed solid acrylic spheres. Nylon material is used as it is both CT and PET imaging ‘friendly’ with tissue-like attenuation. The nylon mesh is porous, so the cages form essentially wall-less contrast features as the inside fills at full concentration while the nearby background (between spheres) has less effective concentration. Actual feature contrast is determined experimentally as each phantom contained a separate 45 mm diameter by 25 mm long cylinder, with minimal to no partial volume error, with nylon screen mesh over the ends. The ratio of the mean within this large cylinder to that in a region containing only acrylic spheres serves as the reference contrast (see red box in Fig. 2).
Fig. 2.
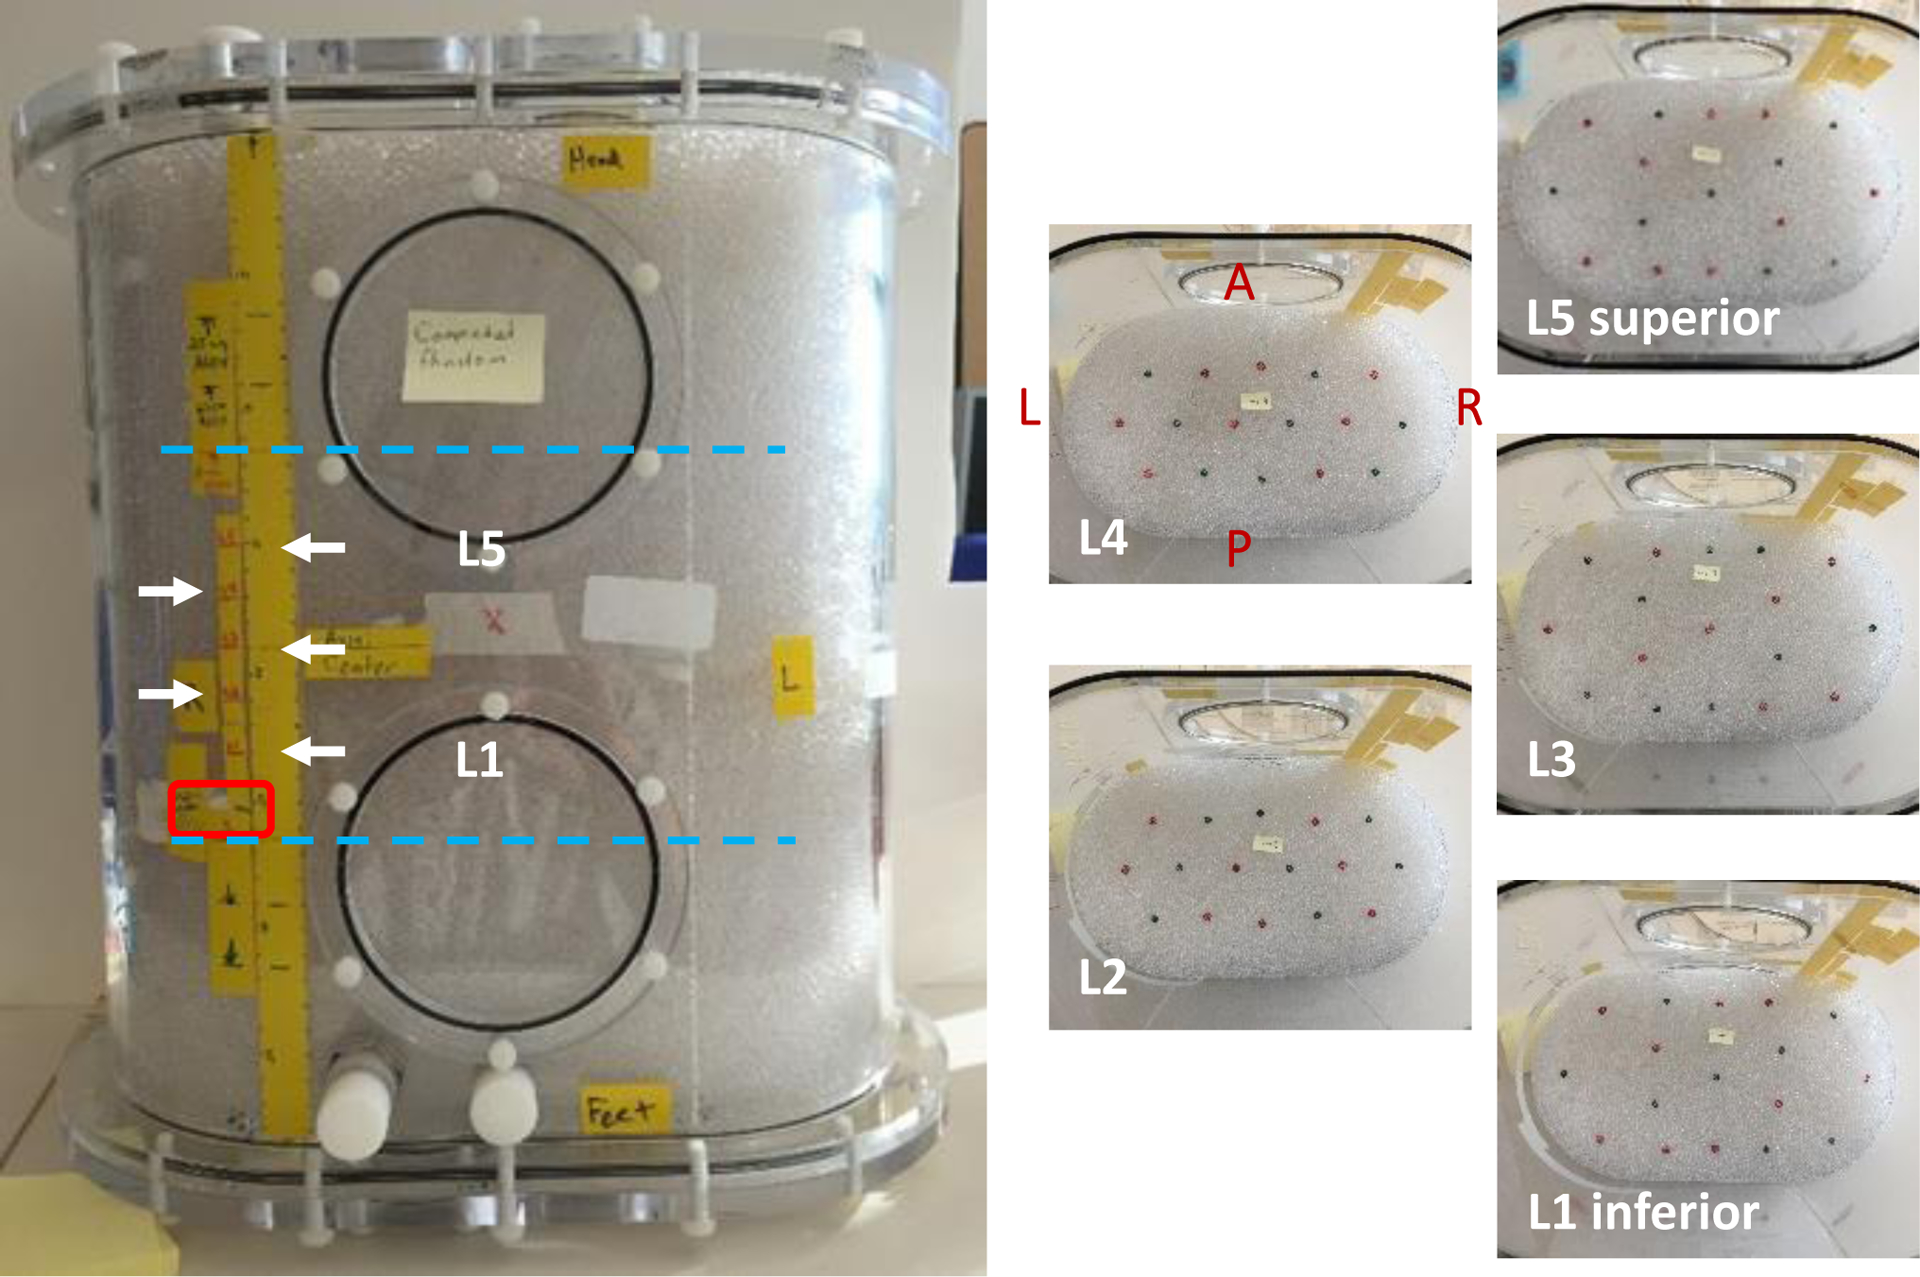
Body-size phantom with 5 layers containing a total of 83 features. Feature layers are indicated by white arrows; red box is the uniform cylinder; cyan lines indicate axial extent for 15cm (shortest) imaging FOV. Each layer contained roughly half 5 mm and half 6 mm features.
Phantom preparation.
Two phantoms were prepared for imaging – one a 20 cm diameter × 20 cm long cylinder (‘head-size’, Data Spectrum corporation flangeless Esser™ phantom, approx. 6.1 L volume) and one a 21 cm × 36 cm oval × 40 cm long (‘body-size’, Data Spectrum corporation Extended Oval™ phantom, approx. 24.9 L volume). In the head-size phantom, 7 evenly spaced co-planar layers of 4mm (face-to-face) dodecahedrons were used (Fig. 1). In the body-size phantom, 5 co-planar layers with 83 total features (41 of 5 mm, 42 of 6 mm) were used (Fig. 2). The feature layers were contained within the central 10 cm axially of each phantom. In the head-size phantom, feature layers alternated between having features placed at a radius of 5 or 7 cm from the phantom center and were evenly spaced about the central axis. In the body-size phantom, use of two feature sizes covered the possibility that the smaller size was too small thus producing too low of a detectability. Feature placement for both phantoms used a paperboard template with the intent of creating non-overlapping 4 × 4 cm axial sub-images centered on each feature.
Fig. 1.
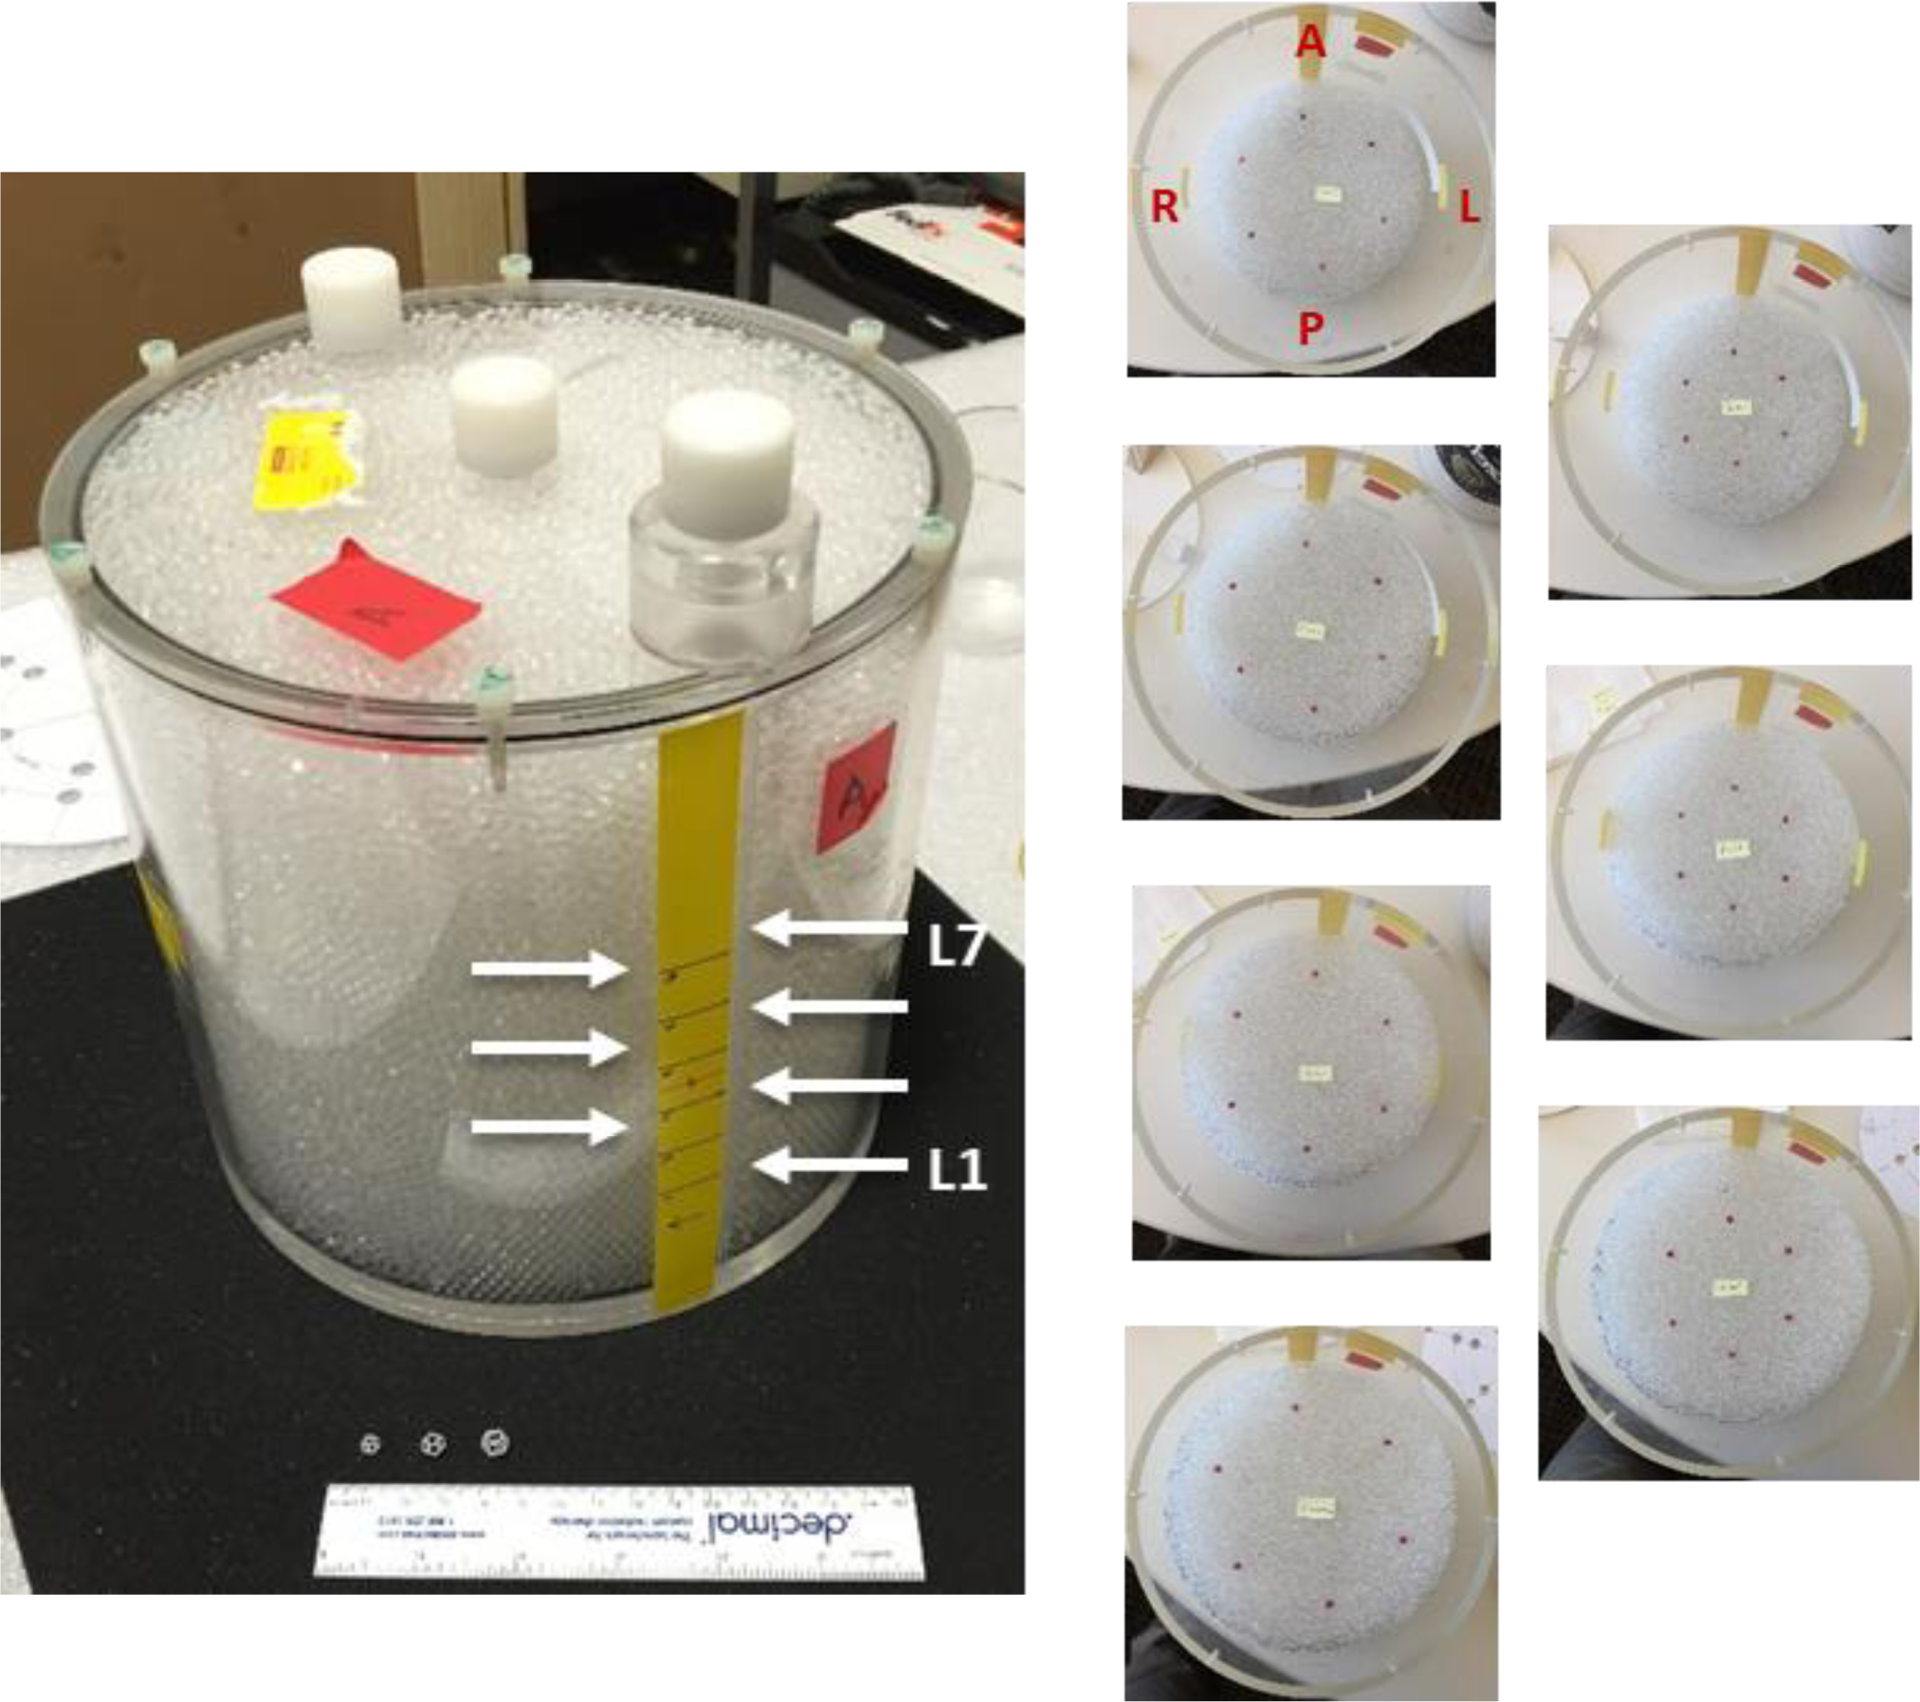
Head-size phantom with 7 layers of six 4 mm features/layer.
Each phantom required approximately 30 minutes to prepare prior to filling with a pre-mixed solution of deionized water, radionuclide, and approximately 1 g/L sodium bisulfate surfactant. The pre-mixed volume was approximately 3 and 12 liters for the head-size and body-size phantoms, respectively. The solution was slowly added to the prepared phantoms, taking approximately 5 minutes to fill the head-size phantom taking and 10 minutes for the larger body-size phantom.
Scanning.
Images from four PET/CT systems were compared using the phantoms and methodology on one GE Discovery MI-DR and three GE Discovery MI systems. System parameters are shown in Table 1. Prior to scanning, an imaging schedule was planned to meet the following requirements: (1) image each phantom twice per system, (2) scan durations adjusted to have matched decays per scan per phantom, (3) sufficient decays/scan to produce 4 sub-scans with sub-scan images leading to 0.6 < AUC < 0.9, and (4) early/late activity concentrations bracketing typical clinical values. These requirements were necessary to enable interpolation of detectability as a function of activity concentration and scan duration, leading to a comparison between systems/reconstructions at the same concentration and duration. The multiple scans per system also samples from each systems noise-equivalent count (NEC) curve, therefore taking into account differing system-specific random coincidence levels at the sampled activity concentrations. Overall, the scanning of both phantoms on all systems required approximately 4.5 hours from start to end.
Table 1.
PET/CT system configuration and performance parameters.
| Discovery MI | ||
|---|---|---|
| Scintillator dimensions (mm) | 4.2 × 6.3 × 25 | 4.0 × 5.3 × 25 |
| Timing resolution (ps) | 550 | 385 |
| Axial FOV (cm) | 15.7 | 15, 20, 25 |
| NEMA sensitivitiy (cps/kBq) | 7.5 | 7.5, 13.7, 21.7 |
| Transaxial resolution @ 1cm (mm) | 4.0 | 4.0 |
| Axial resolution @ 1cm (mm) | 5.0 | 4.8 |
Data generation.
List-mode data were used to generate four sub-scans per scan with equal decays/sub-scan. Four sub-scan data were also generated at 75%, 50% and 25% of the full-scan duration to allow interpolation of detectability as a function of duration at a given concentration. All scan data were reconstructed with 6 algorithms: (a) ordered-subset expectation-maximization (OSEM) [16], (b) OSEM with point spread function modelling (OSEM+PSF) [17], (c) block-subset regularized EM (BSREM) [18], (d) time-of-flight with OSEM (ToF-OSEM), (e) ToF-OSEM+PSF, (f) ToF-BSREM ([18] using time-of-flight). For Discovery MI-DR, reconstruction used 2 iterations, 24 subsets and 2.0 mm pixel size and 3.0 mm FWHM Gaussian post-filter for the head-size phantom and a 2.73 mm pixel size and 5.0 mm FWHM post-filter for the body-size phantom. For Discovery MI, iterations/subsets were 3/16 with all other parameters the same as the MI-DR. These iteration/subset combinations were selected to mirror typical clinical practice for head and body imaging and it was beyond the scope of this work to explore optimizing these settings. However, further non-ToF reconstructions using 4 and 6 iterations (MI-DR) and 6 and 9 iterations (MI) were generated to enable finding non-ToF detectability at the noise level matched to ToF for each phantom.
Analysis.
For each scan, contrast features were localized using PET and thin-slice CT images (0.625 mm). Axial sub-images of 4 × 4 cm from all sub-scan data were extracted centered at each feature – these became the ‘signal-present’ (SP) image data for the model observer. Matched signal-absent (SA) sub-images were found using the same locations offset axially by half the feature plane distance toward the end of the phantom. Example CT and PET axial images for localization are shown in Fig. 3. Since image data using 4 sub-scans per scan for each phantom were used, many sub-image pairs were available for the model observer. It is important to note that the rule of thumb [19], [20] for channelized Hotelling model observers (CHO) is to have the number of (SA/SP) image pairs an order of magnitude above the number of channels used – which was 3 for the CHO in this work.
Fig. 3.
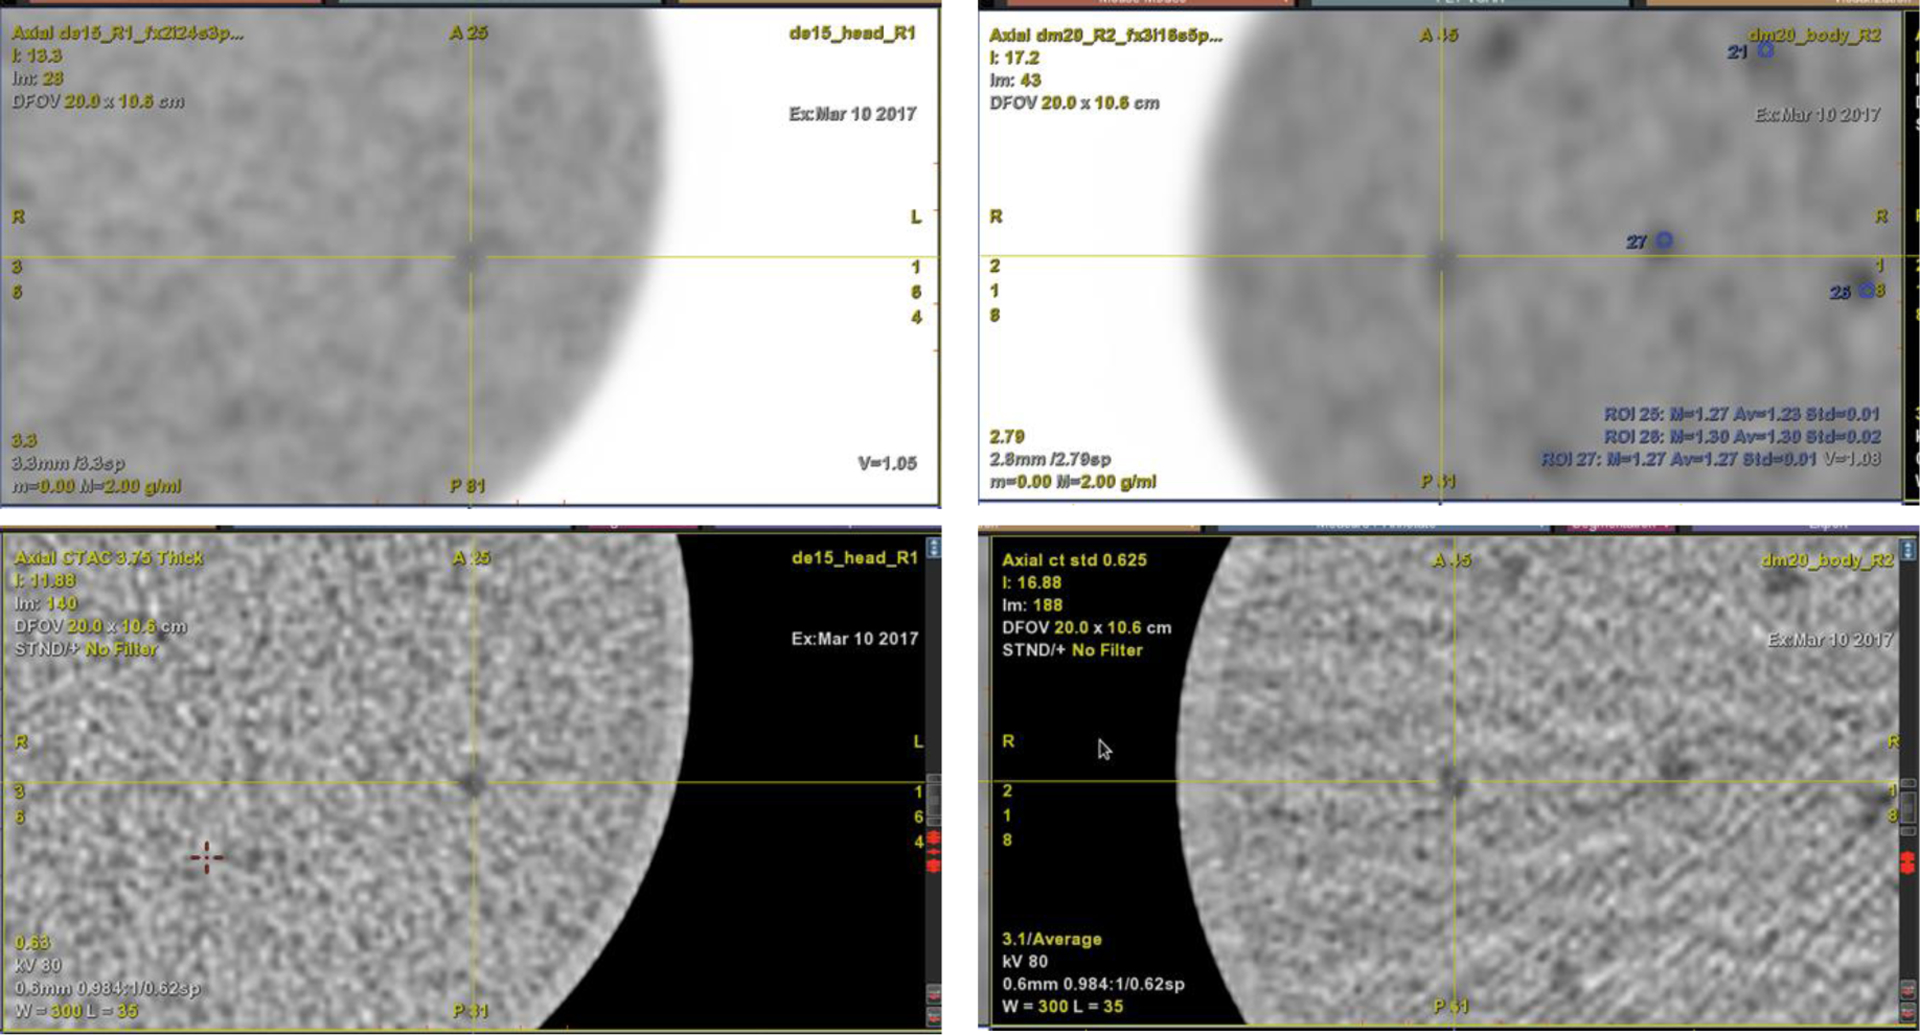
PET (top) and CT (bottom) images showing contrast features. Left: Head-size phantom. Right: Body-size phantom.
The sub-image data per parameter set P = (phantom {2x}, scan {2x}, sub-scan-type {4x}, reconstruction method {6x}) were then used as input to the MATLAB™-based IQmodelo code (https://github.com/DIDSR/IQmodelo). This code was used to apply a Channelized Hotelling observer (CHO) using 3 difference-of-Gaussian channels [21]. The AUC and 95% confidence interval were output from the code. From the AUC, the detectability index d’ (SNR) was computed [22]. Using the detectability from the 4 sub-scans at partial duration and for each system/reconstruction/scan, fit parameters for a logarithmic relationship of SNR versus scan duration was determined. Using that relationship and a fixed duration to compare across parameters, a linear function was fit to SNR versus the two average activities per phantom and system. Note that a logarithmic relationship could be used, but prior unpublished data from [1] with three scans showed minimal difference between the two function choices. Using next a fixed activity concentration to compare, this second relationship led to a SNR for each system/reconstruction/phantom at matched duration and activity concentration. For the body-size phantom, a plot of SNR versus image noise for OSEM+PSF and ToF-OSEM+PSF was made using the extra non-ToF iterations. A linear fit to the results for non-ToF enabled comparing ToF SNR gain at matched noise.
To demonstrate some the capability of the methodology, a bar chart for each phantom was made showing SNR, and 95% confidence interval error bars, as a function of system and reconstruction method at the same duration and activity concentration for all systems. A comparison of noise-matched −/+ ToF-OSEM+PSF was also performed using the body-size phantom reconstructed at further non-ToF iterative updates. Finally, plots of SNR versus system NEMA sensitivity/cm for the three MI systems (15, 20, 25) cm, all reconstruction methods and each phantom size were made.
Results
Sub-image panels from the first scan of the head-size phantom on the MI 25 cm system with signal-present and signal-absent are shown in Fig. 4. Feature visualization was similar in the body-size phantom. For the head-size phantom, only 41 of 42 features filled completely; for the body-size, only 82 of 83 filled. Aggregating the 4 sub-scans per scan for each phantom led to a total of 164 and 328 image pairs for the head-size and body-size phantoms, respectively. Since both the 5 mm and 6 mm features produced usable images (i.e. visible in some cases) in the body-size phantom, the sub-images from both sizes were pooled - object size was not a focus of this analysis. Using the small cylinder in each phantom, the measured feature contrast to background was 2.80 ± 0.07 and 2.73 ± 0.06 for the head-size phantom and body-size phantoms, respectively.
Fig. 4.
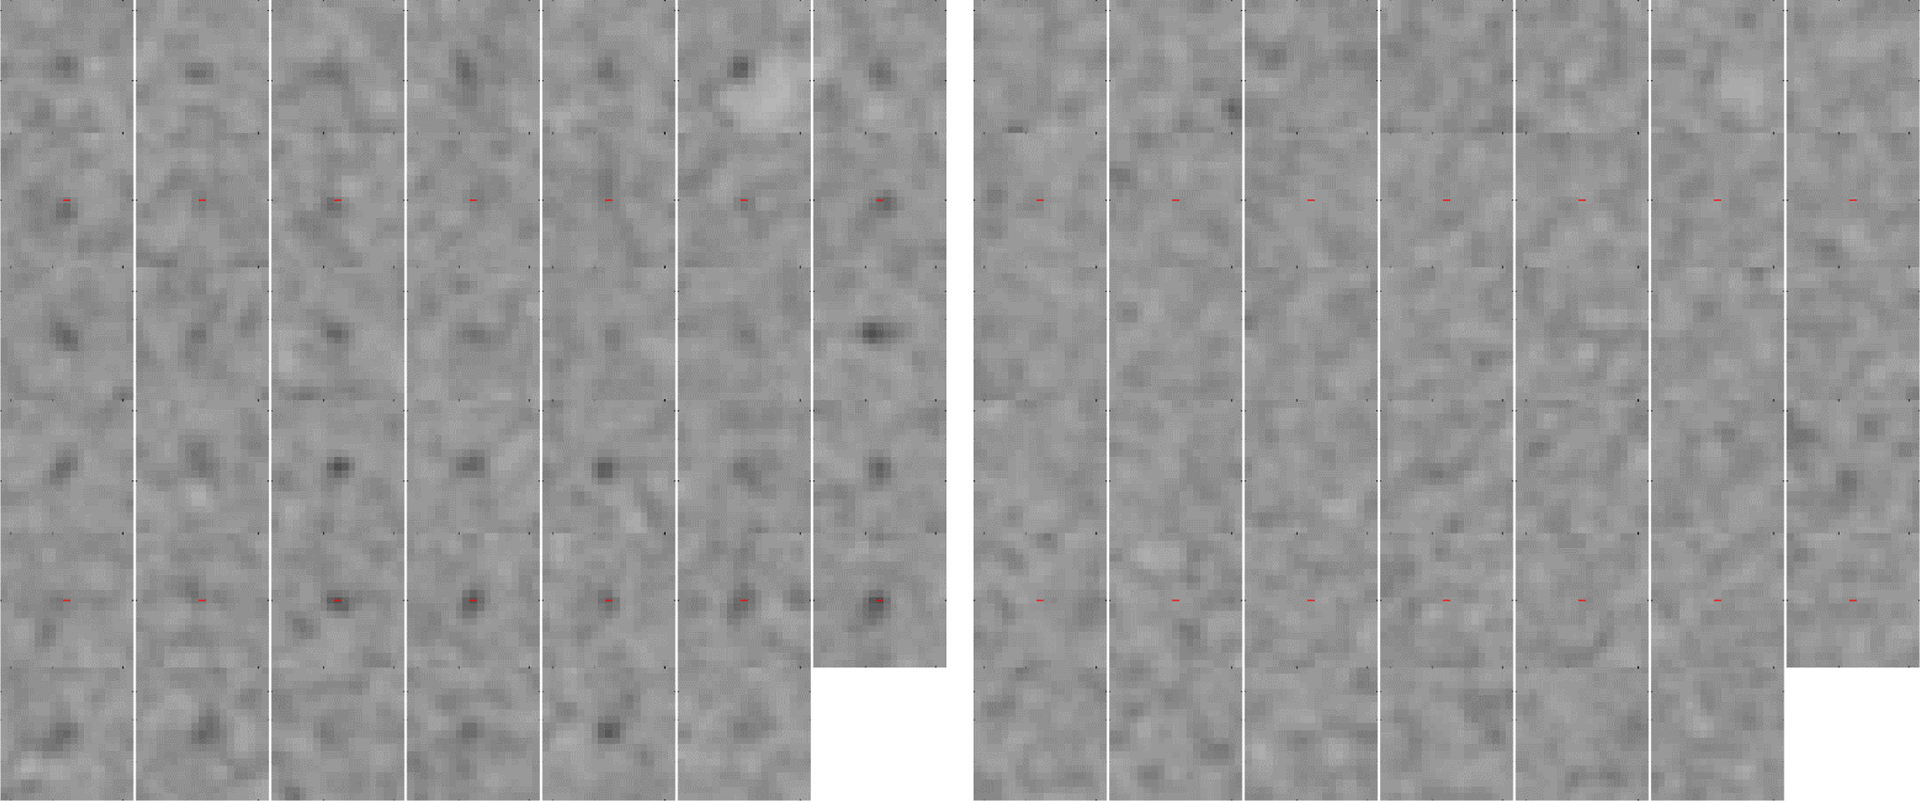
PET sub-images for the head-size phantom with 4 mm 2.8:1 contrast features from MI 25cm with (left) signal-present and (right) signal-absent.
Comparisons of SNR as a function of scanner and reconstruction method at a 2.5 minute scan duration and average activity concentration of 7.0 kBq/ml in the head-size phantom and average activity concentration of 4.0 kBq/ml in the body-size phantom are shown in Fig. 5 and Fig. 6, respectively. An example plot of the body-size phantom results showing SNR versus image noise and using the additional non-ToF OSEM+PSF reconstructions at higher number of iterative updates is shown in Fig. 7. The noise-matched observer SNR between non-ToF and with-ToF are indicated by vertical arrows.
Fig. 5.
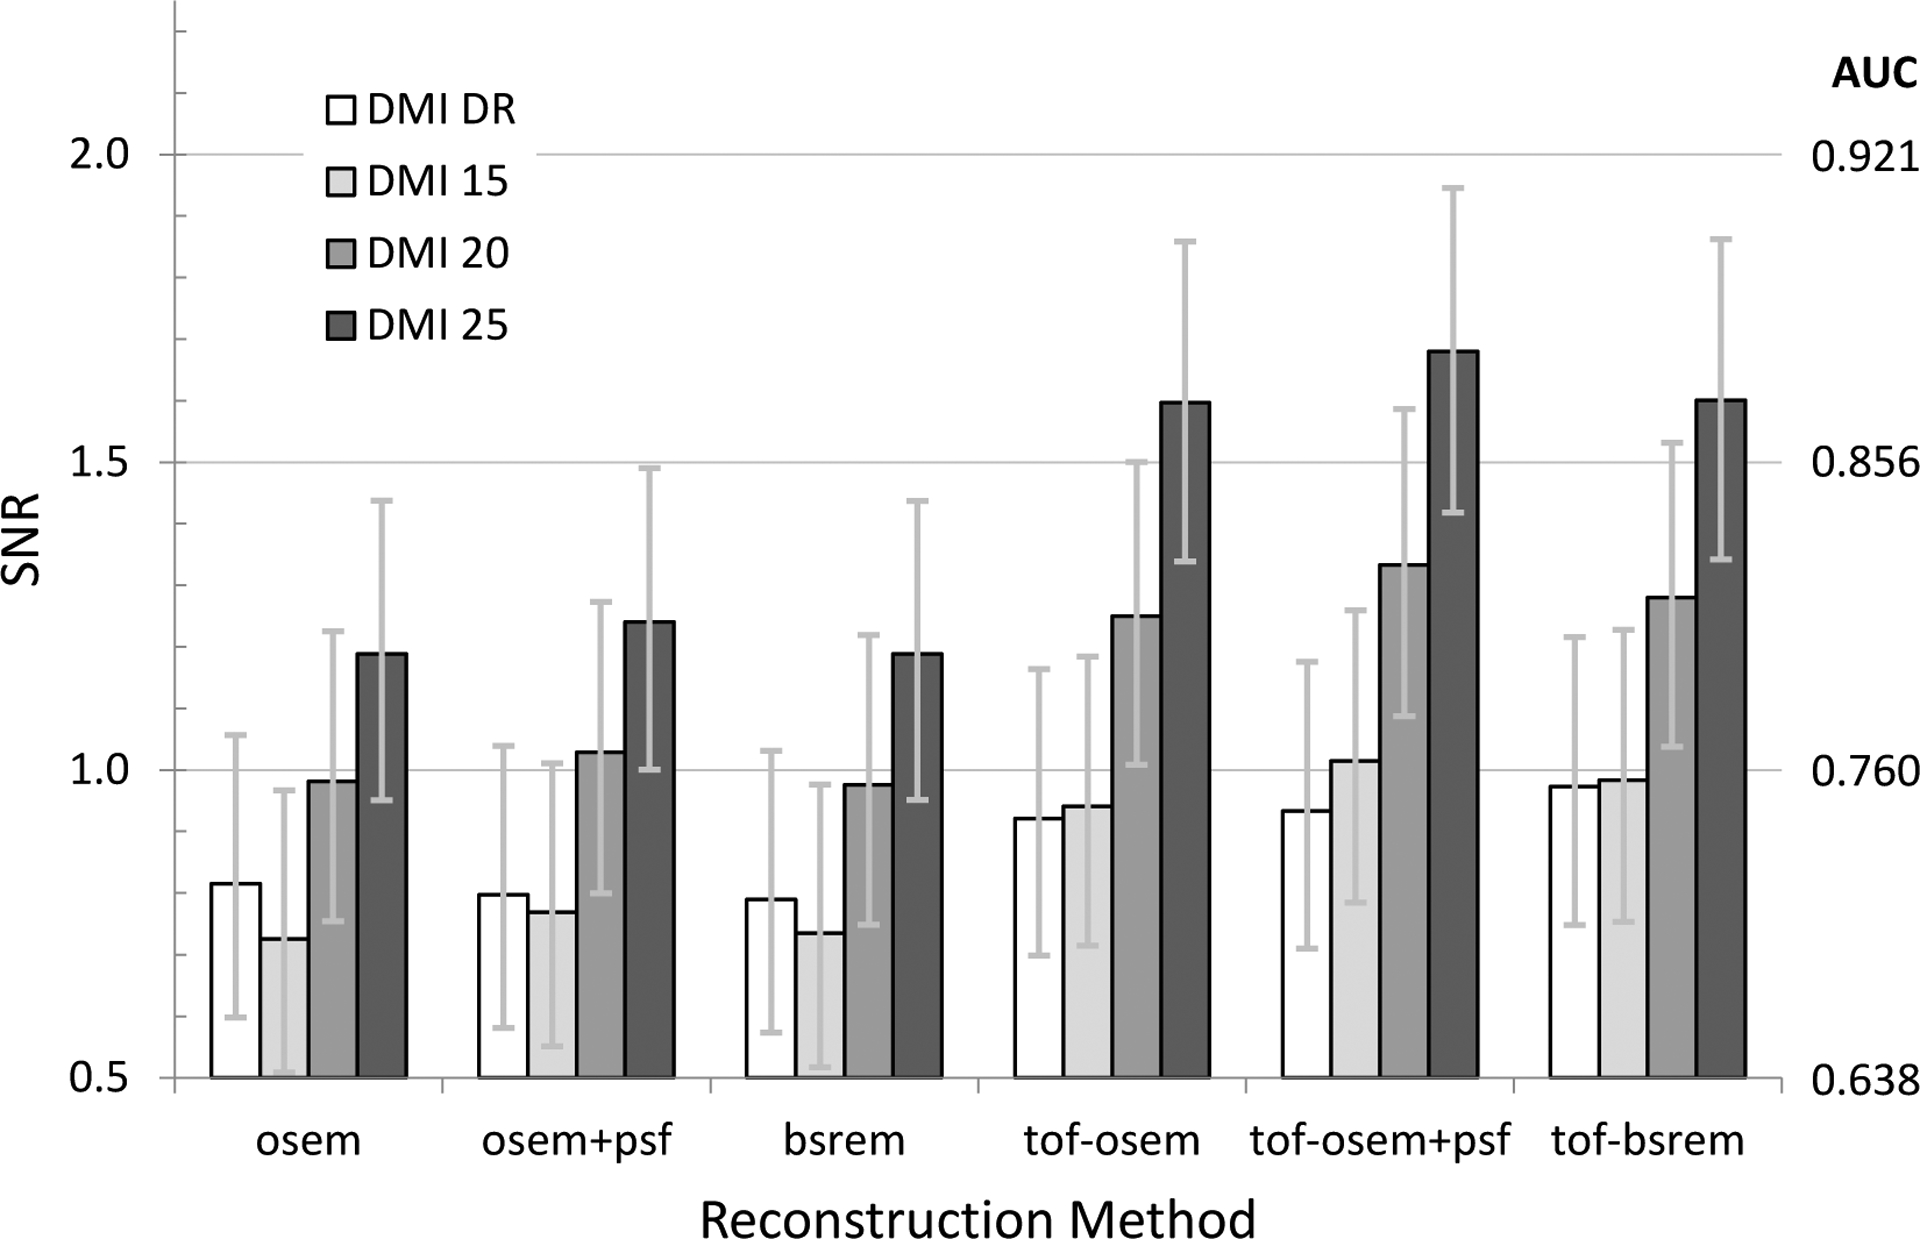
Plot of SNR as a function of reconstruction method for all DMI scanners using the head-size phantom, a 2.5-minute scan duration and 7.0 kBq/mL average activity concentration.
Fig. 6.
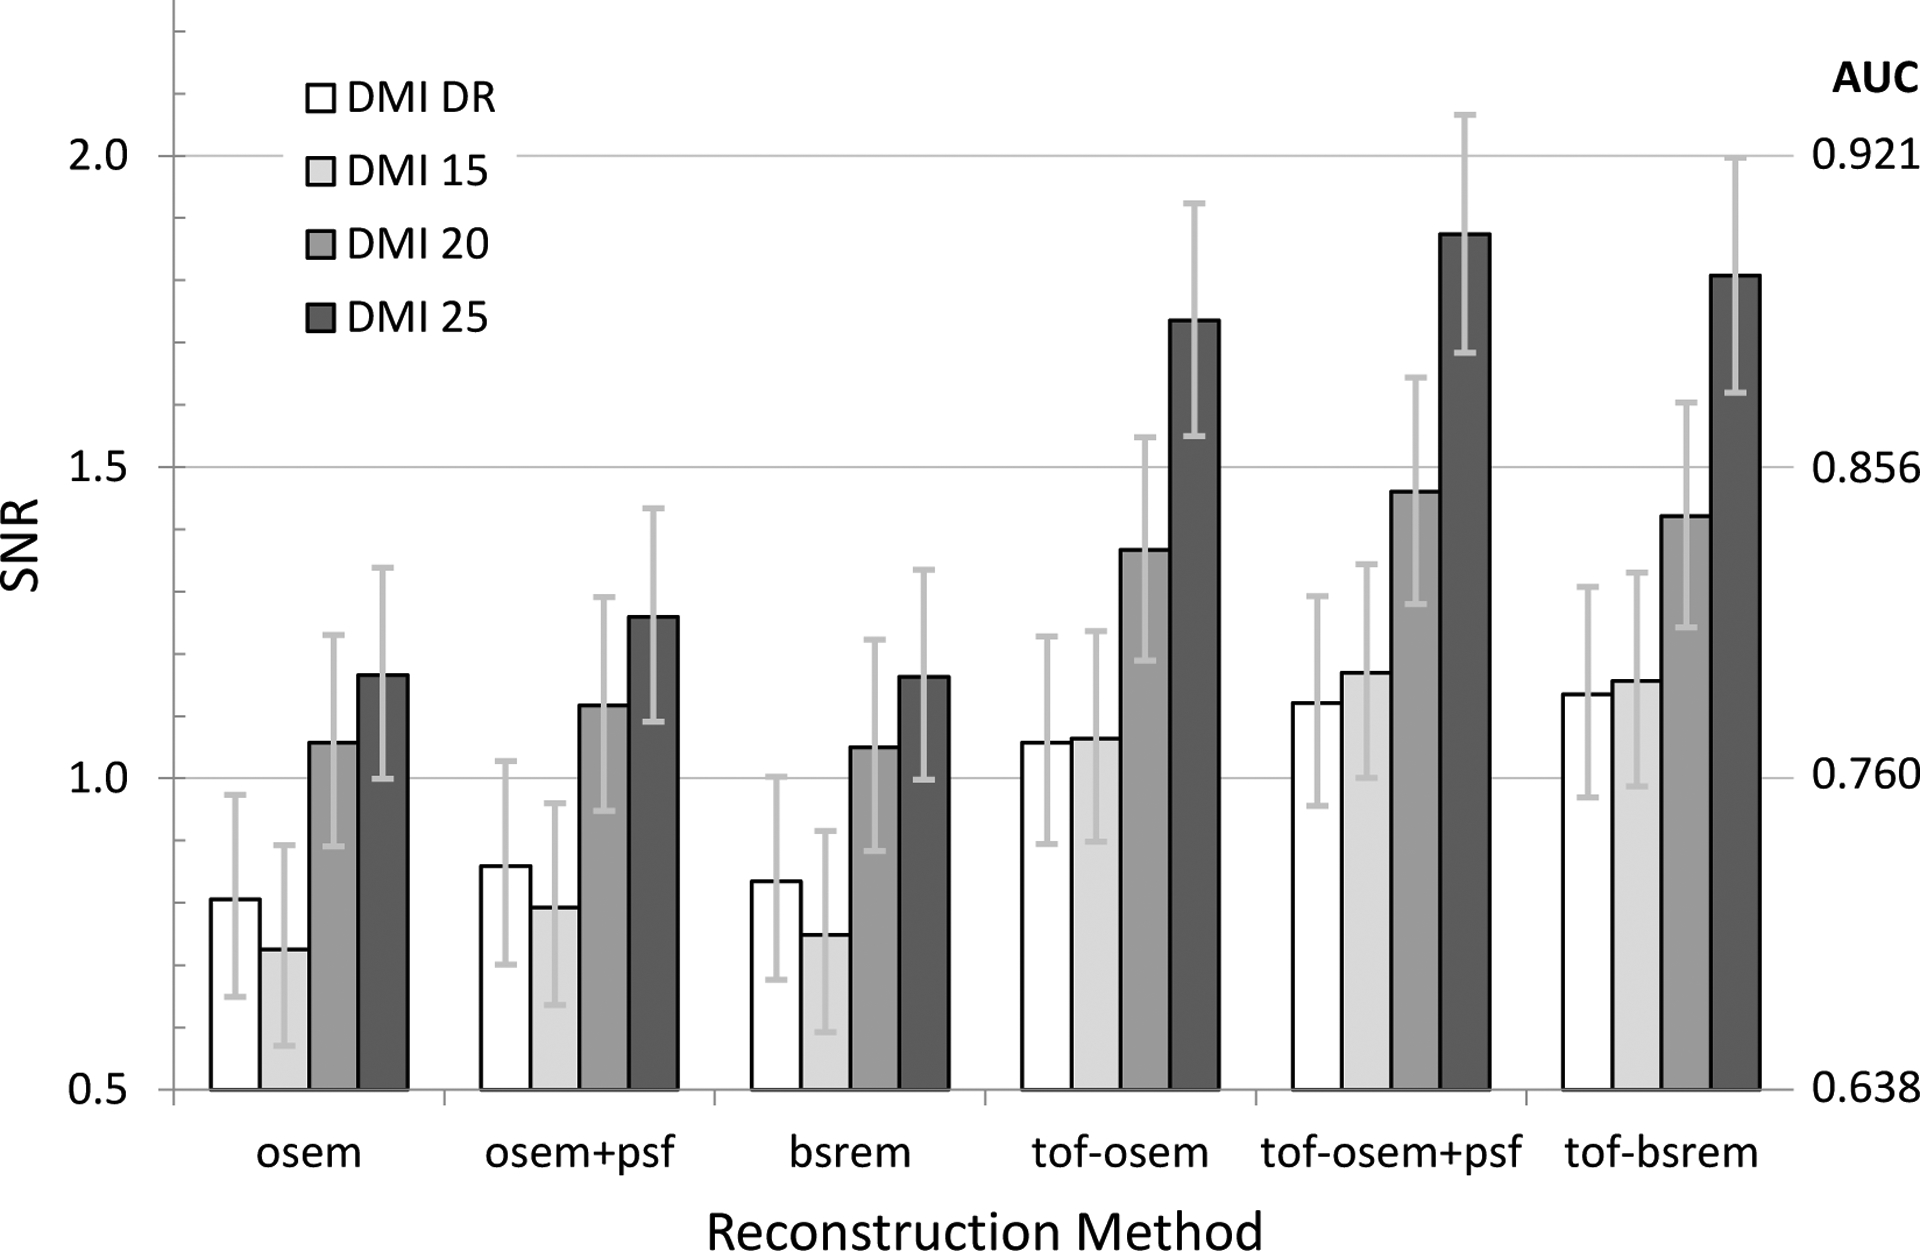
Plot of SNR as a function of reconstruction method for all DMI scanners using the body-size phantom, a 2.5-minute scan duration and 4.0 kBq/mL average activity concentration.
Fig. 7.
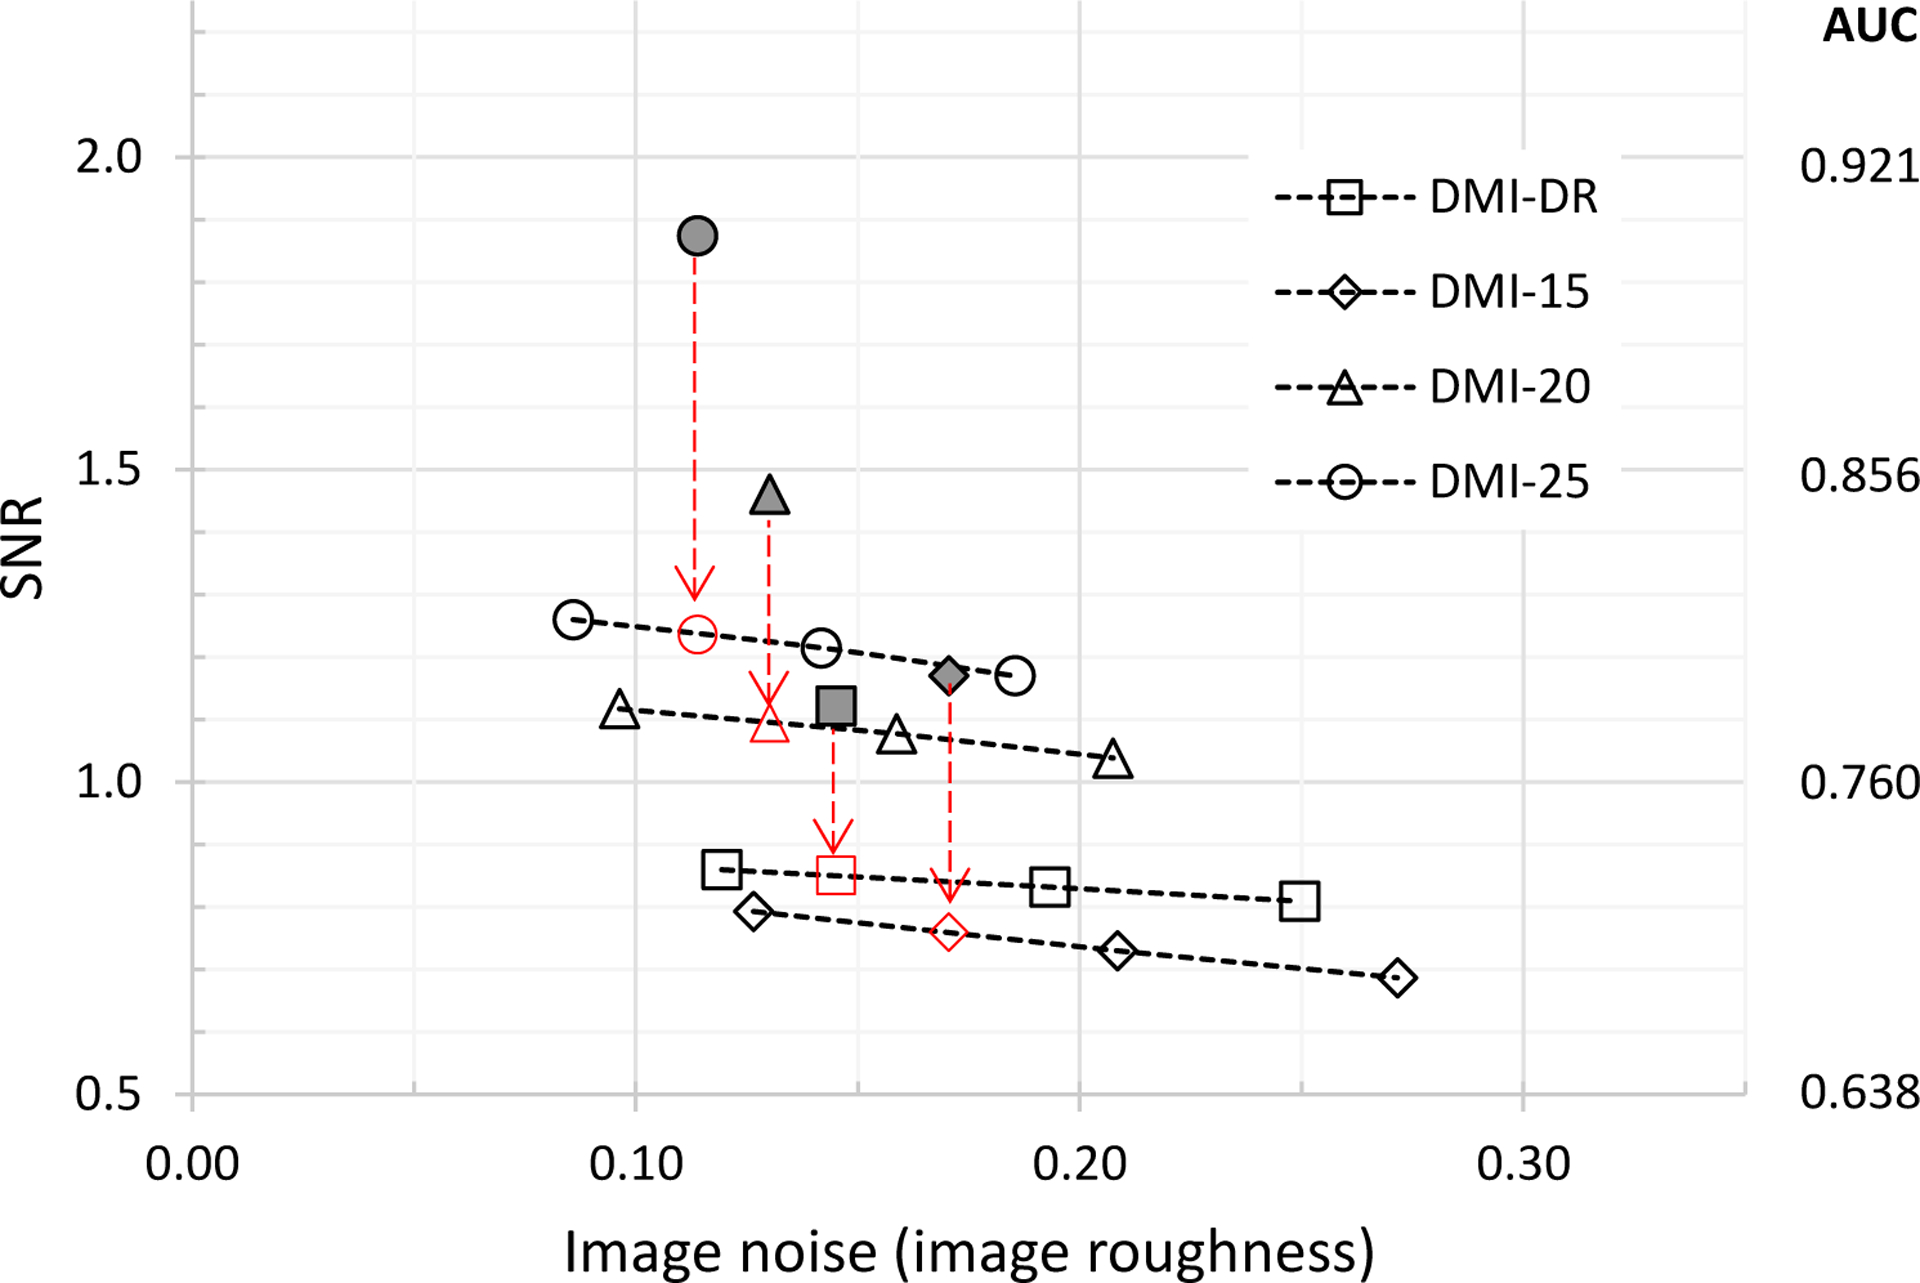
Plot of SNR versus noise for the body-size phantom and OSEM+PSF reconstruction without and with ToF. Dark datapoints are with-ToF reconstruction, open datapoints are non-ToF. Non-ToF SNR at matched noise are indicated by vertical arrows.
Fig. 8 and Fig. 9 compare the observer SNR as a function of system NEMA sensitivity per length for the head-size and body-size phantoms. Example linear fits to OSEM and ToF-OSEM demonstrates that detectability increases with the square root of sensitivity for both phantoms, independent of reconstruction methods. The ratio of the with-ToF OSEM to non-ToF OSEM linear fit slope was 1.42 for the head-size phantom and 1.52 for the body-size phantom, demonstrating more ToF observer SNR gain for the body-size phantom.
Fig. 8.
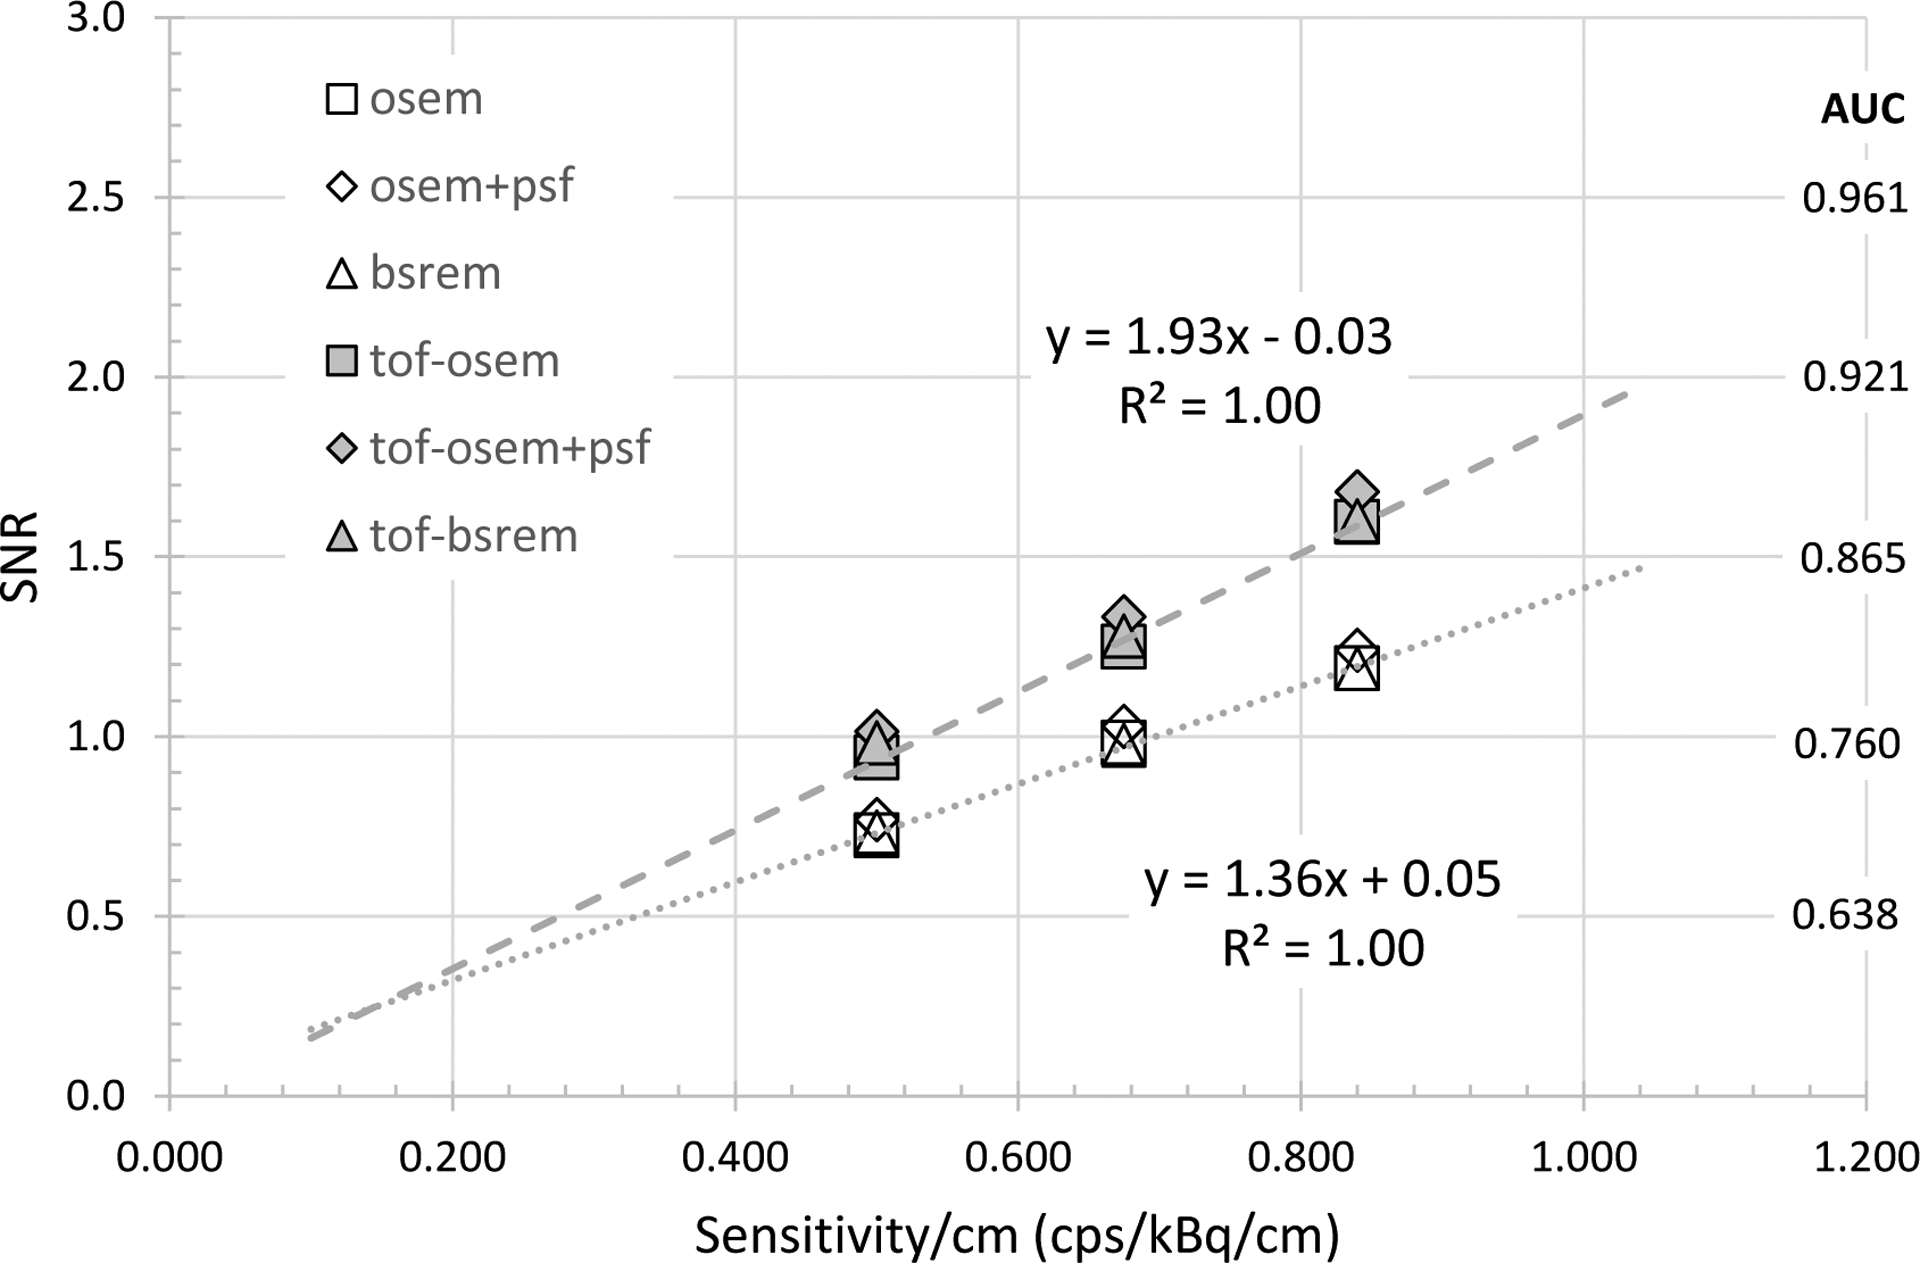
Plot of observer SNR as a function of sensitivity/cm using three MI configurations (15, 20, 25) cm for the head-size phantom. Linear fits are shown for OSEM and ToF-OSEM series.
Fig. 9.
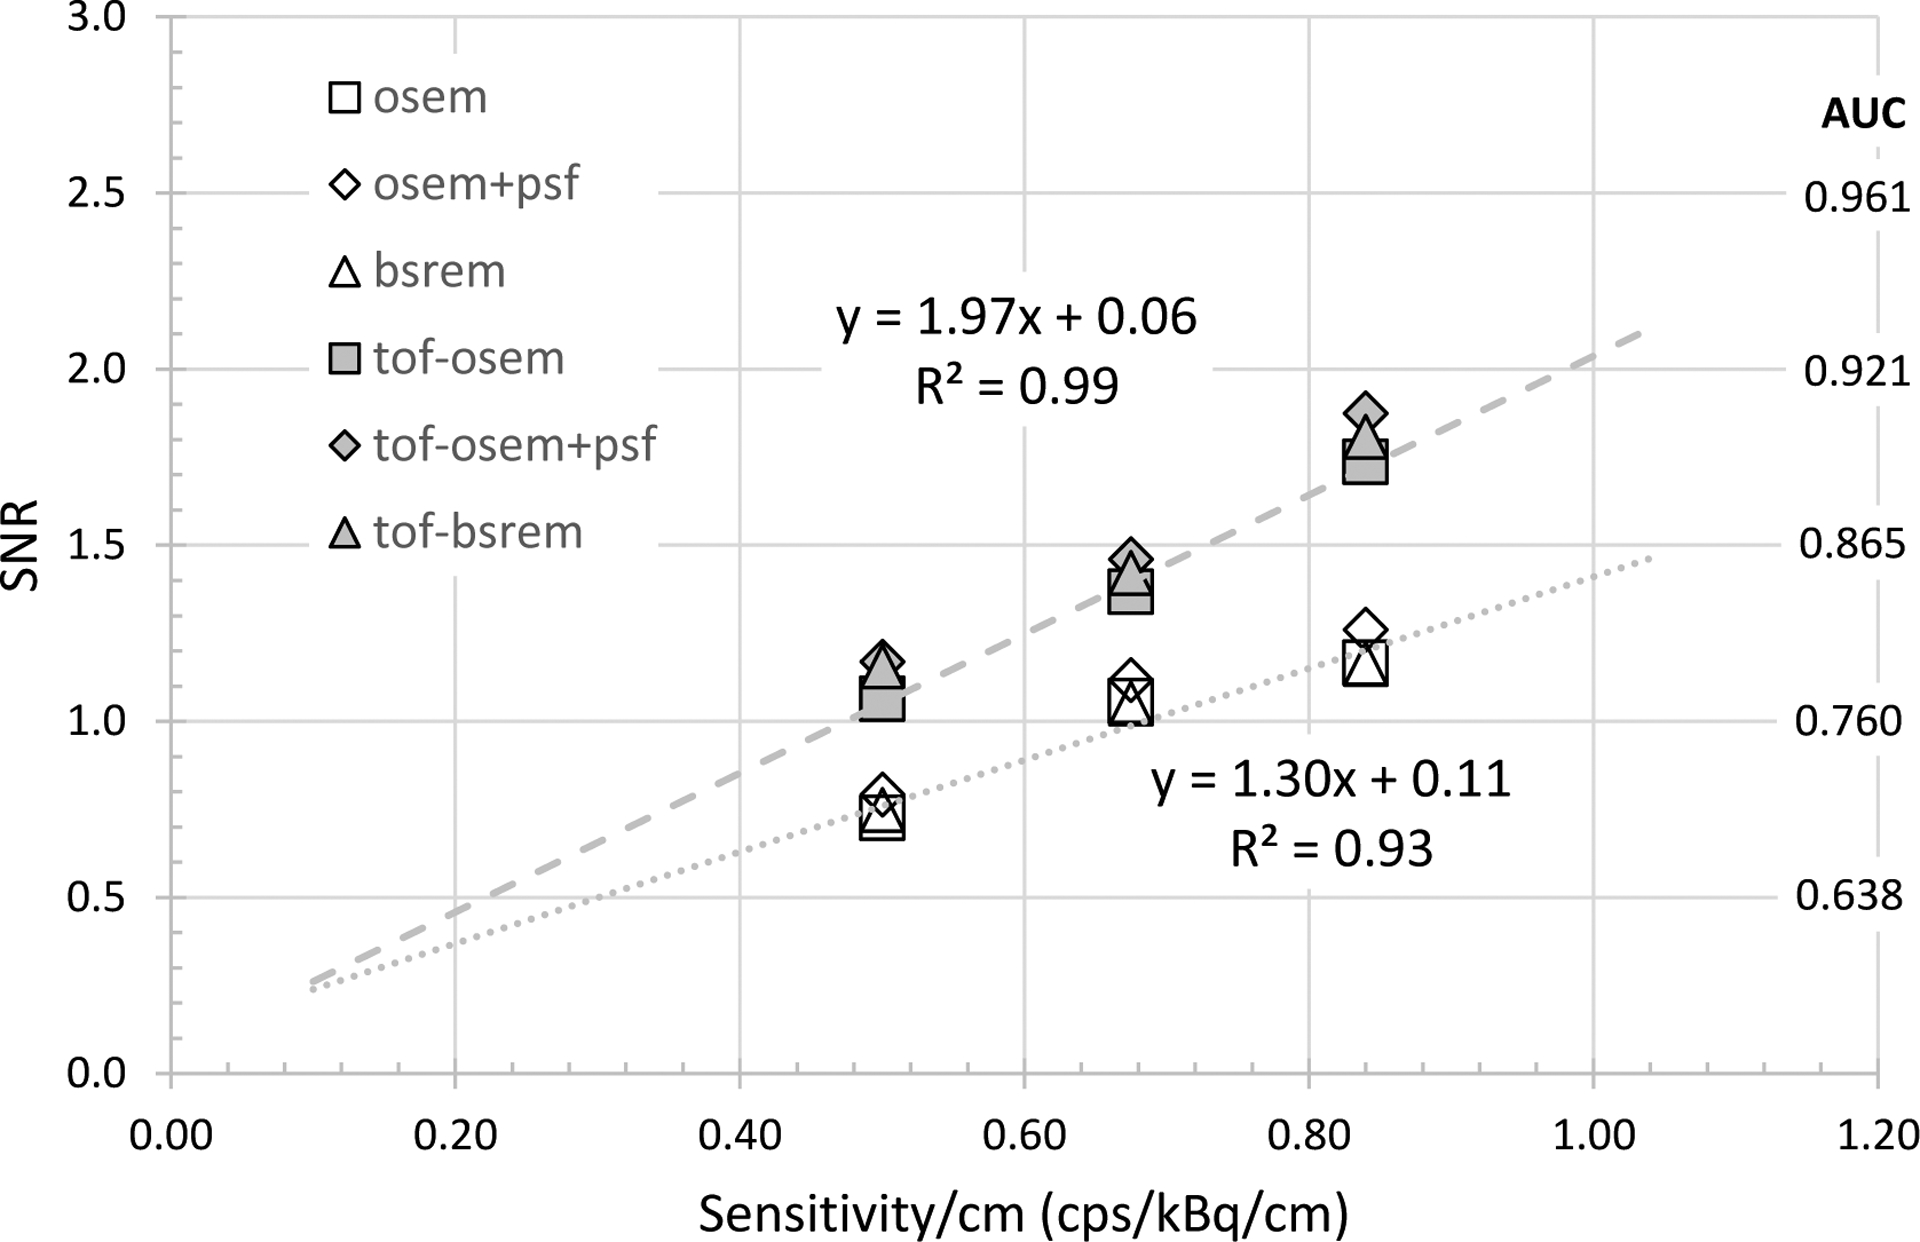
Plot of observer SNR as a function of sensitivity/cm using three MI configurations (15, 20, 25) cm for the body-size phantom. Power-law fits are shown for OSEM and ToF-OSEM series.
Discussion
Many imaging sites utilize multiple PET systems and are interested in understanding the comparative detection capability of the systems as well as how to optimize them for better performance. Further, multi-center comparison of detection performance may be beneficial for other purposes such as clinical trials. The current work demonstrates a flexible phantom design as well as scanning and analysis approach enabling comparison of system and reconstruction settings. It could also effectively be used in a multi-site setting as the phantom is easily emptied, stored and re-generated. It is not critical that the components be exactly in the same placement – future work may include auto-localization of features in each scan using both CT and PET.
Subdivision of list-mode data enables statistically independent replication of scans to boost the number of SA/SP image pairs to make an effective measurement of SNR. It was an important component of this work to cover activity levels, count rates and scan durations that emulated clinical imaging conditions – i.e. not at the high end of scanner capability but rather realistic to clinical oncology imaging with current systems. Earlier ranging studies helped guide the correct combination of size, contrast, and duration to produce clinically relevant scanning conditions for SNR comparison, with results equivalent to an AUC between roughly 0.7 – 0.9.
Since the phantoms cannot be imaged on all systems at the same time and at identical scanning conditions, the proposed analysis permits evaluation at matched scan duration and activity concentration between systems. This analysis requires imaging at two time points during the decay of the phantom enabling interpolation of SNR as a function of detected count levels/noise.
The results comparing SNR as a function of system and reconstruction in Fig. 5 and Fig. 6 demonstrate how ToF improves SNR, more so for body-size than head-size, as well as differences between system sensitivity and algorithm evolution. For instance, the DMI-DR (white) and 15 cm DMI (light gray) are substantially similar, with the DMI being newer and including evolution in quantitative correction algorithms. However, the non-ToF MI SNR is slightly lower than MI-DR, but as the MI timing resolution is improved over MI-DR, the ToF reconstruction shows an increase over MI-DR. For the clinical reconstruction settings applied here, the OSEM, OSEM+PSF, and BSREM methods applied to the same data yielded similar SNR, although we should stress that reconstruction settings were not optimized in this study. Likewise, the SNR in these two charts are only meant to be demonstrative in that no attempt is made to explore the interaction between iterations/subsets or regularization for BSREM. Further, it is known that adding PSF further impacts noise versus contrast recovery and therefore requires a different number of iterative updates to reach the same noise level (as measured by standard deviation, for instance). This is an interesting area to explore for future efforts.
It more difficult to interpret the results in Fig. 7 and whether a comparison at matched image ‘noise’ makes sense. We speculate that this comparison may become more enlightening at matched background variability rather than noise measured as standard deviation in an ROI – a discussion of PET image measures of noise is further explored in [23]. We further recognize that with the reconstruction methods and settings used for this demonstration, we are not optimizing the detection task. Future efforts may further explore the combination of feature size, contrast, location and enclosing object size.
Finally, the results of Fig. 8 and Fig. 9 show the expected trend that SNR follows as the square root of system sensitivity. It was beyond the scope of this work to investigate further the further impacts of scanning protocol (initial dose and scan duration) or reconstruction settings such as pixel size, image updates (combination of iterations and subsets) or the regularization for BSREM reconstruction. When investigating such parameters, however, one must note an important limitation that only a limited number of phantom sizes were readily available, so the results would not readily extrapolate to all patient imaging conditions. We did not analyze the observer SNR by feature size since the phantom geometries for 4 mm versus 5 mm and 6 mm was different. A future analysis could consider separately the 5 mm and 6 mm features as there were 164 sub-image pairs of each size in the body-size phantom. The current ‘consolidated’ body-size phantom results reflect the average response of an ‘effective’ 5.5 mm feature size with 328 image pairs.
An advantage of this type of phantom is that the background variability due to the random close-packed spheres closely mimics the noise texture often found in clinical FDG studies in the liver. Lesion detection in the liver is one of the most difficult clinical tasks in oncologic PET. The current phantom design can be extended to include even more background sphere sizes, which would impact the noise texture in the resulting PET images. One could envision more complex phantom geometries with compartments or regions of different background texture but the same features. Another advantage of this phantom approach is that there are no individual features to fill, and a phantom can contain a great many features. The phantom build and fill process minimizes the amount of time the user has to spend near a radioactive phantom. A drawback, however, is that it is always safer, from a radiation safety standpoint, to have a small amount of activity in a small volume for phantom filling versus using a larger, pre-mixed volume. Also, care must be taken to avoid trapped air bubbles, especially within the dodecahedral features. A further air-removal improvement can be made by pulling a slight vacuum using a hand pump similar to ones used for automotive brake line bleeding.
A limitation of the current phantom setup is that the features are a single contrast. The dilution feature concept was extended beyond 3D-printed dodecahedral features to printing spherical helicoids with lattices inside [24] (Fig. 10). Using 3D-printed nylon, the internal lattice diluted a background radionuclide concentration by the fill factor of the lattice compared to the fill factor of the background. As a proof-of-concept, a set of these contrast/size features were included near one axial end of the central portion of the body-size phantom and scanned across the PET/CT systems. A set of 48 spheres, 4 each at 4 design contrasts of (1.5, 2.0, 2.5, open (~2.8)) and 3 diameters of (20, 15, 10) mm were 3D printed and dipped in cyanoacrylate to seal the nylon surfaces. A set of 4 open spherical helicoids at each diameter were also included to demonstrate the ‘native’ feature contrast. Example single-slice CT and PET images from one of the scanners and with BSREM reconstruction are shown in Fig. 11.
Fig. 10.
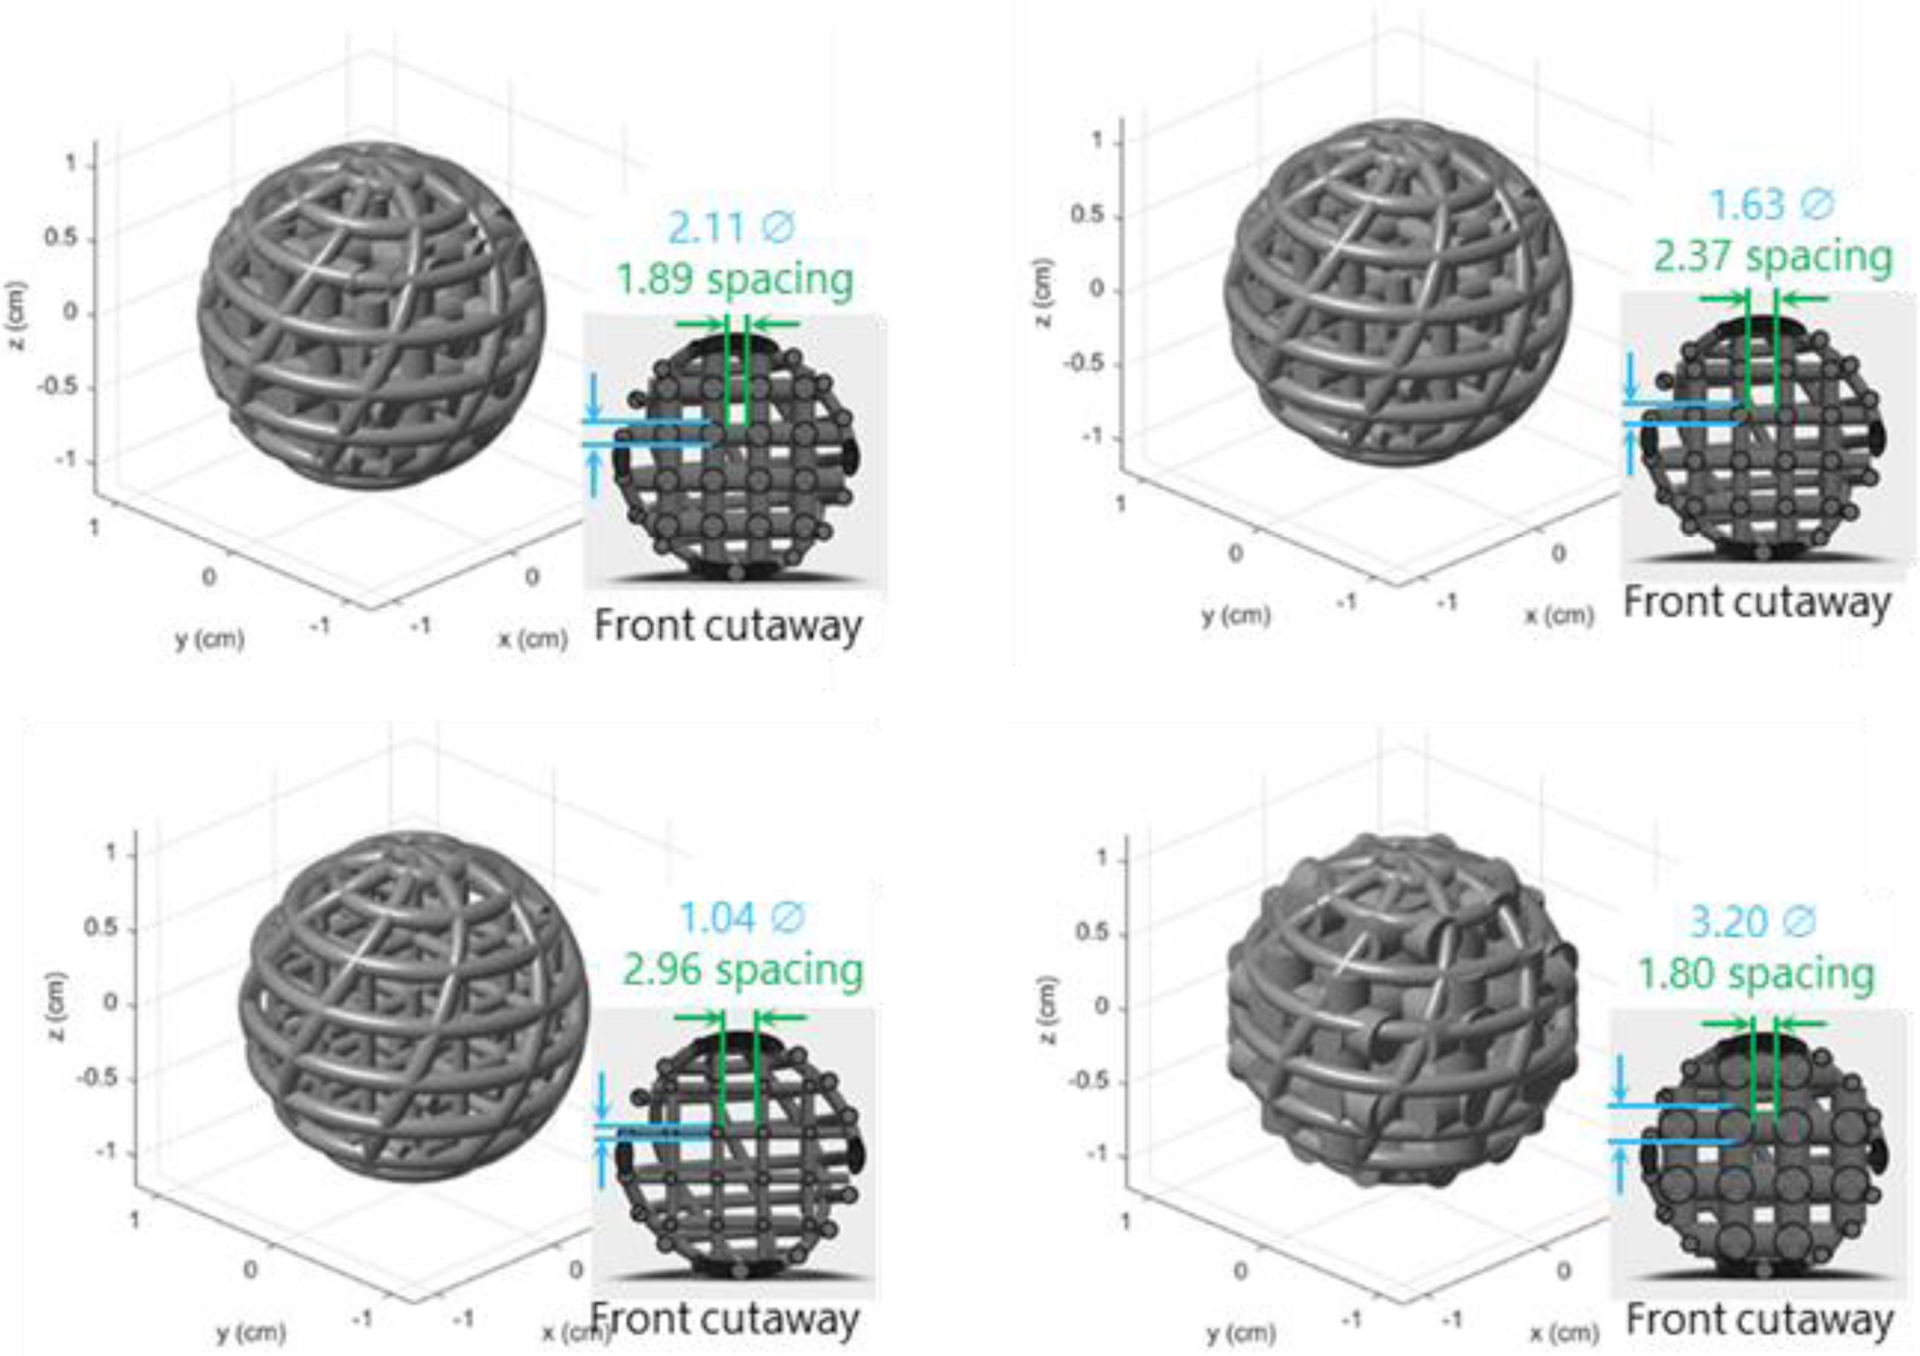
Example 3D print design for a set of spherical helicoid features with different internal lattice designs.
Fig. 11.
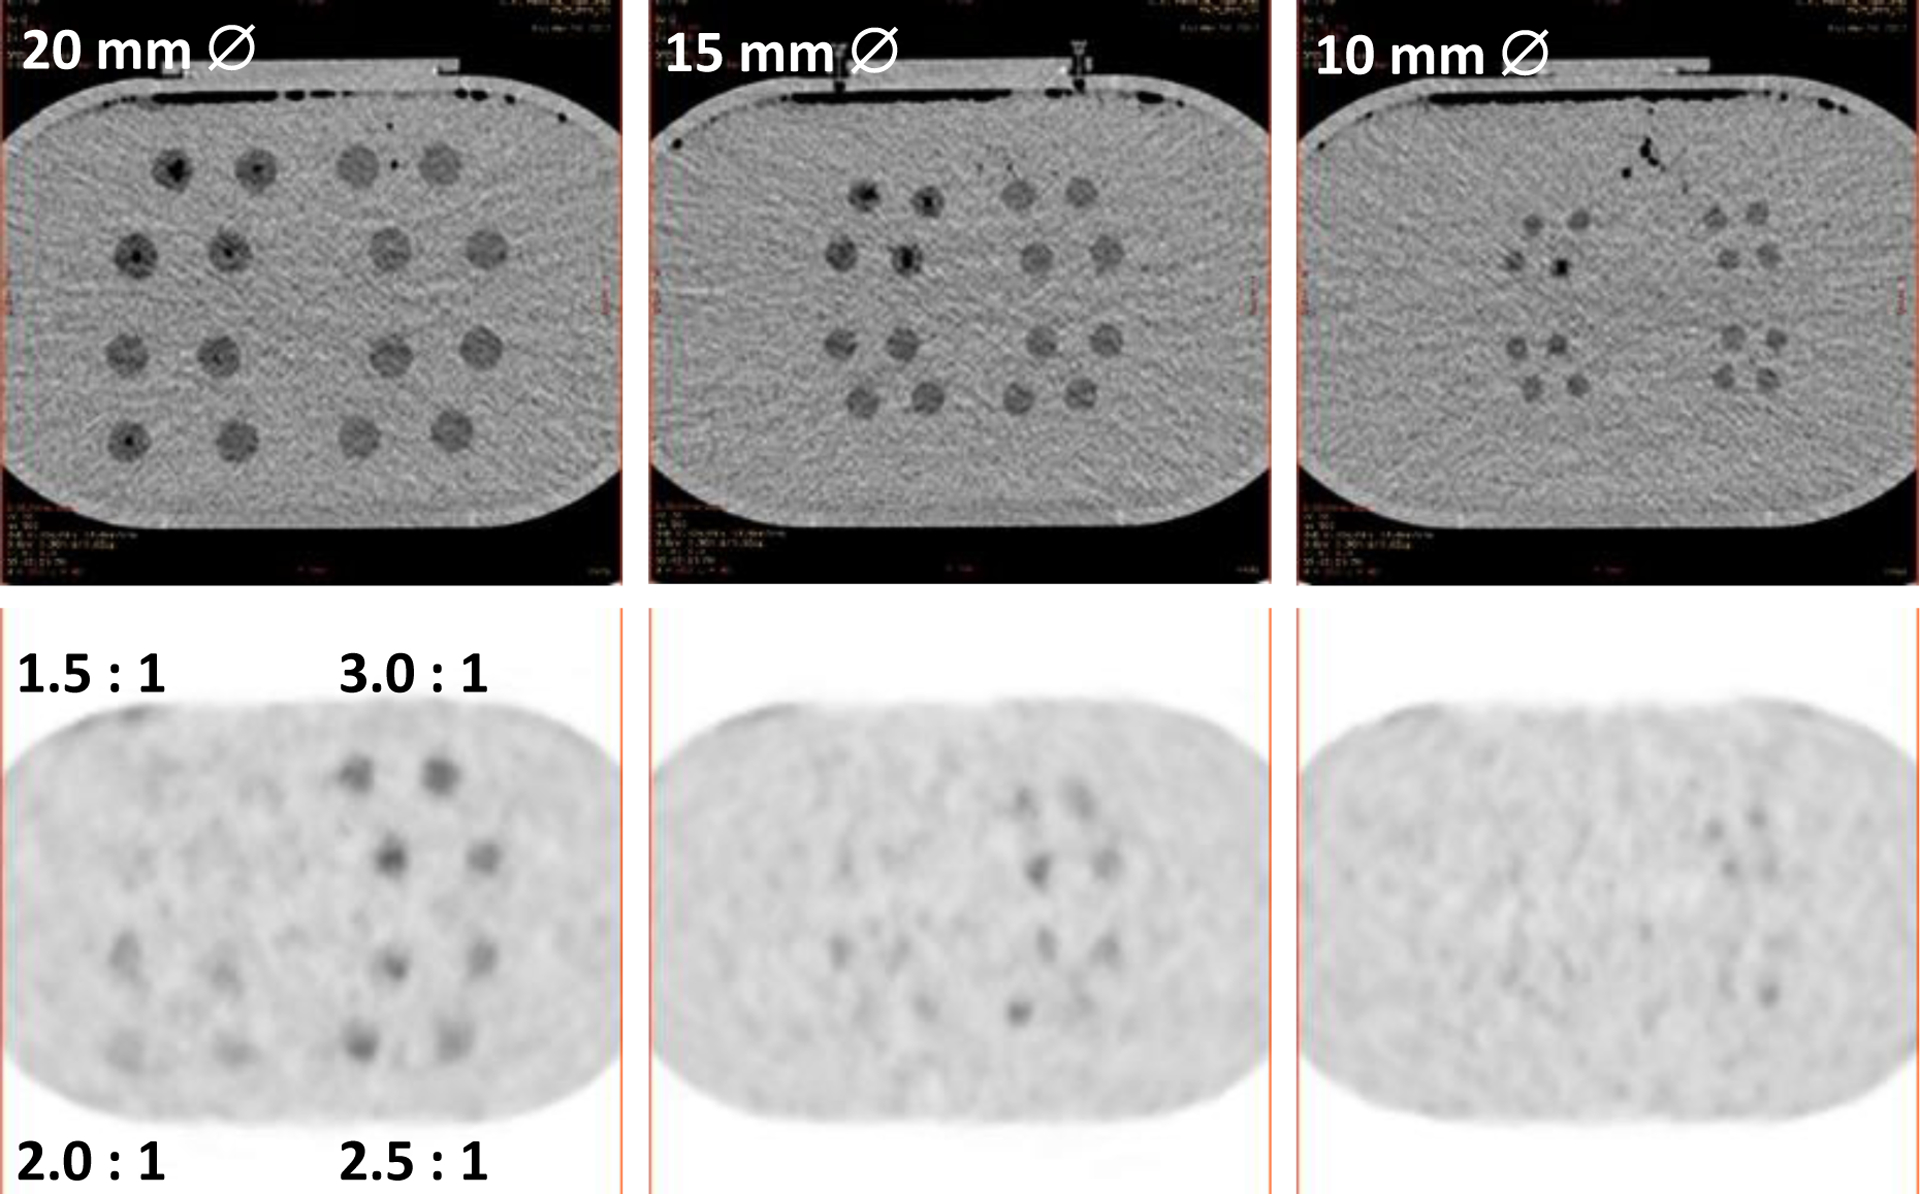
CT (top) and PET (bottom) images of (left-right) 20, 15 and 10 mm diameter spherical features containing internal lattices with different fill factors (contrasts), in grouped sets of 4 for each of 4 contrasts. The expected contrast is shown on the lower-left PET image.
Conclusions
We have developed and demonstrated a phantom design and accompanying methodology that can be used for quantitative estimation of detection task performance in PET imaging. Importantly, this also allows for comparison of the impact of system sensitivity, resolution, and reconstruction and other acquisition differences on the clinical detection task.
Acknowledgments
We thank Craig Abbey, Sangtae Ahn, Kristin Wangerin, Chuck Stearns and Darrin Byrd for helpful discussions and Jun Miao for help in the phantom acquisitions. Supported in part by NIH grant R01CA258298.
Footnotes
Conflict of interest disclosure
S. D. Wollenweber is employed by GE Healthcare. P. E. Kinahan and A. M. Alessio have research contracts with GE Healthcare.
Contributor Information
Scott D. Wollenweber, GE Healthcare – 3000 N. Grandview W-1250, Waukesha, WI 53188
Adam M. Alessio, Computational Mathematics, Science and Engineering, IQ Rm. 1116, BioEngineering Facility, 775 Woodlot Drive, East Lansing, MI 48824.
Paul E. Kinahan, Research and Professor of Radiology, Adjunct Professor of Bioengineering and Physics, Head of the Imaging Research Laboratory, Director of PET/CT Physics, UW Medical Center, University of Washington, Box 357987, University of Washington, Seattle, WA 98195-7987 USA.
References
- [1].Wollenweber SD, Alessio AM, and Kinahan PE, “A phantom design for assessment of detectability in PET imaging,” Med. Phys, vol. 43, no. 9, 2016. [DOI] [PubMed] [Google Scholar]
- [2].Jaszczak RJ, “United States Patent,” 4499375, 1985. [Google Scholar]
- [3].Derenzo SE, Budinger TF, Cahoon JL, Huesman RH, and Jackson HG, “High resolution computed tomography of positron emitters,” IEEE Trans Nuc Sci, vol. 24, no. 1, pp. 544–558, 1977. [Google Scholar]
- [4].Rose A, “The Sensitivity Performance of the Human Eye on an Absolute Scale*,” J. Opt. Soc. Am, vol. 38, no. 2, pp. 196–208, 1948. [DOI] [PubMed] [Google Scholar]
- [5].DiFilippo FP, “Technical Note: Automated quantitative analysis of planar scintigraphic resolution with the ACR SPECT phantom,” Med. Phys, vol. 45, no. 3, pp. 1118–1122, 2018. [DOI] [PubMed] [Google Scholar]
- [6].DiFilippo FP, Patel M, and Patel S, “Automated Quantitative Analysis of American College of Radiology PET Phantom Images,” J. Nucl. Med. Technol, vol. 47, no. 3, pp. 249–254, 2019. [DOI] [PubMed] [Google Scholar]
- [7].DiFilippo FP, “Assessment of PET and SPECT phantom image quality through automated binary classification of cold rod arrays,” Med. Phys, vol. 46, no. 8, pp. 3451–3461, 2019. [DOI] [PubMed] [Google Scholar]
- [8].Wollenweber SD, “A multi-contrast, multi-resolution phantom for radionuclide imaging using a single activity concentration fill,” IEEE Trans. Nucl. Sci, vol. 61, no. 5, pp. 2503–2509, 2014. [Google Scholar]
- [9].Wilson JM and Turkington TG, “Multisphere phantom and analysis algorithm for PET image quality assessment,” Phys. Med. Biol, vol. 53, no. 12, pp. 3267–3278, 2008. [DOI] [PubMed] [Google Scholar]
- [10].Wilson JM and Turkington TG, “TOF-PET small-lesion image quality measured over a range of phantom sizes,” IEEE Trans. Nucl. Sci, vol. 60, no. 3, pp. 1589–1595, 2013. [Google Scholar]
- [11].Kadrmas DJ and Christian PE, “Comparative evaluation of lesion detectability for 6 PET imaging platforms using a highly reproducible whole-body phantom with (22)Na lesions and localization ROC analysis.,” J. Nucl. Med, vol. 43, no. 11, pp. 1545–54, 2002. [PubMed] [Google Scholar]
- [12].Kadrmas DJ, Oktay MB, Casey ME, and Hamill JJ, “Effect of scan time on oncologic lesion detection in whole-body PET,” IEEE Trans. Nucl. Sci, vol. 59, no. 5 PART 1, pp. 1940–1947, 2012. [DOI] [PMC free article] [PubMed] [Google Scholar]
- [13].Kadrmas DJ, Casey ME, Conti M, Jakoby BW, Lois C, and Townsend DW, “Impact of time-of-flight on PET tumor detection.,” J. Nucl. Med, vol. 50, no. 8, pp. 1315–23, Aug. 2009. [DOI] [PMC free article] [PubMed] [Google Scholar]
- [14].Kadrmas DJ, Casey ME, Black NF, Hamill JJ, Panin VY, and Conti M, “Experimental comparison of lesion detectability for four fully-3D PET reconstruction schemes,” IEEE Trans. Med. Imaging, vol. 28, no. 4, pp. 523–534, 2009. [DOI] [PMC free article] [PubMed] [Google Scholar]
- [15].Sunderland JJ and Christian PE, “Quantitative PET/CT Scanner Performance Characterization Based Upon the Society of Nuclear Medicine and Molecular Imaging Clinical Trials Network Oncology Clinical Simulator Phantom,” J. Nucl. Med, vol. 56, no. 1, pp. 145–152, 2015. [DOI] [PubMed] [Google Scholar]
- [16].Manjeshwar RM, Ross SG, Iatrou M, Deller TW, and Stearns CW, “Fully 3D PET Iterative Reconstruction Using Distance-Driven Projectors and Native Scanner Geometry,” in 2006 IEEE Nuclear Science Symposium Conference Record, 2006, vol. 5, pp. 2804–2807. [Google Scholar]
- [17].Alessio AM et al. , “Application and evaluation of a measured spatially variant system model for PET image reconstruction,” IEEE Trans. Med. Imaging, vol. 29, no. 3, pp. 938–949, 2010. [DOI] [PMC free article] [PubMed] [Google Scholar]
- [18].Ahn S and Fessler JA, “Globally convergent image reconstruction for emission tomography using relaxed ordered subsets algorithms,” IEEE Trans. Med. Imaging, vol. 22, no. 5, pp. 613–626, May 2003. [DOI] [PubMed] [Google Scholar]
- [19].Fiete RD, Barrett HH, Smith WE, and Myers KJ, “Hotelling trace criterion and its correlation with human-observer performance,” J. Opt. Soc. Am. A, vol. 4, no. 5, pp. 945–953, May 1987. [DOI] [PubMed] [Google Scholar]
- [20].Gifford HC, King MA, De Vries DJ, and Soares EJ, “Channelized Hotelling and Human Observer Correlation for Lesion Detection in Hepatic SPECT Imaging,” J. Nucl. Med, vol. 41, no. 3, pp. 514–521, 2000. [PubMed] [Google Scholar]
- [21].Wunderlich A, Noo F, Gallas BD, and Heilbrun ME, “Exact Confidence Intervals for Channelized Hotelling Observer Performance in Image Quality Studies,” IEEE Trans. Med. Imaging, vol. 34, no. 2, pp. 453–464, 2015. [DOI] [PMC free article] [PubMed] [Google Scholar]
- [22].Abbey CK, Barrett HH, and Eckstein MP, “Practical issues and methodology in assessment of image quality using model observers,” Proc. SPIE - Int. Soc. Opt. Eng, vol. 3032, pp. 182–194, 1997. [Google Scholar]
- [23].Tong S, Alessio AM, and Kinahan PE, “Noise and signal properties in PSF-based fully 3D PET image reconstruction: an experimental evaluation,” Phys. Med. Biol, vol. 55, no. 5, p. 1453, 2010. [DOI] [PMC free article] [PubMed] [Google Scholar]
- [24].Wollenweber SD, “A Phantom Design and Demonstration of Contrast-Size Features in PET,” in IEEE Nuclear Science Symposium & Medical Imaging Conference, 2017, pp. 1–3. [Google Scholar]


