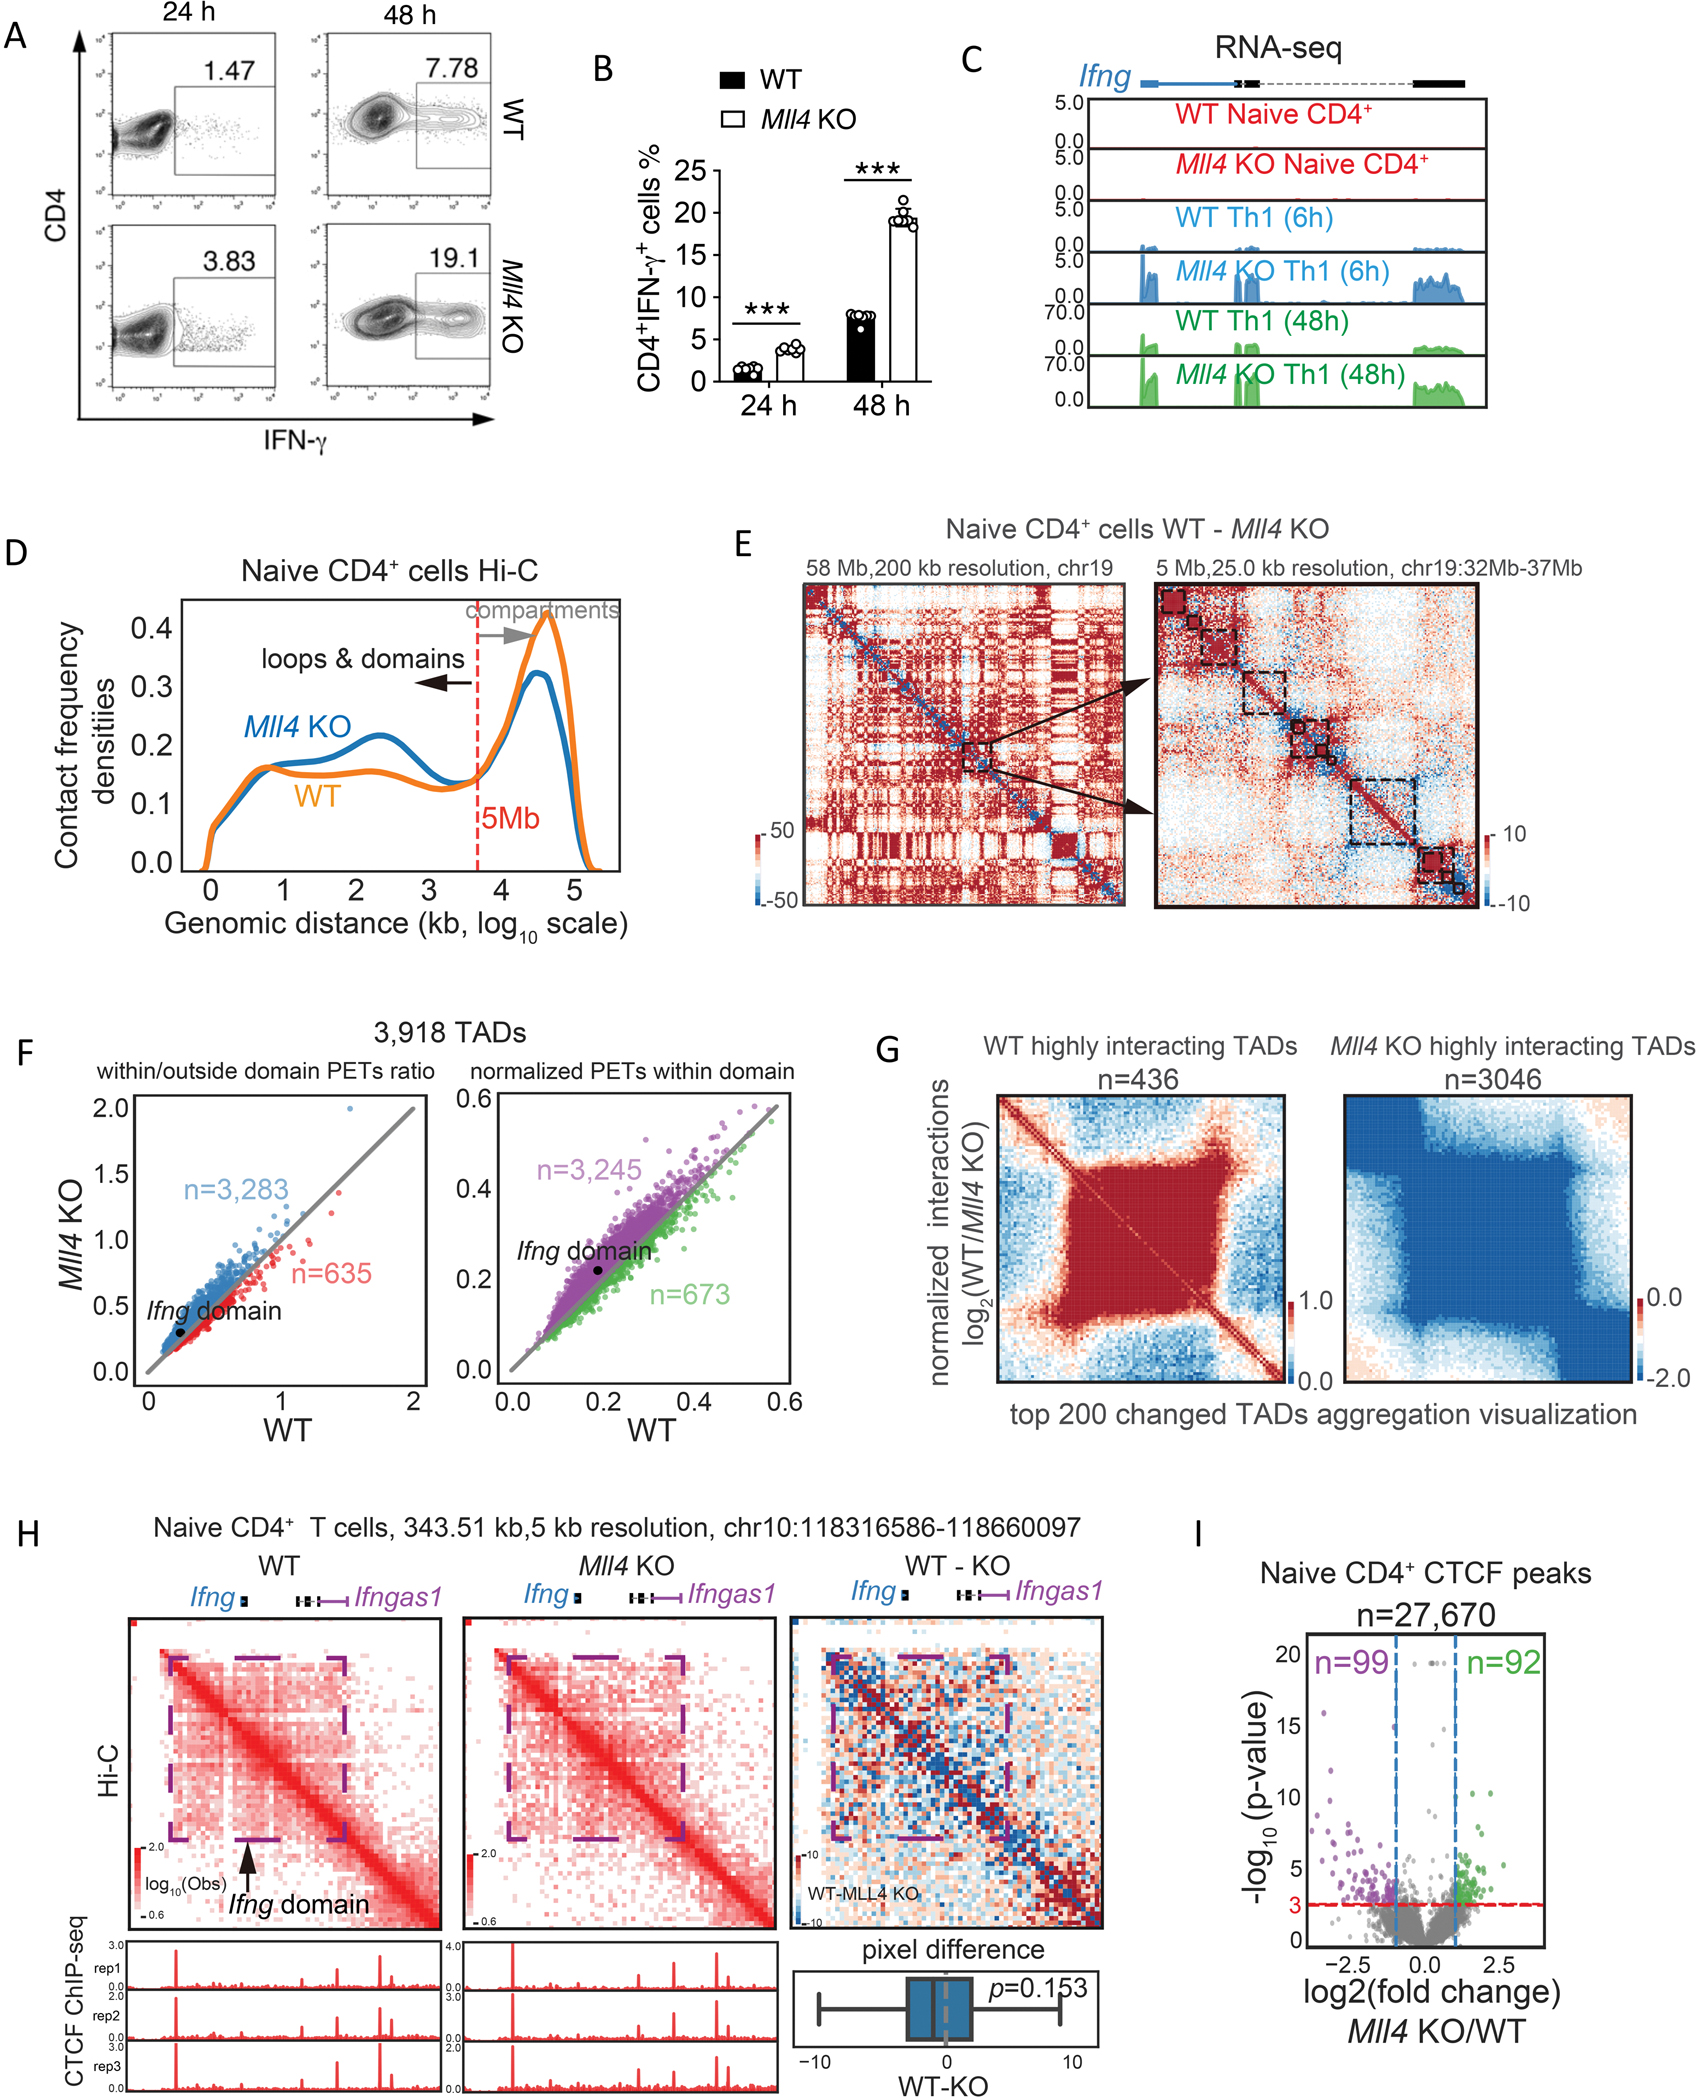
Fig 1. Loss of Mll4 induces enhanced IFN-g expression and interaction frequencies within the Ifng domain.

(A) Naive CD4+ T cells from WT and Mll4 KO mice were stimulated under Th1 condition and harvested at 24 and 48 hours. Intracellular expression levels of IFN-γ produced in these cells were determined by flow cytometry.
(B) Quantification of IFN-γ producing cells from multiple experiments as measured in (A) above.
(C) Genome browser images of RNA-seq analysis of Ifng expression in WT and Mll4 KO CD4+ T cells under Th1 condition. The RNA-seq data were generated in this study.
(D) Distribution of interacting paired-end tags (PETs) frequencies against genomic distances of Hi-C data in wild-type and Mll4 KO naïve CD4+ T cells. Hi-C data were obtained from 32 and down-sampled to 300 million for a fair comparison. Only PETs with distance longer than 1 kb were used to draw the density plot.
(E) Examples of chromatin interaction changes measured by Hi-C after Mll4 KO in naïve CD4+ T cells. The changes of Hi-C interaction frequency were visualized by subtracting the number of PETs detected in KO cells from the number of PETs detected in WT cells. The blue color indicates decreased interaction frequencies, and the red color indicates increased interaction frequencies. Left panel shows the interaction difference heatmap for Chromosome 19 with 200 kb resolution, and arrows indicate a random selected region for zoom-in visualization as the right panel. The right panel shows the interaction changes in a 5 Mb genomic region with 25 kb resolution; the black rectangles mark the TADs called by Juicer with the WT Hi-C data.
(F) Quantitation of Hi-C interaction changes for TADs comparing Mll4 KO and WT mice in naïve CD4+ T cells. The left panel shows relative changes regarding the TAD compactness, and the right panel shows changes of interaction densities within the TADs. Only PETs with a distance longer than 1 kb were used for the calculation. The numbers indicate the TADs with higher interacting densities in KO or WT cells. The TAD contains the Ifng locus was indicated.
(G) Hi-C data aggregation analysis of highly interacting TADs in WT or Mll4 KO cells. WT or KO highly interacting domains were obtained by overlapping the consistently changed domains from compactness and interaction densities within TADs in (F). Only the top 200 changed TADs were used to draw the aggregation heatmaps.
(H) Hi-C interaction frequencies of Ifng domain were increased in Mll4 KO naïve CD4+ T cells (middle panel) compared to WT cells (left panel). The changes of interaction frequency were visualized by subtracting the number of PETs detected in KO cells from the number of PETs detected in WT cells (right panel). The blue color indicates decreased interaction frequencies, and the red color indicates increased interaction frequencies. CTCF ChIP-seq profiles for WT and KO naïve CD4+ T cells were shown below the red heatmaps for corresponding cell types. Distribution of pixel level (5kb resolution) difference for the Ifng domain was shown below the red/blue heatmap. Two sided Wilcoxon signed-rank test P-value was shown for the statistical difference of interactions within the Ifng domain. CTCF ChIP-seq data were generated in this study.
(I) Volcano plots of significantly changed CTCF peaks for the naïve CD4+ T cells affected by Mll4 KO. Mean values from three replicates were used to calculate fold changes (KO/WT) and Poisson P-values. Fold change > 2 (or < 0.5) and P-value smaller than 0.001 were set as the significant cutoffs. Numbers of total peaks, WT specific peaks and KO specific peaks were shown.
Data are representative of at least two independent experiments (A, C-I) or pooled from two independent experiments (B). ***p < 0.001. (Two-way ANOVA with Tukey’s multiple comparison test, error bars represent SD).
