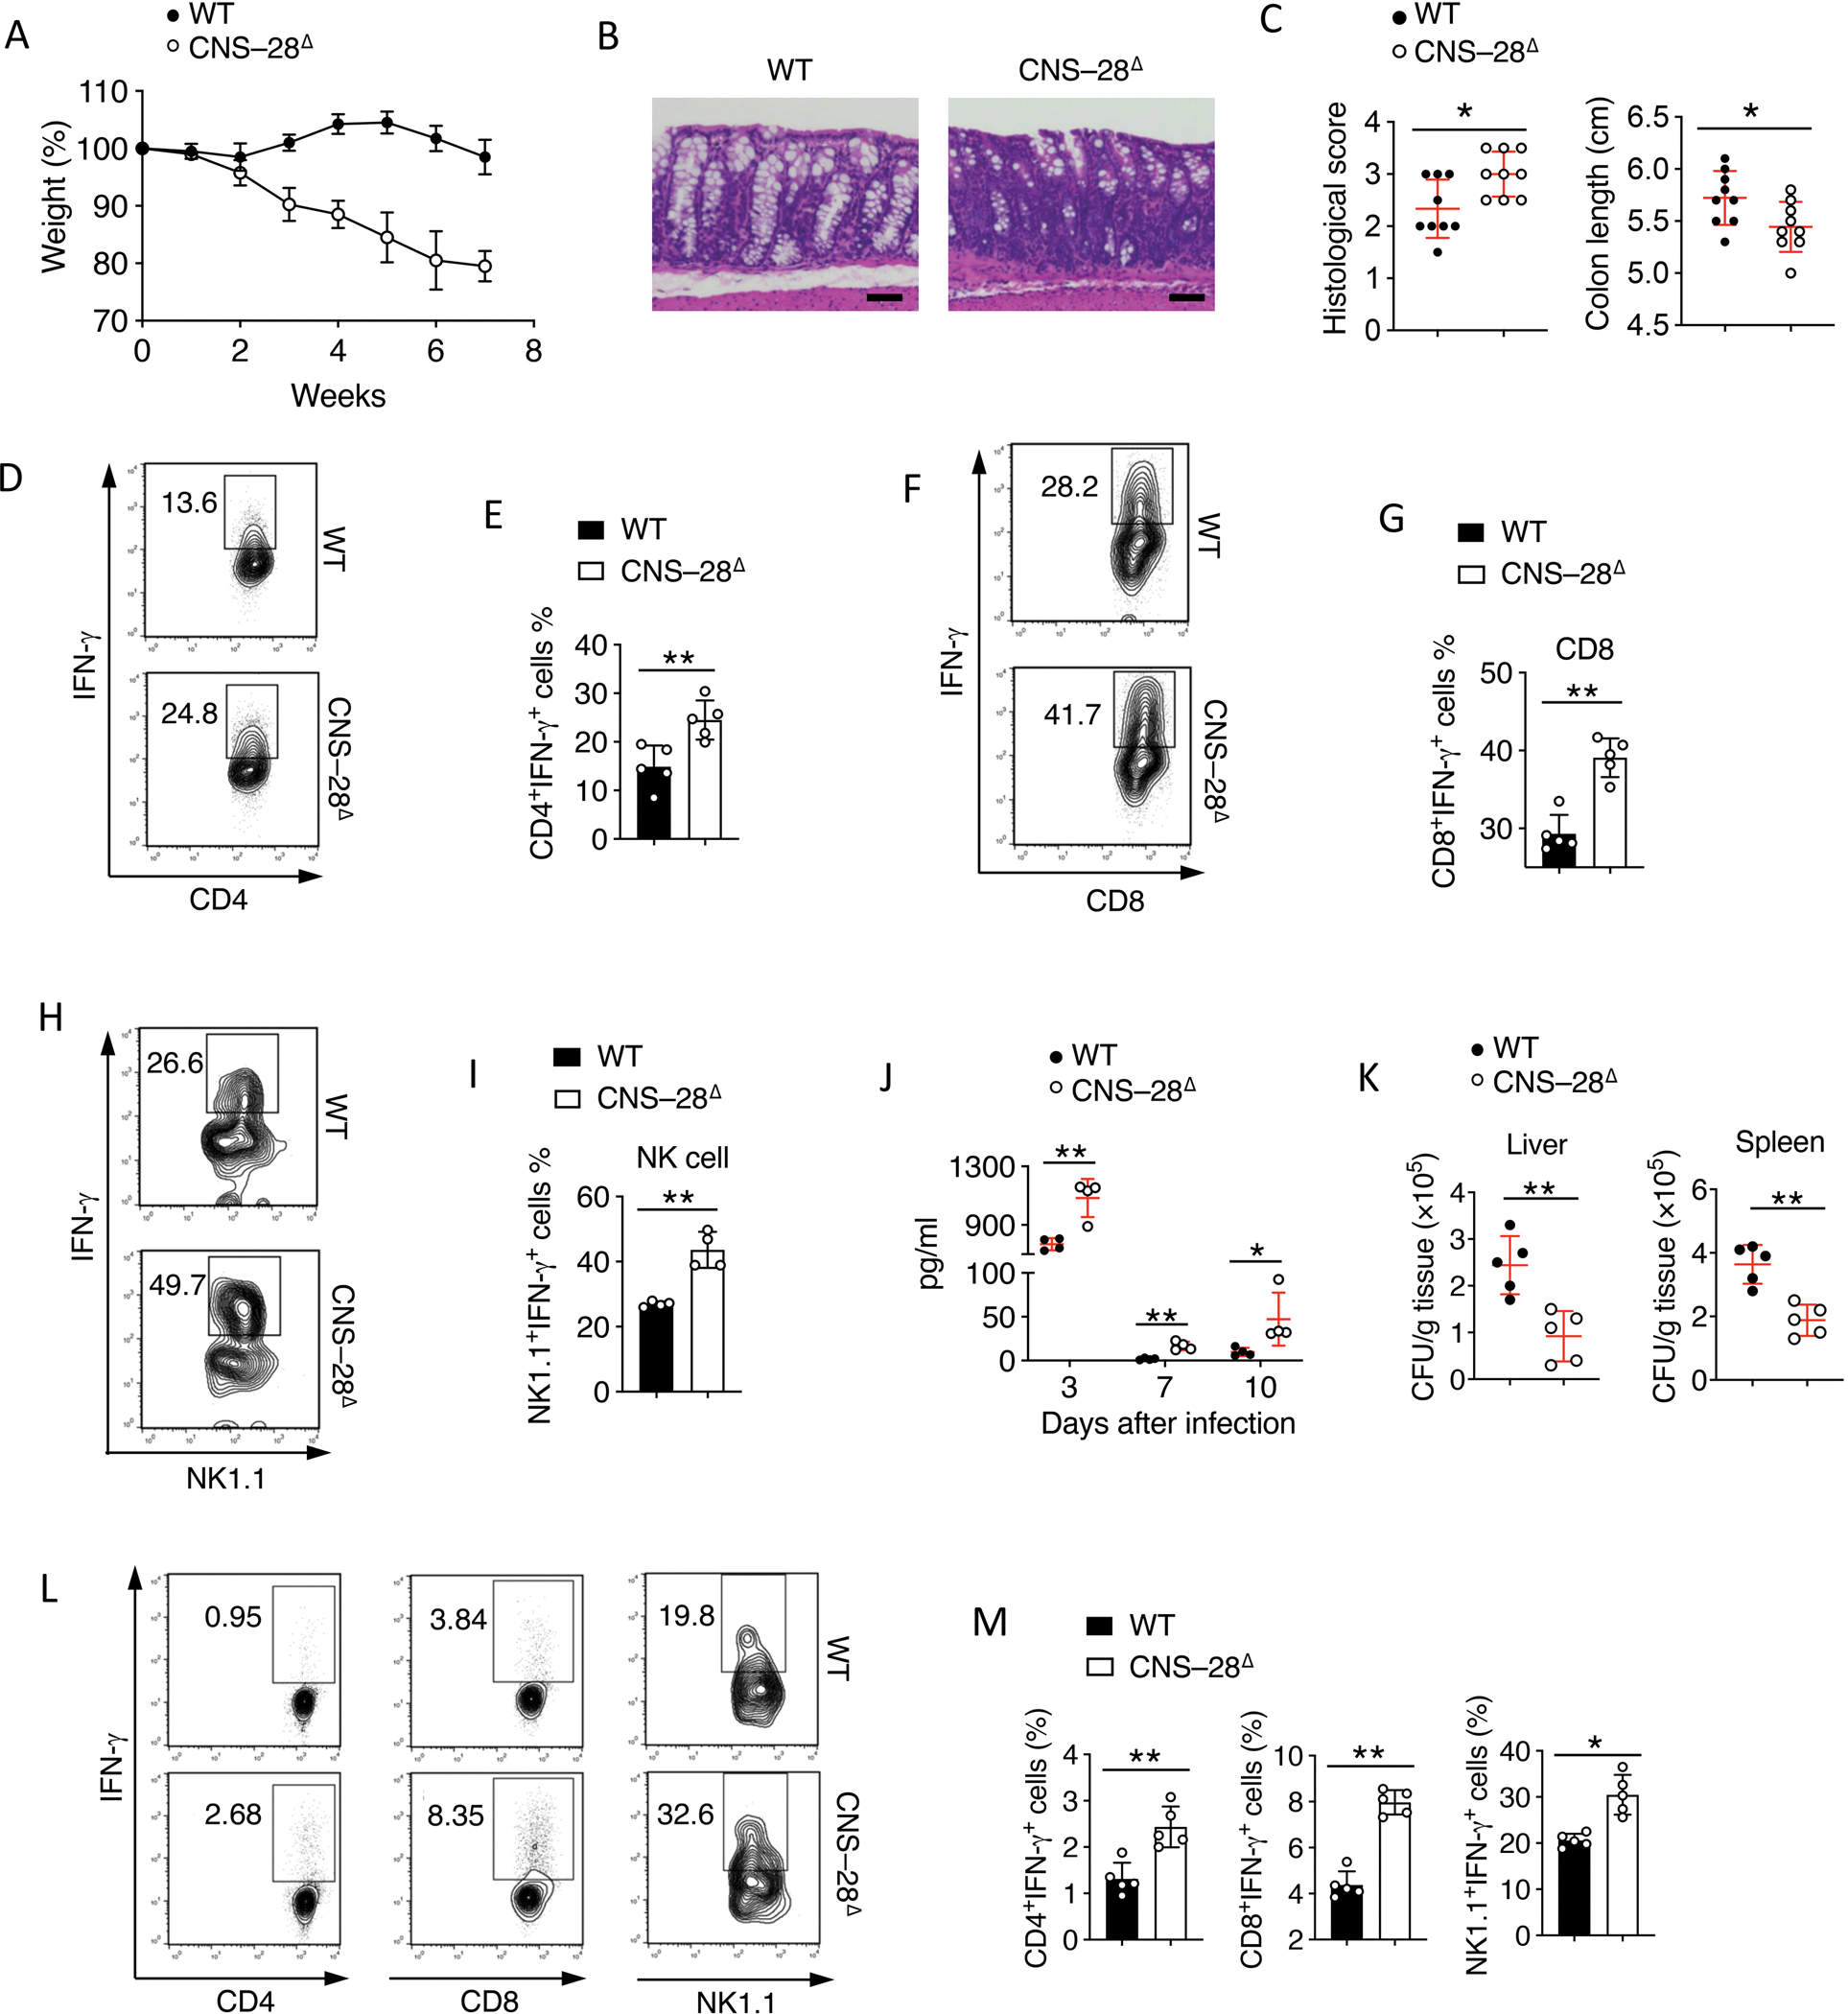
Fig 5. CNS–28 is critical for type 1 responses during host defense and inflammation.

(A) Body weight of Rag2−/− mice transferred i.p. with CD4+CD25−CD62L+ cells from WT or CNS–28Δ mice.
(B) Hematoxylin and eosin staining of colonic tissue from the different groups as in (A) 10 weeks after colitis induction, scale bar, 50μm.
(C) Left: Quantification of pathological changes in the colon of mice as in (A); Right: Colon lengths of Rag2−/− mice which had received the indicated cells for transfer as in (A), measured from the colocecal junction to the anal verge
(D-E) (D)Flow cytometry analysis and (E) Quantification of IFN-γ expression by CD4+ T cells isolated from LP from indicated groups as in (A) 10 weeks after colitis induction.
(F-I) Splenocytes from WT and CNS–28Δ mice were isolated and cultured in the presence of IL-12 and IL-2 for 6 h. IFN-γ expression in (F, G) CD8+ T cells or (H, I) NK1.1+ NK cells were measured by (F, H) flow cytometry or (G, I) Quantification.
(J-M) Listeria were inoculated into WT and CNS–28Δ mice by oral gavage. The mice were sacrificed on day 14 for further tests.
(J) IFN-γ level in serum was assessed by ELISA at indicated day.
(K) Bacteria CFU was counted at day 7 after infection in liver and spleen.
(L) Flow cytometry analysis and (M) Quantification of IFN-γ expression in CD4+, CD8+ T cells from spleen 7 days after infection and NK cells isolated from spleen 1 day after infection.
Data are representative of at least two independent experiments (A, B, C-M) or pooled from two independent experiments (C). *p < 0.05, **p < 0.01 (Student’s t test, error bars represent SD).
