Abstract
Small extracellular vesicles (sMEVs) from bovine milk are studied for delivering therapeutics. Here, we estimated sMEV bioavailability of an oral dose of sMEVs. Bovine sMEVs were labeled covalently with HiLyte™ 750 (MEV-750) and administered by oral gavage to C57BL/6J mice. Plasma, urine, feces, and tissues were harvested at timed intervals for up to 24 h and fluorescence was assessed. Fecal excretion amounted to approximately 55% of the oral MEV-750 dose in males and females. The levels of MEV-750 peaked in the intestinal mucosa and plasma approximately 6 h after oral gavage and returned to baseline at time point 24 h. MEV-750 were detectable in peripheral tissues approximately 12 h after gavage. MEV-750 excretion in urine peaked approximately 6 h after oral gavage and returned to background levels after 24 h. Analysis by size exclusion chromatography suggested that HiLyte™ detached from sMEVs in artificial gastric fluid but not in plasma, i.e., HiLyte™ allows to estimate sMEV bioavailability with comparably high confidence. We conclude that the apparent bioavailability of sMEVs is 45%, and sMEVs are transported to peripheral tissues in C57BL/6J mice; excretion in feces and urine are the main routes of sMEV elimination.
Keywords: Drug delivery, extracellular vesicles, feces, milk, plasma, tissue distribution, urine
1. Introduction
Experimental evidence is compelling that small extracellular vesicles (sEVs) have properties conducive for delivering therapeutic payloads to tissues. For example, autologous culture-derived sEVs from dendritic cells delivered small interfering RNA (siRNA) to neurons, microglia, and oligodendrocytes, and significantly knocked down the expression of target genes (Alvarez-Erviti et al., 2011). The technology was adapted to deliver KrasG12D siRNA in mouse models of pancreatic cancer, leading to a 60% decrease in tumor weight and a doubling of survival time compared to scrambled siRNA controls (Mendt et al., 2018). Despite the great promise that cell culture-derived sEVs hold for use in drug delivery, their use is limited by low yield and uncertainties regarding oral bioavailability.
sEVs from milk afford distinct advantages compared to sEVs from cell cultures. The production of milk sEVs is a scalable process. Bovine milk contains approximately 1017/l sEVs and cows produce approximately 10,800 kg milk per year (Statista, 2021, Sukreet et al., 2021). Bovine milk sEVs (sMEVs) are stable and protect their cargo against degradation under conditions encountered in the gastrointestinal tract and industrial processing (Benmoussa et al., 2016, Howard et al., 2015, Izumi et al., 2012). Bovine sMEVs are bioavailable and accumulate in the intestinal mucosa and peripheral tissues in humans, pigs, and mice (Baier et al., 2014, Manca et al., 2018, Munagala et al., 2016, Wolf et al., 2015). Bovine, porcine, and murine sMEVs cross barriers such as the placenta and blood-brain barrier (Sadri et al., 2020, Zhou et al., 2022). Bovine sMEVs are safe and do not compromise liver and kidney function or elicit cytokine release of frank immune responses in humans, human peripheral blood mononuclear cells ex vivo, and mice (Leiferman et al., 2018, Munagala et al., 2016, Mutai et al., 2020). Protocols have been developed for loading bovine sMEVs with therapeutic cargos, and lung cancer KRASG12S specific siRNA-loaded sMEVs have resulted in a 54% decrease in A549 lung cancer xenografts volume in athymic nude mice compared to the vehicle control (Aqil et al., 2019, Manca et al., 2018). The pharmaceutical industry has recognized the potential for using sMEVs in drug delivery, as evidenced by a $1 billion licensing agreement between Roche, Inc. and PureTech Health, Inc. (The Pharma letter, 2018).
A randomized controlled bovine milk feeding study showed a post-prandial increase in functional bovine milk miRNAs in human plasma approximately 4 h after drinking milk (Baier et al., 2014). sMEVs and their miRNA cargos enter intestinal mucosa cells and peripheral tissues such as liver, spleen, and brain following their oral administration (Manca et al., 2018, Wolf et al., 2015, Zhou et al., 2022). While the bioavailability of bovine milk sEVs and siRNA payloads has been demonstrated in mice and pigs, the percent bioavailability is unknown (Manca et al., 2018, Munagala et al., 2016). In a previous report, we provided a crude estimate of the percent bioavailability (25%) but that estimate was based on comparing the accumulation of bovine sMEVs labeled with a single payload (fluorophore-labeled miR-320) in a single tissue (liver) at a single-time point after oral (6 h) and intravenous administration (3 h) (Manca et al., 2018). Here, we assessed the oral bioavailability of bovine sMEVs by conducting time course studies in feces, plasma and urine, in combination with studies of tissue distribution and label stability.
2. Materials and methods
2.1. Purification, characterization, and labeling of bovine milk sEVs (sMEVs)
Skim bovine milk was obtained from a local grocery store and sMEVs were isolated by differential ultracentrifugation and covalently labeled with carbonyl-reactive HiLyte™ Fluor 750 hydrazide (AnaSpec, Inc.; cat. co. AS-81268) as previously described (Khanam et al., 2021, Wolf et al., 2015). HiLyte™-labeled sMEVs (MEV-750) were resuspended in phosphate-buffered saline (PBS), and their concentration was determined by using a NanoSight NS300 instrument (Malvern, Westborough, MA). We used camera setting 14–15, screen gain 2, detection threshold 3, syringe speed 100, and captured three 1-minute videos. Each frame contained approximately 49 – 80 particles. Data were analyzed using NTA 2.3 (Malvern). MEV-750 morphology and their dispersion in PBS were assessed by using transmission electron microscopy (TEM) as previously described (Sukreet et al., 2021). Marker proteins were analyzed by immunoblot analysis as previously described, using anti-CD63 (cat. no. MCA2042GA, Bio-Rad), anti-Alix (cat. no. SC49268, Santa Cruz Biotechnology), and anti-Tsg101 (cat. no. Ab225877, Abcam) to detect markers for exosomes, integrin β1 (cat. no. Ab183666, Abcam) as a marker for microvesicles, and histone H3 (cat. no. SC56616, Santa Cruz Biotechnology) as a marker for nuclear material (Leiferman et al., 2019). MEV-750 and unlabeled sMEVs (MEV) were stored at −80°C for up to 24 weeks.
2.2. Assessment of sMEV bioavailability, distribution, and excretion
C57BL/6J mice, ages 8 – 14 weeks, were purchased from the Jackson Laboratory (stock no. 000664) and housed in a pathogen-free facility at 22°C in a 12-h light/dark cycle. The mice had free access to Teklad Global 16% Protein Rodent Diet (cat. no. Teklad 2016, Envigo, Inc.) and water. Mice were allowed to acclimate for at least 1 week prior to the study. Males and females were studied. Animal experiments were conducted following a protocol approved by the Institutional Animal Care and Use Committee of the University of Nebraska-Lincoln (protocol No. 2152).
Fecal and urinary excretion of MEV-750 was used to assess the apparent bioavailability and pathways of excretion. Briefly, 3 × 10¹¹ MEV-750 were administered by oral gavage per gram body weight (n = 3 per sex). Mice were housed individually using hydrophobic sand for bedding (BRAINTREE SCIENTIFIC, INC., cat. no. LABSAND CS); enrichment toys were provided. Fecal samples were collected from cages at timed intervals for up to 24 h after MEV-750 and MEV administration. Feces was suspended in PBS by using a vortex mixer at room temperature. Fluorescence was measured at 753 nm (excitation) and 782 nm (emission) in a LI-COR Odyssey CLx system (LI-COR Biosciences) and corrected by subtracting the background noise. The fecal excretion of MEV-750 was calculated as follows:
In studies of plasma concentration versus time curves and tissue distribution, MEV-750 were administered by oral gavage using a dose of 2 × 10¹¹ MEV-750 per g body weight; controls received MEV (n = 4 per sex and treatment). The studies were terminal and therefore were conducted in mice other than those used for collection of total feces. Blood and tissues were collected 6 h, 12 h, and 24 h after oral gavage, and MEV controls provided 0-h values. Mice were euthanized and blood was collected by cardiac puncture into EDTA tubes (Thermo Fisher Scientific; cat. no. Covidien 8881311149). Plasma was obtained by centrifugation of blood (600 g at 4°C) for 15 min. Tissues and plasma were harvested in petri dishes and microcentrifuge tubes, respectively, and processed as previously described (Manca et al., 2018). Plasma and tissue fluorescence was measured as described above. In densitometry analysis, fluorescence values in MEV-750 treated mice were normalized by using the fluorescence from a tissue-free area in the petri dishes and by subtracting the fluorescence produced by MEV controls. We determined whether plasma fluorescence was linked to sEVs as follows. Platelets were removed by centrifugation of plasma at 5,000 g at 20°C for 20 min. sEVs in the supernatant were harvested by polyethylene glycol (PEG) precipitation as previously described and resuspended in 100 μl PBS (Garcia-Romero et al., 2019).
2.3. Assessment of label stability by size exclusion chromatography of plasma
The stability of the HiLyte-sMEV bondage was assessed by using size exclusion chromatography (SEC) as previously described (Boing et al., 2014). Briefly, plasma samples from time point 6 h (400 μl) were loaded on sepharose CL-2B columns (10 ml bed volume in 12-ml luerlock syringes (Becton, Dickinson and Company), and fractions (0.5 or 1.0 ml) were eluted with PBS-citrate buffer (Garcia-Romero et al., 2019). Twenty-five fractions were collected. sEVs in column fractions were precipitated by using PEG for analysis of fluorescence. The fluorescence readings for pellets from 0.5-ml fraction was multiplied by a factor of 2 to make the reading comparable to 1-ml fractions.
We supplemented studies of postabsorptive label stability in plasma by assessing the stability of the HiLyte-sMEV bondage prior to absorption in the stomach and intestine. Briefly, MEV-750 were incubated in artificial stomach fluid (cat. no. 710832; Fisher Scientific) containing pepsin (cat. no. 10108057001; Sigma) at a final concentration of 1 mg/ml at 37°C for 2 h. The 2-h treatment time mimics in mice (Schwarz et al., 2002). Size exclusion chromatography was conducted as described above, using untreated MEV-750 as control. The release of HiLyte from MEV-750 in the intestine was assessed by incubating MEV-750 in artificial intestinal fluid (cat. no. 71097516; Fisher Scientific) containing pancreatin (cat. no. J6216230; Thermos Scientific) at a final concentration of 3 mg/ml at 37°C; controls were incubated in PBS. At timed intervals, were collected and MEV-750 suspencions were treated with 10% PEG to precipitate MEV-750. The release of HiLyte was assessed by quantifying the fluorescence in the supernatant.
2.4. Statistical analysis
Data analysis was conducted using non-parametric tests. Two-tailed Mann–Whitney U test was used for comparison of two groups and Kruskal–Wallis test with Dunn’s multiple comparisons post hoc test was used for comparisons among more than two groups. GraphPad Prism 8 was used for all statistical analyses (GraphPad Software, Inc.). Data are presented as means ± SEM. Differences were considered significant if p < 0.05.
3. Results
3.1. Characterization of sMEVs
sMEV preparations from bovine milk were rich in exosomes. The size of MEV-750 matched the size expected for exosomes with a mean value of 76 ± 1.2 nm (n = 3 independent samples); three technical replicates from one sample are shown in Figure 1a. MEV-750 presented as spherical, membranous structures and were finely dispersed in PBS, i.e., sMEV aggregation was an unlikely confounder in studies of bioavailability (Fig. 1b). sMEVs tested positive for exosome marker proteins (CD63, Alix, and Tsg101), whereas markers for microvesicles (integrin β1) and nuclear material (histone H3) were not detectable (Fig. 1c).
Figure 1: Characterization of bovine sMEVs.
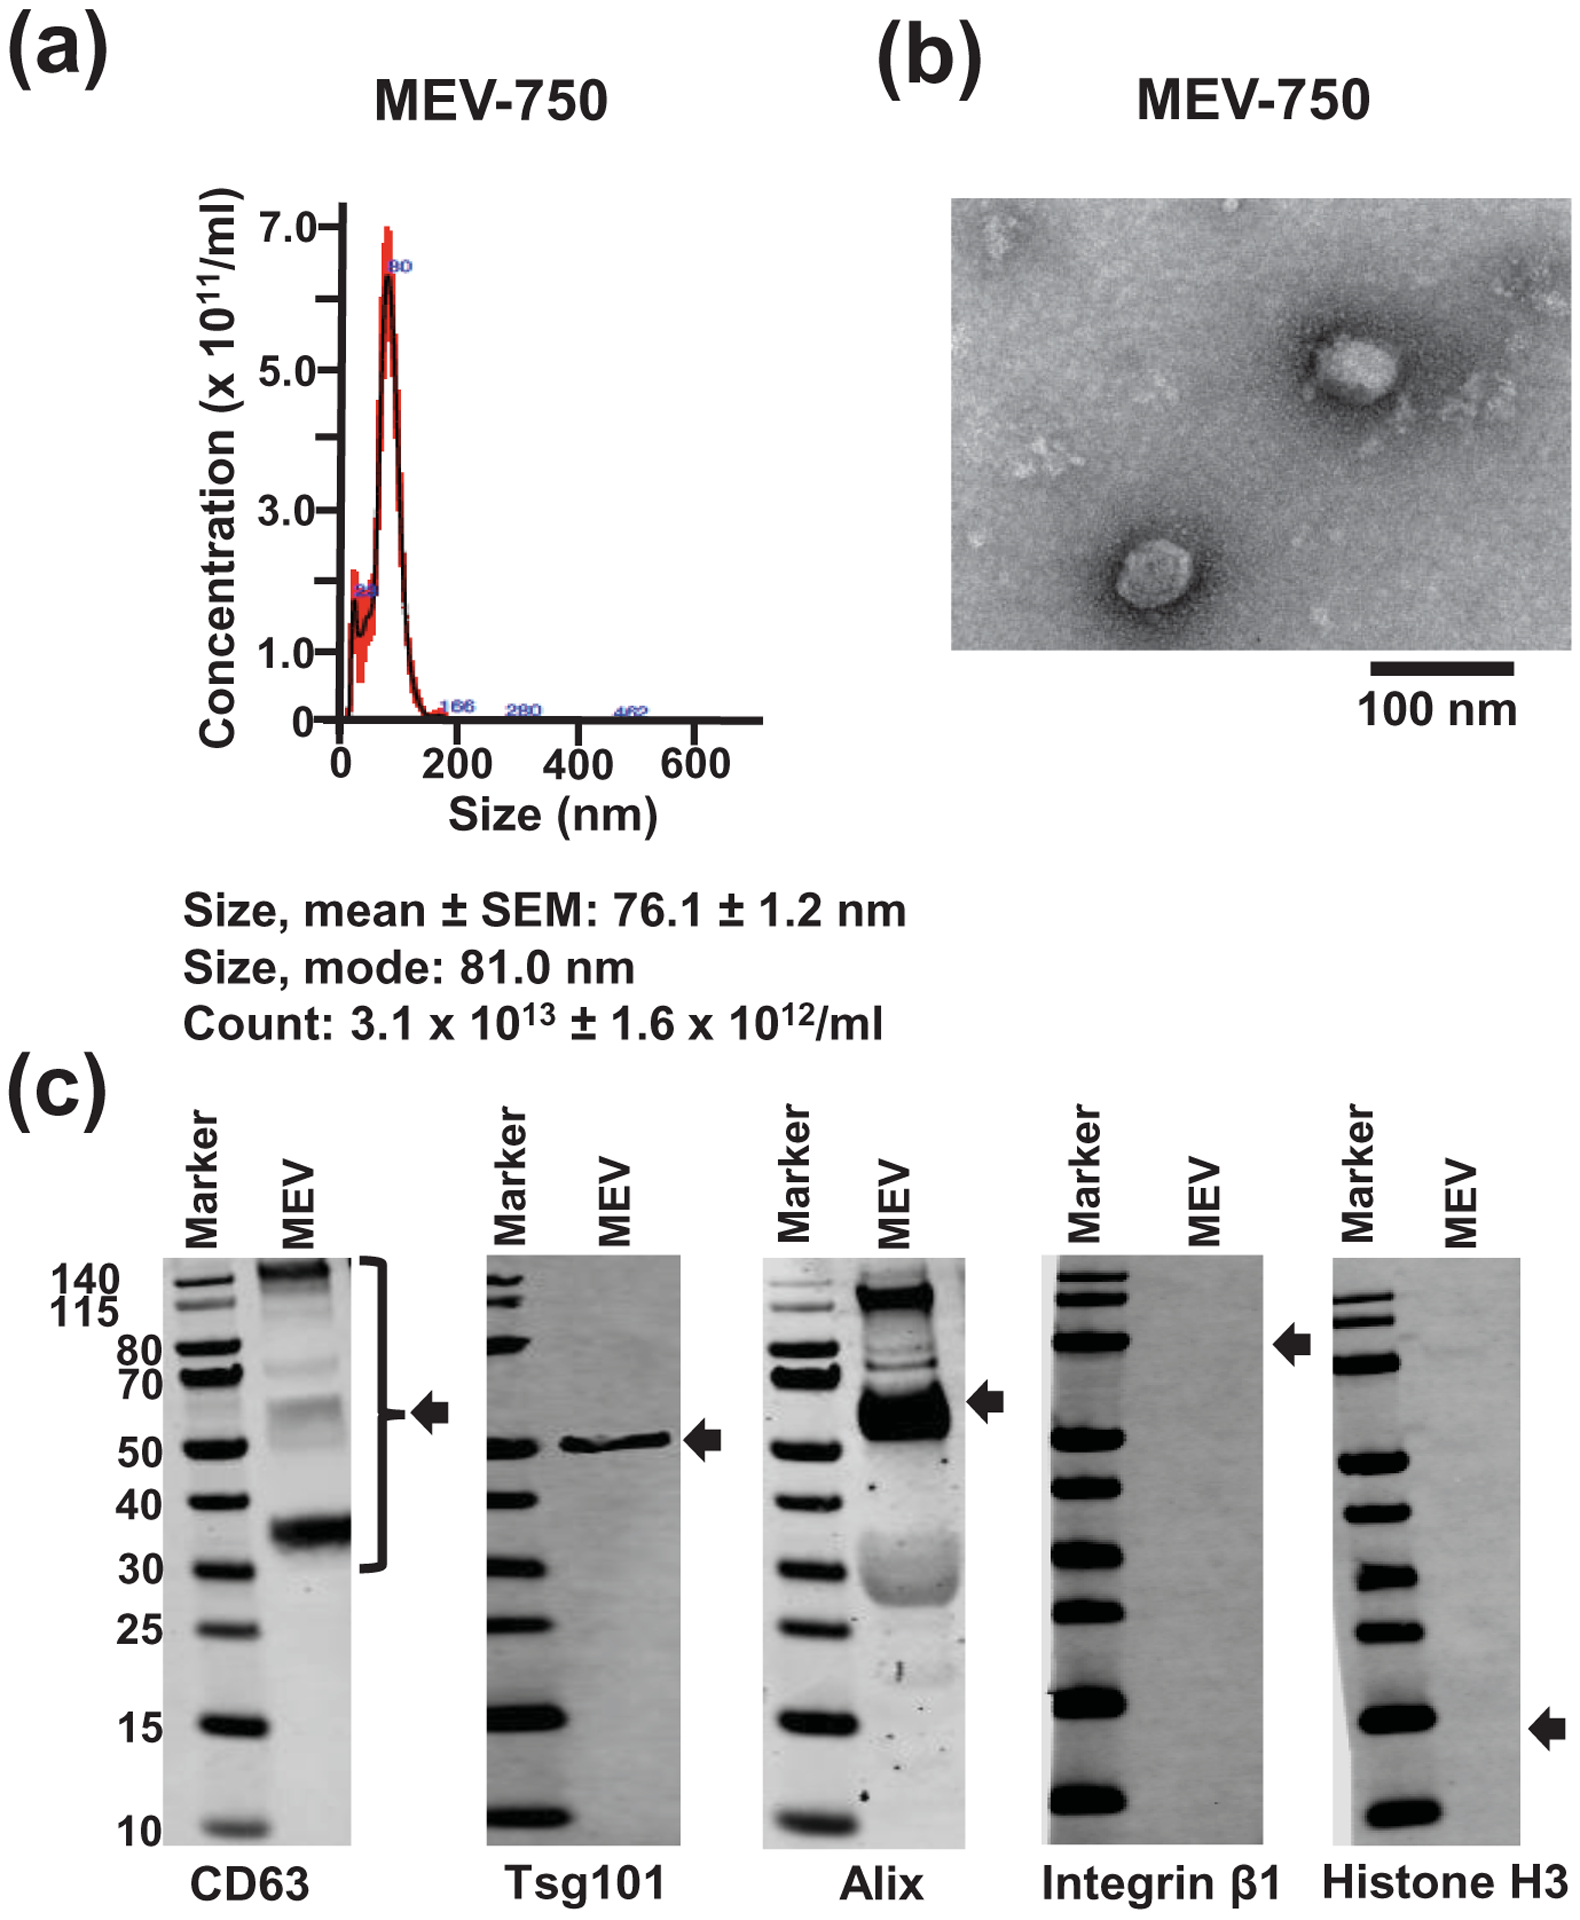
(a) Nanoparticle tracking analysis of HiLyte™-labeled sMEVs (MEV-750). Representative size distribution and trace of three technical replicates from one of three independent MEV-750 samples. Values are expressed as mean ± SEM. (b) Transmission electron microscopy analysis of MEV-750. (c) Immunoblot analysis of unlabeled sMEVs (MEV). Lanes were electronically re-arranged.
3.2. Bioavailability, distribution, and excretion of sMEVs
Fecal excretion is an important metric when assessing the apparent bioavailability of orally ingested compounds. Cumulative excretion data suggest that 55 ± 3.0% and 52.7 ± 5.9% of MEV-750 escaped absorption and were excreted in feces in males and females, respectively, within 24 h after oral gavage (Fig. 2a; p > 0.05 males versus females). The bulk of MEV-750 was excreted within 6 h and fecal excretion approached baseline levels 24 h after oral gavage in both males and females (Fig. 2b). The levels of MEV-750 reached peak concentrations in the intestinal mucosa and plasma 6 h after oral gavage and approached baseline values 24 h after gavage in both males and females (Figs. 3 and 4a). The HiLyte™−750 detected in plasma was linked to sMEV. When plasma sEVs were precipitated with PEG, most of the fluorescence was associated with the pellet, whereas only residual fluorescence was detectable in the supernatant (Fig. 4b). The fluorescence was unexpectedly in plasma from females at time 0 h. We repeated the experiment several times and always observed strong fluorescence in females at time 0 h. When the pellet was suspended in PBS, the fluorescent sEVs had a diameter of 97 ± 2.6 nm (n = 3 independent samples); three technical replicates from one of the samples are shown in Supplementary Fig. 1a. Plasma sEVs presented as spherical, membranous structures and were finely dispersed in PBS (Supplementary Fig. 1b). The pellet tested positive for exosome marker proteins (CD63, Alix, and Tsg101) and a microvesicle marker protein (integrin β1; Supplementary Fig. 1c). The presence of microvesicles in the fluorescent pellet does not mean that the label transferred from bovine sEVs to endogenous microvesicles but suggests that PEG precipitated both classes of EVs in plasma. sMEVs in plasma reached peripheral tissues. Primary sites of accumulation included intestinal mucosa, liver, brain, bone, and thymus (Fig. 5, Table 1); accumulation was maximal 12 h and returned to baseline levels 24 h after oral gavage, respectively. The excretion of MEV-750 in urine peaked at 6 h and returned to baseline 24 h after oral gavage, respectively (Fig. 6). While the excretion of MEV-750 in urine provided robust information on time courses of excretion, we were concerned that small volumes of urine escaped collection. We decided to err on the side of caution and did not use urine data for calculating the apparent bioavailability of MEV-750.
Figure 2: Fecal excretion of orally administered sMEVs in mice.
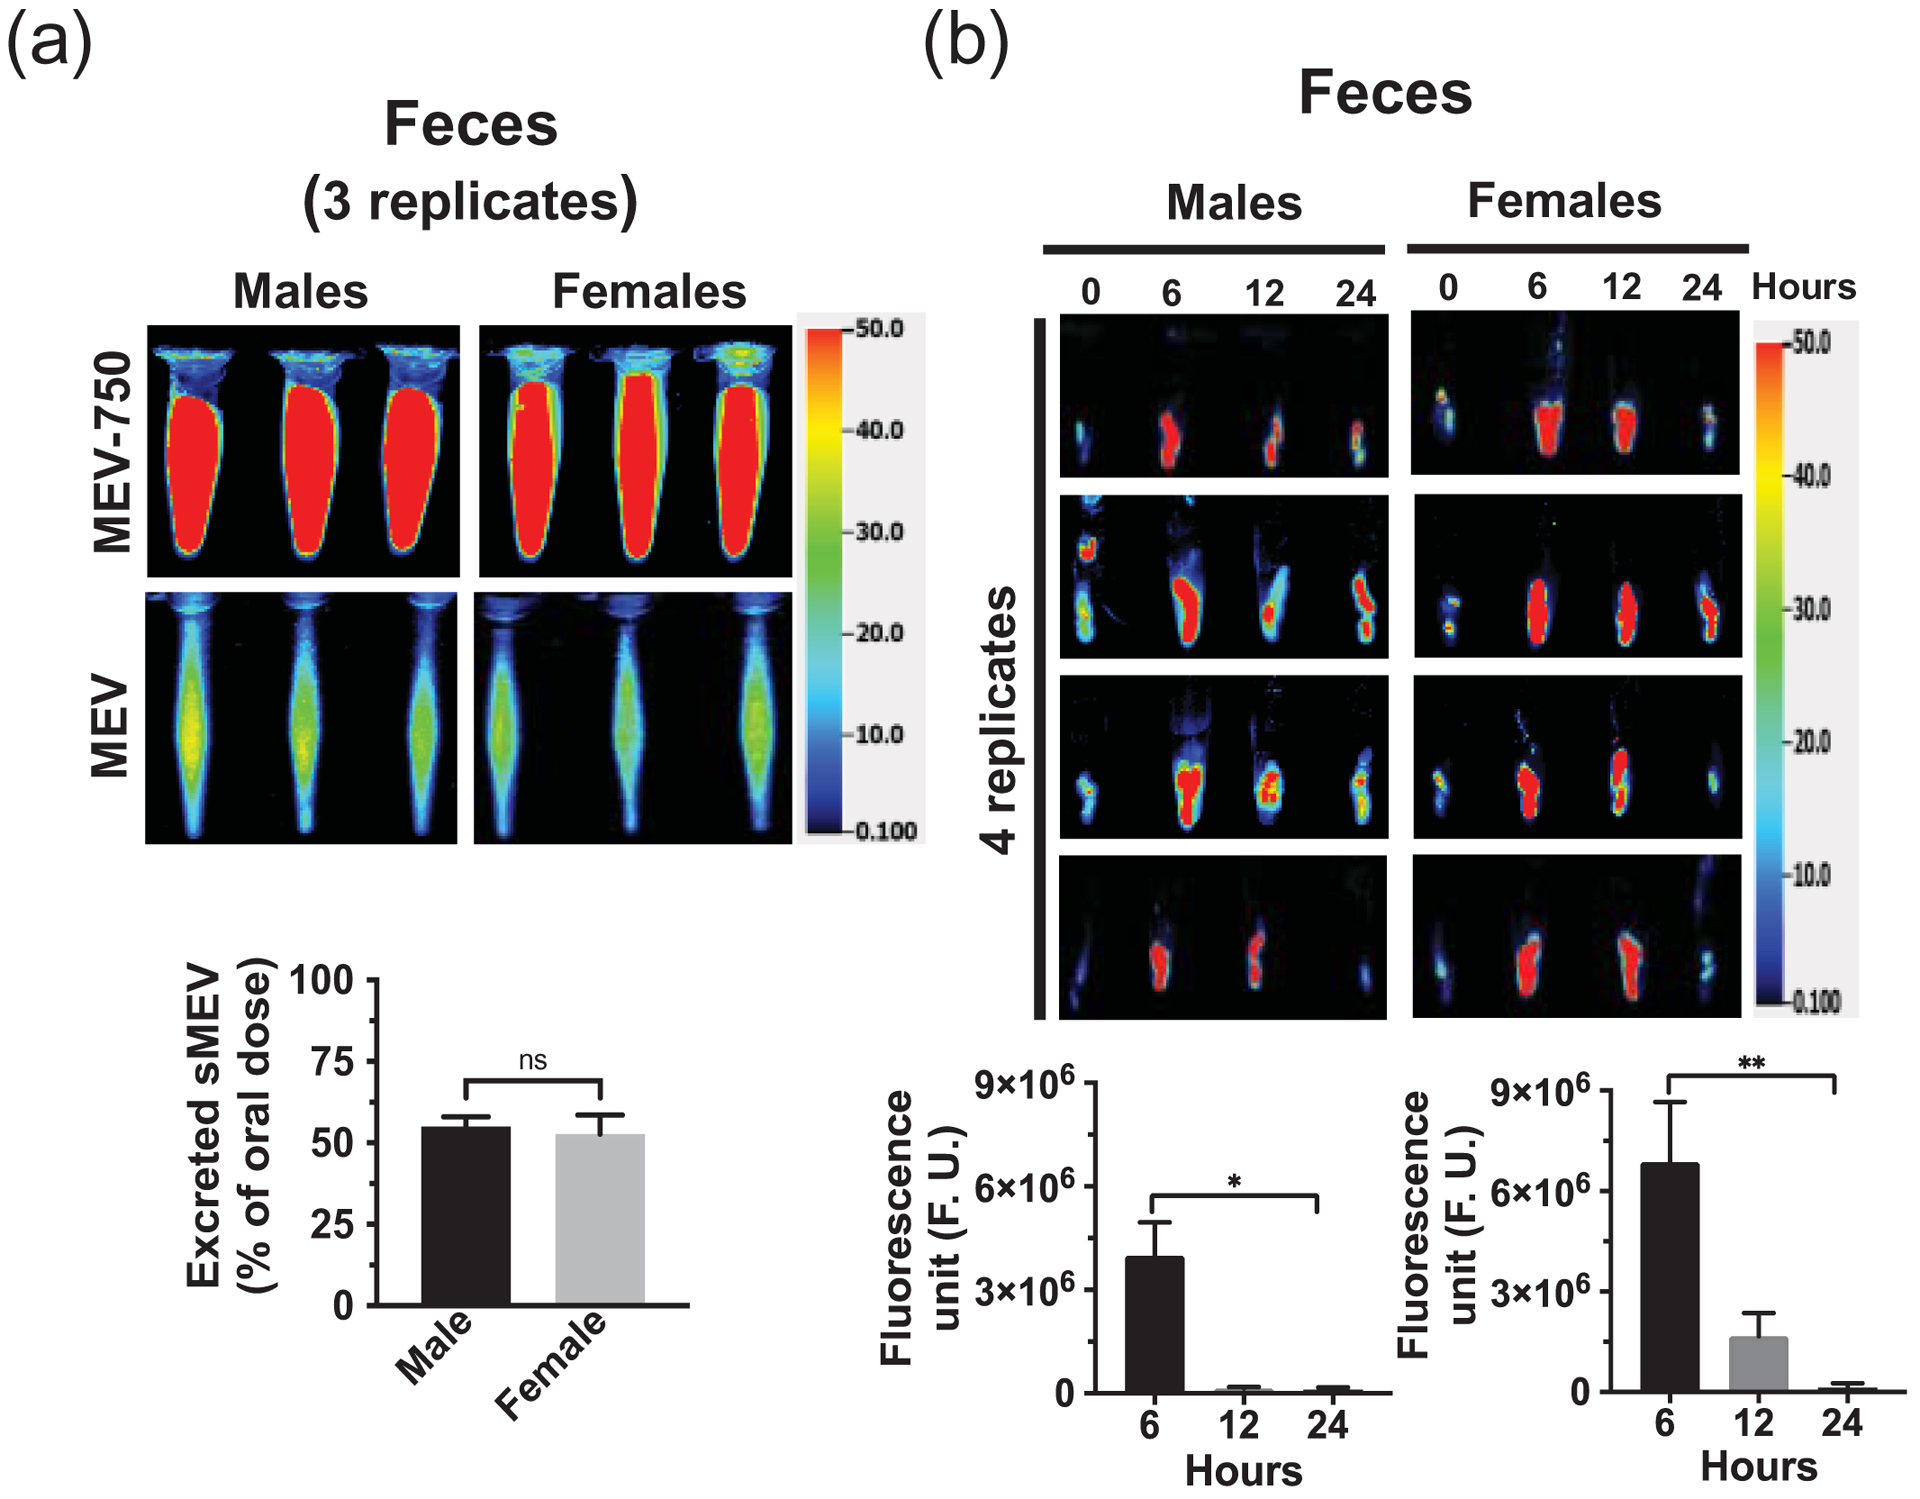
(a) Cumulative excretion of HiLyte™-labeled sMEVs (MEV-750) in feces during 24 h after oral administration. Upper panel: fluorescence in 1 ml out of 10 ml fecal suspension in PBS pooled from the 24-h period following the oral gavage of HiLyte™-labeled sMEVs (MEV-750; n = 3 mice/sex). Middle panel: fluorescence in 1 ml out of 10 ml fecal suspension in PBS pooled from the 24-h period following the oral gavage of unlabeled sMEVs (n = 3 mice/sex). Bottom panel: percent of orally administered MEV-750 excreted during the 24-h observation period in males and females. (b) Fecal samples collected from male and female mice at timed intervals (n=4 mice/sex). Left: individual images. Right: quantitative analysis of fluorescent in 100 mg of feces in males (left) and females (right). Values are expressed as mean ± SEM (*p < 0.05, **p < 0.01, ns p > 0.05).
Figure 3: Accumulation of orally administered sMEVs in the murine gastrointestinal tract.
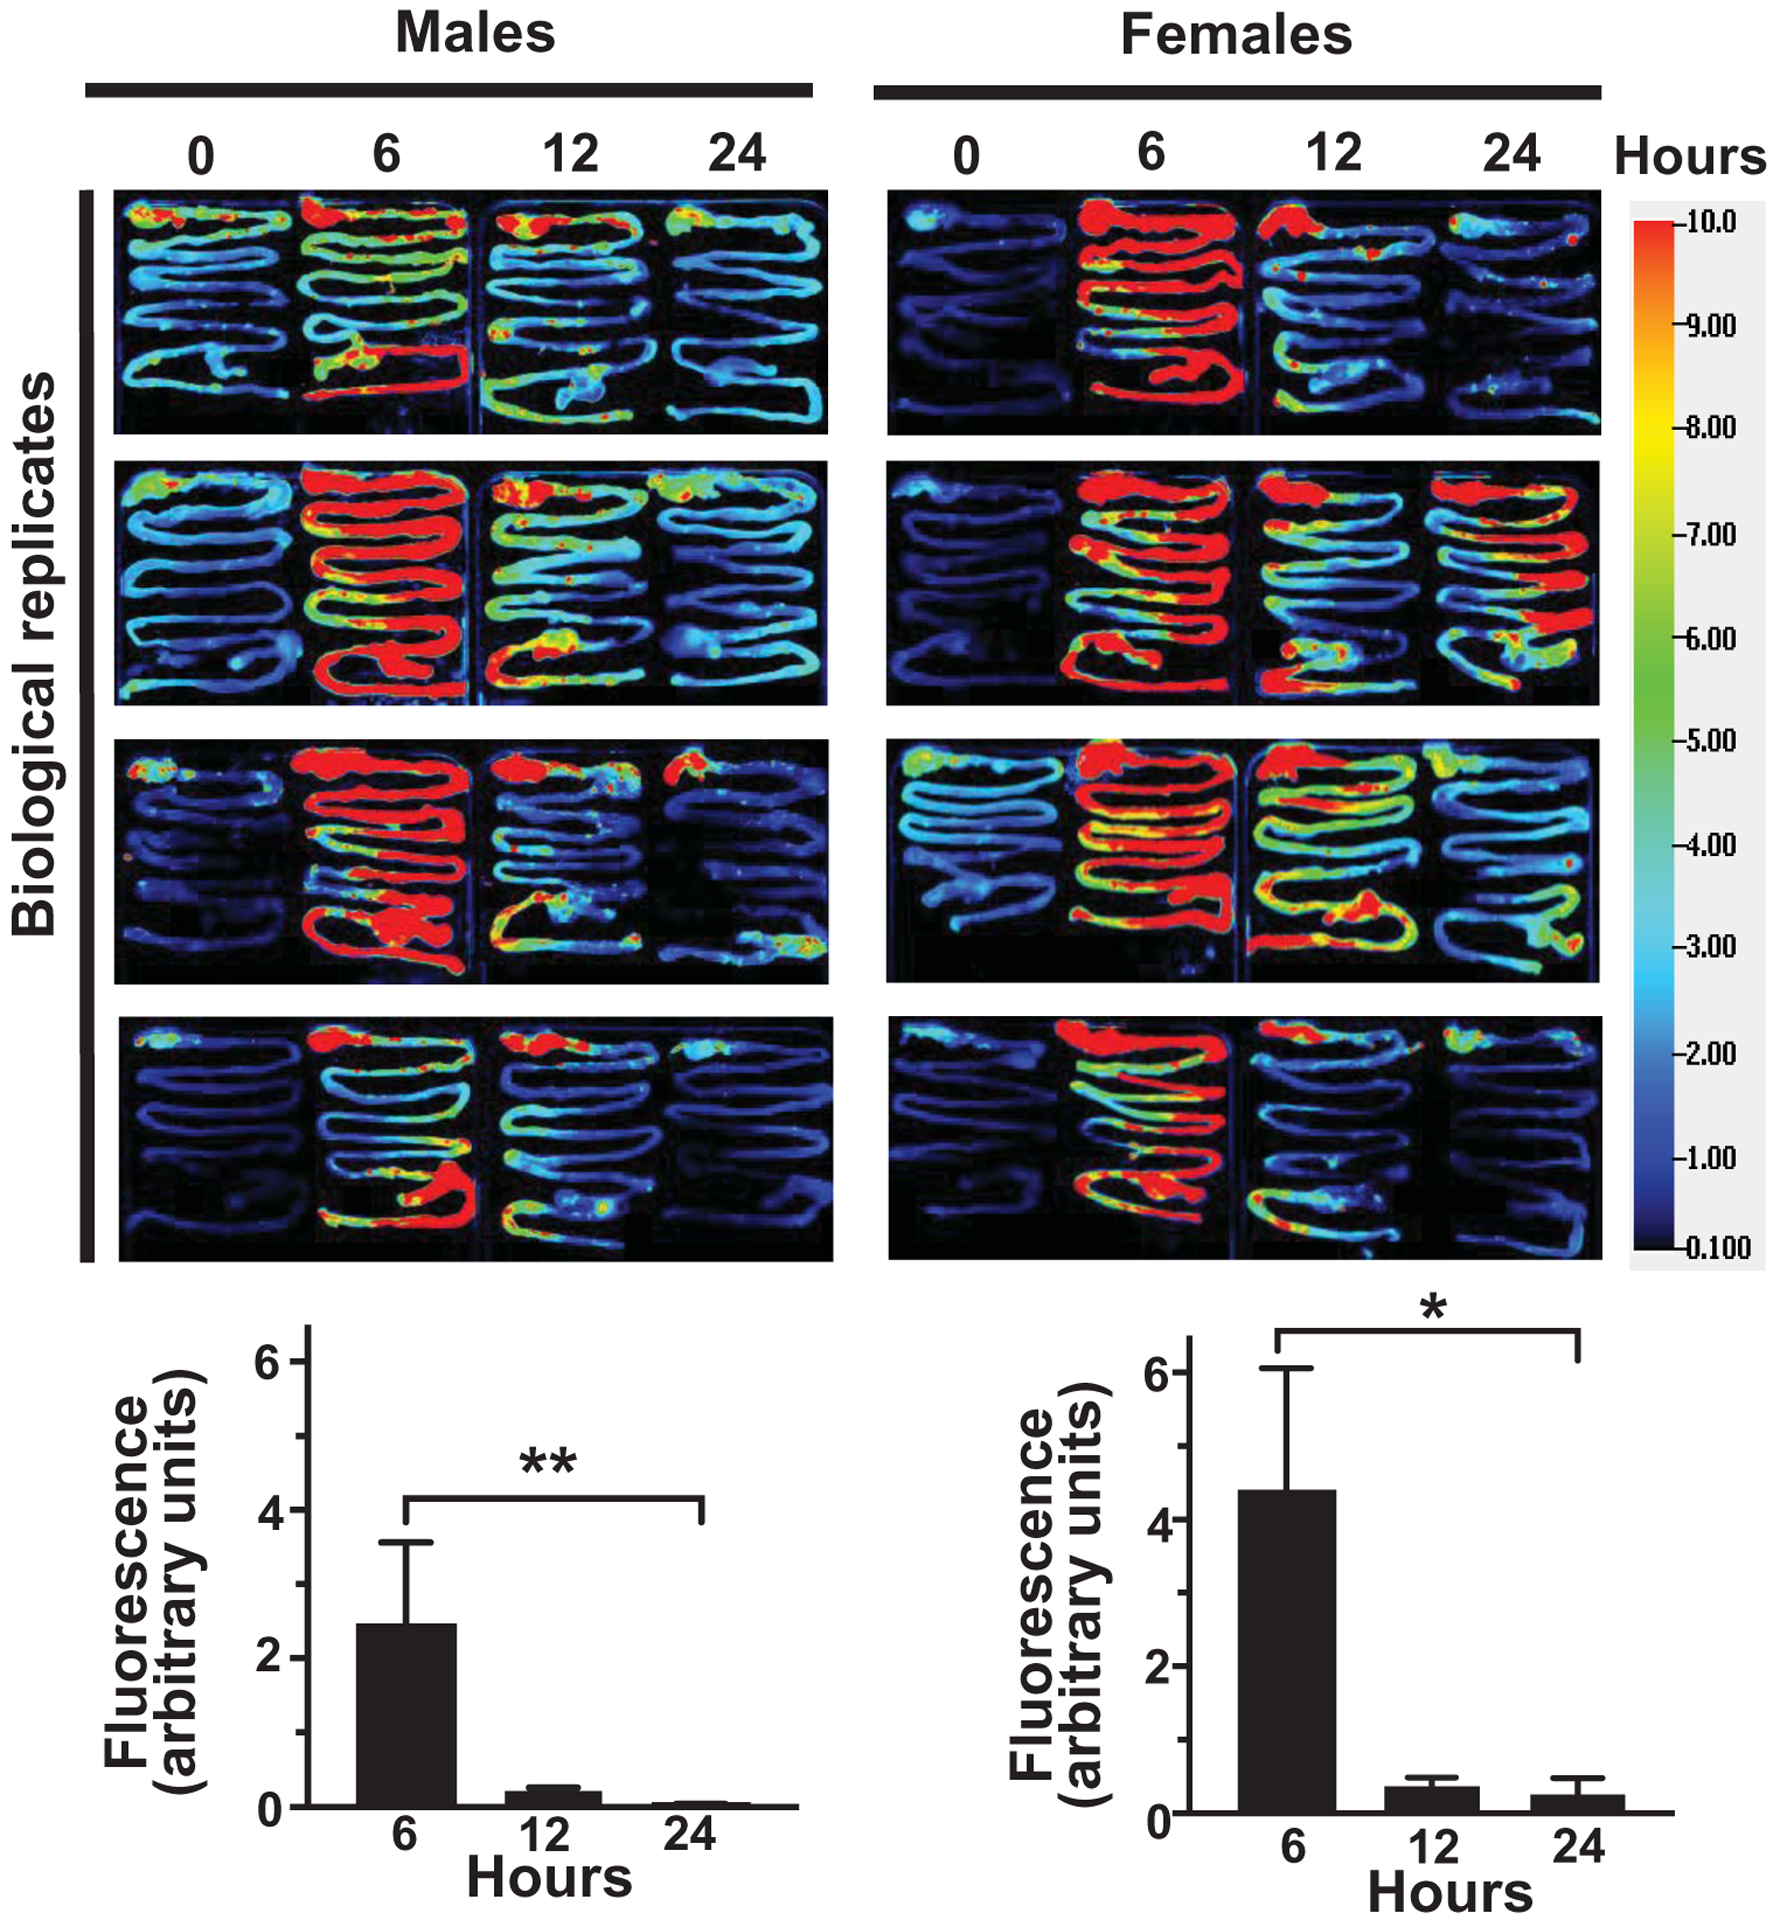
Time courses of HiLyte™-labeled sMEVs (MEV-750) fluorescence in gastrointestinal tract. In the upper panel, representative images of gastrointestinal tracts at different time points following the oral gavage of HiLyte™-labeled sMEVs (MEV-750) in male and female mice (4 mice per sex). In the lower panel, densitometry analysis of background-corrected fluorescence units in male (left) and female mice (right). All data represent 4 independent experiments. Values are expressed as mean ± SEM (*p < 0.05 or **p < 0.01).
Figure 4: Bioavailability of sMEVs in murine plasma.
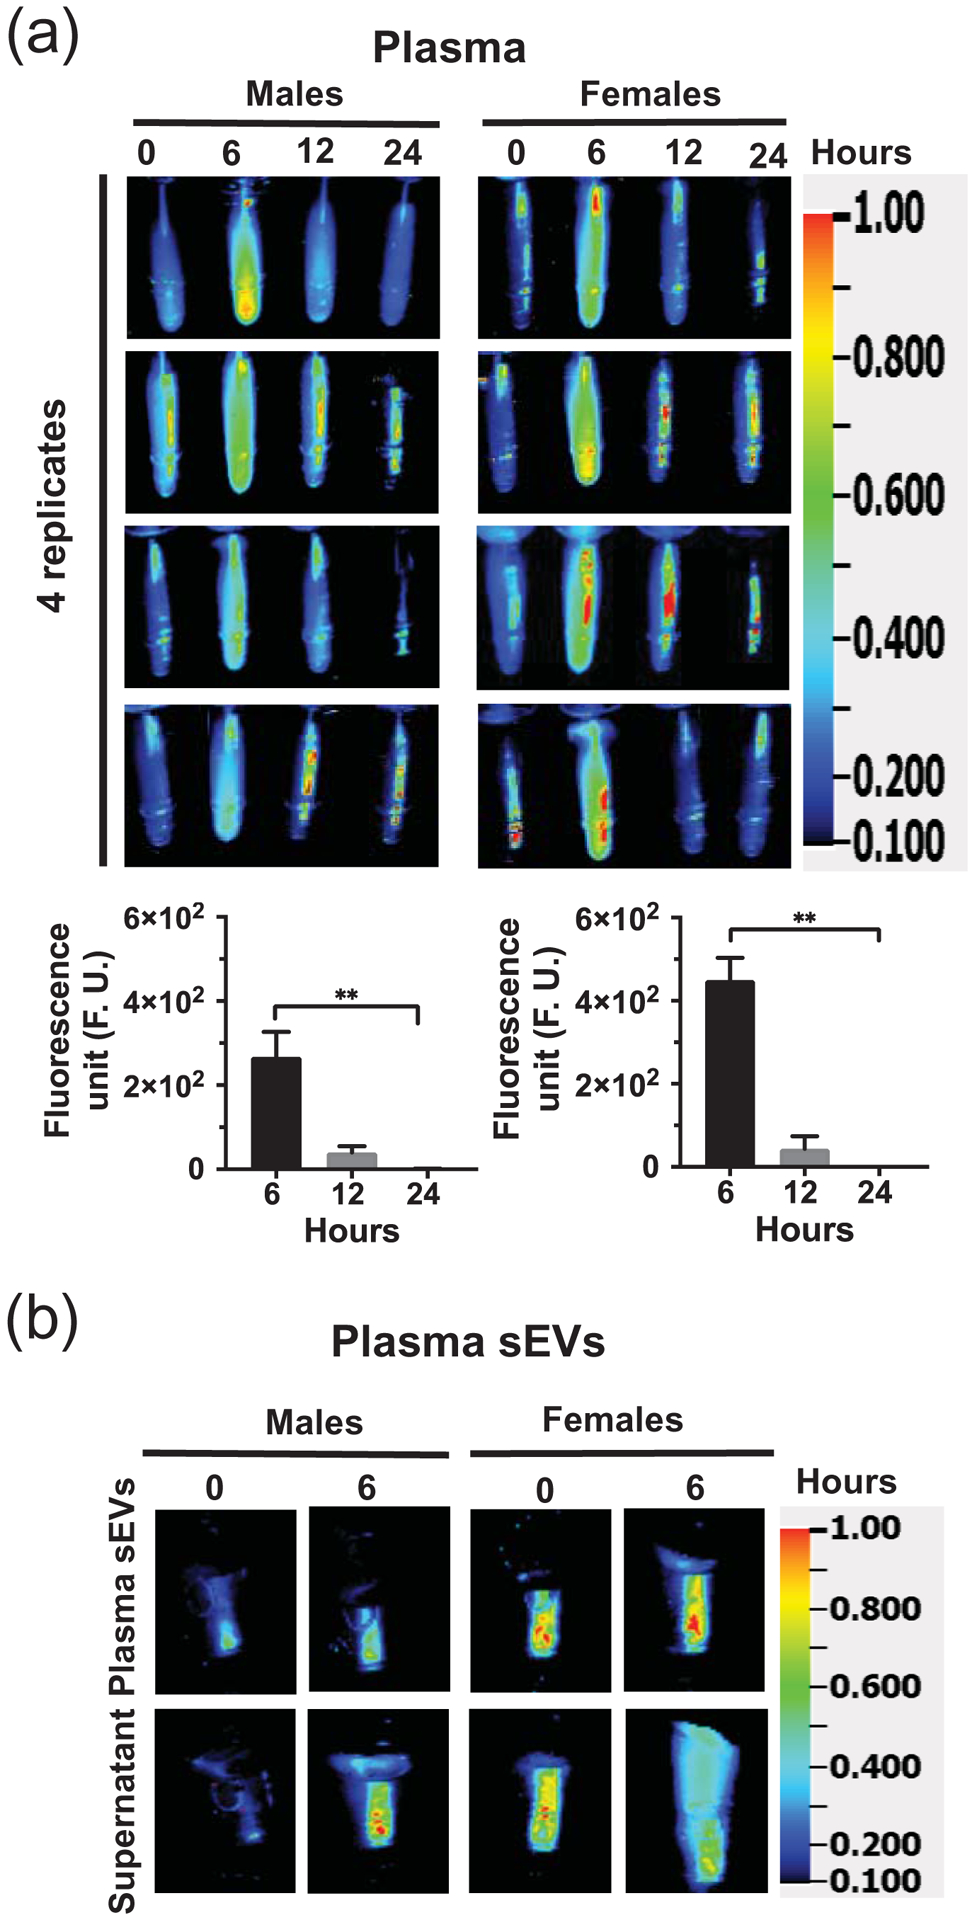
Time courses of HiLyte™-labeled sMEVs (MEV-750) fluorescence in plasma and association of fluorescence to plasma sEVs. (a) Time courses of HiLyte™-labeled sMEVs (MEV-750) fluorescence in plasma following MEV-750 administration by oral gavage. Upper panel: MEV-750 in plasma collected at timed intervals following MEV-750 administration in male and female mice (4 mice per sex). Lower panel: Quantitative analysis of time courses, normalized by background (time 0 h). Values are expressed as mean ± SEM (**p < 0.01, n = 4 mice/sex). (b) Representative images of plasma small extracellular vesicles (sEVs) precipitated with polyethylene glycol and resuspended in phosphate-buffered saline.
Figure 5: Distribution of orally administered sMEVs in peripheral murine tissues.
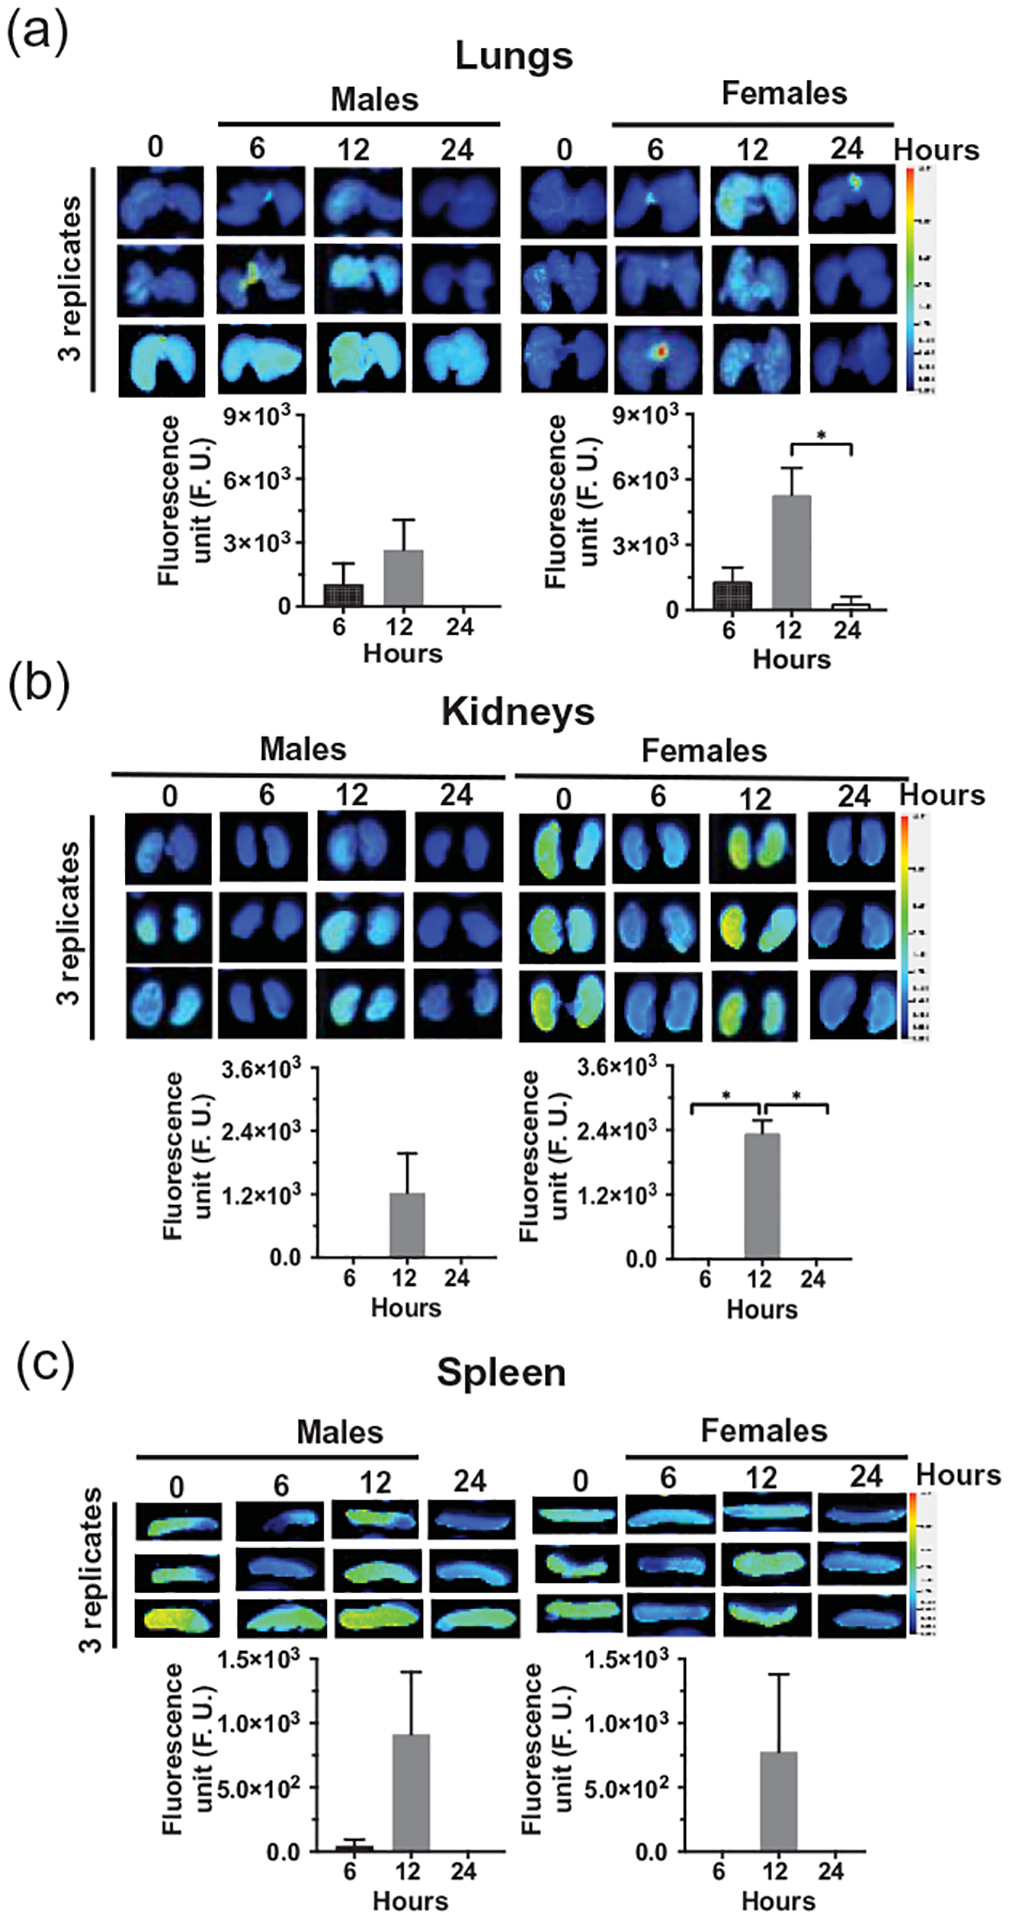
Time courses of HiLyte™-labeled sMEVs (MEV-750) fluorescence in tissues. The upper images in panels (a), (b), and (c) show representative examples of time courses of MEV-750 in lung, kidneys, and spleen, respectively, in male and female mice (3 mice per sex). The lower images in panels (a), (b), and (c) show the quantitative analysis of time courses in tissues, normalized by background (time 0 h). Values are expressed as mean ± SEM (*p < 0.05; n = 4 for kidneys and spleen; n = 3 for lung).
Table 1.
Distribution of MEV-750 in murine tissues.1
| Tissue | 6 h | 12 h | 24 h | |||
|---|---|---|---|---|---|---|
| Male | Female | Male | Female | Male | Female | |
| Liver | 6679±3951 | 6828±6828 | 7683±5061 | 7587±4566 | 2925±2925 | 5496±5285 |
| Spleen | 47 ± 47 | ND | 913±484 | 777±604 | ND | ND |
| Pancreas | ND | ND | 82 ± 43 | 509±489 | ND | 8491±8491 |
| Lung | 1052±970 | 1326±628 | 3066±1069 | 5290±1240 | 152±152 | 315±303 |
| Kidneys | ND2 | ND | 1228±743 | 2341±240 | ND | ND |
| Heart | 797±514 | 462±191 | 361±357 | 416±244 | 125±125 | 175±118 |
| Brain | 2580±670 | 2083±435 | 139±108 | 394±289 | 1882±591 | 1300±464 |
| Bone | 1674±389 | 1162±415 | 411±411 | 153 ± 90 | 1532±409 | 620±189 |
| Muscle | 406 ± 88 | 275 ± 67 | 32 ± 22 | 48 ± 22 | 113 ± 41 | 311±125 |
| eWAT2 | 313±115 | 264 ± 73 | 246 ± 88 | 78 ± 55 | 90 ± 67 | 122±109 |
| BAT2 | 1113±418 | 976±658 | ND | 38 ± 38 | 347±138 | 917±825 |
| Thymus | 2463±541 | 3330±329 | 369±225 | 322±124 | 1415±414 | 2158±958 |
| GI | 2472499± | 4407905± | 219913± | 369293± | 22346±15314 | 264562± |
| 1086825 | 1649237 | 34725 | 109890 | 201517 | ||
Value are background-corrected fluorescence (arbitrary units; mean ± SEM; N = 4 (except male lungs, N = 3).
BAT, brown adipose tissue; eWAT, epididymal white adipose tissue; GI, gastrointestinal tract; ND, not detectable.
Figure 6: Urinary excretion of orally administered sMEVs in mice.
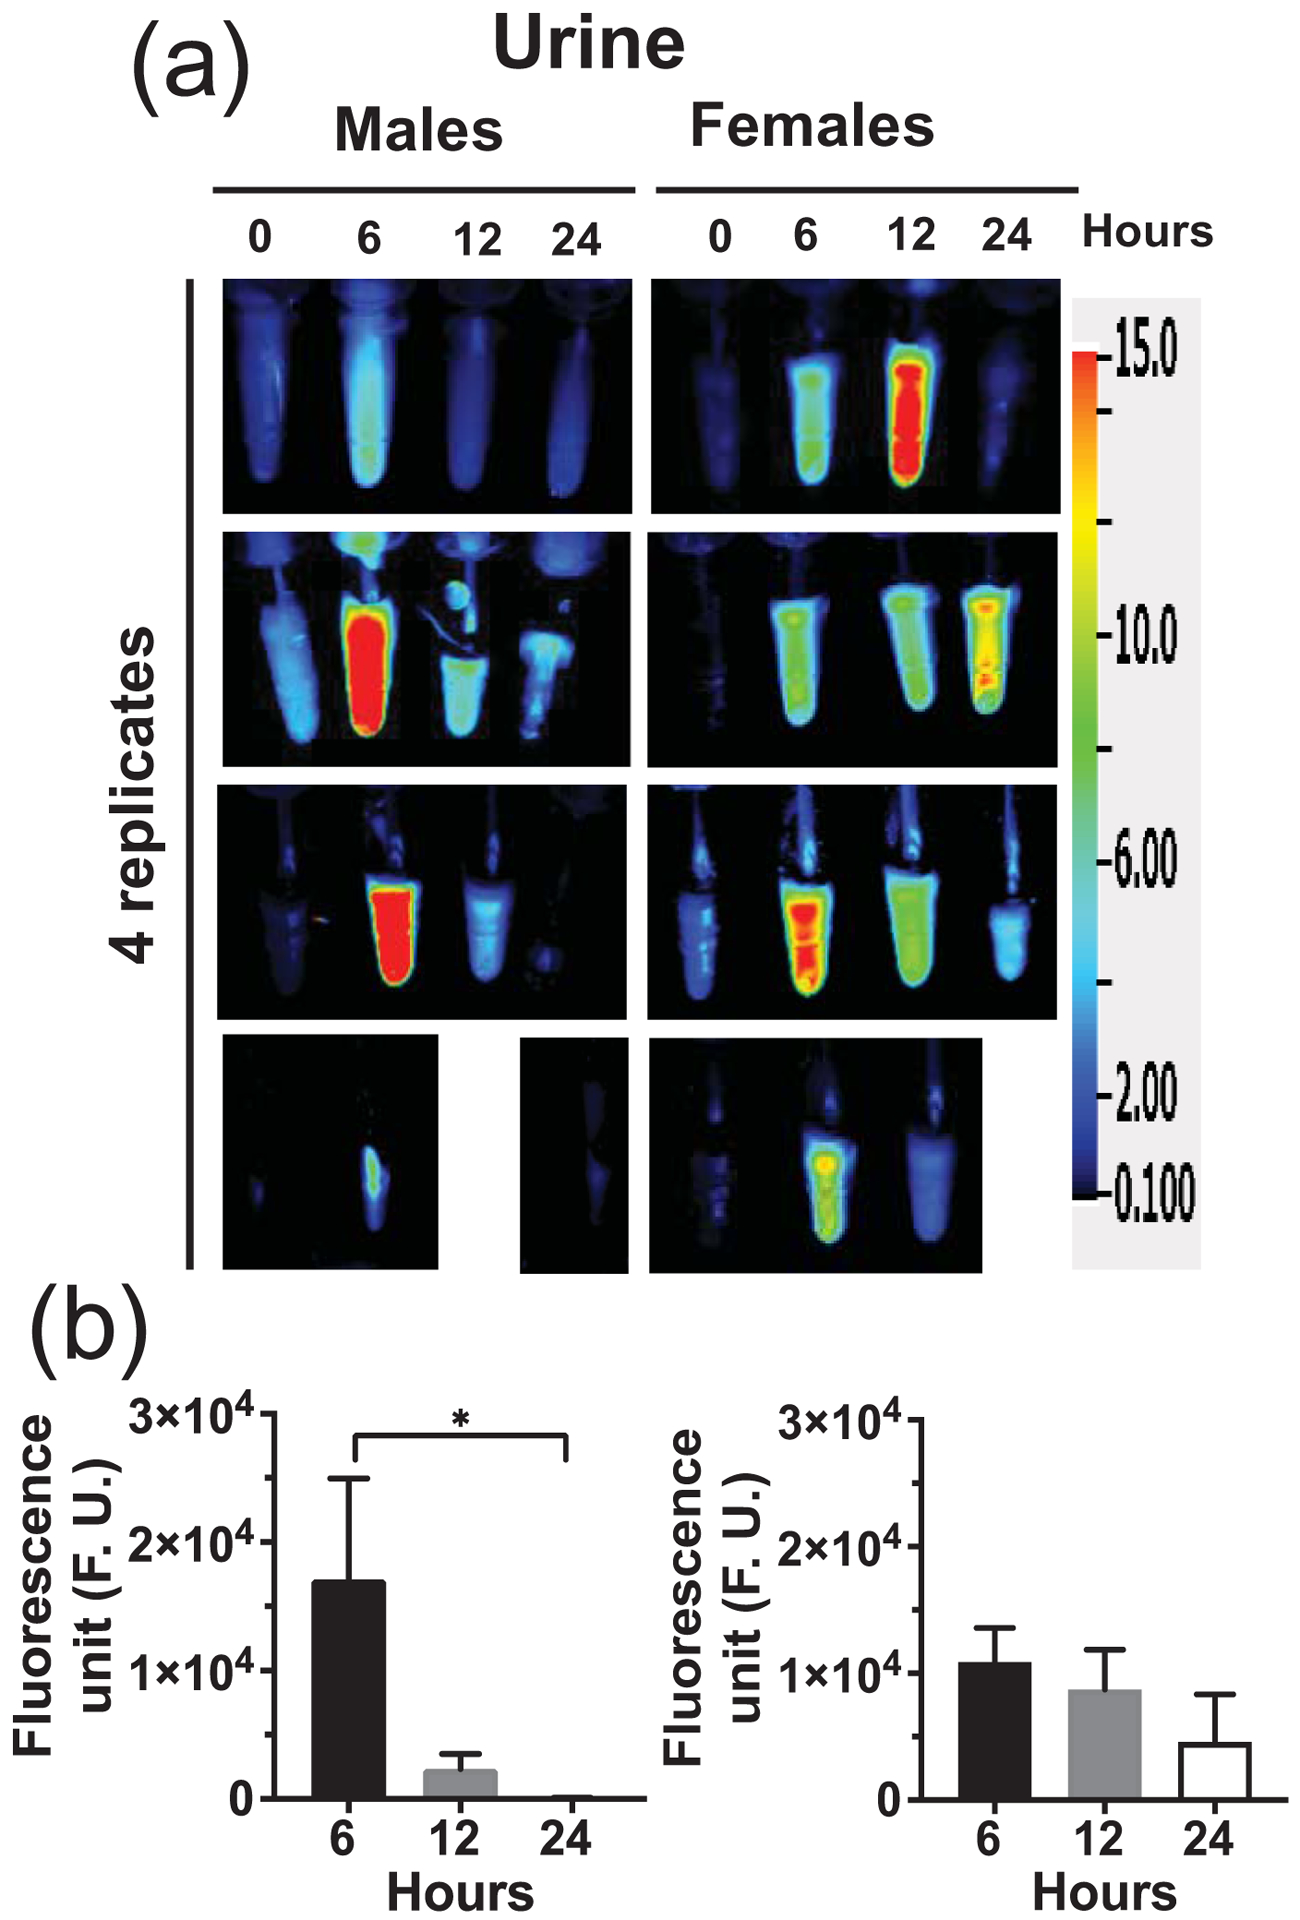
Time courses of HiLyte™-labeled sMEVs (MEV-750) fluorescence in urine. (a) Representative images of urines collected at timed intervals after oral gavage of HiLyte™-labeled sMEVs (MEV-750) in male and female mice (n = 4 mice per sex). Blank spaces denote missing samples. (b) Quantitative analysis of time courses in urine, normalized for background (time 0 h). Values are expressed as mean ± SEM (*p < 0.05; n = 4/sex).
3.3. Label stability
When plasma was fractionated by SEC, MEV-750 and plasma sEVs eluted in the same SEC fractions. MEV-750 in fractions 8 – 13 and the majority of plasma sEV eluted in fractions 5 and 9. No maximum could be identified when plasma was fractionated by SEC. Free HiLyte Fluor 750 did not elute in a discrete peak (data not shown). Letters after numerals identify pellets from 0.5-ml fractions that were suspended in 1.0 ml buffer and for which fluorescence values were multiped by factor 2 (Fig. 7c).
Figure 7: Fractionation of plasma by size exclusion chromatography.
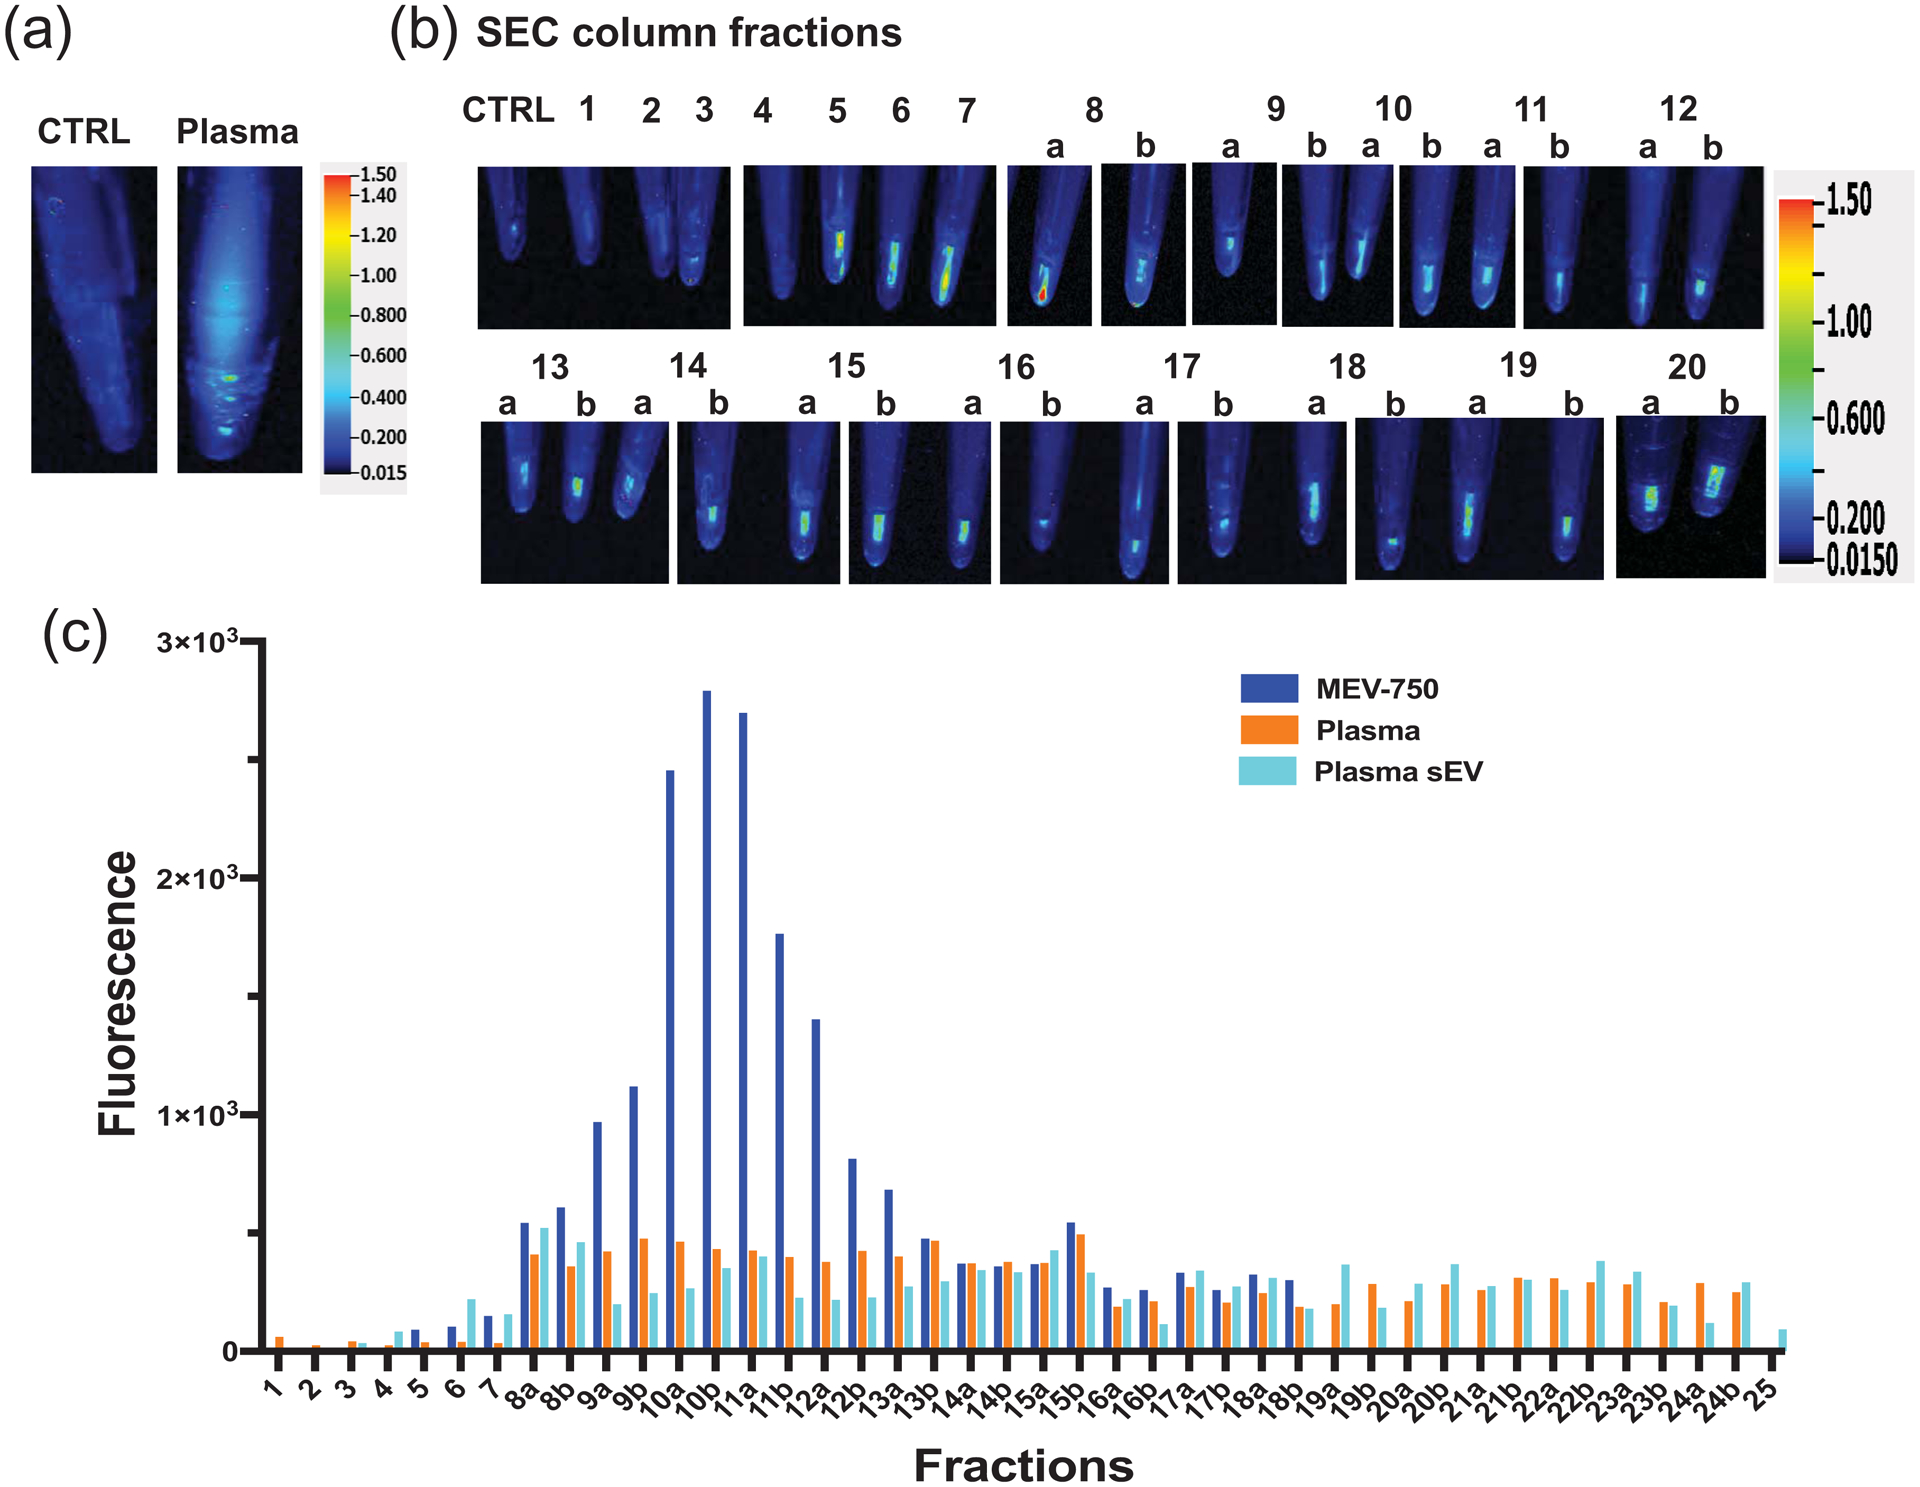
(a) Fluorescence of phosphate-buffered saline (PBS)-citrate control (CTRL) and input plasma pooled from 6-h time points. (b) Fluorescence of plasma fractionated by size exclusion chromatography (SEC) fractions; 1-mL fractions were precipitated by using poly ethylene glycol. Fractions identified by a and b were collected in 500-μL volumes to improve resolution and pellets were suspended in 1 mL of PBS-citrate. (c) Quantitative analysis of fluorescence in SEC fraction. Fluorescent values of samples identified with a and b were multiplied by factor to account for their greater dilution.
Label stability in artificial stomach fluid was different compared to plasma. The bulk of fluorescence eluted in fractions 8 – 14a (Fig. 8). Across these fractions, on average 75% of label was released by treatment. However, when MEV-750 was incubated in artificial intestinal fluid for 15 min to 2 h, no release of HiLyte from MEV-750 was observed. For example, 5.7 ± 0.2% was released in artificial intestinal fluid compared to 6.2 ± 0.3% in PBS controls after 2 h of incubation (n =3 independent samples; p > 0.05). These observations suggest that the bioavailability data likely represent the intestinal absorption of MEV-750 rather than the absorption of HiLyte released from MEV-750.
Figure 8: Fractionation of HiLyte™-labeled sMEVs (MEV-750) incubated in artificial gastric fluid by size exclusion chromatography.
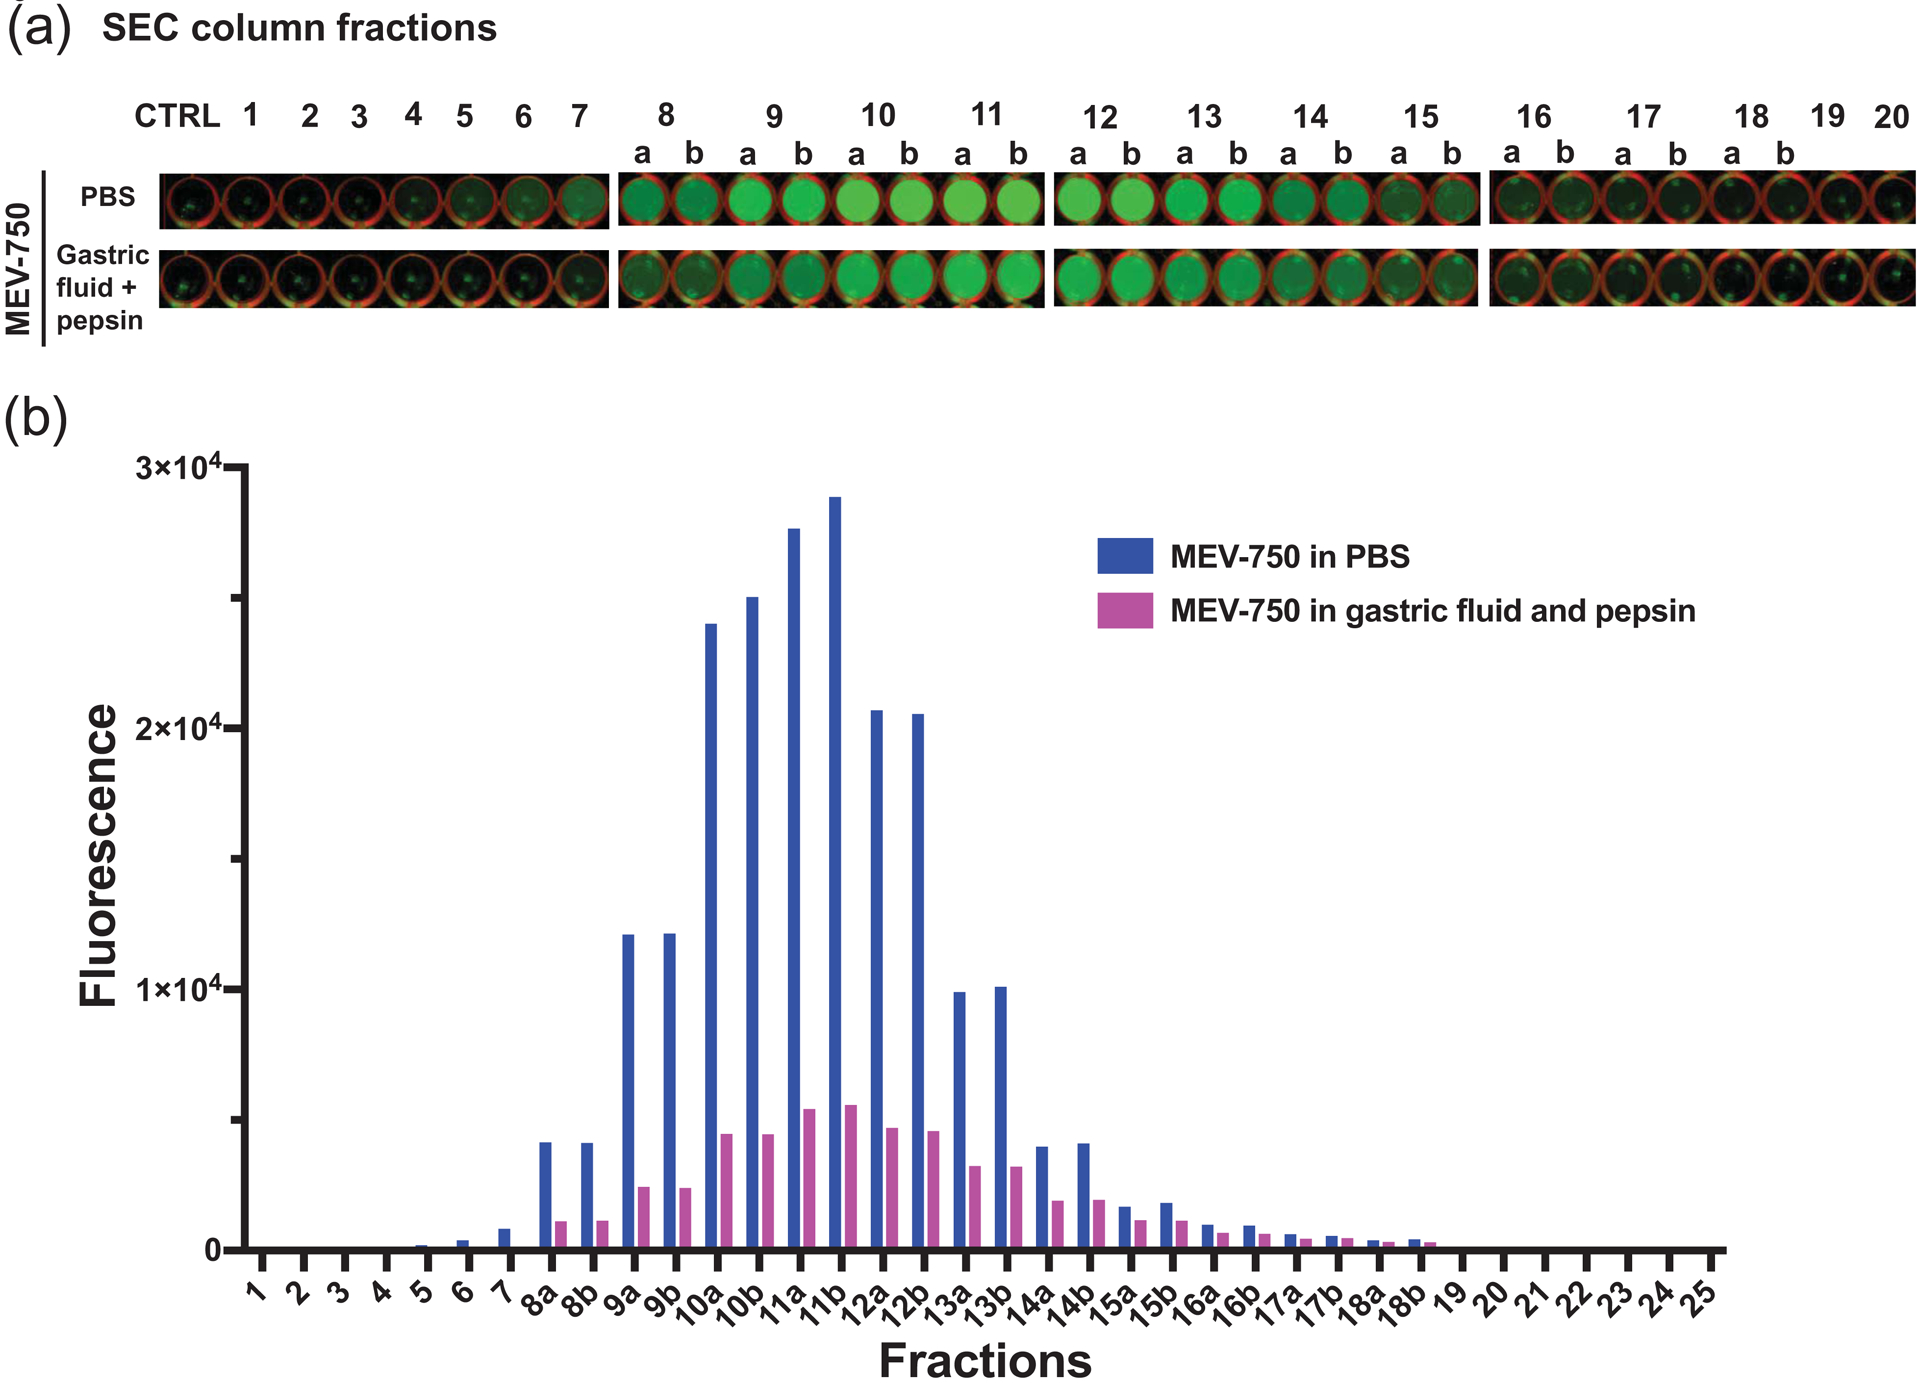
(a) Fluorescence of SEC fractions in 48-well plates. Letters after numerals denote MEV-750 pellets from 0.5-ml SEC fractions that were suspended in 1 ml of PBS-citrate. (b) Quantitative analysis of fluorescence in SEC fractions shown in panel a. Fluorescence values of samples identified with a and b were multiplied by 2 to account for their dilution.
4. Discussion
To our knowledge, this is the first study that quantified the bioavailability of bovine sMEVs through a comprehensive assessment of fecal excretion, concentration-time courses in plasma and tissues, and analysis of label stability in mice. Judged by fecal excretion, the apparent bioavailability of bovine sMEVs was approximately 45%, which speaks to the great potential of using bovine sMEVs for delivering drugs. The bioavailability reported in this paper exceeds a previous estimate of 25% bioavailability (Manca et al., 2018). In our previous report, we stated that the estimate for percent bioavailability “may not represent the true bioavailability” because it relied on using bovine sMEVs loaded with a single fluorophore-labeled microRNA (miR-320a) and comparing sMEV accumulation in a single tissue (liver) at a single time point following oral and intravenous administration. (The previous report was designed to assess bovine sMEV tissue distribution and compare sMEV labeling protocols rather than assessing bioavailability). While confidence is high that the bioavailability reported in this paper represents a sound approximation of the true bioavailability, there is the possibility that bioavailability exceeds 45%. For example, it is possible that some of the fecal sMEVs have gone through enterohepatic circulation, i.e., sMEVs were secreted back into the gastrointestinal lumen through bile after absorption. Enterohepatic circulation plays a role in the metabolism of cholesterol and bile acids and the absorption of lipids (van de Peppel et al., 2020). Similarly, it is possible that milk sMEVs were released into the intestinal lumen by the shedding of intestinal cells following absorption. Approximately 2 × 10⁸ cells are shed from the small intestine per day in mice (Williams et al., 2015). We acknowledge that it would be preferable to assess sMEV bioavailability based on urinary excretion rather than fecal excretion. However, we were concerned that some urine might have escaped collection, thereby underestimating sMEV bioavailability.
Concentration-time curves of bovine sMEVs followed the expected patterns in feces, plasma, urine, and tissues. For example, fecal excretion approached baseline levels 24 h after sMEV administration, which is consistent with a previous report that the gastrointestinal transit time is 24 h in mice (Yan et al., 2011). The concentration of bovine sMEVs in the intestinal mucosa peaked before reaching peak concentrations in plasma and urine, and sMEVs became detectable in peripheral tissues a few hours after peak plasma concentrations. Time curves in tissues are consistent with a previous report, which suggested that bovine sMEV concentrations in tissues peak within 18 h and return to baseline approximately 24 h after oral gavage (Manca et al., 2018).
Uncertainties remain regarding the distribution patterns of bovine sMEVs in murine tissues, stability of the HiLyte-sMEV bondage, and sex effects on bioavailability. Previous studies reported that sMEVs accumulate primarily in the intestinal mucosa, liver, spleen, and brain, whereas major sites of bovine sMEV accumulation also included lung and kidneys in this study (Manca et al., 2018, Munagala et al., 2016, Zhou et al., 2022). The minor differences in distribution may be explained using repeated or bolus administration of bovine sMEV, effects of dose, administration of sMEVs within or across species boundaries, and choice of label. For example, one study delivered milk sEVs through the natural route of suckling in mice for 17 days and reported a substantial accumulation in the intestinal mucosa, brain, and liver, whereas this study delivered a one-time dose of sMEVs across species boundaries from cow to mouse (Zhou et al., 2022). Another study loaded bovine sMEVs with fluorophore-labeled microRNAs and delivered a 10-fold higher dose than used in this study to mice, and reported accumulation in the intestinal mucosa, brain, liver, kidney, and spleen (Manca et al., 2018). A third study labeled bovine sMEVs with a lipophilic dye, and identified liver, spleen, lungs, and kidneys as primary sites of accumulation in mice (Munagala et al., 2016). Lipophilic dyes are known to transfer from sEV membranes to other lipophilic compounds and, therefore, are prone to produce artifacts in distribution studies (Takov et al., 2017). In this study, we demonstrated that the HiLyte-sMEV bond was stable in plasma, suggesting that the HiLyte-sMEV bondage remained intact after absorption or that the release of label was below the limit of detection. In contrast, approximately 75% of HiLyte label was released when HiLyte-labeled sMEVs were incubated in artificial stomach fluid. We propose that the covalent HiLyte label is superior compared to lipophilic membrane labels because of its apparent stability after absorption but that label release in the stomach needs to be taken into account. We did not detect effects of sex on sMEV bioavailability and distribution, because this study was not intended and powered to assess sex as independent variable. It appears that effects of sex are subtle. We have no explanation for why the fluorescence was strong in plasma from females but not males at time 0 h.
We conclude that the apparent bioavailability of bovine sMEVs is higher than previously thought. Now that the time frames of concentration-time curves have been established, future studies may focus on conducting in-depth pharmacokinetic studies of sMEVs in both sexes at different ages and perhaps include dose-response studies. It might be worthwhile to identify a label that resists release from sMEVs in the stomach.
5. Conclusions
We conclude that mice absorb approximately 45% of orally administered bovine sMEVs accumulate in distinct peripheral tissues.
Supplementary Material
Supplementary Figure 1: Characterization of plasma sEVs. (a) Nanoparticle tracking analysis of size distribution and concentration from one out of three independent plasma sEV samples. (b) Transmission electron microscopy analysis of plasma sEVs. (c) Immunoblot analysis of plasma sEVs. Lanes were electronically re-arranged.
Acknowledgments
Dr. You Zhou from Microscopy Core Research Facility at the University of Nebraska-Lincoln assisted with transmission electron microscopy experiments. The Microscopy Core Research Facility receives support from the Nebraska Research Initiative, the National Institutes of Health (General Medicine, National Centers of Biomedical Research Excellence), a donation from the Ken Morrison Family, and The Nebraska University Foundation. Dr. Haichuan Wang in the Department of Nutrition and Health Sciences at the University of Nebraska-Lincoln advised during the preparation of the first draft of this manuscript. The Biomedical and Obesity Research Core (BORC) in the Nebraska Center for the Prevention of Obesity Disease through Dietary Molecules at the University of Nebraska-Lincoln provided research instrumentation. The BORC receives support from NIH (NIGMS) award 2P20GM104320.
Funding
This work was supported by the National Institutes of Health (grant number P20GM104320), the National Institute of Food and Agriculture (grant number 2022-67021-36407), the SynGAP Research Fund, and the United States Department of Agriculture (grant numbers W-4002 and Hatch NEB-36-096) to J. Zempleni. J. Zempleni is a consultant for PureTech Health, Inc.
Abbreviations:
- MEV-750
HiLyte™ 750-labeled sMEVs
- MEV
unlabeled sMEVs
- PEG
polyethylene glycol
- sMEVs
small milk extracellular vesicles
- sEVs
small extracellular vesicles
- PBS
phosphate-buffered saline
- SEC
size exclusion chromatography
- SEM
standard error of the mean
- siRNA
small interfering RNA
- TEM
transmission electron microscopy
Footnotes
Credit authorship contribution statement
Afsana Khanam: investigation, formal analysis, and writing original draft. Alice Ngu: investigation. Janos Zempleni: conceptualization, funding acquisition, validation, supervision, project administration, and writing (review and editing).
Publisher's Disclaimer: This is a PDF file of an unedited manuscript that has been accepted for publication. As a service to our customers we are providing this early version of the manuscript. The manuscript will undergo copyediting, typesetting, and review of the resulting proof before it is published in its final form. Please note that during the production process errors may be discovered which could affect the content, and all legal disclaimers that apply to the journal pertain.
6. References
- Alvarez-Erviti L, Seow Y, Yin H, Betts C, Lakhal S, Wood MJ, 2011. Delivery of siRNA to the mouse brain by systemic injection of targeted exosomes. Nat Biotechnol. 29, 341–345. https://doi: 10.1038/nbt.1807. [DOI] [PubMed] [Google Scholar]
- Aqil F, Munagala R, Jeyabalan J, Agrawal AK, Kyakulaga AH, Wilcher SA, Gupta RC, 2019. Milk exosomes - Natural nanoparticles for siRNA delivery. Cancer Lett. 449, 186–195. https://doi: 10.1016/j.canlet.2019.02.011. [DOI] [PubMed] [Google Scholar]
- Baier SR, Nguyen C, Xie F, Wood JR, Zempleni J, 2014. MicroRNAs are absorbed in biologically meaningful amounts from nutritionally relevant doses of cow’s milk and affect gene expression in peripheral blood mononuclear cells, HEK-293 kidney cell cultures, and mouse livers. J Nutr. 144, 1495–1500. https://doi: 10.3945/jn.114.196436 [DOI] [PMC free article] [PubMed] [Google Scholar]
- Benmoussa A, Lee CH, Laffont B, Savard P, Laugier J, Boilard E, Gilbert C, Fliss I, Provost P, 2016. Commercial dairy cow milk microRNAs resist digestion under simulated gastrointestinal tract conditions. J Nutr. 146, 2206–2215. https://doi: 10.3945/jn.116.237651. [DOI] [PubMed] [Google Scholar]
- Boing AN, van der Pol E, Grootemaat AE, Coumans FA, Sturk A, Nieuwland R, 2014. Single-step isolation of extracellular vesicles by size-exclusion chromatography. J Extracell Vesicles. 3, https://doi: 10.3402/jev.v3.23430. [DOI] [PMC free article] [PubMed] [Google Scholar]
- Garcia-Romero N, Madurga R, Rackov G, Palacin-Aliana I, Nunez-Torres R, Asensi-Puig A, Carrion-Navarro J, Esteban-Rubio S, Peinado H, Gonzalez-Neira A, Gonzalez-Rumayor V, Belda-Iniesta C, Ayuso-Sacido A, 2019. Polyethylene glycol improves current methods for circulating extracellular vesicle-derived DNA isolation. J Transl Med. 17, 75. https://doi: 10.1186/s12967-019-1825-3. [DOI] [PMC free article] [PubMed] [Google Scholar]
- Howard KM, Jati Kusuma R, Baier SR, Friemel T, Markham L, Vanamala J, Zempleni J, 2015. Loss of miRNAs during processing and storage of cow’s (Bos taurus) milk. J Agric Food Chem. 63, 588–592. https://doi: 10.1021/jf505526w. [DOI] [PMC free article] [PubMed] [Google Scholar]
- Izumi H, Kosaka N, Shimizu T, Sekine K, Ochiya T, Takase M, 2012. Bovine milk contains microRNA and messenger RNA that are stable under degradative conditions. J Dairy Sci. 95, 4831–4841. https://doi: 10.3168/jds.2012-5489. [DOI] [PubMed] [Google Scholar]
- Khanam A, Yu J, Zempleni J, 2021. Class A scavenger receptor-1/2 facilitates the uptake of bovine milk exosomes in murine bone marrow-derived macrophages and C57BL/6J mice. Am J Physiol Cell Physiol. 321, C607–C614. https://doi: 10.1152/ajpcell.00222.2021. [DOI] [PMC free article] [PubMed] [Google Scholar]
- Leiferman A, Shu J, Upadhyaya B, Cui J, Zempleni J, 2019. Storage of extracellular vesicles in human milk, and microRNA profiles in human milk exosomes and infant formulas. J Pediatr Gastroenterol Nutr. 69, 235–238. https://doi: 10.1097/mpg.0000000000002363. [DOI] [PMC free article] [PubMed] [Google Scholar]
- Leiferman A, Shu J, Grove R, Cui J, Adamec J, Zempleni J, 2018. A diet defined by its content of bovine milk exosomes and their RNA cargos has moderate effects on gene expression, amino acid profiles and grip strength in skeletal muscle in C57BL/6 mice. J Nutr Biochem. 59, 123–128. https://doi: 10.1016/j.jnutbio.2018.06.007 [DOI] [PMC free article] [PubMed] [Google Scholar]
- Manca S, Upadhyaya B, Mutai E, Desaulniers AT, Cederberg RA, White BR, Zempleni J, 2018. Milk exosomes are bioavailable and distinct microRNA cargos have unique tissue distribution patterns. Sci Rep. 8, 11321. https://doi: 10.1038/s41598-018-29780-1. [DOI] [PMC free article] [PubMed] [Google Scholar]
- Mendt M, Kamerkar S, Sugimoto H, McAndrews KM, Wu CC, Gagea M, Yang S, Blanko EVR, Peng Q, Ma X, Marszalek JR, Maitra A, Yee C, Rezvani K, Shpall E, LeBleu VS, Kalluri R, 2018. Generation and testing of clinical-grade exosomes for pancreatic cancer. JCI Insight. 3, e99263. https://doi: 10.1172/jci.insight.99263. [DOI] [PMC free article] [PubMed] [Google Scholar]
- Munagala R, Aqil F, Jeyabalan J, Gupta RC, 2016. Bovine milk-derived exosomes for drug delivery. Cancer Lett. 371, 48–61. https://doi: 10.1016/j.canlet.2015.10.020. [DOI] [PMC free article] [PubMed] [Google Scholar]
- Mutai E, Ramer-Tait AE, Zempleni J, 2020. MicroRNAs in bovine milk exosomes are bioavailable in humans but do not elicit a robust pro-inflammatory cytokine response. BMC exRNA. 2, 2. https://doi: 10.1186/s41544-019-0041-x. [DOI] [Google Scholar]
- Sadri M, Shu J, Kachman SD, Cui J, Zempleni J, 2020. Milk exosomes and microRNAs cross the placenta and promote embryo survival in mice. Reproduction. 160, 501–509. https://doi: 10.1530/REP-19-0521. [DOI] [PubMed] [Google Scholar]
- Schwarz R, Kaspar A, Seelig J, Kunnecke B, 2002. Gastrointestinal transit times in mice and humans measured with 27Al and 19F nuclear magnetic resonance. Magn Reson Med. 48, 255–261. https://doi: 10.1002/mrm.10207. [DOI] [PubMed] [Google Scholar]
- Milk produced per cow in the United States from 1999 to 2020 (in pounds) [database on the Internet] 2021. [cited 5/24/2021]. Available from: https://www.statista.com/statistics/194935/quantity-of-milk-produced-per-cow-in-the-us-since-1999/.
- Sukreet S, Pereira Braga C, An TT, Adamec J, Cui J, B. T, Zempleni J, 2021. Isolation of extracellular vesicles from byproducts of cheese making by tangential flow filtration yields heterogeneous fractions of nanoparticles. J Dairy Sci. 104, 9478–9493. https://doi: 10.3168/jds.2021-20300 [DOI] [PubMed] [Google Scholar]
- Takov K, Yellon DM, Davidson SM, 2017. Confounding factors in vesicle uptake studies using fluorescent lipophilic membrane dyes. J Extracell Vesicles. 6, 1388731. https://doi: 10.1080/20013078.2017.1388731. [DOI] [PMC free article] [PubMed] [Google Scholar]
- ThePharmaletter. PureTech out-licenses milk exosomes technology in $1 billion deal. 2018. [cited 07/20/2018]; Available from: https://www.thepharmaletter.com/article/puretech-out-licenses-milk-exosomes-technology-in-1-billion-deal.
- van de Peppel IP, Verkade HJ, Jonker JW, 2020. Metabolic consequences of ileal interruption of the enterohepatic circulation of bile acids. Am J Physiol Gastrointest Liver Physiol. 319, G619–G625. https://doi: 10.1152/ajpgi.00308.2020. [DOI] [PubMed] [Google Scholar]
- Williams JM, Duckworth CA, Burkitt MD, Watson AJ, Campbell BJ, Pritchard DM, 2015. Epithelial cell shedding and barrier function: a matter of life and death at the small intestinal villus tip. Vet Pathol. 52, 445–455. https://doi: 10.1177/0300985814559404. [DOI] [PMC free article] [PubMed] [Google Scholar]
- Wolf T, Baier SR, Zempleni J, 2015. The intestinal transport of bovine milk exosomes is mediated by endocytosis in human colon carcinoma caco-2 cells and rat small intestinal IEC-6 cells. J Nutr. 145, 2201–2206. https://doi: 10.3945/jn.115.218586. [DOI] [PMC free article] [PubMed] [Google Scholar]
- Yan L, Combs GF Jr., DeMars LC, Johnson LK, 2011. Effects of the physical form of the diet on food intake, growth, and body composition changes in mice. J Am Assoc Lab Anim Sci. 50, 488–494. [PMC free article] [PubMed] [Google Scholar]
- Zhou F, Ebea P, Mutai E, Wang H, S. S, Navazesh SE, Dogan H, Li W, Cui J, Ji P, Ramirez DMO, Zempleni J, 2022. Small extracellular vesicles in milk cross the blood-brain barrier in murine cerebral cortex endothelial cells and promote dendritic complexity in the hippocampus and brain function in C57BL/6J mice. Front Nutr. 9, 838543. https://doi:doi.org/ 10.3389/fnut.2022.838543. [DOI] [PMC free article] [PubMed] [Google Scholar]
Associated Data
This section collects any data citations, data availability statements, or supplementary materials included in this article.
Supplementary Materials
Supplementary Figure 1: Characterization of plasma sEVs. (a) Nanoparticle tracking analysis of size distribution and concentration from one out of three independent plasma sEV samples. (b) Transmission electron microscopy analysis of plasma sEVs. (c) Immunoblot analysis of plasma sEVs. Lanes were electronically re-arranged.


