

Abstract
Objectives:
This study evaluated the effectiveness of academic screening measures in relation to parent-reported diagnoses.
Design:
Multi-center, retrospective cohort study including structured interviews, questionnaires and chart reviews.
Setting:
Six North American cleft centers.
Participants:
Children (n = 391) with cleft lip and/or palate, ages 8 to 10 years of age (192 male) and their guardians were recruited during regular clinic visits.
Main Outcome Measures:
Parent and child ratings on the Pediatric Quality of Life Inventory (PedsQL) School Scale, child report on CleftQ School Scale, parent report on the Adaptive Behavior Assessment System-Third Edition Functional Academics (ABAS-FA) Scale and Child Behavior Checklist (CBCL) School Competency Scale, parent interview, and medical chart review.
Results:
Risk for concerns ranged from 12–41%, with higher risk reflected on the CBCL-SC compared to other measures. Males with cleft palate were consistently at the highest risk. Only 9% of the sample had a parent-reported diagnosis of a learning or language disability. Ratings from the ABAS-FA and CBCL-SC had the highest utility in identifying those with language and/or learning concerns.
Conclusions:
As cleft teams work to develop standardized batteries for screening and monitoring of patients, it is important to evaluate the effectiveness of measures in identifying those at highest risk. When screening for language and learning disorders, questions related to potential academic struggles, such as increased school effort or increased school distress, are most useful. Referrals for follow-up evaluation are recommended for those identified at high risk.
Keywords: Nonsyndromic clefting, Psychological assessment, Quality of life
Introduction
The diagnosis of a cleft of the lip and/or palate (CL/P) requires multidisciplinary collaboration for the diverse needs of patients across their lifespan. Experts in surgery, dentistry, orthodontics, otolaryngology, nursing, genetics, speech-language pathology, psychology, and other fields are often brought together to assist with care and management. Internationally, cleft teams have been called for a more standardized approach to screening a variety of clinically relevant areas of functioning.1 Regional working groups (e.g., EuroCleft,2 AmeriCleft,3 ScandCleft,4 and the Clinical Standards Advisory Group [CSAG]5) started the process of developing standardized metrics within disciplines. Recently, larger collaborative efforts have been made to create a standard collection of measures to be given at specific scheduled time points for purposes of assessing etiologies, treatments, outcomes, and impacts of cleft across disciplines (e.g., the International Consortium for Health Outcomes Measurement [ICHOM]6 and the Cleft Collective7, a UK based longitudinal cohort study). Such batteries would minimize the burden on families and enhance cross-institutional collaboration.
These projects take a multidisciplinary and developmental approach, with specific metrics measured in infancy, toddlerhood/preschool, school-aged, adolescence, and adulthood. Key domains of focus shared across these projects include: dental and oral health, speech/communication, appearance, psychosocial development, and cognition/vocational milestones. The focus of the current paper is on the measurement of cognition/vocational milestones and how this translates into screening for academic risk and possible learning disabilities.
Decades of research have documented a higher rate of learning concerns in children with CL/P, even among those without an associated syndrome.8,9 This increased risk has been identified through case/control10–12 and population-based studies.13–15 Research has focused heavily on language and reading given the nature of the cleft and impact on both speech and hearing. While results are mixed depending on method of measurement, inclusion/exclusion criteria, and comparison groups, most have found increased risk for language-based learning disorders (e.g., dyslexia11,16), with the highest risk among boys with palatal involvement.17,18 Studies evaluating neuropsychological patterns related to academic underachievement have found impairments in reading to be associated with deficits in phonological awareness19 and auditory working memory.11,12
Early identification and intervention for language and learning disorders is associated with the best outcomes for students.20 In their 2011 review, Rimrodt and Lipkin21 expressed the importance of early screening to identify increased learning effort (e.g., acting out in class, taking longer to complete work, demonstrating resistance or reluctance to do school work) and school distress (e.g., frequent failures, punishments for misbehavior, disengagement) among patients, before they result in school failure (e.g., retention, expulsion, dropping out). Using a medical model, recommendations for screening, obtaining relevant histories, and referral for further diagnostic testing were made.
Given that cleft care teams provide care for children from birth through adulthood, screening for cognitive issues has become a recognized service that approved clinics are expected to provide.22 However, clinic visits are lengthy with multiple specialists evaluating the child’s functioning across many areas. Despite the need for appropriate academic screening, current suggestions for standard protocols fall short; with an understandable emphasis on psychosocial concerns that unfortunately omit questions related specifically to academic struggles. ICHOM6 utilizes subscales from the self-report CLEFT-Q,23 including the School subscale that asks questions related to general psycho-social functioning within the school setting. Similarly, up to 5 years of age, the Cleft Collective resource24 includes the parent-report Ages and Stages Questionnaire, 3rd Edition25 (ASQ-3) and ASQ Social Emotional26 (SE) questionnaires. After the age of 5 years, the parent-report Strength and Difficulties Questionnaire27 (SDQ), and self-report Harter Self-Perception Profile28,29 (HSPP) are administered. Parents also provide responses to the Pediatric Quality of Life (PedsQL) Healthcare Satisfaction30 and Family Impact31 modules; but these are specific to perceptions of healthcare and parent/family functioning rather than child-specific functioning. The ASQ-3 measures general cognition through 5.5 years of age; the SDQ measures behavioral/emotional functioning. The HSPP looks at student’s self-perception across different areas, including academics; this is the only measure thus far that provides information on school distress, one of the two screening areas recommended by Rimrodt and Lipkin.21
The Americleft Psychosocial Outcomes Project32 was established around the same time as ICHOM and the Cleft Collective. As the primary aim of this project was limited to psychosocial and cognitive outcomes rather than being multi-disciplinary, there was room to expand on some of the measures given. While there is some overlap with ICHOM (i.e., CLEFT-Q), additional measures related to academic functioning (i.e., Adaptive Behavior Assessment System, 3rd Edition33 [ABAS-3], the Child Behavior Checklist34 [CBCL], and PedsQL Inventory35), were also completed, along with parental report of diagnosed psychosocial, behavioral, and language-learning disabilities. The ABAS-3 is an adaptive, parent report questionnaire and measures general ability to use reading, writing, and math in daily life. The CBCL measures internalizing and externalizing symptoms, but also includes an Academic Competence scale that evaluates school attendance, performance across subject areas, use of special services, and identified disabilities. The PedsQL Inventory includes the School Functioning subscale, which obtains both parent and child-response related to issues with focus and school absences. (See Table 1)
Table 1.
Common Screening Measures and Constructs they Assess.
| Measure | # Items | Constructs |
|---|---|---|
| CLEFT-Q School | 10 | Self-report related to having friends and feeling accepted by peers and teachers, participating in activities, and feeling happy and safe at school |
| PedsQL School | 5 | Parent and self-report of ability to focus and keep up with schoolwork and missing school due to illness or doctor visits |
| ABAS-FA | 23 | Parent report of general ability to use reading, writing, and math in daily life |
| CBCL-SC | 4 | Parent report of issues with attendance and school performance, use of special services, and identified disabilities |
| ASQ-3* | 21 | Parent report of functioning related to Communication, Gross and Fine Motor Skills, Problem Solving, and Personal-Social |
| SDQ* | 25 | Parent report of functioning related to Emotion, Conduct, Hyperactivity/Inattention, Peer Relationships, and Prosocial Behaviors. Additional measures of the Impact any issues have on Home Life, Friendship, Classroom Learning, and Leisure Activities |
| HSPP* | 36-45 | Self-report of global self-worth related to Scholastics, Social Competence, Athletic Competence, Physical Appearance, and Behavioral Conduct |
Note. PedsQL School = Pediatric Quality of Life Inventory, School; ABAS-FA = Adaptive Behavior Assessment System, 3rd Edition, Functional Academics; CBCL-SC = Child Behavior Checklist, Academic Competence; ASQ-3 = Ages and Stages Questionnaire, 3rd Edition; SDQ = Strengths and Difficulties Questionnaire; HSPP = Harter Self-Perception Profile.
The ASQ-3, SDQ, and HSPP were not included in the present study, but are included here for reference.
The purpose of the current study was to leverage data from the Americleft Psychosocial Outcomes Project to compare common measures included in screening batteries for school-aged patients with CL/P. Specific research aims were to: 1) identify patterns of academic risk among children with CL/P across the different measures and 2) evaluate the effectiveness of each screening measure in identifying potential academic issues based on parent report of diagnoses. Based on a review of items, it was hypothesized that the CleftQ-School and PedsQL-School scales were more measures of psycho-social functioning within the school setting and would not be predictive of academic risk. However, the CBCL-School and ABAS-3 Functional Academic measures incorporated aspects of both increased learning effort and school distress, so would be more predictive of academic risk. Understanding of the level of academic risk and utility of different screening measures will be beneficial for cleft teams working to improve screening and referral of patients, ensuring the earliest identification and intervention for potential issues.
Materials and Methods
Recruitment and Assessment
Children (ages 8 to 10 years old) with oral clefts and their families were approached and invited to participate by trained research staff during a visit to one of six cleft centers in North America (Shriners Hospitals for Children, Chicago; Nationwide Children’s Hospital, Columbus; the Hospital for Sick Children, Toronto; the University of Iowa, Iowa City; Lancaster Cleft Palate Clinic, Lancaster; and Children’s Medical Center, Dallas). Exclusion criteria were: 1) complex craniofacial syndromes; 2) other comorbid medical issues; 3) children and parents who spoke languages other than English or Spanish. Children with Pierre Robin sequence who did not require a tracheostomy and those with Van der Woude syndrome were eligible to participate. Parents/Guardians provided informed consent and children provided written or verbal assent. Questionnaires were completed via paper and pencil or online REDCap administration (using a tablet) during the clinic visit. If questionnaires were not completed before the end of the clinic visit, postage-paid envelopes were provided for paper submission or a REDCap link was emailed to the parent/guardian for online submission. Children were compensated with a small gift (value of $5) for their participation. Data collection occurred from 2016 – 2019. All procedures were approved by each site’s Institutional Review Board.32
Measures
The Americleft protocol included parent/guardian report and self-report questionnaires designed to obtain information on medical/treatment history, psychosocial functioning, and academic functioning. To limit the influence of repeated measures, when two parents responded to questionnaires, only the first rating was used in analyses. The ratings used were predominately completed by mothers (n = 322; 82%). The following measures from the protocol were included in the current analysis.
Pediatric Quality of Life Inventory Generic Core Scales (PedsQL)
The PedsQL35 is a widely used measure of health-related quality of life that asks parents and children to report the degree to which the child experiences issues in functioning across physical, emotional, social, and school domains. The School subscale (5 items; approximately 1 minute to complete) specifically evaluates a child’s ability to focus and keep up with schoolwork as well as amount of school missed due to illness or doctor visits. Parent (PR) and child report (CR) for the PedsQL-School scores were transposed to Z-scores using normative data;36 higher values indicate better functioning.
CLEFT-Q
The CLEFT-Q23 is a self-report measure developed for use in persons with CL/P ages 8 to 29 years. The School subscale (10 items; approximately 2 minutes to complete) was utilized for the current study. It evaluates if a child has friends, feels accepted by peers and teachers, participates in activities, and feels happy and safe at school. CLEFT-Q School subscores were transposed to Z-scores using normative data,37 where higher values indicate better functioning.
Adaptive Behavior Assessment System, 3rd Edition (ABAS-III)
The ABAS-III33 is a measure of child functioning based on parent report. Items from the Functional Academics subscale (ABAS-FA; 23 items, approximately 9 minutes to complete) was used to obtain parents’ ratings of the frequency of learning challenges for their child. Questions focus on a child’s ability to use basic reading, writing, and math skills in daily life. Standard scores are calculated with a normative mean of 10 and standard deviation of 3; higher values indicate better functioning. To ease comparison across measures, ABAS-FA standard scores were transposed to Z-scores.
Child Behavior Checklist (CBCL)
The CBCL34 is a parent report measure of children’s competencies and psychological adjustment. The competency scales focus on school (attendance, special services, problems, disabilities), social (number of peer friendships, frequency of visits, quality of interactions), and activities (number of sports, activities, chores and level of performance) functioning. The psychosocial adjustment portion assesses internalizing and externalizing problems, attention problems, and thought problems. The current study used the School Competency T-Score (CBCL-SC; 4 items, approximately 2 minutes to complete). The normative mean is 50 with a standard deviation of 10; higher values indicate better functioning. Again, T-Scores were transposed to Z-scores for comparison across measures.
Medical History and Chart Review
Parents completed a structured interview to identify their child’s treatments received since birth including behavioral and learning diagnoses, speech therapy, other developmental therapies, educational services/interventions, and family socioeconomic status (SES) using a Hollingshead scale38 (where higher values indicate higher SES). Self-reported diagnoses (i.e., learning/language disorders, attention disorders, behavioral disorders, mood disorders, and autism spectrum disorder [ASD]) were the variables of interest.
Analyses
Participants (A-priori Descriptive Statistics)
Univariate analysis was used to evaluate potential group differences in age and SES. When homogeneity of variance was violated, Welch Statistic was utilized. Pearson Chi-Square was used to evaluate group differences on categorical variables (i.e., cleft type, sex, and adoption status). Main effects were considered significant at alpha < .05 and interactions were considered significant at alpha < .10. Partial eta squared was calculated to estimate effect size with the following interpretations: small effect = .01, medium effect = .06, and large effect > .13.39 All analyses should be interpreted in light of uneven group sizes (particularly over representation of participants with CLP vs those with CL and CP).
Patterns of Risk across each Measure
First, univariate ANOVAS were run to evaluate main and interaction effects of sex and cleft type on each screening measure (i.e., CLEFT-Q School, PedsQL-School, ABAS-FA, and CBCL-SC). Next, for the CLEFT-Q School, ABAS-FA, and CBCL-School, scores were coded as “not at risk” if the standard score was above the 16th Percentile and as “at risk” if the standard score was at or below the 16th Percentile. For the PedsQL-School, risk was defined based on published cutoff scores.36 Pearson Chi-Square analysis was utilized to evaluate main effects of sex and cleft type on the rate of participants in the at risk range.
Effectiveness of identifying Academic Risk
Incidence of parent-reported diagnoses from clinical interview were tabulated for learning and language disorders (i.e., expressive/receptive language disorder and specific learning disabilities in reading [dyslexia], expressive writing [dysgraphia], and mathematics [dyscalculia]), attention deficit/hyperactivity disorder (ADHD), behavioral disorders (i.e., conduct disorder and disruptive behavior disorder), mood disorders (i.e., anxiety and depression), and ASD. Pearson Chi-Square analysis was utilized to evaluate main and interaction effects of sex and cleft type on incidence. Finally, estimates of sensitivity (true positive rate), specificity (true negative rate), and predictive values were obtained to evaluate the potential clinical utility of each screening measure.
Results
Participants (A-priori Descriptive Statistics)
Nine hundred and ninety-three children (ages 8 to 10 years old) with oral clefts and their families were screened for participation. Of those screened, 228 were not eligible for participation: 66% had another comorbid medical issue, 28% had a craniofacial syndrome, and 6% spoke a language other than English or Spanish. Of those eligible for participation, 414 (76% of eligible) were enrolled. Reasons for declining the study included: time constraints (43%), active decline (28.7%), missed appointment (14.9%), other (13.1%). Of those enrolled, a total of 311 had complete data and 391 had at least partial data (CLEFT-Q School n = 324, PedsQL School CR n = 341, PedsQL School PR n = 384, ABAS-FA n = 387, and CBCL-SC n = 380). Participant inclusion across the 6 centers was as follows: Shriners (n = 160), Nationwide (n = 118), Hospital for Sick Children (n = 38), Iowa (n = 30), Lancaster (n = 25), and Dallas (n = 20).
Of children included in this study, 192 (49%) were male and 260 (66%) had cleft of the lip and palate (CLP). There were 72 (18%) children with cleft palate (CP) and 59 (15%) were born with cleft lip (CL). Participants were more likely to be female (χ2 (1) = 10.89, p < .001). There were no sex (F (1, 385) = 0.98, p = .322; η2 = .003) or cleft type (F (2, 385) = 0.71, p = .490; η2 < .01) differences in child age. There were no sex (F (1, 372) = 2.32, p = .129; η2 < .01) or cleft type differences (F (2, 372) = 0.55, p = .577; η2 < .01) for SES. The majority of participants were Caucasian (56.3%); 28.4% reported as Asian, 9.9% as Hispanic/Latinx, 1.3% as African American, 1.3% as Native American, and 2.8% as multiracial. One hundred and eleven participants (28%) were adopted (see Table 2). As there were no significant differences on outcome measures for those who were vs were not adopted, all participants were analyzed together. Distribution across Grade levels was as follows: 1st = 7, 2nd = 91, 3rd = 125, 4th = 120, 5th = 46, and 6th = 2.
Table 2.
Participant Demographics.
| CLP | CL | CP | ||||
|---|---|---|---|---|---|---|
| Male | Female | Male | Female | Male | Female | |
|
| ||||||
| n | 139 | 121 | 31 | 28 | 22 | 50 |
| Age [Mean (SD)] | 9.4 (0.9) | 9.2 (0.9) | 9.5 (0.8) | 9.2 (0.7) | 9.1 (1.0) | 9.3 (0.9) |
| SES [Mean (SD)] | 42.2 (13.0) | 45.5 (13.3) | 41.5 (14.2) | 42.3 (12.5) | 42.1 (12.5) | 45.6 (9.6) |
| Race/Ethnicity | ||||||
| White | 87 | 48 | 18 | 14 | 18 | 35 |
| Asian | 33 | 60 | 3 | 9 | 1 | 5 |
| Hispanic/Latinx | 15 | 6 | 7 | 3 | 0 | 8 |
| African American | 1 | 0 | 1 | 0 | 1 | 2 |
| Native American | 1 | 2 | 1 | 0 | 1 | 0 |
| Multiracial | 2 | 5 | 1 | 2 | 1 | 0 |
| Adopted | 38 | 58 | 3 | 10 | 0 | 2 |
Note. SES = Socioeconomic Status; higher values reflect higher SES.
Patterns of Risk across each Measure
Responses on the PedsQL School CR, ABAS-FA, and CBCL-SC were moderately and negatively skewed (skewness (SE) = −0.69 (0.13), −0.57 (0.12), and −0.64 (0.13), respectively), with a higher proportion of responses reflecting better functioning. Responses on the CLEFT-Q School and PedsQL School PR were approximately symmetric (skewness (SE) = −0.49 (0.14), −0.46 (0.13), respectively). Scores on the CLEFT-Q School and ABAS-FA scale were predominately in the average to high average range, scores on both the child and parent report of the PedsQL-School were predominately within the average range, and scores on the CBCL-SC were in the low average to average range. (See Figure 1)
Figure 1.

Mean (95% CI) Z-Score for Screening Measures by Sex and Cleft Type.
Note. CBCL-SC = Child Behavior Checklist, Academic Competence; PedsQL School = Pediatric Quality of Life Inventory, School; ABAS-FA = Adaptive Behavior Assessment System, 3rd Edition, Functional Academics; CR = Child Report; PR = Parent Report.
On the CLEFT-Q School, there were no significant sex or cleft type main effects or interactions. For the PedsQL-School, there was a significant main effect of sex where females scored higher than males on both child and parent report (mean difference (standard error) = 0.30 (0.13); F (1, 335) = 5.58, p = .019; η2 = .02 and mean difference (standard error) = 0.28 (0.12); F (1, 378) = 5.81, p = .016; η2 = .02, respectively). For the parent report, there was also a significant main effect of cleft type (F (2, 378) = 4.46, p = .012; η2 = .02), where participants with CP scored significantly lower than those with CL (mean difference (standard error) = −0.49 (0.17), p = .009). This effect did not reach significance for child report, though the same pattern was present (F (2, 335) = 2.55, p = .008; η2 = .02; CP vs CL = −0.41 (1.81), p = .074). On the ABAS-FA, there was a significant sex-by-cleft type interaction (F (2, 381) = 2.54, p = .080; η2 = .01). Males had lower scores than females but this difference was only significant for participants with CP (F (1, 69) = 8.07, p = .006; η2 = .11). For the CBCL-SC, there were no significant main or interaction effects of sex or cleft type. (Figure 1 and Table 3)
Table 3.
Z-Scores and Percentage Coded as “At Risk” across Sex and Cleft Type.
|
CLP |
CL |
CP |
Sex Main |
Cleft Type Main |
Sex*Cleft Interaction |
||||
|---|---|---|---|---|---|---|---|---|---|
| Male | Female | Male | Female | Male | Female | Effect | Effect | Effect | |
|
| |||||||||
| CLEFT-Q School (n) | 111 | 106 | 20 | 26 | 17 | 44 | |||
| Mean (SD) | 0.11 (1.10) | 0.15 (1.04) | 0.27 (1.00) | 0.25 (1.08) | 0.00 (1.35) | 0.42 (1.03) | 0.907 | 0.310 | 0.674 |
| % At Risk | 16% | 19% | 15% | 12% | 29% | 14% | 0.068 | 0.597 | |
| PedsQL School CR (n) | 116 | 111 | 24 | 27 | 17 | 46 | |||
| Mean (SD) | −0.14 (0.92) | 0.03 (0.86) | 0.01 (1.18) | 0.29 (0.82) | −0.49 (1.00) | −0.03 (0.85) | 5.587* | 2.549 | 0.555 |
| % At Risk | 44% | 37% | 38% | 26% | 82% | 39% | 4.442* | 4.471 | |
| PedsQL School PR (n) | 136 | 118 | 31 | 28 | 21 | 50 | |||
| Mean (SD) | −0.09 (0.92) | 0.21 (0.84) | 0.18 (0.85) | 0.46 (0.85) | −0.29 (1.05) | −0.05 (0.88) | 5.810* | 4.462* | 0.027 |
| % At Risk | 49% | 30% | 29% | 18% | 52% | 50% | 6.366* | 9.888** | |
| ABAS-FA (n) | 139 | 121 | 28 | 28 | 22 | 49 | |||
| Mean (SD) | 0.56 (1.25) | 0.72 (1.11) | 0.73 (0.93) | 0.79 (1.20) | 0.06 (1.34) | 0.94 (1.14) | 5.730* | 0.704 | 2.541 |
| % At Risk | 16% | 10% | 4% | 11% | 27% | 6% | 3.544 | 1.544 | |
| CBCL-SC (n) | 134 | 118 | 31 | 27 | 22 | 48 | |||
| Mean (SD) | −0.55 (0.83) | −0.45 (0.77) | −0.25 (0.66) | −0.41 (0.78) | −0.74 (0.88) | −0.31 (0.82) | 1.375 | 1.166 | 2.027^ |
| % At Risk | 34% | 26% | 26% | 22% | 45% | 23% | 3.998* | 0.946 | |
Note. F-Statistics are presented for univariate ANOVAs and Chi-Square Statistics are presented for categorical risk data.
p < .10 (only noted for interactions)
p < .05
p < .001
When scores were coded based on risk, total risk was the lowest for the ABAS-FA = 12%, and CLEFT-Q School = 17%. Total risk was higher on the CBCL-SC = 29%, PedsQL-School parent report = 39%, and PedsQL-School child report = 41%. Chi-Squares were run to assess potential sex and cleft type main effects for each measure. There was a significant main effect of sex for the PedsQL-School (child and parent report; χ2 (1) = 4.44, p = .035 and χ2 (1) = 6.37, p = .012, respectively) and the CBCL-SC (χ2 (1) = 4.00, p = .046), where risk was higher for males compared to females. There also a significant main effect of cleft type for PedsQL-School Parent Report, where those with CP had the highest risk compared to those with CL (χ2 (2) = 9.89, p = .007). There were no significant main effects for the CLEFT-Q School and the ABAS-FA. (See Table 3)
Effectiveness of identifying Academic Risk
Incidence of diagnoses based on parent report are provided in Table 4. Formal diagnosis of either a learning or language disorder was reported in 9% of the full sample. There were no significant sex (χ2 (1) = 0.27, p = .607) or cleft type (χ2 (2) = 1.17, p = .558) differences in rates of learning or language diagnoses. Among learning/language diagnoses, expressive and receptive language disorders were diagnosed in 5% of participants, followed by reading (4%), writing (3%), and math (2%) disorders. Among other diagnoses, attention deficits were the most frequently reported (16%); males were nearly three times more likely to have a diagnosis than females (χ2 (1) = 19.12, p < .001) which is slightly higher than differences in the general population.40 Behavioral and mood disorders were reported in 3% of the participants and ASD was reported in 1% of participants.
Table 4.
Percent of Parent-Reported Diagnoses.
| CLP | CL | CP | Total | ||||||
|---|---|---|---|---|---|---|---|---|---|
| Male | Female | Male | Female | Male | Female | Male | Female | Total | |
| n = 136 | n = 121 | n = 28 | n = 28 | n = 22 | n = 49 | n = 186 | n = 198 | n = 384 | |
|
| |||||||||
| Learning/Language Disorder | 7% | 9% | 11% | 14% | 9% | 8% | 8% | 10% | 9% |
| Expressive/Receptive LD | 4% | 5% | 0% | 7% | 5% | 4% | 4% | 5% | 5% |
| Reading LD | 4% | 4% | 7% | 7% | 5% | 0% | 5% | 4% | 4% |
| Writing LD | 2% | 2% | 7% | 4% | 0% | 4% | 3% | 3% | 3% |
| Math LD | 1% | 2% | 0% | 7% | 0% | 0% | 1% | 3% | 2% |
| Attention Disorder | 25% | 11% | 24% | 7% | 23% | 4% | 25% | 9% | 16% |
| Behavioral Disorder | 4% | 3% | 7% | 0% | 5% | 2% | 4% | 3% | 3% |
| Mood Disorder | 2% | 2% | 3% | 0% | 9% | 4% | 3% | 3% | 3% |
| Autism Spectrum Disorder | 2% | 0% | 0% | 4% | 5% | 0% | 2% | 1% | 1% |
Note. LD = Learning Disorder.
Estimates of performance (i.e., sensitivity, specificity, positive predictive value [PPV], and negative predictive value [NPV]) for each measure in identifying participants with a learning and/or language disorder diagnosis are presented in Figure 2.
Figure 2.
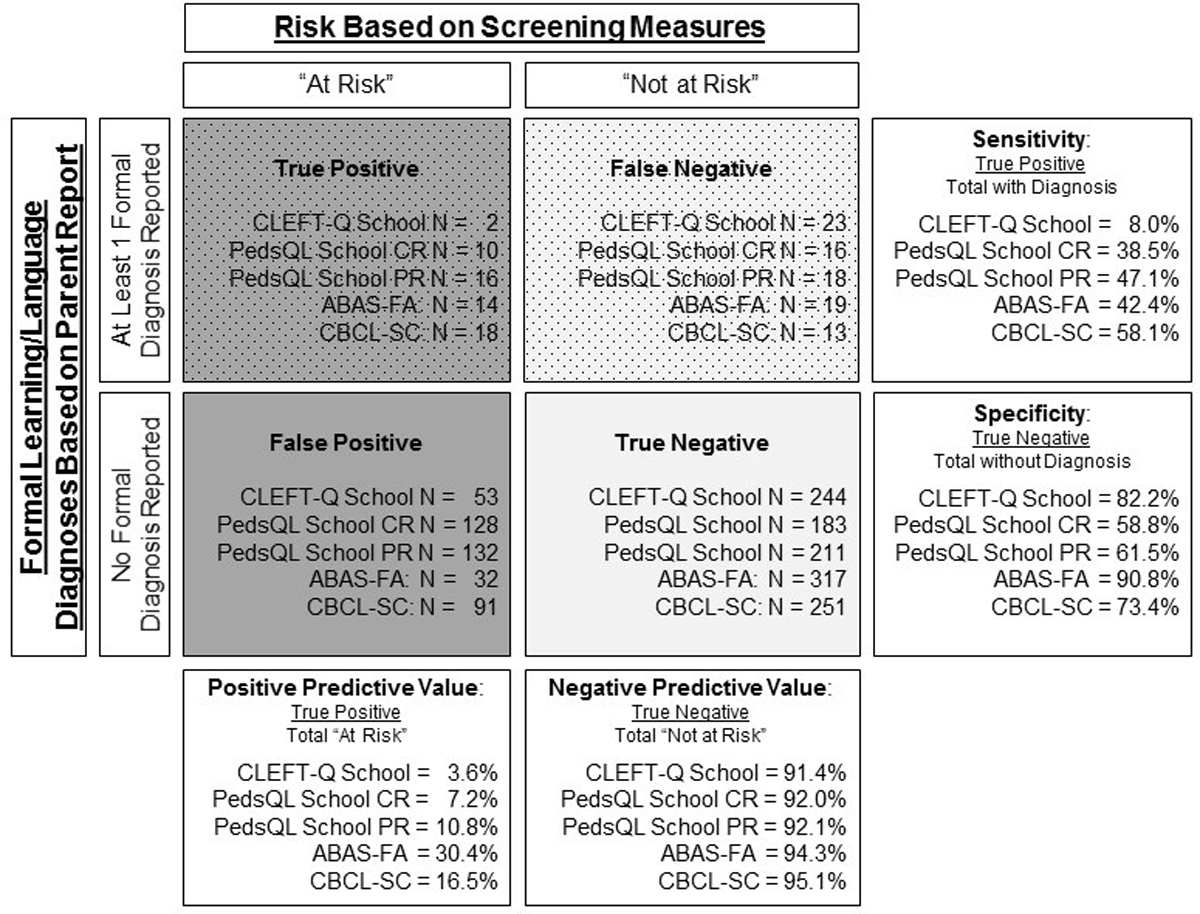
Calculation of Sensitivity, Specificity, and Predictive Values.
Note. CBCL-SC = Child Behavior Checklist, Academic Competence; PedsQL School = Pediatric Quality of Life Inventory, School; ABAS-FA = Adaptive Behavior Assessment System, 3rd Edition, Functional Academics; CR = Child Report; PR = Parent Report.
When evaluating the effectiveness of screening measures, PPV (percentage of those deemed “at risk” who were true positives) and NPV (percentage of those deemed “not at risk” where were true negatives) are the key variables of importance.41 As hypothesized, both the ABAS-FA and CBCL-SC had higher PPV (30.4% and 16.5%, respectively) and NPV (94.3% and 95.1%, respectively) compared to the CLEFT-Q School and PedsQL-School child and parent report (PPV = 3.6%, 7.2%, and 10.8%, respectively; NPV = 91.4%, 92.0%, and 92.1%, respectively). This indicates that the ABAS-FA and CBCL-SC had a higher accuracy in identifying those who truly were “at risk” and “not at risk”.
Sensitivity (i.e., percentage of those who were true positives out of those who have a diagnosis) and specificity (i.e., percentage of those who were true negatives out of those who do not have a diagnosis), are also helpful metrics to consider. The CBCL-SC was the only measure that had both sensitivity and specificity over 50% (58.1% and 73.4%, respectively). While the ABAS-FA had the highest specificity (90.8%), less than half of those who had a diagnosis were identified as “at risk” (sensitivity = 42.4%).
Post-Hoc Analyses
Review of the PedsQL-School and CBCL raised questions of potential utility of specific items. For the PedsQL-School, three items could be related to increased school effort (i.e., paying attention in class, forgetting things, and keeping up with school work) and the other items are related to attendance. To determine if responses on the first three items may be more sensitive to potential learning concerns, mean responses were calculated for the first three items (PedsQL-School Effort) and the last two items (PedsQL-School Attendance) where lower scores reflected less concern. Since cut-points for items are not available, two Repeated Measures ANOVAs (one for parent report and one for child report) were run with the diagnosis of a language/learning disability as the between subjects independent variable and scores on the PedsQL-School Effort vs. Attention as the within subjects variable. For parent-report, there was a significant diagnosis*item interaction (F (1, 373) = 6.66, p = .010; η2 = .02), where responses on PedsQL-School Effort were rated with more problems than items on the PedsQL-School Attendance, and the difference was more profound for those with a language/learning disability. Neither the diagnosis*item interaction (F (1, 330) = 1.29, p = .257; η2 < .01) nor the main within subject effect between items (F (1, 330) < 0.01, p = .963; η2 < .01) were significant for child-report.
The CBCL-SC is composed of items that measure performance across classes, receipt of services, grade retention, and general problems in school. Clinically, it is of importance to professionals when issues are occurring (i.e., poor grades, retention, and problems in school), but receipt of services is not endorsed. For the current sample, of those with a diagnosed language/learning disorder (n = 34), 38% were not reported to be currently receiving services.
Discussion
Internationally, efforts are being made to develop a consensus for psychological screening and evaluation of children with CL/P. Given the importance of academic screening, the current paper sought to provide information on academic risk and evaluate the utility of different screening measures in identification of risk for academic achievement.
Ratings across four of the measures evaluated (CLFT-Q School, PedsQL-School child and parent report, and ABAS-FA) were all at or above the average range. In contrast, ratings on the CBCL-SC were in the low average to average range. These differences are likely related to what each measure is evaluating. The CLFT-Q School and PedsQL-School measure adjustment and functioning within a school setting. The ABAS-FA measures general ability to use reading, writing, math, and organizational skills within daily life. Whereas, items on the CBCL-SC flag potential issues with low school performance and need for academic services. The findings presented here suggest that, in general, students with CL/P are not experiencing significant psychosocial issues in the school setting and are able to use academic skills in daily life. However, they demonstrate higher risk in regards to low academic achievement and higher need for services. The differences across these measures reflect the importance of what questions are being asked to ensure that concerns are adequately being evaluated.
While ratings were at or above the average range for most children with CL/P, males were at the highest risk for issues. In fact, males with CP were at the highest risk across all measures (ranging from 29% to 82% in the “at risk” group). Even the measure that yielded the lowest risk (CLEFT-Q School) is more than double the expected percentage of risk found within the general population.40 This supports previous research that males with CP are at a higher risk for language and learning concerns.17,18
Using parental report as a marker, only 9% had a known language or learning diagnosis. However, without direct assessment of academic achievement, the accuracy of parent-reported language or learning diagnoses cannot be determined. Previous work evaluating reading among males with CL/P found that while only 4% of the sample had a diagnosis of dyslexia, 37% had reading performance that fell within the impaired range.11 Additionally, more subtle learning disabilities may not yet have been identified for participants in early elementary school. As stated earlier, while screening of academic issues is required for ACPA approved cleft clinics, the method in which this screening is achieved is not standardized. Some centers may ask brief questions regarding school performance, where others have on-site psychologists who conduct more formal screening and assessment. Ensuring that screening efforts are adequately identifying those at greatest risk and in need of follow-up assessment is a critical need.
Analysis of screening measures is a complex matter, with consideration needed for not only predictive values, sensitivity, and specificity, but also to prevalence, the cost of screening and diagnostics, as well as the impact of false positives and false negatives. For language and learning disorders, there is evidence of higher prevalence (up to 40–60% for subgroups) and neuropsychological assessment required for diagnostics is costly. While the monetary cost related to a possible false positive is high, the long term impact of a false negative is immeasurable for a student. This means that maximizing true positives (higher PPV) and true negatives (higher NPV) is of utmost importance.
In comparing the screening measures utilized in this study, the ABAS-FA and CBCL-SC had the highest PPV and NPV. Both were negatively skewed to a significant degree. For the ABAS-FA, this resulted in 50% of participants falling at or above the 84th Percentile (above average), reflecting a possible ceiling effect for this measure. On the CBCL-SC, only 14% of participants were scored at the ceiling level. Finally, while specificity was higher for the ABAS-FA (high ability to identify those who were not reported to have a language/learning diagnosis), sensitivity was higher for the CBCL-SC (moderate ability to identify those who had a reported learning/language disorder).
As noted by Rimrodt and Lipkin,21 screening for learning disabilities must be able to identify increased learning effort and school distress among patients, ideally before they result in school failure. Routine academic screening by the cleft team can be achieved by asking these key questions to explore if there are any issues with school, peers, performance, or homework completion. Clinical review of individual items from the CBCL-SC could be useful in determining need for referrals, particularly if a student’s score is indicative of school performance concerns, repeating a grade, or school problems, but is not yet receiving special services. However, as demonstrated by the current study, asking these questions alone is not sufficient in identifying students who may require intervention. Additional screening for specific learning disabilities may be needed. For example, researchers in Sweden have been testing a Short Dyslexia Scale that requires parent response to 7 screening questions. They reported that 22% of participants with CL/P fell below the 10th percentile.42 In clinical practice, those with concerning screening results could then be used to trigger a referral to a team or local psychologist for a neuropsychological evaluation or collaboration with the child’s school to advocate for further evaluation and/or service provision.
Despite the large, multi-center nature of this study design, the findings reported have limitations. The generalizability of the findings is limited by lack of racial and ethnic diversity within the sample. Our sample was not powered to evaluate the potential influence of key socio-demographic variables (e.g., socioeconomic status, adoption status) that are associated with incidence of language and learning concerns as well as access to appropriate diagnostic and intervention services. Additionally, parent reported diagnoses were used as an indicator for learning/language disability rather than medically confirmed diagnoses or actual measures of skill/performance. It is possible that parents mis-reported diagnoses or that children who truly had a learning/language disability had not been identified or diagnosed. Future prospective work should follow children from identification and referral through treatment/intervention to assess factors of timing and type of intervention on outcomes. Information on the effectiveness of different measures in identification of academic risk helps guide cleft teams in determining what screening methods to use and how to best address their patient’s needs.
Conclusion
As cleft teams work to develop standardized batteries for screening and monitoring of patients throughout life, it is of importance that work be done to assess the success of those measures in identifying those at highest risk. For the screening of language and learning disorders, this means ensuring that questions related to potential academic struggles, such as increased school effort or increased school distress, are asked and referrals for follow-up evaluation are made for those identified at high risk. By following patients and tracking the results of follow-up diagnostics, cleft teams will be able to best ensure that our efforts are truly meeting the needs of our patients.
Acknowledgements:
We would like to extend our sincerest gratitude to the families who gave their time to participate in this study.
Funding:
This work was supported by a grant through the Cleft Palate Foundation (CPF); a training grant through the National Institute of Dental and Craniofacial Research (grant number K23DE024511); and the National Center for Advancing Translational Sciences of the National Institutes of Health (grant number UL1TR002537).
Footnotes
Declaration of Conflicting Interest: The Authors declare that there is no conflict of interest.
References
- 1.Lee ES, Koh HL, Ho EQ, et al. Systematic review on the instruments used for measuring the association of the level of multimorbidity and clinically important outcomes. BMJ open. 2021;11(5):e041219. doi: 10.1136/bmjopen-2020-041219 [DOI] [PMC free article] [PubMed] [Google Scholar]
- 2.Shaw WC, Semb G, Nelson P, et al. The Eurocleft project 1996–2000: overview. J Craniomaxillofac Surg. 2001;29(3):131–40; discussion 141–2. doi: 10.1054/jcms.2001.0217 [DOI] [PubMed] [Google Scholar]
- 3.Americleft. Welcome to Americleft. Lancaster Cleft Palate Clinic. Accessed February 3, 2022, https://www.americleft.org/
- 4.Lohmander A, Willadsen E, Persson C, Henningsson G, Bowden M, Hutters B. Methodology for speech assessment in the Scandcleft project--an international randomized clinical trial on palatal surgery: experiences from a pilot study. Cleft Palate Craniofac J. 2009;46(4):347–62. doi: 10.1597/08-039.1 [DOI] [PubMed] [Google Scholar]
- 5.Sandy J, Williams A, Mildinhall S, et al. The Clinical Standards Advisory Group (CSAG) Cleft Lip and Palate Study. Br J Orthod. 1998;25(1):21–30. doi: 10.1093/ortho/25.1.21 [DOI] [PubMed] [Google Scholar]
- 6.Allori AC, Kelley T, Meara JG, et al. A Standard Set of Outcome Measures for the Comprehensive Appraisal of Cleft Care. Cleft Palate Craniofac J. 2017;54(5):540–554. doi: 10.1597/15-292 [DOI] [PubMed] [Google Scholar]
- 7.Bristol Uo. The Cleft Collective. Accessed 01/28/2022, 2022. www.cleftcollective.org.uk
- 8.Gallagher ER, Collett BR. Neurodevelopmental and Academic Outcomes in Children With Orofacial Clefts: A Systematic Review. Pediatrics. 2019;144(1)doi: 10.1542/peds.2018-4027 [DOI] [PubMed] [Google Scholar]
- 9.Richman LC, McCoy TE, Conrad AL, Nopoulos PC. Neuropsychological, behavioral, and academic sequelae of cleft: early developmental, school age, and adolescent/young adult outcomes. Cleft Palate Craniofac J. 2012;49(4):387–96. doi: 10.1597/10-237 [DOI] [PMC free article] [PubMed] [Google Scholar]
- 10.Collett BR, Stott-Miller M, Kapp-Simon KA, Cunningham ML, Speltz ML. Reading in children with orofacial clefts versus controls. J Pediatr Psychol. 2010;35(2):199–208. doi: 10.1093/jpepsy/jsp047 [DOI] [PMC free article] [PubMed] [Google Scholar]
- 11.Conrad AL. Are predictors of reading impairment in isolated cleft similar to those in idiopathic dyslexia? Ann Dyslexia. 2018;doi: 10.1007/s11881-018-00166-2 [DOI] [PMC free article] [PubMed] [Google Scholar]
- 12.Conrad AL, McCoy TE, DeVolder I, Richman LC, Nopoulos P. Reading in subjects with an oral cleft: speech, hearing and neuropsychological skills. Neuropsychology. 2014;28(3):415–22. doi: 10.1037/neu0000024 [DOI] [PMC free article] [PubMed] [Google Scholar]
- 13.Persson M, Becker M, Conrad AL, Svensson H. Female and Male Differences in Academic Achievement in Individuals With Cleft: A Population-Based Register Study. Cleft Palate Craniofac J. 2018;55(2):196–203. doi: 10.1177/1055665617726990 [DOI] [PMC free article] [PubMed] [Google Scholar]
- 14.Persson M, Becker M, Svensson H. Academic achievement in individuals with cleft: a population-based register study. Cleft Palate Craniofac J. 2012;49(2):153–9. doi: 10.1597/09-047 [DOI] [PubMed] [Google Scholar]
- 15.Knight J, Cassell CH, Meyer RE, Strauss RP. Academic outcomes of children with isolated orofacial clefts compared with children without a major birth defect. Cleft Palate Craniofac J. 2015;52(3):259–68. doi: 10.1597/13-293 [DOI] [PMC free article] [PubMed] [Google Scholar]
- 16.Wehby GL, Collet B, Barron S, Romitti PA, Ansley TN, Speltz M. Academic achievement of children and adolescents with oral clefts. Pediatrics. 2014;133(5):785–92. doi: 10.1542/peds.2013-3072 [DOI] [PMC free article] [PubMed] [Google Scholar]
- 17.Collett BR, Wehby GL, Barron S, Romitti PA, Ansley TN, Speltz ML. Academic achievement in children with oral clefts versus unaffected siblings. J Pediatr Psychol. 2014;39(7):743–51. doi: 10.1093/jpepsy/jsu049 [DOI] [PMC free article] [PubMed] [Google Scholar]
- 18.Wehby GL, Collett BR, Barron S, Romitti P, Ansley T. Children with oral clefts are at greater risk for persistent low achievement in school than classmates. Arch Dis Child. 2015;100(12):1148–54. doi: 10.1136/archdischild-2015-308358 [DOI] [PMC free article] [PubMed] [Google Scholar]
- 19.Morris H, Ozanne A. Phonetic, phonological, and language skills of children with a cleft palate. Cleft Palate Craniofac J. 2003;40(5):460–70. [DOI] [PubMed] [Google Scholar]
- 20.NICHD. Emergent and Early Literacy Workshop: Current Status and Research Directions. Center for Research for Mothers and Children; 2000:20. https://www.nichd.nih.gov/sites/default/files/publications/pubs/documents/EEL_workshop.pdf [Google Scholar]
- 21.Rimrodt SL, Lipkin PH. Learning disabilities and school failure. Pediatr Rev. 2011;32(8):315–24. doi: 10.1542/pir.32-8-315 [DOI] [PubMed] [Google Scholar]
- 22.ACPA. Standards for Approval of Cleft Palate and Craniofacial Teams. American Cleft Palate-Craniofacial Association; 2019. [Google Scholar]
- 23.Wong KW, Forrest CR, Goodacre TE, Klassen AF. Measuring outcomes in craniofacial and pediatric plastic surgery. Clin Plast Surg. 2013;40(2):305–12. doi: 10.1016/j.cps.2012.11.005 [DOI] [PubMed] [Google Scholar]
- 24.Stock NM, Hammond V, Owen T, Kiff J, Shanly A, Rumsey N. Achieving Consensus in the Measurement of Psychological Adjustment to Cleft Lip and/or Palate. Cleft Palate Craniofac J. 2016;53(4):421–6. doi: 10.1597/15-071 [DOI] [PubMed] [Google Scholar]
- 25.Squires J BD. Ages & Stages Questionnaires, Third Edition (ASQ-3). Brookes Publishing; 2009. [Google Scholar]
- 26.Squires J, Bricker D, Heo K, Twombly E. Ages & States Questionnaires: Social-Emotional. A parent-completed, child-monitoring system for social-emotional behaviors. Brookes; 2002. [Google Scholar]
- 27.Goodman R The Strengths and Difficulties Questionnaire: a research note. J Child Psychol Psychiatry. 1997;38(5):581–6. doi: 10.1111/j.1469-7610.1997.tb01545.x [DOI] [PubMed] [Google Scholar]
- 28.S H. Self-Perception Profile for Children: Manual and Questionnaires. University of Denver. Accessed February 3, 2022, https://portfolio.du.edu/SusanHarter/page/44210 [Google Scholar]
- 29.S H. Self-Perception Profile for Adolescents: Manual and Questionnaires. University of Denver. Accessed February 3, 2022, https://portfolio.du.edu/SusanHarter/page/44210 [Google Scholar]
- 30.Seid M, Varni JW, Kurtin PS. Measuring quality of care for vulnerable children: challenges and conceptualization of a pediatric outcome measure of quality. Am J Med Qual. 2000;15(4):182–8. doi: 10.1177/106286060001500409 [DOI] [PubMed] [Google Scholar]
- 31.Varni JW, Sherman SA, Burwinkle TM, Dickinson PE, Dixon P. The PedsQL Family Impact Module: preliminary reliability and validity. Health Qual Life Outcomes. 2004;2:55. doi: 10.1186/1477-7525-2-55 [DOI] [PMC free article] [PubMed] [Google Scholar]
- 32.Crerand CE, Conrad AL, Albert M, et al. The Americleft Psychosocial Outcomes Project: A Multicenter Approach to Advancing Psychosocial Outcomes for Youth With Cleft Lip and Palate. Clin Pract Pediatr Psychol. 2017;5(1):65–76. doi: 10.1037/cpp0000172 [DOI] [PMC free article] [PubMed] [Google Scholar]
- 33.Harrison P, Oakland T. Adaptive Behavior Assessment System, 3rd Edition: Manual. Western Psychological Services; 2015. [Google Scholar]
- 34.Achenbach TM. The Child Behavior Checklist and related instruments. The use of psychological testing for treatment planning and outcomes assessment. Lawrence Erlbaum Associates Publishers; 1999. [Google Scholar]
- 35.Varni JW, Seid M, Kurtin PS. PedsQL 4.0: reliability and validity of the Pediatric Quality of Life Inventory version 4.0 generic core scales in healthy and patient populations. Med Care. 2001;39(8):800–12. doi: 10.1097/00005650-200108000-00006 [DOI] [PubMed] [Google Scholar]
- 36.Huang IC, Thompson LA, Chi YY, et al. The linkage between pediatric quality of life and health conditions: establishing clinically meaningful cutoff scores for the PedsQL. Value in health : the journal of the International Society for Pharmacoeconomics and Outcomes Research. 2009;12(5):773–81. doi: 10.1111/j.1524-4733.2008.00487.x [DOI] [PMC free article] [PubMed] [Google Scholar]
- 37.Klassen AF, Riff KWW, Longmire NM, et al. Psychometric findings and normative values for the CLEFT-Q based on 2434 children and young adult patients with cleft lip and/or palate from 12 countries. Cmaj. 2018;190(15):E455–E462. doi: 10.1503/cmaj.170289 [DOI] [PMC free article] [PubMed] [Google Scholar]
- 38.Hollingshead AB. Four Factor Index of Social Status. Department of Sociology, Yale University; 1975. [Google Scholar]
- 39.Statology. What is Partial Eta Squared? (Definition & Example). Accessed 03/11/2022, https://www.statology.org/partial-eta-squared/
- 40.Zablotsky B, Black LI, Maenner MJ, et al. Prevalence and Trends of Developmental Disabilities among Children in the United States: 2009–2017. Pediatrics. 2019;144(4)doi: 10.1542/peds.2019-0811 [DOI] [PMC free article] [PubMed] [Google Scholar]
- 41.Sensitivity Trevethan R., Specificity, and Predictive Values: Foundations, Pliabilities, and Pitfalls in Research and Practice. Front Public Health. 2017;5:307. doi: 10.3389/fpubh.2017.00307 [DOI] [PMC free article] [PubMed] [Google Scholar]
- 42.Weinfeld JP, Johnels JA, Persson C. Prevalence of Reading Difficulties in 9- to 10-Year Old Children in Sweden Born With Cleft Palate. Cleft Palate Craniofac J. 2021:10556656211013236. doi: 10.1177/10556656211013236 [DOI] [PubMed] [Google Scholar]