

SUMMARY
Mitosis in most Drosophila cells is triggered by brief bursts of transcription of string (stg), a Cdc25-type phosphatase that activates the mitotic kinase, Cdk1 (Cdc2). To understand how string transcription is regulated, we analyzed the expression of string-lacZ reporter genes covering ~40 kb of the string locus. We also tested protein coding fragments of the string locus of 6 kb to 31.6 kb for their ability to complement loss of string function in embryos and imaginal discs. A plethora of cis-acting elements spread over >30 kb control string transcription in different cells and tissue types. Regulatory elements specific to subsets of epidermal cells, mesoderm, trachea and nurse cells were identified, but the majority of the string locus appears to be devoted to controlling cell proliferation during neurogenesis. Consistent with this, compact promotor-proximal sequences are sufficient for string function during imaginal disc growth, but additional distal elements are required for the development of neural structures in the eye, wing, leg and notum. We suggest that, during evolution, cell-type-specific control elements were acquired by a simple growth-regulated promoter as a means of coordinating cell division with developmental processes, particularly neurogenesis.
Keywords: string, Drosophila, Mitosis, Cdk1, Cis-acting element
INTRODUCTION
The Drosophila gene, string, encodes a Cdc25-type phosphatase that triggers mitosis by dephosphorylating and thereby activating the Cdk1/CyclinB kinase (Edgar and O’Farrell, 1989; Kumagai and Dunphy, 1991; Gautier et al., 1991; Edgar et al., 1994b). Extensive evidence shows that differential expression of string executes mitosis during most stages of Drosophila development. For instance, loss-of-function mutations in the gene cause G2 arrest in both embryos and imaginal disc cells (Edgar and O’Farrell, 1989; Neufeld et al., 1998), whereas ectopic string expression in both embryos and discs drives G2 cells rapidly into mitosis (Edgar and O’Farrell, 1990; Milán et al., 1996a,b; Neufeld et al., 1998; Johnston and Edgar, 1998). This shows that string is rate-limiting for mitotic initiation in both contexts. During embryonic cell cycles 14–16, string is transcribed in dynamic patterns that correspond to the mitotic patterns, but which precede mitoses by 10–20 minutes (Edgar and O’Farrell, 1989; Edgar et al., 1994a). During this period, other factors required for cell cycle progression, such as Cdk1, Cdk2, CyclinA, CyclinB and CyclinE are expressed in excess (Lehner and O’Farrell, 1989, 1990a,b; Stern et al., 1993; Richardson et al., 1993; Knoblich et al., 1994; Duronio et al., 1995). This effectively eliminates G1 phases from these cycles, making string the de facto limitor of cell proliferation. The same situation may apply in proliferating neuroblasts, which express CyclinE constitutively but show periodic string expression (Britton and Edgar, unpublished). In other situations string’s regulatory role is more limited. For instance, during embryonic cell cycles 1–13, maternally supplied string is functionally redundant with another Cdc25 homolog, twine (Edgar and Datar, 1996). During the growth of the imaginal discs which form many adult structures, both G1/S and G2/M transitions are regulated. In these cycles string is periodically transcribed and limiting for G2/M progression, whereas Cyclin E expression limits G1/S progression (Richardson et al., 1995; Milán et al., 1996b; Kylsten and Saint; 1997; Neufeld et al., 1998).
Why is patterned cell division needed during development? In the fly embryo, cell division timing is offset with morphogenetic movements such as gastrulation, neuroblast delamination, germband retraction and dorsal closure (Foe et al., 1993). In imaginal discs, division timing is patterned and synchronized with the onset of cell differentiation (Thomas et al., 1994; Johnston and Edgar, 1998). Although cell division is not absolutely required for cell differentiation in Drosophila (Hartenstein and Posakony, 1990; Edgar and O’Farrell, 1990), divisions at inappropriate times can be deleterious. For instance, triggering mitoses in the ventral furrow during gastrulation disrupts invagination of the blastoderm, resulting in a major loss of mesoderm (Foe et al., 1993), and altering division timing in the embryonic CNS can delete neural fates (Weigmann and Lehner, 1995; Cui and Doe, 1997). These alterations are frequently lethal, even when the number of total cell divisions is not changed (Edgar and O’Farrell, 1990).
How is string activity regulated such that cell proliferation patterns are compatible with morphogenesis? string mRNA is unstable (TG<15 minutes after mitosis 13), string protein patterns closely track those of the mRNA and the protein itself is dramatically destabilized as cells exit mitosis, in a cell cycle-dependent manner (Edgar et al., 1994b; Edgar and Datar, 1996; and unpublished). Therefore transcriptional control is the most important mode of regulating string activity. While transcription of cell cycle genes in single-celled systems such as yeast is often linked to cell cycle progression itself (Breeden, 1996; Koch and Nasmyth, 1994), this is generally not true during Drosophila development. If the cell cycle is prematurely arrested in a fly embryo, cell cycle genes such as string and cyclin E continue to progress through their usual spatiotemporal programs of expression (Edgar et al., 1994a; Knoblich et al., 1994). However, mutations in many pattern formation genes do alter string expression in specific predictable ways, indicating that string transcription is controlled by the same network of factors that controls cell fates (Arora and Nüsslein-Volhard, 1992; Edgar et al., 1994a; Johnston and Edgar 1998). Our previous studies with rescuing transgenes and a deletion mutant (stgAR5; Fig. 1) indicated that the string locus uses a large regulatory region to respond to these transcription factors (Edgar et al., 1994a). Here we dissect this control region and show that it consists of many modular elements with separable activities. These elements pattern mitoses in the embryo and in neural lineages at many stages of development. Surprisingly, they are dispensable during the growth-coupled cell cycles of imaginal disc development, where a simpler mode of control more akin to that of yeast appears to be used.
Fig. 1.
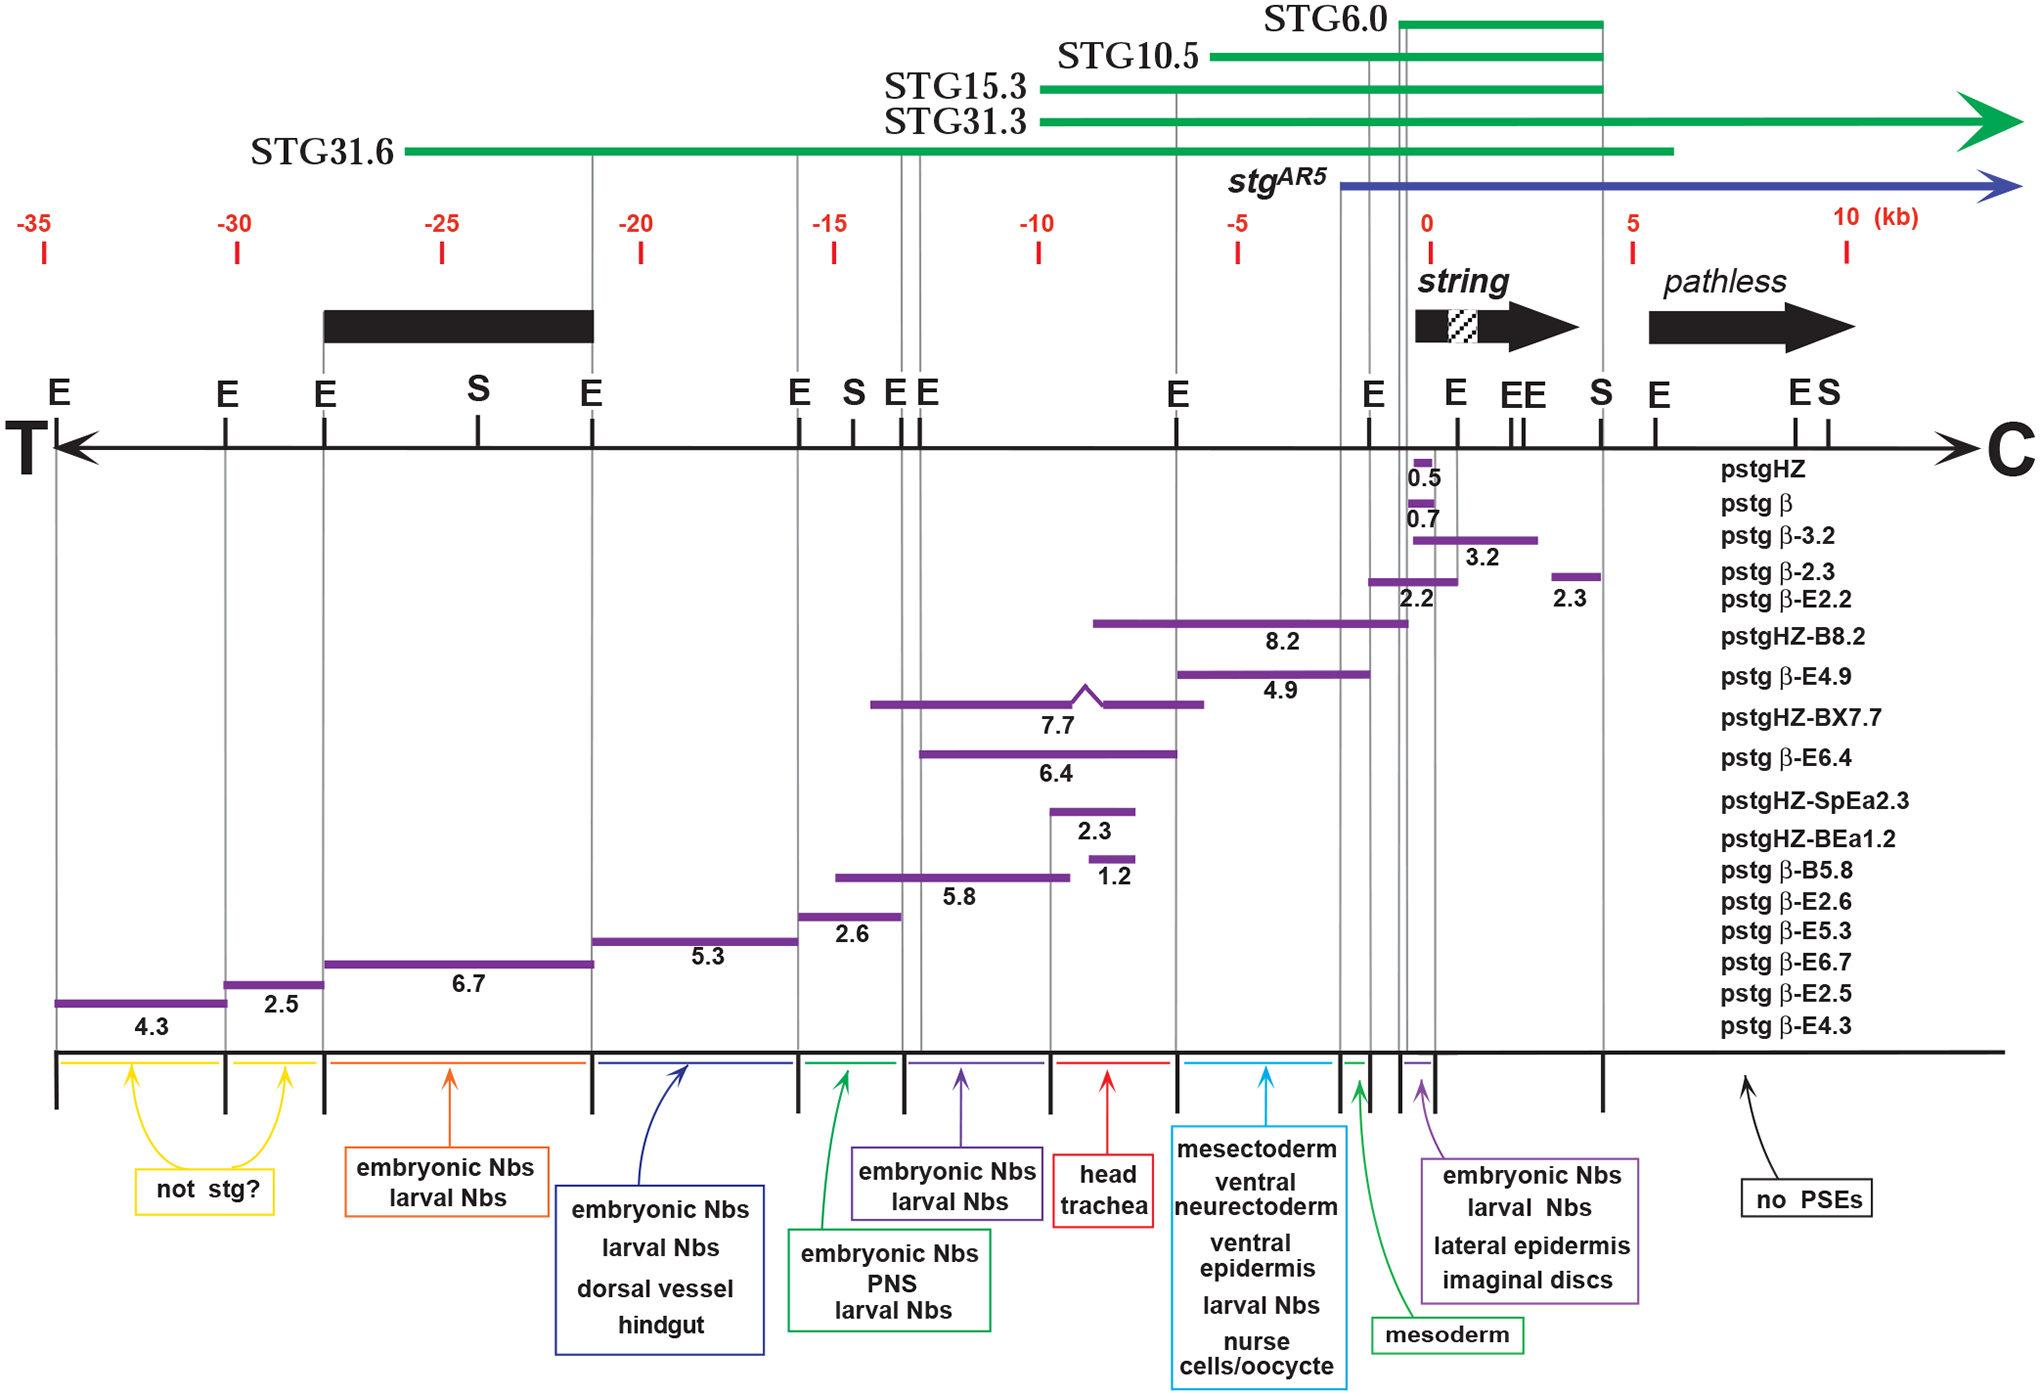
The ~50 kb genomic region surrounding string. Bold black lines represent transcribed regions, arrows indicate direction of transcription, if known, and the string intron is hatched. A restriction map indicates EcoRI (E) and SalI (S) sites and the directions of the centromere (C) and telomere (T). Above the restriction map, a deletion mutation is indicated in purple (stgAR5), and genomic fragments tested for rescue are indicated in green. Fragments used to drive lacZ expression in transgenic animals are shown below the restriction map in purple, with transgene names to the right. Tissues in which expression is driven by these fragments are indicated in colored boxes, and described in detail in Table 1.
MATERIALS AND METHODS
Construction of string-lacZ reporter genes
This work was initiated independently in two laboratories and therefore two different transformation vectors were used to construct string-lacZ reporter genes; pstgβ and pstgHZ. pstgβ was adapted from pCaSpeR-AUG-β-gal (Thummel et al., 1988) by inserting an XbaI fragment from the 3′ untranslated region (UTR) of stg into the XbaI site downstream of lacZ, and inserting a 0.7 kb stg promotor fragment into the KpnI site upstream of lacZ. This 0.7 kb sequence was generated by PCR, extends from −731bp to +39bp, and contains the two string TATA boxes and the two transcription start sites (Fig. 1; B. A. E., unpublished data). pstgHZ was modified from pHZ50PL (Hiromi and Gehring, 1987) and includes an hsp70 minimal promoter, a lacZ reporter gene and 3′ sequences from hsp70, which provide a polyadenylation signal. pstgHZ was constructed by removing the 7.2 kb rosy transcription unit from pHZ50PL and replacing it with a 4.1 kb fragment that contains the mini-white gene. The vector was further modified by inserting a 0.5 kb string fragment (−31 to −525 bp; Fig. 1) into the KpnI polylinker site upstream of the hsp70 promoter. A KpnI site was created by in vitro mutagenesis at −31bp, destroying the string TATA box at this site. This gave a vector with two functional TATA boxes, one at −501 bp within the 0.5 kb string fragment and another within the hsp70 promoter.
Fragments of string used in string-lacZ reporter genes are shown in Fig. 1. The name to the right of each fragment denotes the transformation vector (pstgHZ or pstgβ), the restriction enzymes used for isolating the fragments from lambda phage or cosmid clones, and their size in kilobases. The restriction enzymes used include: (P) PstI; (Bc) BclI; (E) EcoRI; (B) BamHI; (X) XbaI; (Sp) SpeI; (Ea) EagI. Most DNA fragments were cloned into either pstgβ or pstgHZ, upstream of the string 0.7 kb or 0.5 kb promoter, respectively. Normal 3′ to 5′ orientation was conserved in these contructs. Exceptions to this strategy follow. pstgβ-B3.2 was constructed by inserting the 3.2 kb Bam fragment (which includes the 0.7 kb string promoter) into the Bam site of pCaSpeR-AUG-β-gal. pstgβ-2.3 was constructed by removing the XbaI fragment from pstgβ (the 3′ string UTR) and replacing it with a 2.3 kb PCR fragment from the region 3′ of the string transcription unit. pstgβ-E2.2 was constructed by replacing the 0.7 kb string promoter with the 2.2 kb EcoRI fragment, which includes that promoter. Since pstgβ-E2.2 contained a fragment of the string intron, the stg-lacZ fusion RNA that it produced was not spliced, exported to the cytoplasm or translated into protein. pstgHZ-B8.2 was made by inserting an 8.7 kb fragment (which includes the 0.5 kb string promoter with a mutation in the −31 bp TATA box) into a variant of pHZ that did not include the 0.5 kb string promoter. pstgHZ-BX7.7 was constructed by fusing a 5.3 kb XbaI-BamHI fragment to a 2.5 kb BamHI fragment and therefore is missing a 0.7 kb BamHI fragment normally located in this region. pstgHZ-BEa1.2 includes a 1.2 kb BamHI/EagI fragment inserted into a slightly modified form of pstgHZ containing a string promoter fragment that extends from the KpnI site at −31 bp to the RsaI site at −509 bp. All constructs were introduced into flies by P-element-mediated transformation (Spradling, 1986) and >3 independent lines were analyzed for lacZ expression. For each stg-LacZ reporter gene, we report only those expression patterns that were observed in multiple independent transformant lines, and which were also expressed by the corresponding genomic string rescue transgenes (see below).
Functional rescue using string transgenes
The 31.6 kb string transgene (−24 kb to +7.6 kb; Fig. 1) was isolated by KpnI digestion of a P1 clone (DS08448), ligated to CoSpeR 4 and packaged in vitro. CoSpeR 4 was derived from John Tamkun’s NotBamNot-CoSpeR vector by replacing the NBN polylinker with the polylinker from the CaSpeR 4 plasmid. Two independent transgenic lines carrying ΔPSTG31.6 were made by P-element-mediated transformation. The 6.0 kb string transgene was isolated from ΔPSTG10.0 (Fig. 1) by digestion with SalI and SpeI, and cloned into pCaSpeR 4. BrdU incorporation and rescue experiments were analyzed in flies with the homozygous genotypes P[w+ STG31.6]; stg7B, P[w+ STG 31.6]; stgAR2, and P[w+ STG 6.0]; stg7B. Expression patterns were assessed only in P[w+ STG 31.6]; stgAR2, as stgAR2 is a deletion allele that produces no endogenous string transcript (Edgar et al., 1994a). string transgenes were tested for function in imaginal discs using flies of the genotypes: hs-FLP122/+; P[w+ STG-X]/+; FRT(82B) P[w+ π-myc] stg7B/FRT(82B), or: hs-FLP122/+; P[w+ STG-X]/+; FRT(82B) P[w+ π-myc] stg7B/FRT(82B) M(3)95A, where STG-X is either STG6.0, STG10.5, STG15.3, or STG31.6 (Fig. 1).
In situ analysis
In situ hybridization was performed as described in Tautz and Pfeifle (1989) with modifications including the use of digoxygenin-labeled RNA probes (Boehringer Mannheim), omission of the pretreatment with proteinase K following embryo fixation and an increase in the hybridization temperature from 45°C to 55°C. Double antibody/in situ staining was performed with modifications described in Manoukian and Krause (1992). Anti-β-gal staining was performed prior to in situ hybridization and utilized mouse anti-β-galactosidase antibody (Boehringer Mannheim), donkey anti-mouse-biotin secondary antibodies (Jackson) and streptavidin-HRP (Chemicon). After detection of β-gal, embryos positive for β-gal (P[w+ STG31.6]; stgAR2/TM3 Sb ry P[ry+ ftz-lacZ]) were separated from those without β-gal (P[w+ STG31.6]; stgAR2/stgAR2). In situ hybridization with string RNA probes followed. In vivo BrdU labelling was done for 1 hour as described by Bodmer et al. (1989) and Edgar and O’Farrell (1990) with modifications including β-gal antibody staining and separation of embryos (see above) following fixation and prior to acid treatment. Larval central nervous systems were dissected from second or wandering third instar larvae and fixed for 20 minutes in 4% paraformaldehyde in PBS. Anti-β-gal staining was performed using a rabbit anti-β-gal antibody (Cappel) at 1:10,000 in PBS containing 0.1% Tween-20 followed by a anti-rabbit secondary antibody coupled to Cy3 (Jackson Immunolabs) at a 1:500 dilution. Adult defects were recorded with a JEOL 5800 scanning electron microscope after preparative coating with 20 nm of gold/palladium alloy.
RESULTS
Modular regulatory elements with independent function
To map transcriptional control elements, we dissected >40 kb of the string locus into fragments, fused these to lacZ reporter genes containing 0.7 or 0.5 kb string promotors (in pstgβ or pstgHZ, see Methods), and introduced the gene-fusions into flies via P-element-mediated transformation. We then assessed the lacZ mRNA and protein expression patterns driven by these gene-fusions in situ at a variety of developmental stages. DNA fragments from the transcription start sites (at 0 kb) to −26.4 kb upstream drove lacZ transcription in distinct subsets of string expressing cells, and thus we refer to these sequences as position-specific elements (PSEs). Many of these PSEs activated string expression in specific mitotic domains (MDs) in the embryo (Fig. 1, Table 1). For example, a 4.9 kb fragment (in pstgβ-E4.9) drove expression in cycle 14 domains including the mesoderm (MD 10), the mesectoderm (MD 14), the ventral neurectoderm (MD 21, N), and the ventral epidermis (MD M; Fig. 2F,G). Another PSE, the 6.4 kb fragment (in pstgβ-E6.4) drove expression in a different set of cycle 14 domains (MD 1, 2, 15, 18; Fig. 2M,N). For most of the PSE fragments tested, lacZ expression occurred in spatial and temporal patterns that mimicked a subset of the normal string expression pattern. This fine correlation indicates that the PSEs can function independently of each other and that their spacing relative to the string promotor is not critical.
Table 1.
Expression of the string-lacZ fusion constructs shown in Fig. 1
| Reporter gene | Cycles 1–13 | Cycle 14 | Cycle 15 | Cycle 16 & later cycles | Larval neuroblast cycles |
|---|---|---|---|---|---|
| pstgHZ | – |
head
stripes along A/P axis, anterior and posterior midgut |
lateral epidermis (11) (partial, weak) | lateral epidermis (11) CNS |
not analyzed |
| pstgβ | – |
head
stripes along A/P axis, anterior and posterior midgut mesoderm |
lateral epidermis (11) (partial, weak) | lateral epidermis (11) CNS |
L2: MBNbs, CB L3: VNCTh,T, CB, aOPC, pOPC |
| pstgβ-B3.2 | – | – | – | – | – |
| pstgβ-2.3 | – | – | – | – | – |
| pstgβ-E2.2 | – | – | lateral epidermis (11) (partial, weak) | lateral epidermis (11) CNS | not analyzed |
| pstgHZ-B8.2 | maternal | head (1, 2) mesoderm (10) mesectoderm (14) neurectoderm (21, N) ventral epidermis (M) |
head (1*, 2*) mesoderm (10) neurectoderm (21, N*) ventral epidermis (M*) CNS |
head mesoderm (10) tracheal placodes neurectoderm (N*) CNS |
not analyzed |
| pstgβ-E4.9 | maternal | mesoderm (10) mesectoderm (14) neurectoderm (21, N) ventral epidermis (M) |
head mesoderm (10) mesectoderm (14) neurectoderm (21, N*) ventral epidermis (M*) |
head mesoderm (10) neurectoderm (N*) PNS |
L2: MBNbs, VNCTh,A,T, CB, OPC, IPC L3: VNCTh,T, CB, aOPC, pOPC |
| pstgHZ-BX7.7 | – | head (1, 2) CNS |
head (1*, 2*) CNS |
head tracheal placodes CNS, PNS |
not analyzed |
| pstgβ-E6.4 | – | head (1, 2, 15, 18) mesectoderm (14) CNS |
head (1*, 2*, 15) posterior tip of germ band (4) CNS |
head tracheal placodes CNS |
L2: MBNbs, VNCTh, CB, OPC, IPC L3: VNCTh,T, CB, interior optic lobe cells |
| pstgHZ-SpEa2.3 | – | head (1, 2) | head (1*, 2*) scattered cells in ventral epidermis |
head tracheal placodes |
not analyzed |
| pstgHZ-BEa1.2 | – | head (1, 2, 15) mesectoderm (14) |
head (1*, 2*, 15) scattered cells in ventral epidermis |
head tracheal placodes |
not analyzed |
| pstgβ-B5.8 | – | CNS | CNS | CNS, PNS | L2: MBNbs, VNCTh, CB L3: VNCTh,T, CB, pOPC, IPC |
| pstgβ-E2.6 | – | CNS | CNS | CNS, PNS | L2: MBNbs, VNCTh,T, CB L3: VNCTh,T, CB, pOPC, IPC |
| pstgβ-E5.3 | – | CNS hindgut (13) |
hindgut (13) CNS |
CNS dorsal vessel |
L2: MBNbs, VNCTh,T, CB, OPC, IPC L3: VNCTh,T, CB, lamina |
| pstgβ-E6.7 | – | CNS | CNS | CNS | L2 MBNbs, VNCTh,T, CB L3: VNCTh,T, CB, pOPC, IPC |
For each transgenic line, tissues positive for lacZ expression are listed, followed by the corresponding mitotic domain number(s). Expression patterns believed to be spurious (unlike endogenous string) are denoted with italics, and are listed only for the pstgβ and pstgHZ vectors. The same spurious vector expression patterns were also observed with most of the PSE-containing reporter genes, but for simplicity they are not listed again in each row. Note that mitotic domains are often only subsets of the tissues listed. Asterisks (*) denote domains that are subdivided during cycles 15 and 16. Slashes (−) denote no significant expression. Abbreviations are as follows: CNS, central nervous system; PNS, peripheral nervous system; MBNbs, mushroom body neuroblasts; VNC, neuroblasts of the ventral nerve cord; CB, neuroblasts of the central brain; neuroblasts of the inner proliferation center (IPC) and outer proliferation center (OPC) of the optic lobe. Note that VNC neuroblasts are subdivided into those located in the thoracic (Th), abdominal (A) and terminal (T) regions of the VNC. The OPC is subdivided into anterior (aOPC) and posterior (pOPC) regions in the third instar (Fig. 4).
Fig. 2.
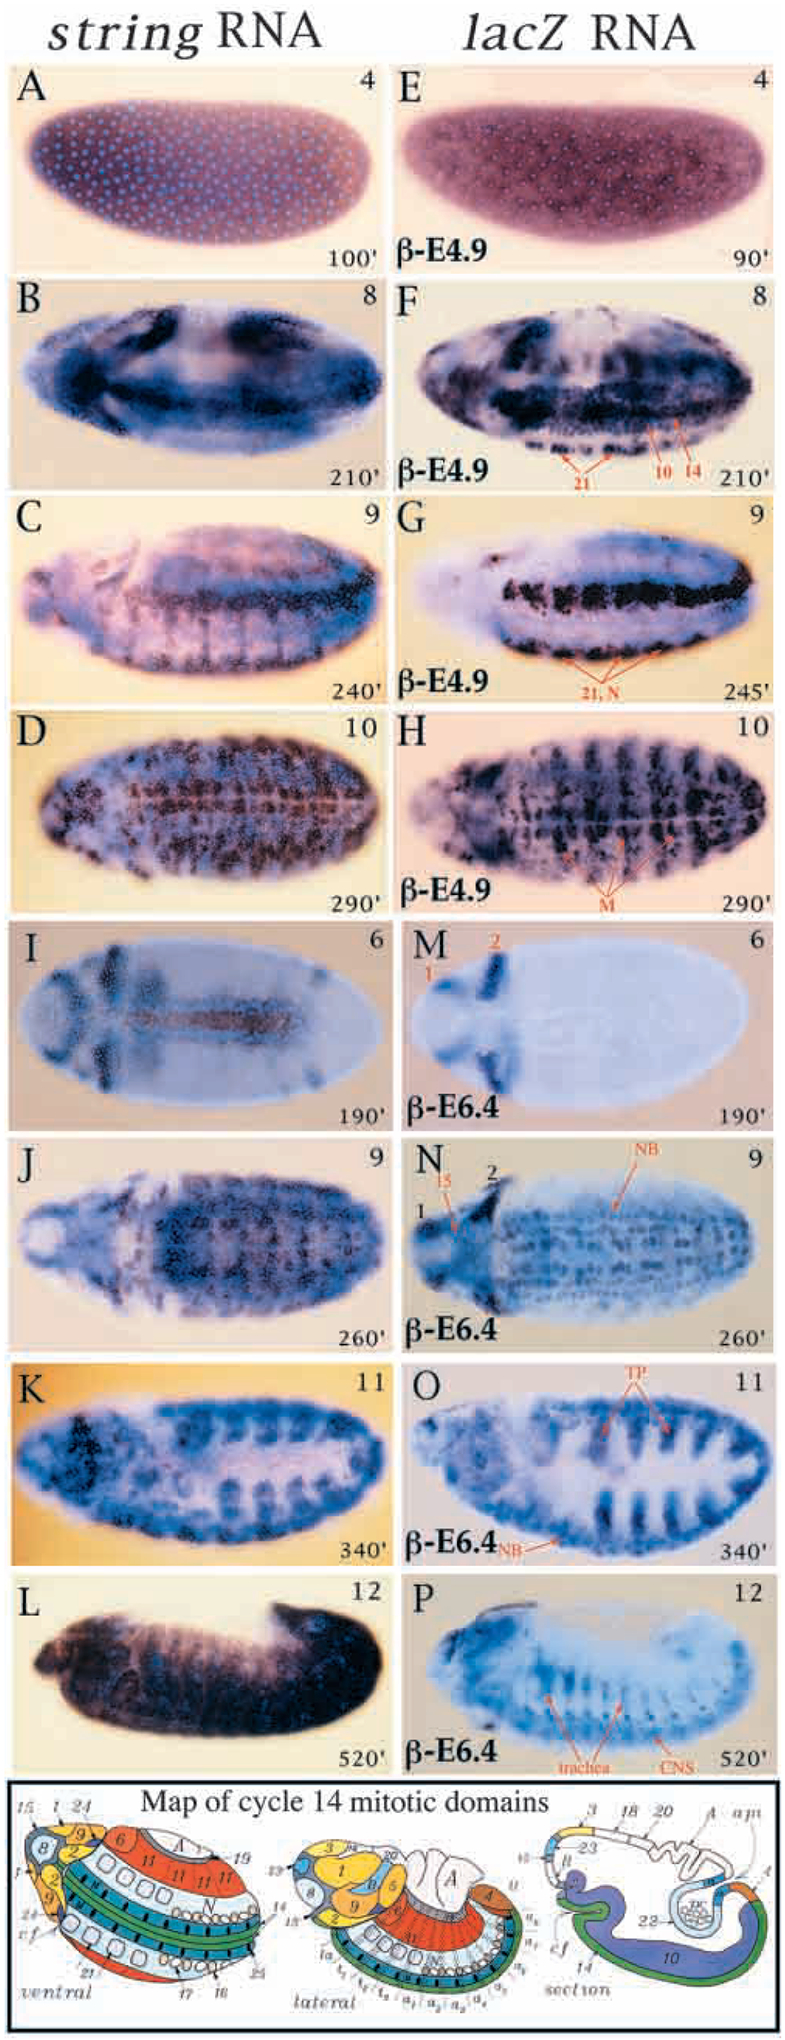
RNA expression of string-lacZ reporter genes. Wild-type string mRNA expression is shown to the left (A-D, I-L), and lacZ mRNA expression in correspondingly staged pstgβ-E4.9 (E-H) and pstgβ-E6.4 (M-P) embryos is shown to the right. Stages are indicated in upper right corners and approximate ages in minutes AED at 25°C are indicated in bottom right corners of each panel. Most embryos are also stained with DNA stain, Hoescht 33258, to illuminate nuclei (light blue). Note views of embryos: (A-C,E-G) ventrolateral; (D,H-J,M,N) ventral; (K,L,O,P) lateral. (A) Maternal stg expression in cycle 12. (E) Maternal lacZ expression in cycle 11. (B) stg expression in MD 1–14 of cycle 14. (F) lacZ expression in MDs 10, 14 and 21 of cycle 14; note the early expression in MD 21 compared to wild type and a lack of expression in the head and lateral epidermis. (C) stg expression in cycle 14 MDs 21–25 and N, cycle 15 expression in the head and lateral epidermis. (G) lacZ expression in cycle 14 MDs 21 and N. (D) stg expression in cycle 14 MD M and cycle 15 expression in the head, ventrolateral epidermis, ventral neurectoderm and neuroblasts. (H) lacZ expression in cycle 14 MD M and cycle 15 ventral neurectoderm; staining in lateral epidermis is background from vector (see results). (I) stg expression in cycle 14 MDs 1–10. (M) lacZ expression in cycle 14 MDs 1 and 2; note lack of expression in domains 3–10. (J) stg expression in cycle 14 MDs M, N and 25 and neuroblasts; cycle 15 expression in the head and lateral epidermis. (N) lacZ expression in cycle 14 MD 15 and neuroblasts (NB), (note that lacZ mRNA persists in MD 15 as it is more stable than string mRNA); cycle 15 expression in the head (subdivisions of MD 1, 2); note lack of expression in cycle 14 MDs M, N, 25 and cycle 15 lateral epidermis. (K) stg expression in tracheal placodes (TP) during cycle 16, expression also in ventral neurectoderm, neuroblasts and head. (O) lacZ expression in tracheal placodes during cycle 16, expression also in neuroblasts and restricted domains in the head. (L) cycle 16 stg expression in the epidermis. (P) lacZ expression is limited to trachea, CNS, brain and head. Bottom: a map of the cycle 14 mitotic domains reproduced from Foe (1989). Mitotic domains are indicated by distinct colors and are numbered according to the order in which they divide.
Most of the string PSEs that we defined activated transcription in multiple cell types and at several developmental stages (Table 1), suggesting that they are composites of smaller more specific PSEs. This possibility was confirmed in several instances when a large PSE was bisected to give smaller PSEs with separate activities (Fig. 1). Many PSEs also drove expression within a particular cell lineage during consecutive cell cycles. For example, the 6.4 kb PSE (in pstgβ-E6.4) drove expression in cells of mitotic domains 1 and 2 during embryonic cycles 14, 15 and 16 (Table 1). Similarly, the PSEs that drove expression in cycle 14 MDs 10, 14, 15, 21, N and M also promoted expression in the analogous MDs during cycle 15 and in some cases during cycle 16. However, many cycle 14 domains are subdivided during cycles 15 and 16 (Foe, 1989), and we found several instances in which a particular PSE drove expression in some subdomains and not in others (Table 1). We conclude that the string PSEs function in a cell type-specific fashion, rather than as developmental timers. Their activities most likely depend upon the expression of position-specific transactivators which are expressed over times spanning several cell cycles within a given cell lineage (Arora and Nüsslein-Volhard, 1992; Edgar et al., 1994a).
Promotor/PSE interactions suggest complex regulation
In testing the vectors used to make the various string reporter genes, we noted several interesting properties of the string promotor. First, the promoter contains sequences that allow it to respond specifically to distant PSEs. This was inferred from the following findings. When several PSEs were tested in a derivative of the stgHZ vector that contained the hsp70 minimal promoter but lacked string promotor sequences, they failed to activate lacZ expression in vivo (Peter Wigley and R. S., unpublished data). A deletion variant of pstgHZ lacking string sequences between −525 bp and −425 bp also failed to express when tested using the 1.2 kb PSE, which was active in the non-deleted version of pstgHZ (as pstgHZ-BEa1.2; Fig. 1 and data not shown). This indicates that string promotor sequences between −525 and −425 bp are required to mediate transcriptional activation by the string PSEs. Such promotor/enhancer specificity has been noted in studies of other Drosophila loci, and may be a common mechanism by which enhancers like the string PSEs activate only the relevant gene within a chromosomal region (Merli et al., 1996; Ohtsuki et al., 1998).
Other experiments suggested that some interactions between the PSEs and the string promotor are repressive. Specifically, we found that the pstgHZ and pstgβ vectors, which contain only promotor-proximal sequences, drove ectopic expression patterns that differed both spatially and temporally from normal string expression. These consisted of abnormal expression throughout the head at the cellular blastoderm stage and in the mesoderm, anterior midgut (AMG) and posterior midgut (PMG) during gastrulation (Table 1). Interestingly, the ectopic expression in the head and mesoderm was lost when certain PSEs were added to pstgβ (as in pstgβ-E6.4), and the ectopic AMG and PMG expression was lost in constructs containing sequences 3′ to the promotor, such as pstgβ-3.2 and pSTG6.0. A similar relationship was discovered in the developing optic lobe of the larval nervous system: the pstgβ vector was expressed throughout a region known as the outer proliferative center (OPC), but parts of this expression were lost when various PSEs were added to pstgβ (Table 1; Fig. 4). This suggests that, in addition to positive regulatory elements, the string locus contains negative elements that restrict the activity of the promotor. Due to the complexity of mapping such repressor sequences, we have not included them in Fig. 1 or Table 1.
Fig. 4.
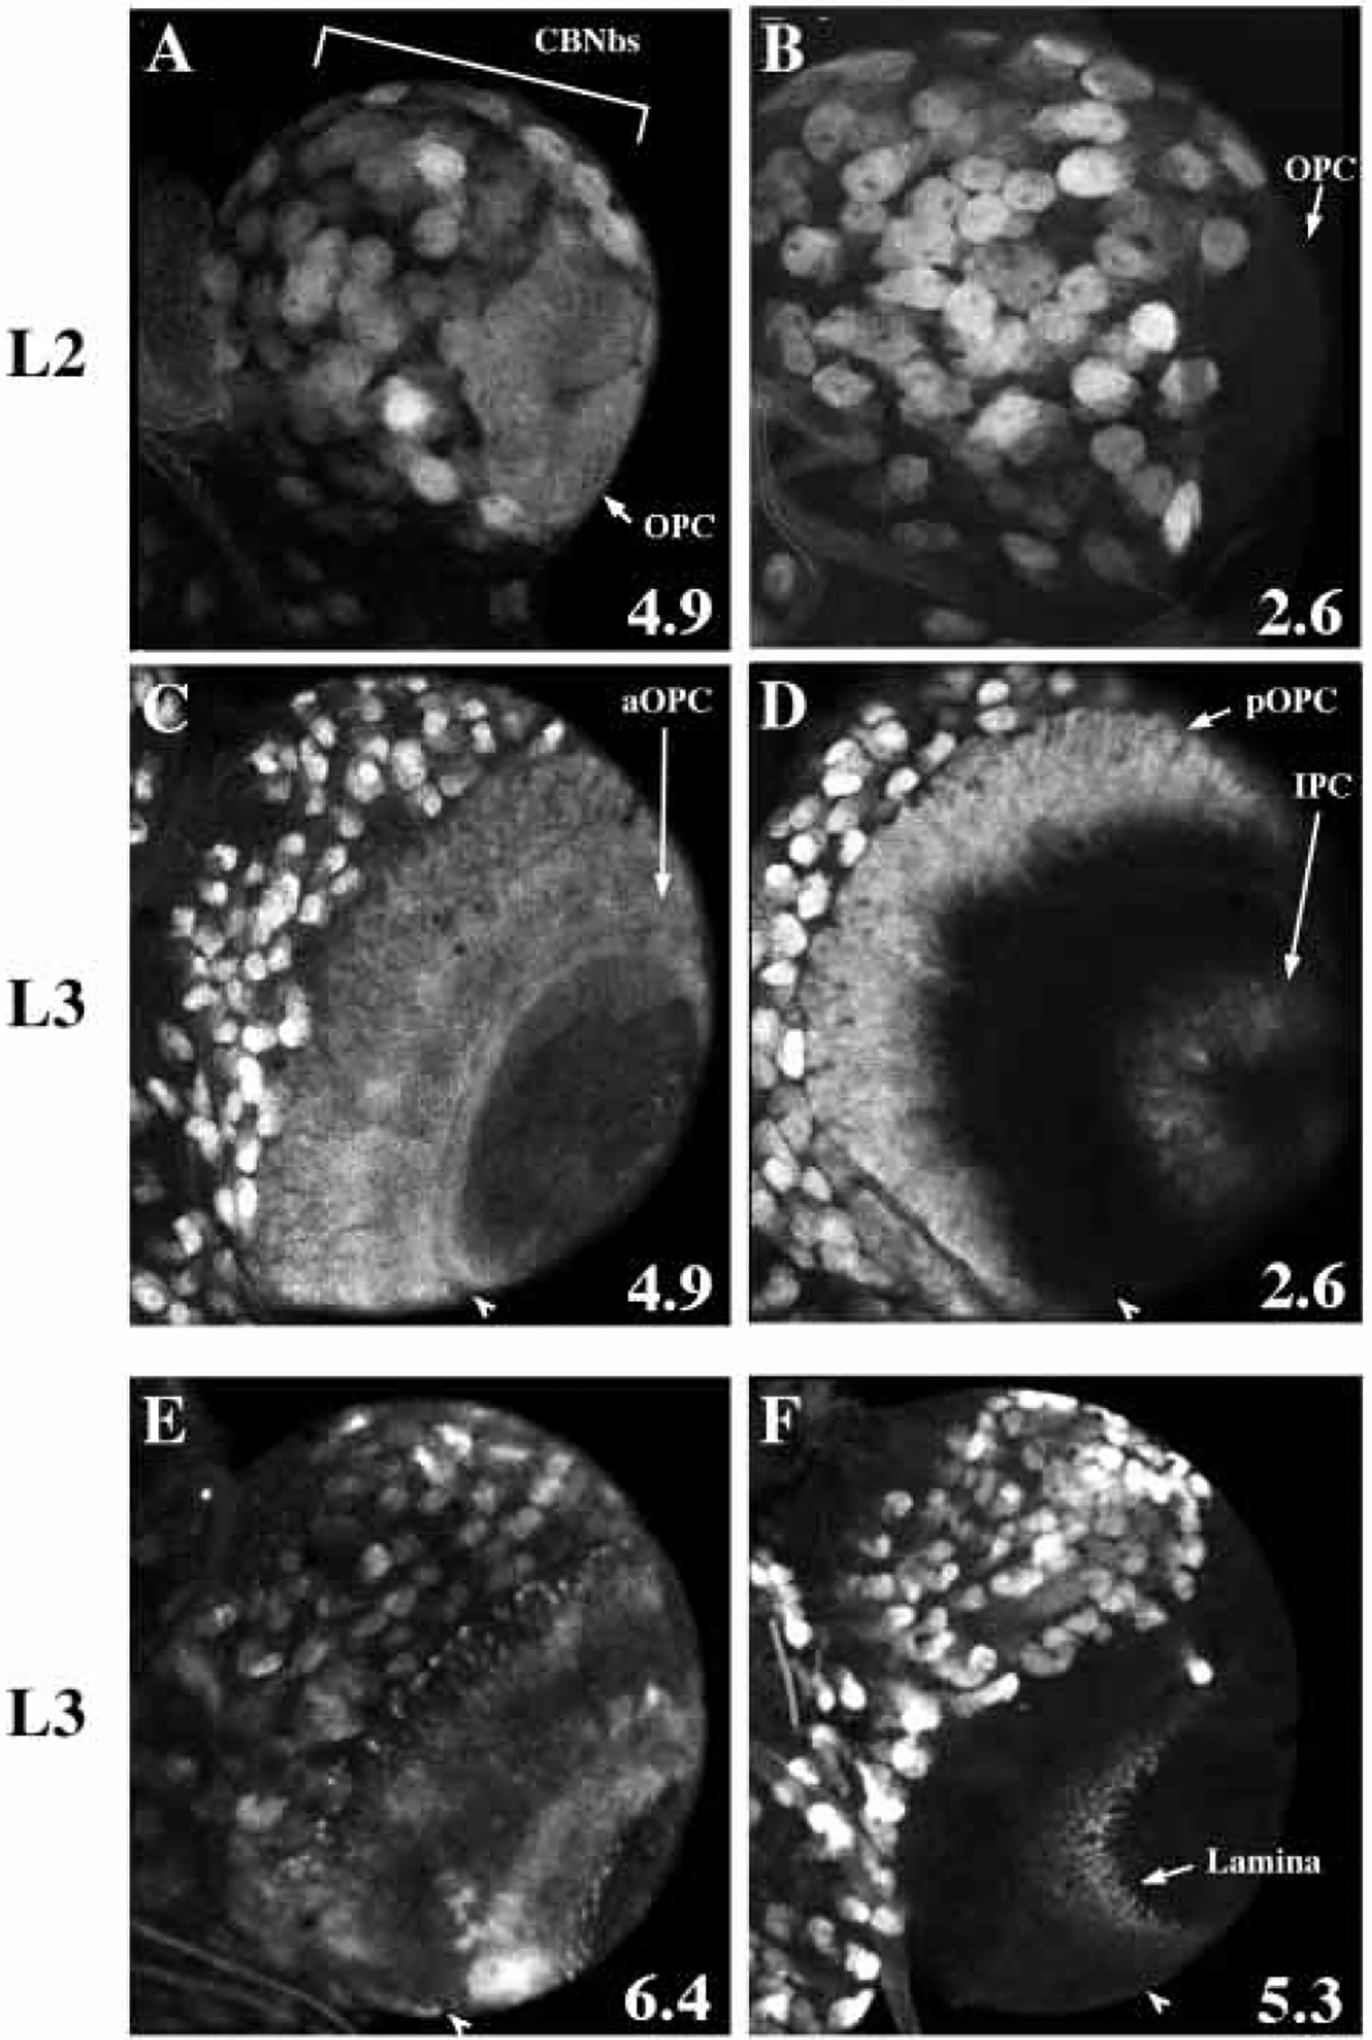
β-gal protein expression in the larval CNS driven by four string-lacZ lines. All views are of a single brain lobe from the ventral side. (A,B) In the second instar optic lobe, pstgβ-E4.9 drives expression in the outer proliferation center (OPC) while pstgβ-E2.6 does not (arrows). Bracket in A marks the central brain region (CBNbs). (C-F) Four classes of expression pattern observed in the third instar optic lobe. Arrowheads indicate the lamina furrow in each panel as a landmark. (C) pstgβ-E4.9 drives β-gal expression in the anterior OPC (aOPC) and posterior OPC (pOPC). (D) pstgβ-E2.6 drives expression in the pOPC and inner proliferation center (IPC). (E) pstgβ-E6.4 drives expression in cells that lie under the surface of the brain, and are most likely progeny of the OPC and IPC neuroblasts. (F) pstgβ-E5.3 drives expression in lamina cells. lacZ transcript was undetectable by in situ hybridization in most larval neuroblasts, suggesting that the 0.7 kb promoter element drives transcription in these cells at a very low level. Since β-gal protein is stable, the expression patterns shown are presumably due to the accumulation β-gal protein over many hours of development.
Differential, combinatorial control during neurogenesis
Embryonic neuroblasts delaminate from the neurectoderm in five waves, S1-S5, followed by string expression and then cell division (Campos-Ortega and Hartenstein, 1985; Hartenstein et al., 1987, 1994; Doe, 1992; Weigmann and Lehner, 1995). We found that >15 kb of the string regulatory region is dedicated primarily to expression in neuroblasts. Within this region, we analyzed the expression patterns promoted by four separable and contiguous PSEs. The 6.4, 2.6, 5.3 and 6.7 kb PSEs all drove expression in overlapping subsets of neuroblasts throughout embryogenesis. We illustrate these patterns for the S1 neuroblasts in Fig. 3. The 6.4 kb PSE is a strong activator for all early S1 neuroblasts except one cell-type: MP2. In contrast, the 2.6, 5.3, and 6.7 kb PSEs express in smaller subsets of S1 neuroblasts. Mitosis in embryonic neuroblasts is immediately followed by S-phase, and therefore BrdU pulse-labeling has been used to track the division pattern in these cells (Weigmann and Lehner, 1995; Fig. 3). This analysis indicated that the neuroblasts of the lateral row (NBs 2–5, 3–5, 5–6, 7–4) plus NB 5–2 and 5–3 divide first, followed by the division of NB 7–1 and 1–1, and subsequently NB 3–2 and MP2. Interestingly, we found that three or four PSEs activated transcription in those neuroblasts that divide earliest. In contrast, fewer PSEs drove expression in the later dividing S1 neuroblasts. This suggests that the timing of neuroblast divisions may depend on rates of string accumulation driven by the additive effect of multiple PSEs.
Fig. 3.
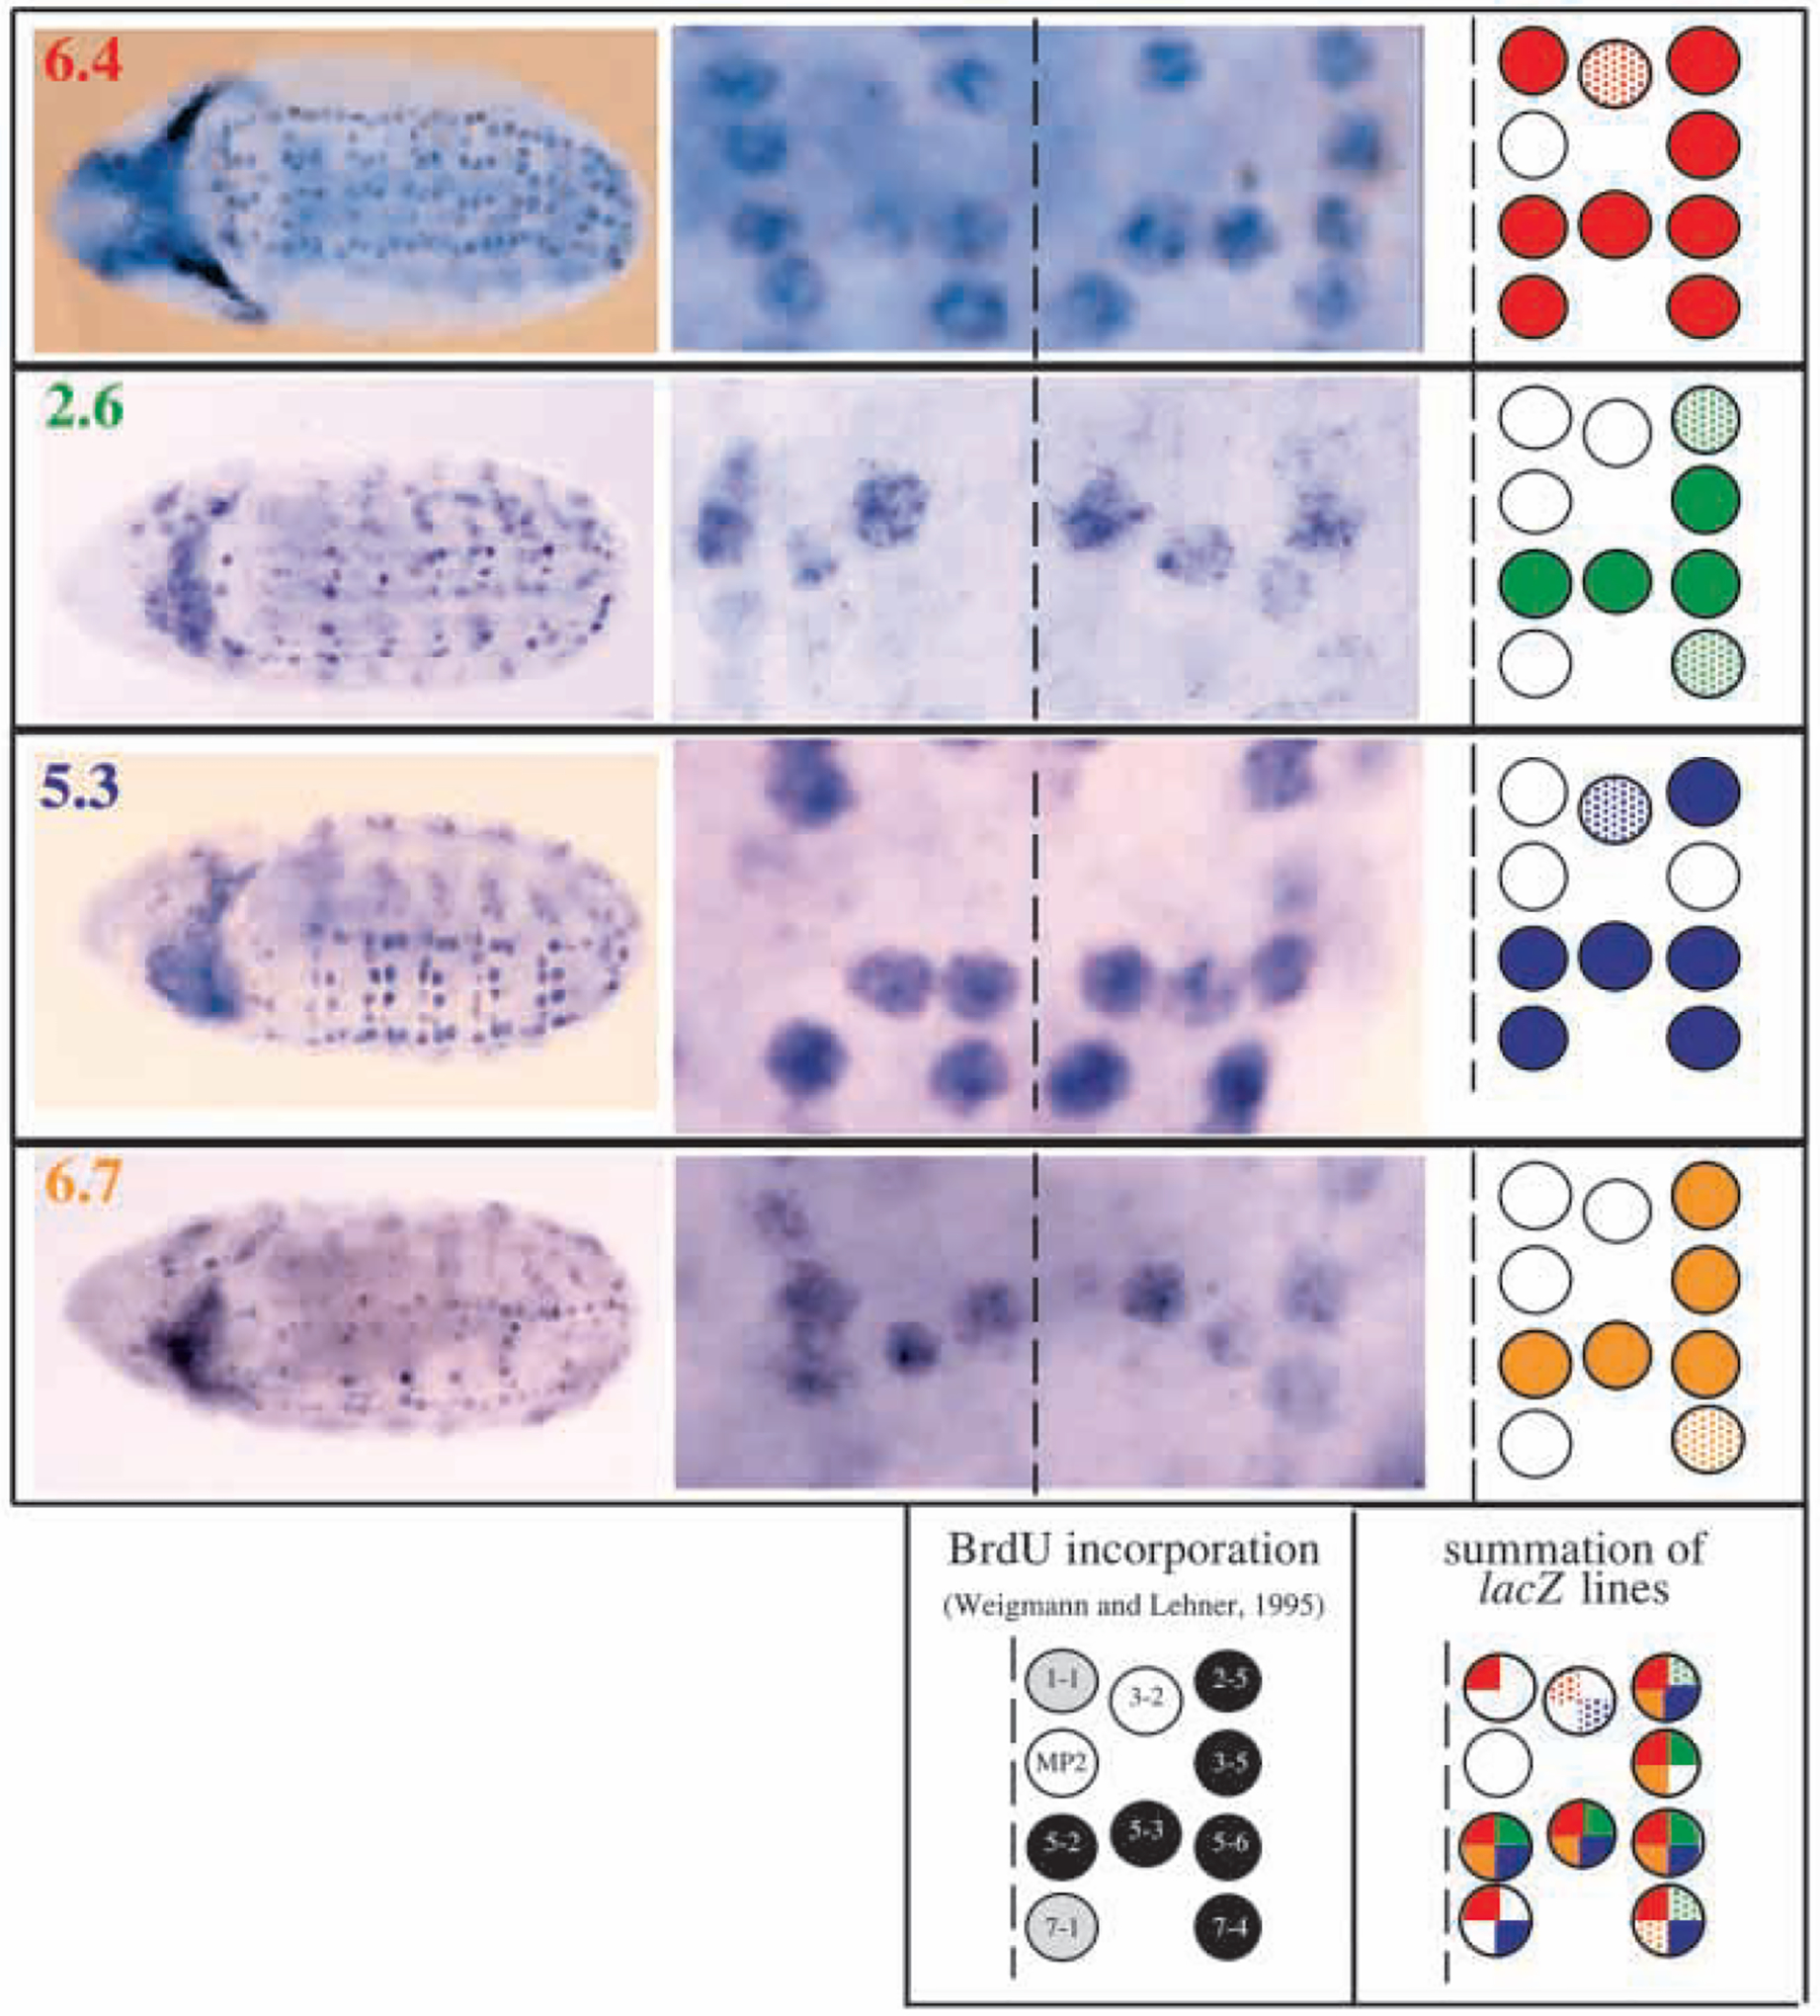
Overlapping patterns of embryonic S1 neuroblast expression driven by pstgβ-E6.4, pstgβ-E2.6, pstgβ-E5.3 and pstgβ-E6.7. Neuroblast expression at stage 9 is shown in whole embryos (left) and first abdominal segments (center). The midline of each segment is represented by a dashed line. As the timing of delamination and the position of neuroblasts varied slightly, more than 30 embryos from each line were analyzed to define the patterns represented schematically (rightmost column). Neuroblasts that express lacZ consistently are represented by solid colored circles. Neuroblasts that show weak, late or inconsistent expression are stippled. Neuroblasts that lack expression are represented by empty circles. A schematic representing the pattern of BrdU incorporation in S1 neuroblasts (Weigmann and Lehner, 1995) is included below. Black circles represent the neuroblasts that divide first, stippled circles represent the neuroblasts that divide second, and white circles represent the last S1 neuroblasts to divide. A schematic representing the summation of the lacZ lines is depicted in the lower right. Each circle is colored with the appropriate number of solid or stippled quarters that represent strong or weak expression driven by individual lines.
During larval neurogenesis, string mRNA is expressed in neuroblasts of the ventral nerve cord (VNC) and the central brain (CB), and in complex patterns in the developing optic lobe including the inner and outer proliferation centers (IPC and OPC) and the lamina (not shown but see Fig. 4). We analyzed patterns of β-gal protein expression driven by the string PSEs in the CNS of second and third instar larvae, and found that those PSEs that activated expression in embryonic neuroblasts also functioned in larval neuroblasts (Figs 1, 4; Table 1). We also found that the 0.7 kb promoter in pstgβ, which is active in a few CNS neuroblasts late in embryogenesis, was expressed in many larval neuroblasts. All transgenes containing this 0.7 kb promotor showed expression in neuroblasts of the CB and the thoracic VNC during the second and third larval instars. In addition, we observed distinct, PSE-specific expression patterns in the developing optic lobe (Fig. 4). For example, in second instar larvae, the 4.9 kb PSE drove expression in the IPC and OPC, while a different PSE, the 2.6 kb, did not (Fig. 4A,B). In third instar larvae, the 4.9 kb PSE drove expression in the entire OPC while the 2.6 kb PSE drove expression in the IPC and only the posterior portion of the OPC (Fig. 4C,D). Yet another PSE, the 6.4 kb, drove expression in a different subset of cells in IPC and OPC regions that lie under the surface of the brain (Fig. 4E). This pattern may correspond to the progeny of the optic lobe neuroblasts going through additional divisions after budding interior to the proliferation centers. Finally, the 5.3 kb PSE drove expression in cells of the developing lamina (Fig. 4F). These results indicate an important role for the multiple neuroblast PSEs in regulating the complex proliferation patterns of optic lobe development.
Embryonic mitoses require >31.6 kb of string regulatory DNA
Within the ~50 kb region under study, we identified PSEs responsible for only a subset of all proliferating cells. One explanation for our failure to detect PSEs for all cell types is that expression in certain regions requires synergistic interactions between multiple PSEs. To test this, we isolated a 31.6 kb genomic DNA fragment covering the string transcription unit and 24 kb of intact upstream sequence (STG31.6; Fig. 1). The function of this fragment was tested in two string mutants that completely block postblastoderm cell divisions (stgAR2 and stg7B). As expected, string mRNA and BrdU incorporation (a measure of cell cycle progression) were detected in stgAR2 P[STG31.6] and stg7B P[STG31.6] embryos in all the mitotic domains where lacZ expression was driven by the individual PSEs (Fig. 5). Interestingly, STG31.6 also drove string expression and mitosis in a few domains that were not detected using the stg-lacZ reporter lines. These included parts of cycle 14 MD 11 and MD 23 and cycle 15 MD 3, MD 6 and MD 19 (Fig. 5). Thus the PSEs may interact additively or synergistically to drive portions of string’s expression pattern.
Fig. 5.
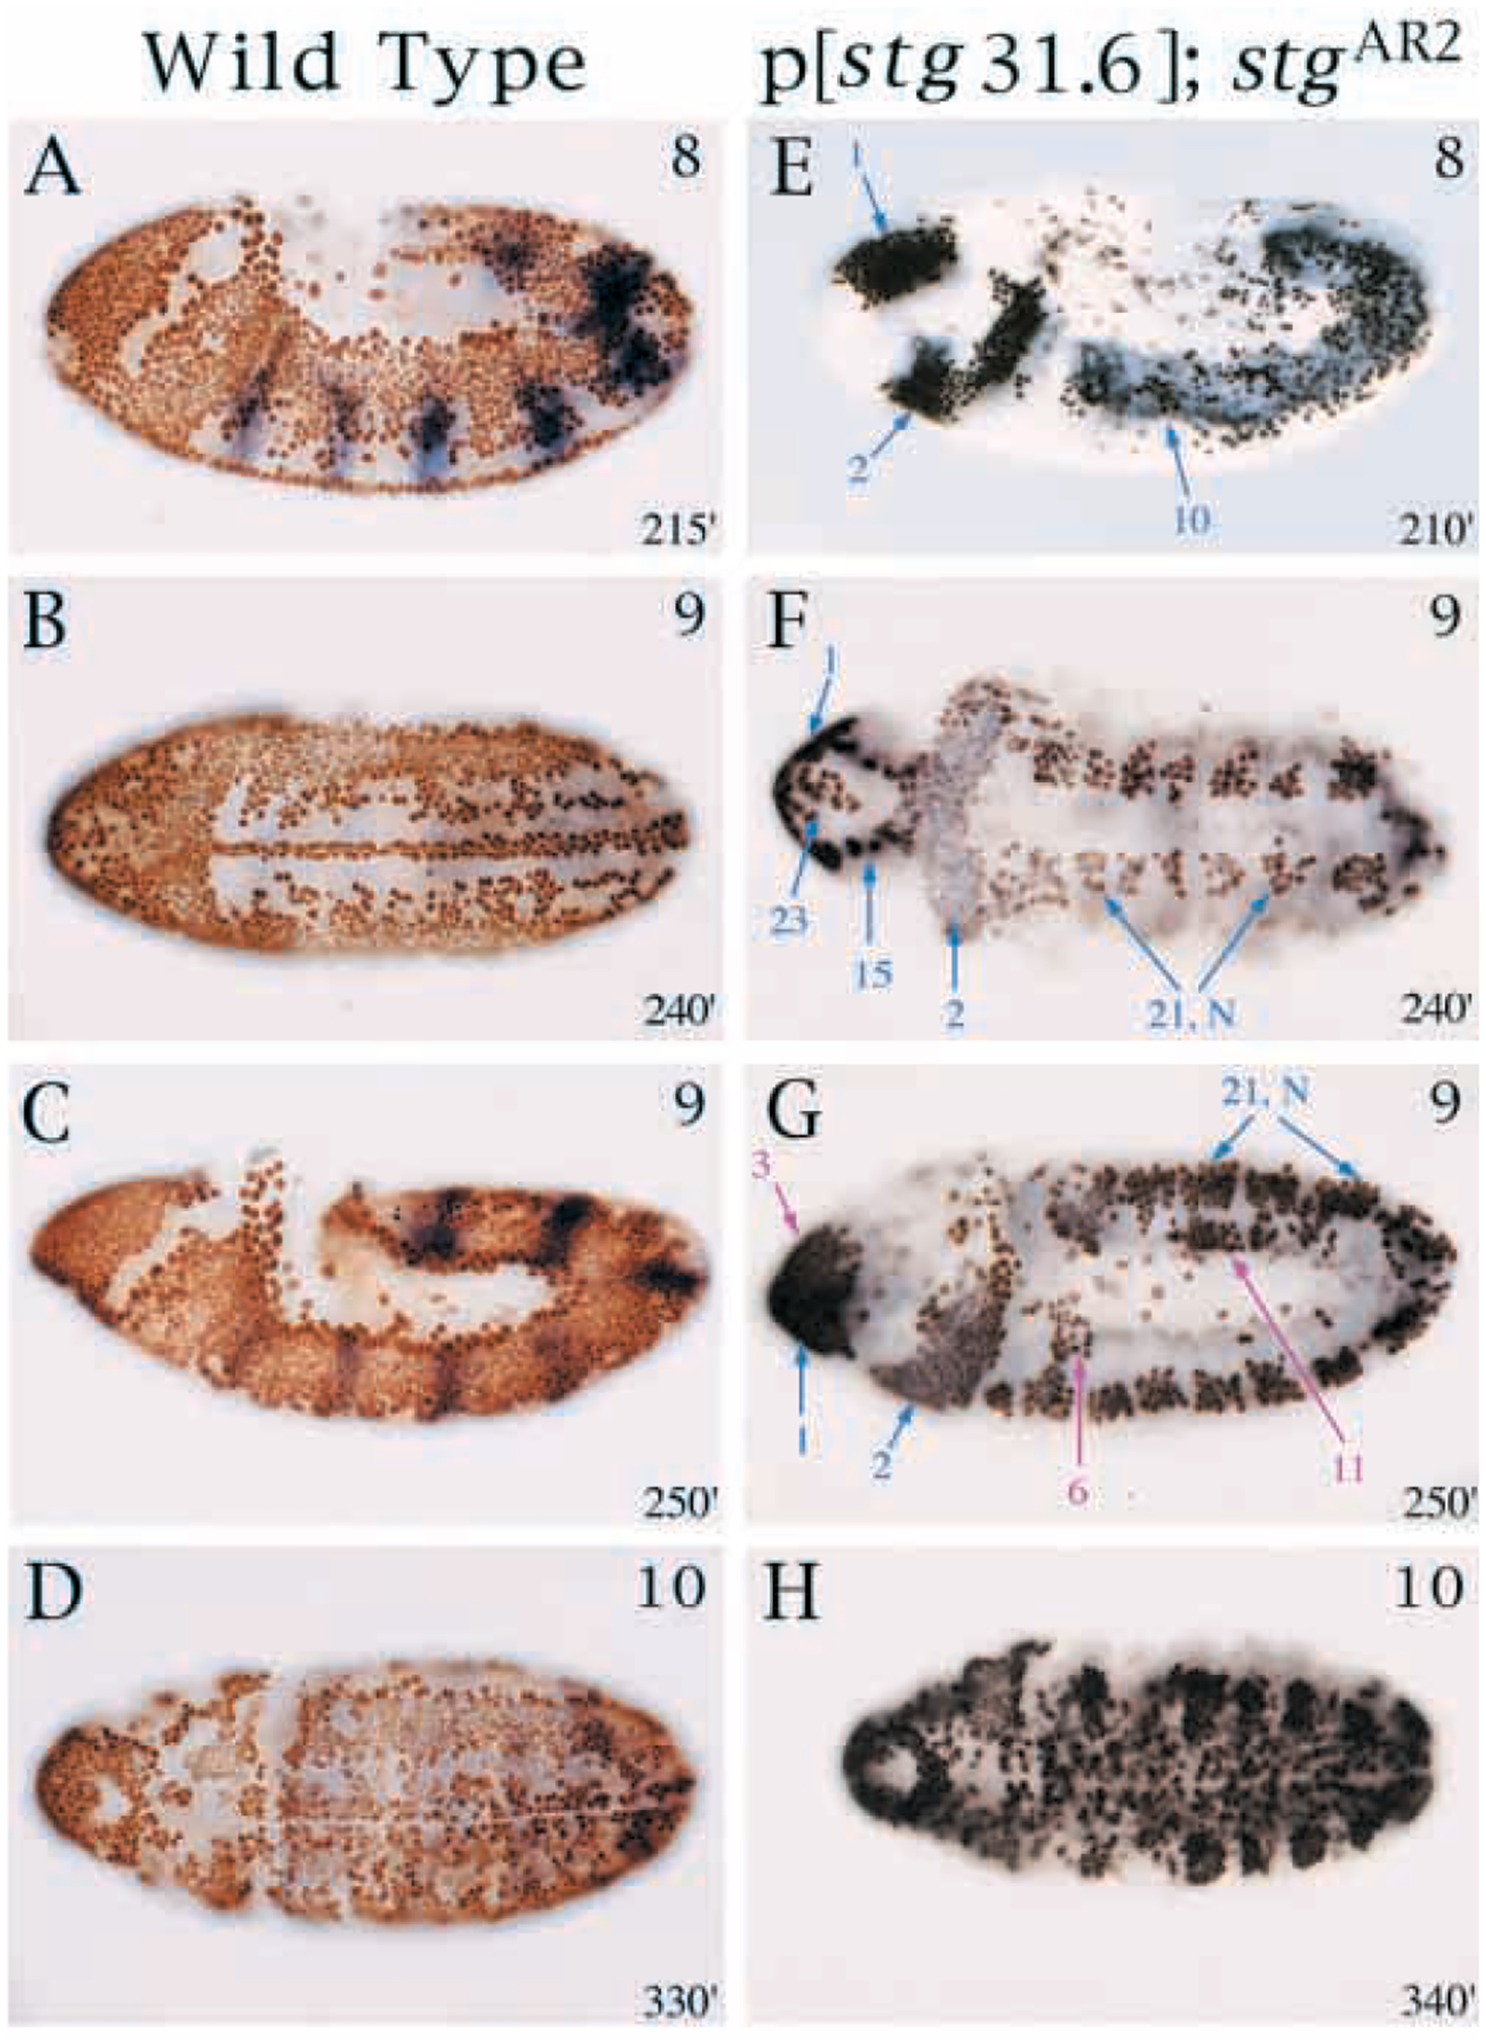
Embryonic cell cycles driven by a 31.6 kb string transgene. (A-D) Normal BrdU incorporation in control P[w+STG31.6]; stgAR2/TM3 Sb (P[ry+ ftz -lacZ]) embryos. (E-H) BrdU incorporation driven by the 31.6 kb transgene in a homozygous string null background; P[w+STG31.6]; stgAR2. All embryos are labeled with BrdU (brown or black stain) for 1 hour at 25°C and anti-β-gal antibody (blue) to detect the balancer. Approximate stages are indicated in upper right corner and age in minutes AED at 25°C is indicated in bottom right corners. Note views of embryos: (A,C,E,G) lateral; (B,D,F,H) ventral. (E-G) Mitotic domains driven by the 31.6 kb transgene that are also activated by individual PSEs are indicated by blue arrows. Mitotic domains in which cell division is driven by the 31.6 but not by the individual lacZ lines are indicated by fuchsia arrows and include cycle 15 MD, 3, 6 and parts of 11. BrdU incorporation in cycle 14 MDs 11 and 14, and cycle 15 MD 19 occurs but is inconsistent (data not shown). (H) Additional cycle 15 domains incorporate BrdU.
Despite these findings, the division patterns driven by STG31.6 still represented only a subset of the wild-type division pattern (Fig. 5). Consistent with this, stg7B P[STG31.6] embryos died with mild cuticular defects that can be attributed to partial loss of cell division in MD11 (the dorsolateral epidermis). Our studies of the stg-lacZ reporter-genes, and also tests of genomic string transgenes, indicated that additional control elements do not reside in the 16 kb 3′ to string (Fig. 1; Table 1; Edgar et al., 1994a). 5′ to −28 kb, we identified two additional PSEs (in pstgβE2.5 and pstgβE4.3; Fig. 1), but these promoted expression patterns unlike those of the normal string gene, suggesting that they might not normally regulate string. We have yet to identify PSEs controlling string expression in MDs 4, 5, 9, 12 and 20, and results pertinent to MDs 7, 8, 11, 16, 17, 22, 24 and 25 remain ambiguous. These missing regulatory elements may be revealed by analysis of sequences beyond −35 kb.
Imaginal disc growth requires ≤6.0 kb of string regulatory DNA
Imaginal discs are epithelial primordia that undergo growth and cell proliferation in the larva and differentiate structures such as wings, legs and eyes in the adult. string is required and rate-limiting for G2/M progression in the discs (Milán et al., 1996b; Kylsten and Saint, 1997; Neufeld et al., 1998; Johnston and Edgar, 1998). During the initial 6–8 cycles of disc growth, string mRNA is expressed in periodic, spatially random patterns that may reflect oscillation during the cell cycle, and during the final 2–3 divisions, as disc cell cycles become synchronized with the onset of cell differentiation, string displays position-specific expression patterns (Milan et al., 1996a; Thomas et al., 1994; Johnston and Edgar, 1998). To identify the control regions required for string expression in imaginal discs, we generated clones of stg7B cells in the presence of rescuing string transgenes possessing different amounts of flanking regulatory sequence (Figs 1, 6).
Fig. 6.
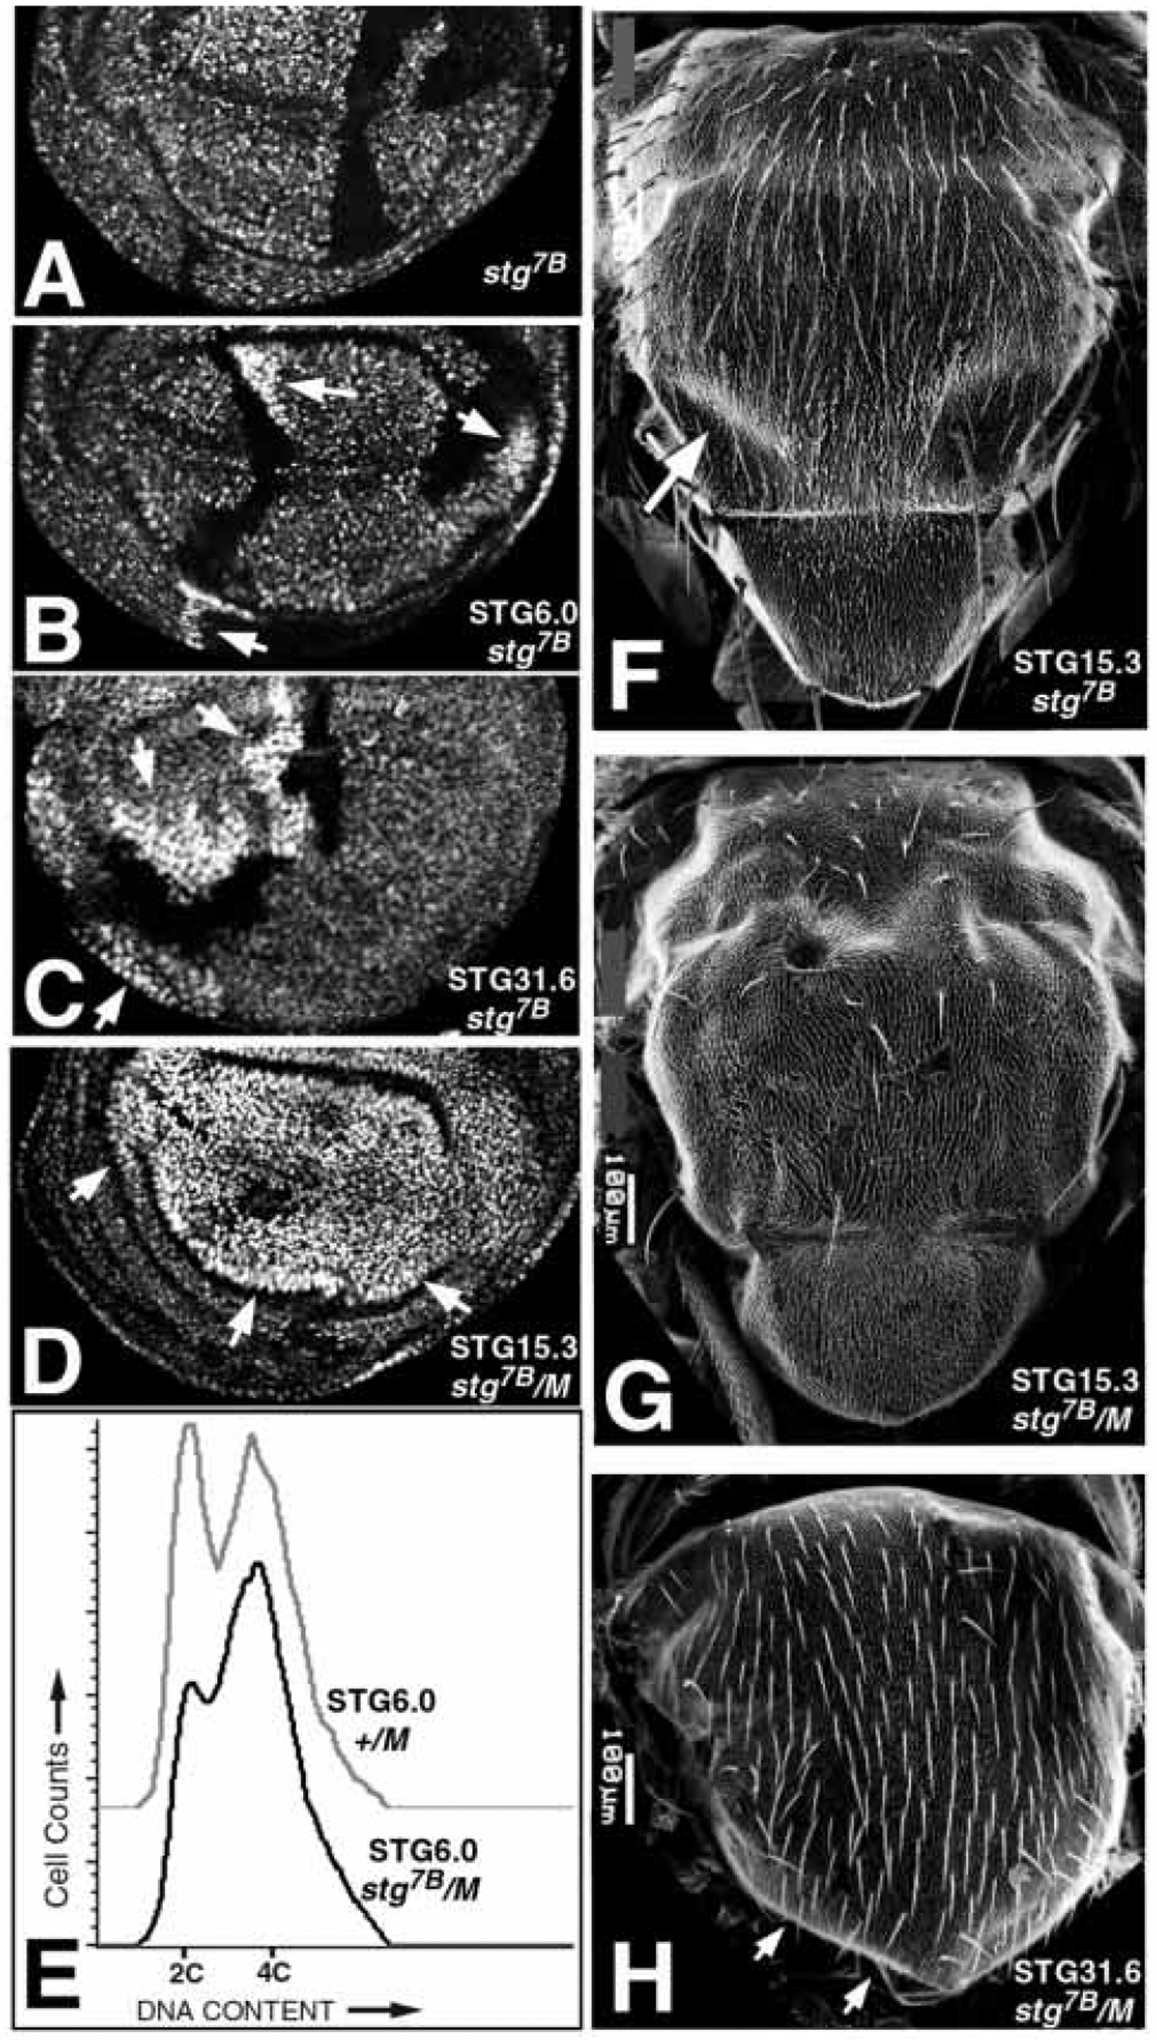
Partial rescue of imaginal disc cell proliferation by string transgenes as small as 6.0 kb. (A-D) Wing imaginal discs in which clones of stg7B cells were induced at 48 hours AED. stg7B π-myc/stg7B π-myc mutant cells are brightly stained (arrows), their +/+ twinspots are black and stg7B π-myc/+ cells are moderately stained. (A) Complete loss of non-dividing stg7B cells. (B) Rescue of stg7B cells by the P[STG6.0] transgene, giving clones of >20 cells. (C) Rescue of stg7B cells by the P[STG31.6] transgene, giving clones equal in size to their twinspots. (D) Rescue of stg7B cells by the P[STG15.3] transgene in a Minute background, giving a clone(s) that encompasses the entire wing pouch; no twin-spots are present. (E) FACS analysis of imaginal discs showing elongation of the G2 phase in stg7B P[STG6.0] cells. Discs were heat-shocked for 2 hours at 37°C at 48 hours AED to induce mitotic recombination, and homozygosity for stg7B, in virtually all cells. See Neufeld et al. (1998) for methods. (F) A missing posterior dorsocentral macrochaete (arrow) in a notum in which clones of stg7B cells were rescued by the P[STG15.3] transgene. (G) Extensive loss of macrochaetae and microchaetae in a notum containing large clones of stg7B cells generated using the Minute technique and rescued by the P[STG15.3] transgene (as in D). (H) Loss of macrochaetae and the scutellum (arrows) in a notum derived from stg7B P[STG31.6] cells, also using a Minute. See Methods for genotypes.
Imaginal disc cells homozygous for stg7B divide only once, giving 2-celled clones that are eliminated by cell competition (Fig. 6A; Kylsten and Saint, 1997; Neufeld et al., 1998). In contrast, stg7B cells carrying the STG31.6, STG15.3, STG10.5 or STG6.0 transgenes (Fig. 1) divided many times and gave large clones of cells (Fig. 6B,C). stg7B clones rescued by the largest string transgene, STG31.6, were equal in size to their wild-type sister clones (‘twin spots’) and thus appeared to grow normally (Fig. 6C). stg7B clones rescued by the other string transgenes were smaller than their twin-spots, and also showed increased cell size and Cyclin A accumulation. This suggested that cells rescued by the shorter string transgenes had a slower cell cycle with a lengthened G2 phase. Analysis of cell cycle phasing by flow cytometry (FACS) confirmed that STG6.0-driven cells had an increased G2 phase (Fig. 6E), and also showed that STG31.6-driven cells had a normal cell cycle with no increase in G2 (not shown). This suggests that the STG31.6 transgene has increased function relative to the STG6.0 transgene. However, we found that all of the string transgenes including STG6.0 were able to rescue cell division in all regions of the wing, leg and eye imaginal discs. This suggests that region-specific PSEs are not used during imaginal disc growth.
Very large clones of stg7B cells rescued by any of the string transgenes could be generated using the Minute technique (Fig. 6D; Simpson and Morata, 1981). These clones often encompassed the majority of the disc tissue (Fig. 6D), and discs containing them grew to full size and differentiated normally sized adult structures (Fig. 6G). This confirms that even the smallest string transgene, STG6.0, is sufficient to support cell cycle proliferation in all regions of the imaginal disc cells. Consistent with this interpretation, we observed that the pstgβ reporter gene, containing virtually the same 0.7 kb promotor as STG6.0, was expressed in all the imaginal discs in a manner similar to the early, unpatterned expression of string (not shown). We conclude that an imaginal disc PSE resides between −1 kb and +5 kb, and is probably embedded in the 0.7 kb promotor used in the pstgβ vector (Fig. 1).
In performing these rescue experiments, we noted that adult flies carrying clones of stg7B cells rescued by any of the string transgenes had defects in differentiated cuticular structures. These included fused facets and missing bristles in the eye (not shown), and missing sensory bristles (macrochaetae and microchaetae) in the wing, leg, and notum (Fig. 6F–H). These deletions appeared to be specific to neural cell types since, in most cases, sensilla were lost without deletions of the underlying epidermis. Losses of epidermal tissue were rare; only the scutellum was frequently affected (Fig. 6H). We infer that sequences not encompassed by STG31.6 are required specifically for cell cycle control in the neural cell lineages that generate sensilla and ommatidia in the adult cuticle.
Analysis of patterns expressed by the stg-lacZ reporters in imaginal discs uncovered several phenomena that are consistent with this scenario. For instance, in the eye disc, the pstgβ vector was expressed at moderate levels anterior to the morphogenetic furrow (MF), depressed in the furrow and expressed at lower levels posterior to the furrow (not shown). These patterns are a subset of the normal string expression pattern in the eye (Thomas et al., 1994). However, none of the stg-lacZ reporter genes shown in Fig. 1 drove the strong stripe of expression exhibited by string just anterior to the MF (not shown). This stripe is thought to synchronize cells in G1 prior to the onset of differentiation, and loss of cell cycle synchronization in the MF results in roughening of the eye (Thomas et al., 1994). Loss of string-mediated cell cycle synchronization and consequent defects in the patterning of cell differentiation may explain the patterning defects in eyes composed of stg7B tissue rescued by the STG31.6, STG15.3 or STG6.0 transgenes. Interestingly, a viable string allele, stgHWY, fails to express string in the stripe anterior to the MF, and causes roughening of the eye and loss of macrochaetae. Consistent with our results, these defects in stgHWY cannot be rescued by the STG31.6 transgene (H. Stocker and E. Hafen, personal communication).
DISCUSSION
string’s regulatory region is a pattern integrator
Previous studies have shown that string transcription is altered in highly specific ways in embryos mutant for axis, gap, pair rule, segment polarity, homeotic, neurogenic, and proneural genes (Foe and Odell, 1989; Arora and Nüsslein-Volhard, 1992; Edgar et al., 1994a). Many of these genes encode transcription factors that are expressed in spatiotemporal patterns which resemble the string expression pattern, making these genes probable regulators of string transcription. Given the extensive array of cis-acting control elements at the string locus, we expect that many of these transcription factors act directly, through binding sites in the string PSEs. Despite this situation, there are no cases where string expression in a particular mitotic domain coincides precisely in space and time with the expression of a pattern formation gene. This is almost certainly because string is regulated combinatorially, rather than by a single activator in each cell type.
This situation is much like that discovered in studies of the pair-rule genes even skipped (eve) and hairy, which employ separate elements to control expression in different stripes of cells in the blastoderm embryo (Harding et al., 1989; Howard and Struhl, 1990; Riddihough and Ish-Horwicz, 1991). In these cases, individual control elements consist of closely juxtaposed binding sites for position-specific activators and repressors and it is the combinations of these factors in a cell that determine the net transcriptional output (Small et al., 1992, 1996; Langeland et al., 1994). Detailed analysis shows that repressors that function through quenching, competition or direct repression usually bind within 100bp of the activator sites they affect, and influence single control elements locally rather than having a dominant affect on the promoter (Gray et al., 1994; Gray and Levine, 1996a,b). Although our analysis of >40 kb of string regulatory DNA revealed only a few cases of transcriptional repression, the regulatory elements that we analyzed are large and multifunctional. Their expression patterns are generally subsets of the patterns exhibited by their putative trans-activators, and thus we expect that many short-range repressor sites reside within the control elements that we tested. Notably, some of the patterns that we mapped also indicated long-range repressive interactions in which a PSE restricted the basal activity of the string promotor (e.g. pstgβ-E6.4 in the embryonic head, mesoderm and the wing imaginal disc).
The evolution of control regions for cell cycle genes
While cell cycle regulators in yeast and cultured cells seem often to be controlled by cell growth or cell cycle progression itself, studies of string provide an informative example of control by developmental programming. Work on other cell cycle genes in Drosophila, such as cyclin E and p27dacapo suggests that this mode of regulation is quite common (L. Jones, H. E. Richardson and R. Saint, personal communication; J. de Nooij and I. Hariharan, personal communication). How did cell cycle control genes evolve their link to the pattern formation system? Our finding that a compact promotor-proximal element provides string activity during imaginal disc growth provides one clue. An attractive model for this element’s role is that it responds directly to cellular growth rates, rather than to patterned transcription factors, and thus functions to couple increases in cell mass with cell cycle progression. Overexpression studies have shown that string transcription in the imaginal discs can be activated by the E2F transcription factor (Neufeld et al., 1998). E2F promotes expression of a large set of cell cycle genes in diverse cell types and species, and could potentially serve to couple growth factor signaling, or growth itself, to cell cycle progression (see Neufeld and Edgar, 1998). Perhaps the promotor-proximal sequences that drive string expression during imaginal disc growth are related to the primordial control elements that drive cell cycle gene expression in the growth-coupled cell cycles of yeast, and also in cultured mammalian cells. In growing tissues such as an early imaginal disc, the use of such a simple control element is appropriate since cells must pace division rates with growth to maintain a normal cell size. But in embryonic cells, which divide very rapidly and lose mass with each division, or neuroblasts, which synchronize their divisions with cell determination functions, growth-coupled transcription of cell cycle genes would be inappropriate. In these situations, which are rarely encountered by single-celled organisms, additional regulatory elements would be required.
These additional elements may have been acquired from other genes and added to a primordial, growth-regulated string promotor in a piecemeal fashion. Several correlations suggest this. For example, string and the HLH transcription factor collier are both expressed coincidentally in MD2, and both fail to be expressed in embryos mutant for buttonhead, an SP1-like transcription factor that is also specifically expressed in MD2 (Edgar et al., 1994a; Crozatier et al., 1996). Thus string and collier appear to have functionally related PSEs that respond to buttonhead. Similarly, string expression in the mesectoderm is coincident with but not dependent upon the mesectodermal specifying transcription factor single-minded (Nambu et al., 1990, 1991; Edgar et al., 1994a). Thus string and single-minded appear to have functionally related mesectodermal enhancers. Cases like these suggest that string’s control region could have evolved through the gradual acquisition of regulatory elements from other genes, like collier and single-minded, that are expressed in specific spatiotemporal patterns.
As mentioned in the introduction, we believe there is a selective advantage in coordinating mitotic timing with morphogenetic processes that place high demands on the cytoskeleton, such as gastrulation and neuroblast delamination. This could favor string’s acquisition of regulatory elements from other genes that respond to transcription factors involved in controlling these processes. This may explain why string has a PSE that ensures that mitosis 14 in the mesoderm occurs after the most violent gastrulation movements are over. A similar argument could explain why string maintains so many neuroblast-specific PSEs. These most likely respond to proneural factors, and could have been co-opted from other genes that are activated as neuroblasts are determined (see Johnston and Edgar, 1998). Neural lineages are typically invariant and precisely coordinated with the asymmetric segregation of determinants used in cell differentiation. Because of this, altering division timing in these lineages can result in altered cell specification and defective neural function (Hartenstein and Posakony, 1990; Weigmann and Lehner, 1995; Cui and Doe, 1997). Thus there may have been great selective pressure for a cell cycle control gene like string to acquire the extensive proneural responsive PSEs that we describe here. DNA sequence alignments of the string PSEs with other pattern responsive promoters may reveal whether these PSEs were actually acquired through duplication from other genes, or represent examples of convergent evolution.
Acknowledgments
We thank Samuel Gwynn, Carter Hoffman, Peter Wigley, and David Glover for sharing unpublished results. We are grateful to Victoria Foe for helpful insights throughout the project, to Sanjeev Datar for comments, and to David Nochimson for manuscript preparation. The P1 clone was provided by the Berkeley Drosophila Genome Project. Work in the Edgar laboratory was supported by NIH GM51186, GM58282, the Lucille P. Markey Charitable Trust and the Rita Allen Foundation. Work in Rob Saint’s laboratory was supported by the Australian Research Council. J. S. B. is a Howard Hughes Medical Institute predoctoral fellow.
REFERENCES
- Arora K and Nüsslein-Volhard C (1992). Altered mitotic domains reveal fate map changes in Drosophila embryos mutant for zygotic dorsoventral patterning genes. Development 114, 1003–1024. [DOI] [PubMed] [Google Scholar]
- Bodmer R, Carretto R and Jan YN (1989). Neurogenesis of the peripheral nervous system in Drosophila embryos: DNA replication patterns and cell lineages. Neuron 3, 21–32. [DOI] [PubMed] [Google Scholar]
- Breeden L (1996). Start-specific transcription in yeast. Curr. Topics Microbiol. Immunol 208, 95–127. [DOI] [PubMed] [Google Scholar]
- Campos-Ortega JA and Hartenstein V (1985). The Embryonic Development of Drosophila melanogaster Berlin: Springer-Verlag. [Google Scholar]
- Crozatier M, Valle D, Dubois L, Ibnsouda S and Vincent A (1996). collier, a novel regulator of Drosophila head development, is expressed in a single mitotic domain. Curr. Biol 6, 707–718. [DOI] [PubMed] [Google Scholar]
- Cui X and Doe CQ (1997). The role of the cell cycle and cytokinesis in regulating neuroblast sublineage gene expression in the Drosophila CNS. Development 121, 3233–3243. [DOI] [PubMed] [Google Scholar]
- Doe CQ (1992). Molecular markers for identified neuroblasts and ganglion mother cells in the Drosophila central nervous system. Development 116, 855–863. [DOI] [PubMed] [Google Scholar]
- Duronio RJ and O’Farrell PH (1995). Developmental control of the G1 to S transition in Drosophila: Cyclin-E is a limiting downstream target of E2F. Genes Dev 9, 1456–1468. [DOI] [PubMed] [Google Scholar]
- Edgar BA and Datar SA (1996). Zygotic degradation of two maternal Cdc25 mRNAs terminates Drosophila’s early cell cycle program. Genes Dev 10, 1966–1977. [DOI] [PubMed] [Google Scholar]
- Edgar BA and O’Farrell PH (1989). Genetic control of cell division patterns in the Drosophila embryo. Cell 57, 177–187. [DOI] [PMC free article] [PubMed] [Google Scholar]
- Edgar BA and O’Farrell PH (1990). The three postblastoderm cell cycles of Drosophila embryogenesis are regulated in G2 by string. Cell 62, 469–480. [DOI] [PMC free article] [PubMed] [Google Scholar]
- Edgar BA, Lehman D and O’Farrell PH (1994a). Transcriptional regulation of string (cdc25): a link between developmental programming and the cell cycle. Development 120, 3131–3143. [DOI] [PMC free article] [PubMed] [Google Scholar]
- Edgar BA, Sprenger F, Duronio RJ, Leopold P and O’Farrell PH (1994b). Distinct molecular mechanisms regulate cell cycle timing at successive stages of Drosophila embryogenesis. Genes Dev 8, 440–452. [DOI] [PMC free article] [PubMed] [Google Scholar]
- Foe VE (1989). Mitotic domains reveal early commitment of cells in Drosophila embryos. Development 107, 1–22. [PubMed] [Google Scholar]
- Foe VE and Odell GM (1989). Mitotic domains partition fly embryos, reflecting early biological consequences of determination in progress. Am. J. Zool 29, 617–632. [Google Scholar]
- Foe VE, O’Dell GM and Edgar BA (1993). Mitosis and morphogenesis in the Drosophila embryo: Point and counterpoint. In The Development of Drosophila melanogaster, (ed. Bate M and Martinez-Arias A), pp. 149–300. New York: Cold Spring Harbor Laboratory Press,. [Google Scholar]
- Gautier J, Solomon MJ, Booher RN, Bazan JF and Kirschner MW (1991). cdc25 is a specific tyrosine phosphatase that directly activates p34cdc2. Cell 67, 197–211. [DOI] [PubMed] [Google Scholar]
- Gray S and Levine M (1996a). Short-range transcriptional repressors mediate both quenching and direct repression within complex loci in Drosophila. Genes Dev 10, 700–710. [DOI] [PubMed] [Google Scholar]
- Gray S and Levine M (1996b). Transcriptional repression in development. Curr. Opin. Cell Biol 8, 358–364. [DOI] [PubMed] [Google Scholar]
- Gray S, Szymanski P and Levine M (1994). Short-range repression permits multiple enhancers to function autonomously within a complex promoter. Genes Dev 8, 1829–1838. [DOI] [PubMed] [Google Scholar]
- Harding K, Hoey T, Warrior R and Levine M (1989). Autoregulatory and gap gene response elements of the even-skipped promoter of Drosophila. EMBO J 8, 1205–1212. [DOI] [PMC free article] [PubMed] [Google Scholar]
- Hartenstein V, Rudloff E and Campos-Ortega JA (1987). The pattern of proliferation of the neuroblasts in the wild-type embryo of Drosophila melanogaster. Roux’s Arch. Dev. Biol 196, 473–485. [DOI] [PubMed] [Google Scholar]
- Hartenstein V and Posakony JW (1990). Sensillum development in the absence of cell division: The sensillum phenotype of the Drosophila mutant string. Dev. Biol 138, 147–158. [DOI] [PubMed] [Google Scholar]
- Hartenstein V, Younossi-Hartenstein A and Lekven A (1994). Delamination and division in the Drosophila neurectoderm: spatiotemporal pattern, cytoskeletal dynamics, and common control by neurogenic and segment polarity genes. Dev. Biol 165, 480–499. [DOI] [PubMed] [Google Scholar]
- Hiromi Y and Gehring WJ (1987). Regulation and function of the Drosophila segmentation gene fushi tarazu. Cell 50, 963–974. [DOI] [PubMed] [Google Scholar]
- Howard KR and Struhl G (1990). Decoding positional information: regulation of the pair-rule gene hairy. Development 110, 1223–1231. [DOI] [PubMed] [Google Scholar]
- Johnston LA, and Edgar BA (1998). Wingless and Notch regulate cell cycle arrest in the developing Drosophila wing. Nature 394, 82–84. [DOI] [PMC free article] [PubMed] [Google Scholar]
- Knoblich JA, Sauer K, Jones L, Richardson H, Saint R and Lehner CF (1994). Cyclin E controls S-phase progression and its down-regulation during Drosophila embryogenesis is required for the arrest of cell proliferation. Cell 77, 107–120. [DOI] [PubMed] [Google Scholar]
- Koch C and Nasmyth K (1994). Cell cycle regulated transcription in yeast. Curr. Opin. Cell Biol 6, 451–459. [DOI] [PubMed] [Google Scholar]
- Kumagai A and Dunphy WG (1991). The cdc25 protein contains an intrinsic phospatase activity. Cell 67, 189–196. [DOI] [PubMed] [Google Scholar]
- Kylsten P and Saint R (1997). Imaginal tissues of Drosophila melanogaster exhibit different modes of cell proliferation control. Dev. Biol 192, 509–522. [DOI] [PubMed] [Google Scholar]
- Langeland JA, Attai SF, Vorwerk K and Carroll SB (1994). Positioning adjacent pair-rule stripes in the posterior Drosophila embryo. Development 120, 2945–2955. [DOI] [PubMed] [Google Scholar]
- Lehner CF and O’Farrell PH (1989). Expression and function of Drosophila cyclin A during embryonic cell cycle progression. Cell 56, 957–968. [DOI] [PMC free article] [PubMed] [Google Scholar]
- Lehner C and O’Farrell PH (1990a). Drosophila cdc2 homologs: a functional homolog is coexpressed with a cognate variant. EMBO J 9, 3573–3581. [DOI] [PMC free article] [PubMed] [Google Scholar]
- Lehner C and O’Farrell PH (1990b). The roles of Drosophila cyclins A and B in mitotic control. Cell 61, 535–547. [DOI] [PMC free article] [PubMed] [Google Scholar]
- Manoukian AS and Krause HM (1992). Concentration-dependent activities of the even-skipped protein in Drosophila embryos. Genes Dev 6, 1740–1751. [DOI] [PubMed] [Google Scholar]
- Merli C, Bergstrom DE, Cygan JA and Blackman RK (1996). Promotor specificity mediates the independent regulation of neighboring genes. Genes Dev 10, 1260–1270. [DOI] [PubMed] [Google Scholar]
- Milán M, Campuzano S, and García-Bellido A (1996a). Cell cycling and patterned cell proliferation in the wing primordium of Drosophila. Proc. Natl. Acad. Sci. USA 93, 640–645. [DOI] [PMC free article] [PubMed] [Google Scholar]
- Milán M, Campuzano S, and García-Bellido A (1996b). Cell cycling and patterned cell proliferation in the Drosophila wing during metamorphosis. Proc. Natl. Acad. Sci. USA 93, 11687–11692. [DOI] [PMC free article] [PubMed] [Google Scholar]
- Nambu JR, Franks RG, Hu S and Crews ST (1990). The single-minded Gene of Drosophila is required for the expression of genes important for the development of CNS midline cells. Cell 63, 63–75. [DOI] [PubMed] [Google Scholar]
- Neufeld TP, de la Cruz AFA, Johnston LA and Edgar BA (1998). Coordination of growth and cell division in the Drosophila wing. Cell 93, 1183–1193. [DOI] [PubMed] [Google Scholar]
- Neufeld TP and Edgar BA (1998). Connections between growth and the cell cycle. Curr. Opin. Cell Biol 10, 784–790. [DOI] [PubMed] [Google Scholar]
- Nambu JR, Lewis JO, Wharton KA and Crews ST (1990). The Drosophila single-minded gene encodes a helix-loop-helix protein that acts as a master regulator of CNS midline development. Cell 67, 1157–1167. [DOI] [PubMed] [Google Scholar]
- Ohtsuki S, Levine M and Cai HN (1998). Different core promoters possess distinct regulatory activities in the Drosophila embryo. Genes Dev 12, 547–56. [DOI] [PMC free article] [PubMed] [Google Scholar]
- Richardson HE, O’Keefe LV, Reed SI and Saint R (1993). A Drosophila G1-specific cyclin E homologue exhibits different modes of expression during embryogenesis. Development 119, 673–690. [DOI] [PubMed] [Google Scholar]
- Richardson H, O’Keefe LV, Marty T and Saint R (1995). Ectopic cyclin E expression induces premature entry into S phase and disrupts pattern formation in the Drosophila eye imaginal disc. Development 121, 3371–3379. [DOI] [PubMed] [Google Scholar]
- Riddihough G and Ish-Horowicz D (1991). Individual stripe regulatory elements in the Drosophila hairy promoter respond to maternal, gap, and pair-rule genes. Genes Dev 5, 840–854. [DOI] [PubMed] [Google Scholar]
- Simpson P and Morata G (1981). Differential mitotic rates and patterns of growth in compartments in the Drosophila wing. Dev. Biol 85, 299–308. [DOI] [PubMed] [Google Scholar]
- Small S, Blair A and Levine M (1992). Regulation of even-skipped stripe 2 in the Drosophila embryo. EMBO J 11, 4047–4057. [DOI] [PMC free article] [PubMed] [Google Scholar]
- Small S, Blair A and Levine M (1996). Regulation of two pair-rule stripes by a single enhancer in the Drosophila embryo. Dev. Biol 175, 314–324. [DOI] [PubMed] [Google Scholar]
- Spradling A (1986). P-element-mediated transformation. In Drosophila, a Practical Approach, (ed. Roberts DB), pp. 175–197. Oxford: IRL Press. [Google Scholar]
- Stern B, Ried G, Clegg NJ, Grigliatti TA and Lehner CF (1993). Genetic analysis of the Drosophila cdc2 homolog. Development 117, 219–232. [DOI] [PubMed] [Google Scholar]
- Tautz D and Pfeifle C (1989). A non-radioactive in situ hybridization method for the localization of specific RNAs in Drosophila embryos reveals translational control of the segmentation gene hunchback. Chromosoma 98, 81–85. [DOI] [PubMed] [Google Scholar]
- Thomas BJ, Gunning DA, Cho J and Zipursky SL (1994). Cell cycle progression in the developing eye: roughex encodes a novel protein required for the establishment of G1. (1994). Cell 77, 1003–1014. [DOI] [PubMed] [Google Scholar]
- Thummel CS, Boulet AM and Lipshitz HD (1988). Vectors for Drosophila P-element-mediated transformation and tissue culture transfection. Gene 74, 445–456. [DOI] [PubMed] [Google Scholar]
- Weigmann K and Lehner CF (1995). Cell fate specification by even-skipped expression in the Drosophila nervous system is coupled to cell cycle progression. Development 121, 3713–3721. [DOI] [PubMed] [Google Scholar]