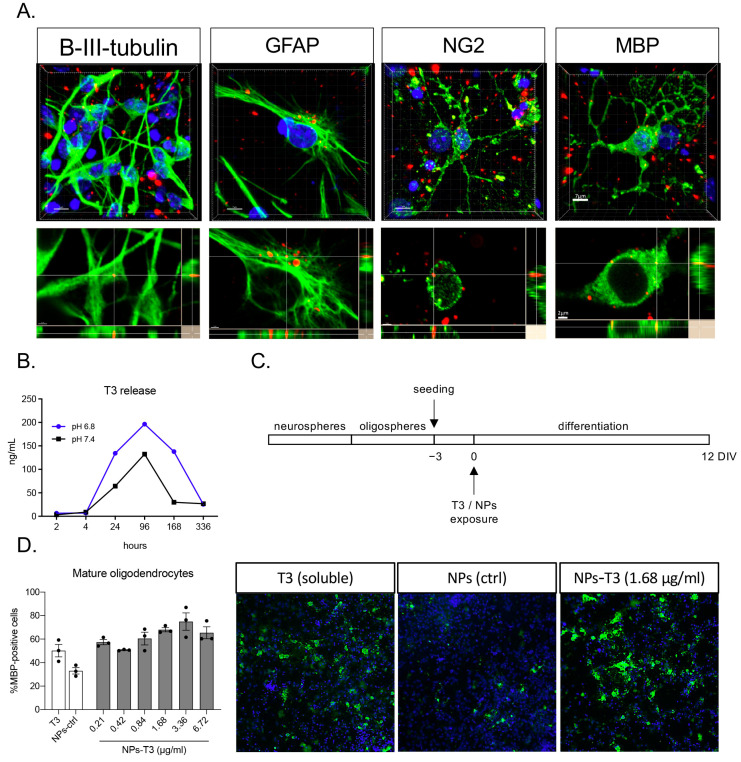
Figure 2.
NMeds internalization and T3 release in vitro: (A) Representative images of NMeds (red) internalized in all the different neural lineages derived from neural stem cell differentiation. Cell lineages were identified by specific markers (green): beta-III-tubulin for neurons, GFAP for astrocytes, NG2 for oligodendrocyte precursor cells, and MBP for mature oligodendrocytes. Images are z-stacks acquired by confocal microscopy and elaborated by IMARIS software. For each lineage, the maximum intensity projection-based 3D image and the lateral projections of the axis are represented, showing the red spots corresponding to the NMeds inside the cell cytoplasm. Bars: 7 μm for z-stacks and 2 μm for lateral projections; (B) T3 release with the xMap kit at pH 6.8 and pH 7.4; (C) protocol used for the in vitro differentiation experiment; (D) differentiation of the neural stem cell-derived oligodendrocytes expressed as percentage of MBP-positive cells on the total cell number identified by the Hoechst nuclear staining after treatment with the standard differentiation protocol (soluble T3, 50 nM, 3.36 µg/mL), control NMeds, or different concentrations of T3-NMeds. Representative images acquired by cell-based high-content screening. The brightness and contrast of the pictures were adjusted to increase the quality of the image visualization without affecting the qualitative and quantitative analyses that were performed on the raw images. Abbreviations: GFAP—glial fibrillary acidic protein; MBP—myelin basic protein; NG2—neural/glial antigen 2; NPs—nanoparticles; T3—triiodothyronine.

