Background:
There is a need for simple, noninvasive solutions to remotely monitor and predict worsening heart failure (HF) events. SCALE-HF 1 (Surveillance and Alert-Based Multiparameter Monitoring to Reduce Worsening Heart Failure Events) is a prospective, multicenter study that will develop and assess the accuracy of the heart function index—a composite algorithm of noninvasive hemodynamic biomarkers from a cardiac scale—in predicting worsening HF events.
Methods:
Approximately 300 patients with chronic HF and recent decompensation will be enrolled in this observational study for model development. Patients will be encouraged to take daily cardiac scale measurements.
Results:
Approximately 50 HF events, defined as an urgent, unscheduled clinic, emergency department, or hospitalization for worsening HF will be used for model development. The composite index will be developed from hemodynamic biomarkers derived from ECG, ballistocardiogram, and impedance plethysmogram signals measured from the cardiac scale. Biomarkers of interest include weight, peripheral impedance, pulse rate and variability, and estimates of stroke volume, cardiac output, and blood pressure captured through the cardiac scale. The sensitivity, unexplained alert rate, and alerting time of the index in predicting worsening HF events will be evaluated and compared with the performance of simple weight-based rule-of-thumb algorithms (eg, weight increase of 3 lbs in 1 day or 5 lbs in 7 days) that are often used in practice.
Conclusions:
SCALE-HF 1 is the first study to develop and evaluate the performance of a composite index derived from noninvasive hemodynamic biomarkers measured from a cardiac scale in predicting worsening HF events. Subsequent studies will validate the heart function index and assess its ability to improve patient outcomes.
Registration:
URL: https://www.clinicaltrials.gov; Unique identifier: NCT04882449.
Keywords: algorithms, electric impedance, heart failure, hospitalization, prospective studies
What is New?
Patients with heart failure are recommended to take daily standing weight measurements to monitor heart failure status.
In the SCALE-HF 1 study (Surveillance and Alert-Based Multiparameter Monitoring to Reduce Worsening Heart Failure Events), we are evaluating a novel weight scale that also measures multiple hemodynamic parameters that may be useful in monitoring heart failure status.
Longitudinal data collected in this study will be used to develop and evaluate the accuracy of the heart function index—a multiparameter composite score for predicting worsening heart failure.
What are the Clinical Implications?
The heart function index could provide an accurate, early prediction of heart failure exacerbations without the need for implantable or wearable devices.
Future studies will validate the heart function index and assess its ability to guide more timely interventions that may improve outcomes for patients with heart failure.
Despite advances in medical and device therapies, worsening heart failure (HF) is a major source of patient morbidity and mortality as the number of hospitalizations for HF and associated readmissions remain high and are costly to the health care system.1 Reducing the HF hospitalization burden and increasing healthy days at home is a priority for many national health systems. Furthermore, the Center for Medicare and Medicaid services is shifting toward the hospital-at-home concept, which will require advancements in remote monitoring devices to achieve better care of patients with HF in the home setting.2
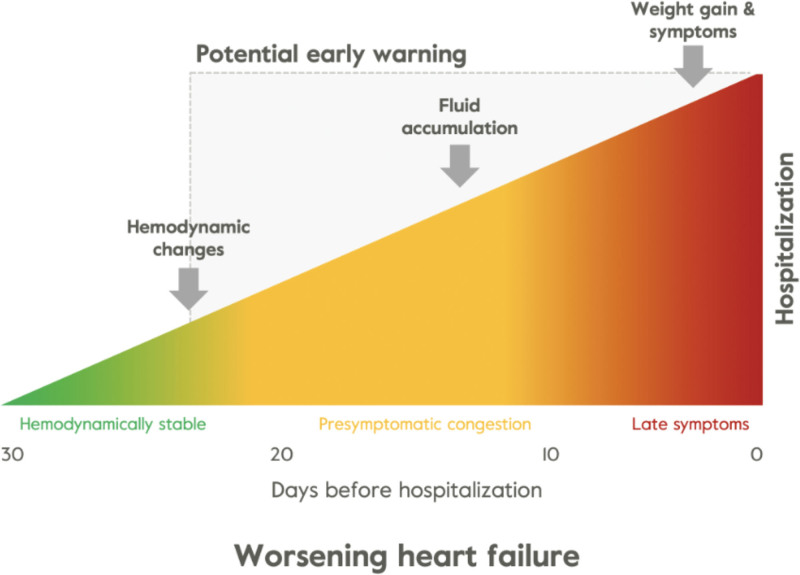
Achieving and maintaining euvolemic status is a key goal for both patients and clinicians in the management of HF and reducing worsening HF. Approximately 90% of HF hospitalizations can be attributed to a hypervolemic state requiring urgent intravenous diuresis.3 Close observation of and rapid response to changes in early physiological indicators of worsening HF are essential in achieving or maintaining euvolemia to prevent decompensation events. Clinical signs and symptoms of HF decompensation are preceded by an increase in filling pressures, autonomic adaptation, and resultant cardiac function and total fluid content changes (Figure 1).5 Weight monitoring is the current noninvasive standard of outpatient care for a vast majority of patients with HF. The 2022 American College of Cardiology Foundation/American Heart Association guidelines include a class 1 recommendation for serial weight monitoring along with jugular venous estimation and assessment of peripheral edema or orthopnea to assess volume status.6 However, weight alone is neither sensitive nor specific in predicting worsening HF status.7
Figure 1.
Pathophysiology of congestion and decompensation. Clinical symptoms such as weight gain are detectable only a few days before a heart failure (HF) event. Fluid buildup is detectable about 7 days prior and changes in hemodynamics occur 3 weeks before an HF event. Adapted from Adamson4 with permission. Copyright ©2023, Springer Nature.
There is a need for more user-friendly, accessible, and scalable noninvasive remote monitoring tools to identify these earlier signs of decompensation. This article will describe the Bodyport cardiac scale and the development of the composite Bodyport heart function index in the SCALE-HF 1 study (Surveillance and Alert-Based Multiparameter Monitoring to Reduce Worsening Heart Failure Events). This prospective, multicenter, observational study was designed to develop and evaluate the accuracy of the heart function index—a composite model of hemodynamic biomarkers from the Bodyport cardiac scale—in predicting HF decompensation events.
Current Remote Monitoring of HF Status
While traditional weight monitoring is highly accessible and of low cost, weight changes are often late manifestations of cardiac decompensation, and routine weight monitoring has not been shown to reduce the risk of hospitalization.7 Wearable devices such as remote dielectric sensing and adhesive patches allow for remote cardiac monitoring via biomarkers of lung fluid content, electrocardiography, and physical activity, among others, but are limited by the need for patients to adopt new, often cumbersome, behaviors.8,9 For example, adhesive patches are limited by skin irritation, adherence, and are most useful for monitoring over short time periods.
Invasive methods, such as pulmonary artery pressure sensors, allow for remote measures of clinical congestion and titration of HF therapy resulting in reduced HF hospitalizations, but their widespread use is limited by the need for an invasive procedure, a relatively narrow indication for use, a hospitalization for HF or elevated brain natriuretic peptides, and high cost of implantation.10–12 The GUIDE-HF study (Haemodynamic-Guided Management of Heart Failure) demonstrated that hemodynamic-guided management reduced HF hospitalizations in the pre–COVID-19 analysis but not in the overall analysis, among patients with New York Heart Association class II to IV symptoms.13 Certain cardiac resynchronization therapy defibrillators and implantable cardioverter defibrillators allow for monitoring metrics such as heart rate, heart sounds, respiration rate, activity, and thoracic impedance, among other signals and can predict HF events with a median lead time of 34 days.14 However, the clinical efficacy of the predictive algorithm needs to be determined, and its use is limited to patients with implantable devices and HF with reduced ejection fraction.15 The MANAGE-HF study (Multiple Cardiac Sensors for Management of Heart Failure) will assess the clinical effectiveness of remote monitoring of HF patients with implanted certain cardiac resynchronization therapy defibrillators or implantable cardioverter defibrillators cardiac devices that contain the HeartLogic software.16 Patients with HF with preserved ejection fraction (HFpEF) account for the growing prevalence of HF and are not currently eligible for these solutions.17
Recent solutions leverage a multiparameter approach to successfully predict HF events given the complexity of HF and the improved model performance from incorporating complimentary physiologic signals.14,18 With this current landscape for remote HF monitoring, there is a need for noninvasive, user-friendly, affordable, and scalable solutions along with rigorous clinical validation to prove their effectiveness. The Bodyport cardiac scale and heart function index may provide a convenient and accessible solution that requires patients to only take a daily step on the scale—a behavior they are already familiar with.
Methods
The data that support the findings of this study are available from the corresponding author upon reasonable request.
Bodyport Cardiac Scale
Overview
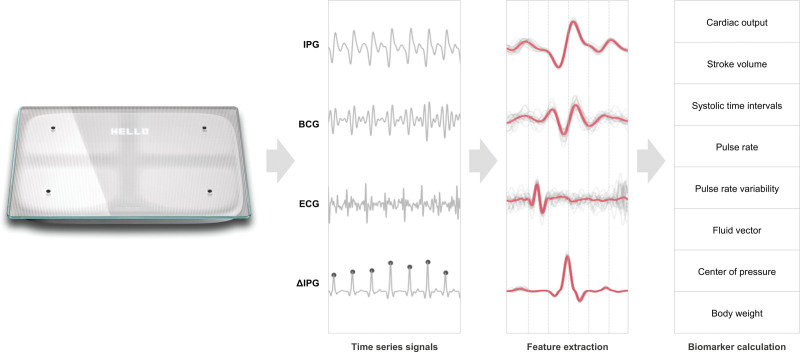
The Bodyport cardiac scale provides an innovative and noninvasive approach to obtain clinically relevant hemodynamic parameters. The scale is a physical platform on which the user stands with bare feet for ≈20 to 30 s and is notified to step off once the measurement is complete (Figure 2). This form factor leverages the existing and familiar behavior in patients with HF of taking daily weight measurements, minimizes natural frictions associated with technology adoption, and follows current clinical guidelines and practices that encourage daily self-weighing.19 The scale utilizes cellular network connectivity, instead of WiFi or Bluetooth, for transmission of measurement data. This feature simplifies the setup process and improves access to care for patients who may not have internet or smartphone access, a growing public health concern accompanying the growth of telemedicine.20 All biomarker data are immediately uploaded after a measurement over the cellular connection and the heart function index is automatically calculated and provided to clinicians on a web-based dashboard. The application programming interface is compatible with integration into remote monitoring platforms and electronic health record software.
Figure 2.
Bodyport cardiac scale and data collection for various biomarkers
. BCG indicates ballistocardiography; and IPG, impedance plethysmography.
The scale measurement captures several physiological parameters including weight, ECG, impedance plethysmography, and ballistocardiography signals. These signals will be used in the SCALE-HF 1 study to develop the Bodyport heart function index—a multivariable algorithm to predict worsening HF events. Combining the individual biomarkers into a composite heart function index will likely provide the benefit of improved interpretability for care providers and improved model accuracy by simultaneously assessing multiple physiological parameters pertinent to the disease state. As a precedent, the multiparameter approach has been successfully deployed with implantable cardioverter defibrillators/certain cardiac resynchronization therapy technologies to predict worsening HF events.14,18
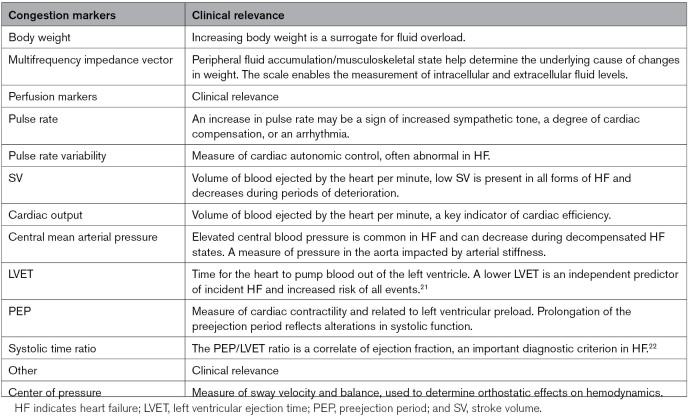
As the user stands with bare feet, dry electrodes located on the surface of the scale obtain 2 biological signals from the user’s body. The first is a single-lead ECG measured between the feet. Impedance plethysmography measures the pulsatile blood flow and is determined by measuring small changes in the electrical impedance of the lower extremities. The ballistocardiography signal is indicative of the mechanical function of the heart and is obtained by measuring the small forces exerted on the body by each contraction. Table 1 details a list of some of the biomarkers that can be obtained from the Bodyport cardiac scale. This provides a foundational framework for model development in the SCALE-HF 1 study.
Table 1.
Biomarkers Measured by the Bodyport Cardiac Scale
Cardiac Scale Sensors
Ballistocardiography
Ballistocardiography aims to measure the effects of the cyclical hemodynamic forces transmitted from the heart with each cardiac systolic ejection.23 Sensitive, high-bandwidth pressure sensors embedded in the scale are capable of measuring this signal. This is analogous to well-described clinical observations such as accentuated movements of the head in conditions like chronic aortic regurgitation. The ballistocardiography wave is typically composed of systolic I, J, and additional diastolic waves. The I wave represents the movement of blood through the inlet of the ascending aorta, and the J wave captures the movement of blood down the descending aorta.
Impedance Plethysmography
Impedance plethysmography measures the electrical resistance of the lower body and is modulated by changes in body water and blood flow to the lower part of the body. It applies Ohm relationship to the lower extremities. The scale injects a clinically undetected and safe current between the feet of the patient and measures the resulting electrical potential. The impedance signal is captured at multiple frequencies to enable the measurement of fluid in both extracellular and intracellular compartments. Understanding the proportion of fluid that is extracellular may be important in interpreting peripheral fluid levels and identifying subclinical or clinical edema. The peripheral fluid status may be an important clinical correlate for HF patients not captured by traditional weight measurements.
ECG
Two electrodes on the surface of the scale capture a single-lead ECG, with a vector in the similar direction as lead I on a traditional ECG. The ECG signal derived from the feet is orders of magnitude smaller than the signal captured at the chest and is detectable through innovations in sensor and signal processing incorporated into the scale.
Physiologic Measures of HF Decompensation and Scale Correlates
Congestion
While direct measures of cardiac congestion are not attainable on a routine basis, the cardiac scale allows for the measurement of several surrogates.
Weight Change
Weight changes are captured by the scale, which in the acute setting are generally due to fluid accumulation. Used in isolation and without context, weight changes are neither sensitive nor specific for worsening HF.7 Weight is often a lagging indicator of worsening status, and many other factors may contribute to a patient’s weight change beyond fluid accumulation.
Fluid and Edema
In the case where a patient gains or loses weight, bioelectrical impedance vector analysis can be used to determine whether the change in weight was largely due to fluid changes or soft tissue changes. This is useful for determining whether weight gain is secondary to fluid accumulation versus other factors, such as caloric intake. Patients with HF are at elevated risk for malnutrition and malabsorption. Therefore, weight loss can be counterbalanced by weight gain from fluid accumulation, making weight a deceiving metric. The bioelectrical impedance vector analysis can help avoid these misleading weight interpretations and provide longitudinal measurements for fluid status and muscle mass to monitor for signs of malnutrition and cachexia. In clinical practice, fluid overload can be managed with augmented diuresis and uptitration of guideline-directed medical therapy.
The cardiac scale is Food and Drug Administration cleared for longitudinal assessment of fluid status through the multifrequency impedance vector measurement.24 The ability to measure the impedance vector at multiple frequencies enables discrimination between changes in extracellular fluid and changes in body composition. Performance data submitted to Food and Drug Administration demonstrate that the impedance measurement is accurate in obese patients with body mass index >30 kg/m2. Further, the data showed an average decrease in impedance of 7Ω per 1 unit increase in body mass index, ≈1 order of magnitude less than the magnitude of change seen preceding an HF exacerbation (average decrease of 70Ω). As a result, it was concluded that there is minimal impact of body mass index on the ability to detect worsening fluid status using impedance-derived measures.
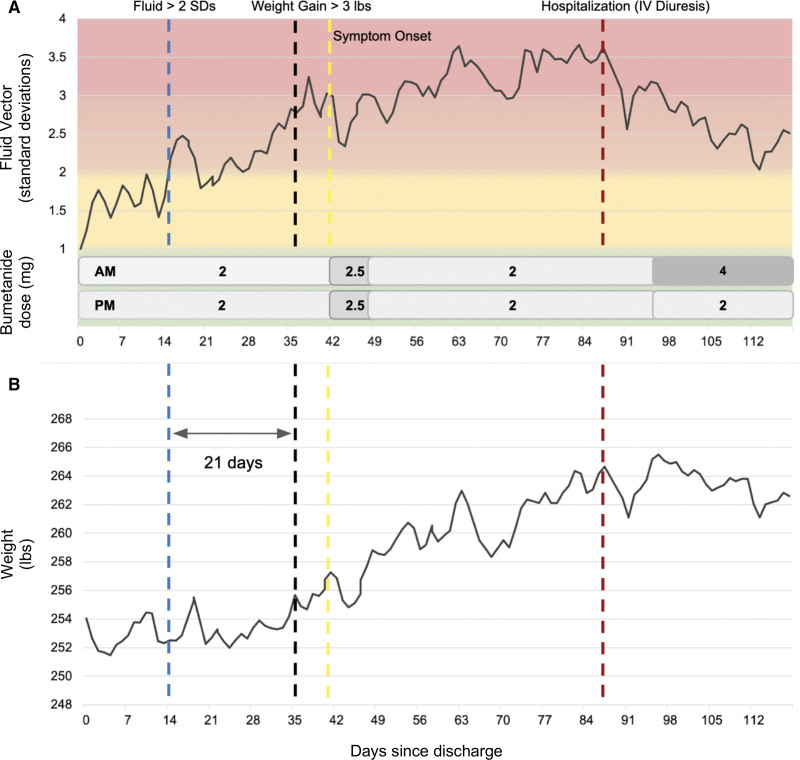
Figure 3 shows an example of a 66-year-old female patient with HFpEF, New York Heart Association class III, who was discharged from an HF admission within the prior week. Her fluid vector started to increase 21 days preceding a more gradual 3-lb weight gain. After the 3-lb weight gain, she started to experience symptoms of lower extremity edema and dyspnea. She had a slower clinical decompensation than may be expected, possibly through mechanisms such as fluid accumulation in the interstitium. She was ultimately hospitalized on day 88 for an HF exacerbation and was treated with intravenous diuretics. Her fluid vector decreased in response to the intravenous diuresis and subsequent increase in her oral diuretic regimen. This example demonstrates the cardiac scale’s ability to monitor fluid status and the potential opportunity to intervene sooner compared with weight or symptom changes.
Figure 3.
An example of a 66-year-old female patient with heart failure with preserved ejection fraction who was discharged from a hospitalization for heart failure within the prior week. A, The patient’s fluid vector (impedance based). There is a gradual increase in the fluid vector exceeding 2 SDs compared with the mean of a healthy control population on day 14 (blue dotted line). A 3-lbs weight gain occurred on day 35 (black dotted line) and HF symptoms on day 41 (yellow dotted line). The patient was hospitalized on day 88 (red dotted line) for an HF event, and oral diuretics were increased in the outpatient setting. B, The corresponding weight trend during the same time period. HF indicates heart failure; and IV, intravenous.
Perfusion
The cardiac scale can obtain metrics related to cardiac perfusion such as pulse rate, pulse rate variability, stroke volume, cardiac output, central mean arterial pressure, left ventricular ejection time, preejection period, and systolic time ratio.
Pulse Rate and Pulse Rate Variability
The accuracy of the pulse rate measured by the cardiac scale was evaluated in a comparison study against heart rate derived from a single-lead (lead II) ECG reference device. Sixty-six participants (30 women and 36 men) with a mean age of 48 years (range, 22–88 years) were included in the analysis. The 2 methods had a correlation coefficient of r=0.99 and a mean absolute error of 0.76 beats per minute. Pulse rate may increase preceding an HF event, and pulse rate variability is an established biomarker for assessing cardiovascular risk.
Stroke Volume and Cardiac Output
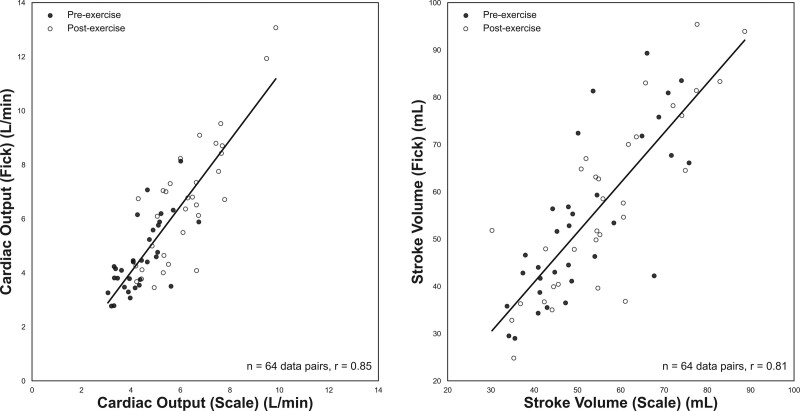
The accuracy of the scale-derived stroke volume and cardiac output was compared with the direct Fick method in patients undergoing an invasive cardiopulmonary exercise test at a tertiary medical center for unexplained dyspnea. Thirty-two participants (9 men and 23 women) with a mean age of 51.7 years (26–78 range) and an array of underlying comorbidities (ie, HF, pulmonary artery hypertension, peripheral vasomotor abnormalities) were included in the final analysis. Cardiac scale measurements were taken immediately before (pre-exercise) and after (post-exercise) the invasive cardiopulmonary exercise test direct Fick measurements. Various signal features from the ballistocardiogram, ECG, and impedance plethysmogram, such as the ballistocardiogram J-wave amplitude (correlates with pulse pressure), the preejection period, left ventricular ejection time, and existing equations developed by Kubicek et al25 were used to create a multivariate regression model for stroke volume and cardiac output. The combined preexercise and postexercise stroke volume measured by the cardiac scale and the direct Fick method correlated with a coefficient of r=0.81 (P<0.001), mean error of 1.58 mL, and a 95% limits of agreement of −21.97 to 18.81 mL. The cardiac output measurements correlated with a coefficient of r=0.85 (P<0.001), mean error of −0.31 L/min, and 95% limits of agreement of −2.62 to 2.00 L/min (Figure 4).26
Figure 4.
The Bodyport cardiac scale shows high correlation with the gold standard direct Fick method. Scatter plots with regression line for cardiac output (left) and stroke volume (right) measured with the scale and direct Fick method. Cardiac output (64 data pairs, r=0.85) and stroke volume (64 data pairs, r=0.81). Preexercise data are denoted with black circles and postexercise data with white circles.
Central Mean Arterial Pressure
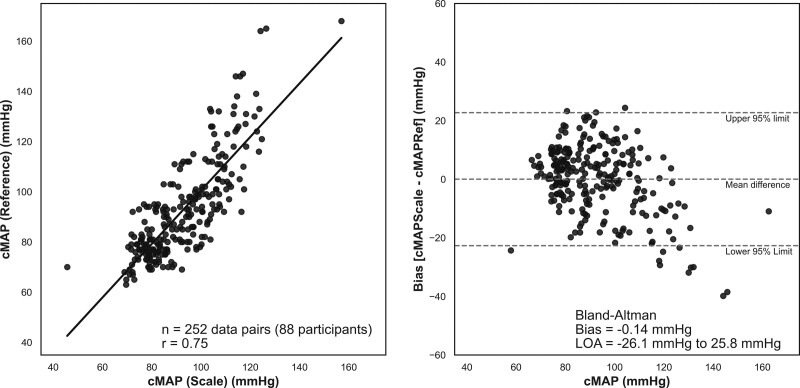
Central mean arterial pressure is the average pressure in a patient’s aorta during 1 cardiac cycle. It is a better indicator of perfusion to vital organs than systolic blood pressure and is generally associated with HF and cardiovascular mortality.27 The scale’s ability to measure the central mean arterial pressure was assessed via a comparison study to a reference device, SphygmoCor XCEL, an Food and Drug Administration–cleared brachial blood pressure cuff that delivers an ascending aortic blood pressure waveform. Eighty-eight participants (49 men and 39 women) with a mean age of 42 years were included in the final analysis. Each participant contributed up to 3 sequential measurements simultaneously with the reference device and the cardiac scale. The mean reference device central mean arterial pressure was 92 mm Hg with an SD of 20 mm Hg, and 30 of 88 (34%) participants had a systolic blood pressure ≤100. The 2 methods had a Pearson correlation of r=0.75 and a mean error of −0.14 mm Hg (Figure 5).28
Figure 5.
Central mean arterial pressure (cMAP) assessments using the cardiac scale compared with a reference device, the SphygmoCor XCEL™ brachial blood pressure cuff. Left, Scatter plot with a linear regression line for the scale-derived and reference device cMAP measurements (n=252 data pairs from 88 participants; r=0.75; mean absolute percent error, 9.6%). Right, Bland-Altman analysis plotting the bias (mean error of cardiac scale minus reference device) of −0.14 mm Hg and 95% limits of agreement (LOA) of −26.1 to 25.8 mm Hg (dotted lines).
Left Ventricular Ejection Time and Preejection Period
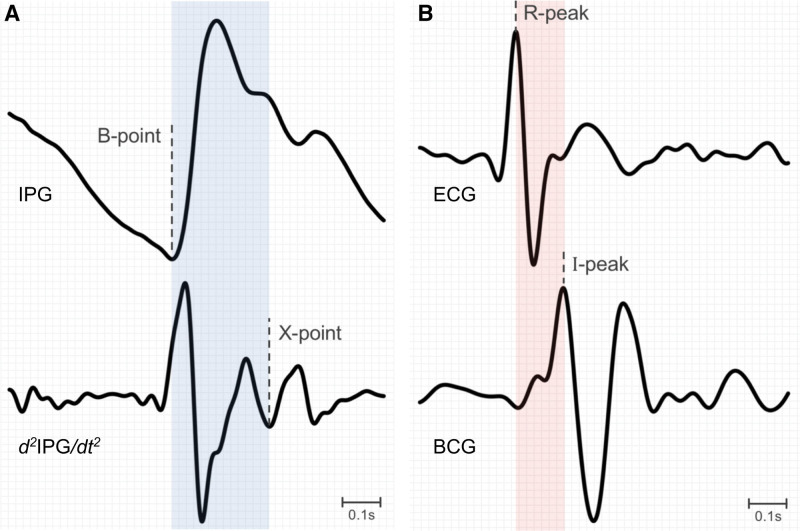
Left ventricular ejection time represents the time it takes for blood to be ejected from the left ventricle, defined by the opening and closing of the aortic valve. With cardiac deterioration such as in HF, the left ventricle has more difficulty producing the contractile force necessary to keep the aortic valve open, resulting in a decreased left ventricular ejection time and increased isovolumic contraction times. The left ventricular ejection time can be captured by this cardiac scale using the B and X points from the impedance plethysmogram (Figure 6A), which represent the opening and closing of the aortic valve. The preejection period is the time interval between the beginning of electrical depolarization and the start of ventricular ejection, representing ventricular contraction with the aortic valve closed. In patients with HF and a diminished contractile force, the preejection period may be prolonged. The preejection period can be measured as the time interval between the R peak on the ECG and the I wave on the ballistocardiogram (Figure 6B). A preejection period to left ventricular ejection time ratio, referred to as systolic time ratio, >0.33 allows for the detection of a left ventricular ejection fraction of <45% with a sensitivity of 95% and specificity of 82% in patients with HF.21,22
Figure 6.
Assessment of left ventricular ejection time using the cardiac scale. A, The LVET interval (blue) is calculated as the time interval between the B-point from the IPG signal and the X-point from the IPG derivative (ΔIPG). B, The PEP interval (pink) is the time interval between the R-peak from the ECG and the I-peak from the BCG signal. BCG indicates ballistocardiography; and IPG, impedance plethysmography.
SCALE-HF 1 Study
Study Design
SCALE-HF 1 is a prospective, multicenter study that will use the cardiac scale biomarker data to derive the Bodyport heart function index—a multivariate algorithm for predicting worsening HF events. Worsening HF is defined as an urgent, unscheduled clinic or emergency department visit or hospital admission with a primary diagnosis of HF defined as worsening symptoms of HF on presentation, objective evidence of new or worsening HF, and received initiation or intensification of treatment for HF. Patients with HF, irrespective of ejection fraction, will be identified by participating sites and may be consented and enrolled remotely, in clinic, or before hospital discharge. Follow-up visits will be remote and occur at 6 weeks, 3 months, and then every 3 months until the end of the study. Participants may also be contacted by the site or study team at other time points for study issues such as suspected device malfunction or nonadherence with the cardiac scale. Patients will have visibility only to their own body weight on the scale display and their subsequent weight from their last measurement. Clinicians will be blinded to all data collected from the scale. There will be no attempt to influence clinical practice. Enrolling centers will obtain site-specific institutional review board approval pursuant to local regulations. All patients are required to sign written informed consent before the collection of any study data.
Study Population
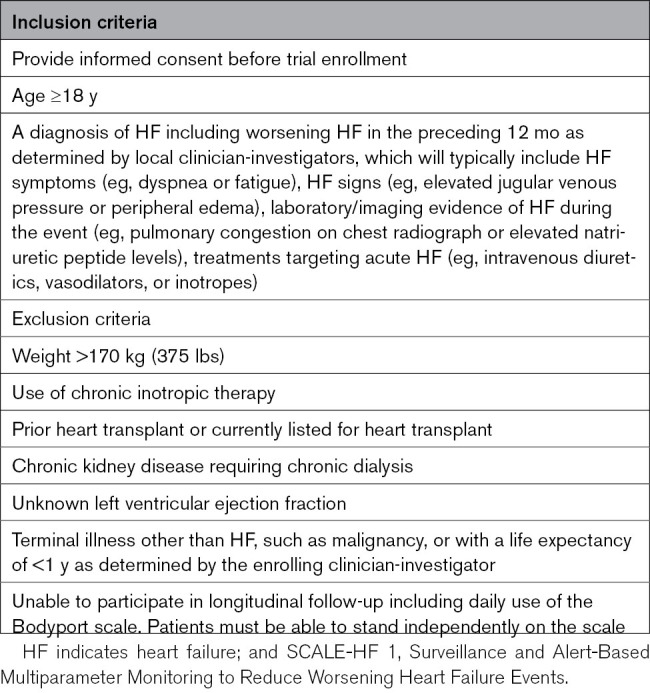
Approximately 300 patients with HF and a history of hospitalization for acute decompensated HF in the past 12 months will be enrolled. There will be limited inclusion and exclusion criteria (Table 2) to ensure enrollment of a broad population of participants, which is critical for developing a model generalizable to patients with many different potential underlying comorbidities and subtypes, irrespective of left ventricular ejection fraction. The proportion of patients enrolled with HF with reduced ejection fraction or HFpEF will be capped at no more than 2/3 of the total enrollment to ensure a balanced representation of these HF subtypes.
Table 2.
SCALE-HF 1 Study Eligibility Criteria
Study End Points
The primary end point of this study will be the identification of worsening HF. Symptoms of worsening HF include dyspnea, decreased exercise tolerance, fatigue, and other symptoms of worsened end-organ perfusion or volume overload. Objective evidence of new or worsening HF includes physical examination findings such as peripheral edema, pulmonary rales, crackles, increased jugular venous distention, abdominal distention or ascites, S3 gallop, or significant weight gain thought to be secondary to fluid accumulation. Laboratory criteria include an elevated NT-proBNP (N-terminal pro-B-type natriuretic peptide) or BNP (B-type natriuretic peptide), radiological evidence of pulmonary congestion, and invasive or noninvasive evidence of elevated right- or left-sided filling pressures. Initiation or intensification of HF treatment includes augmentation of oral diuretic therapy, administration of intravenous diuretic or vasoactive agents, mechanical/surgical circulatory support, or mechanical fluid removal. At each study visit, participants will be followed for possible clinical events and deaths. Medical record information regarding these clinical events and deaths will then be submitted to an independent Clinical Events Committee, composed of physicians not taking part in the clinical study and trained to the standards and definitions of worsening HF criteria as defined in the Clinical Events Committee charter. The Clinical Events Committee is responsible for reviewing and adjudicating all reported events and will be blinded to all cardiac scale biomarker data.
Sample Size Determination
At least 50 HF events with sufficient cardiac scale data preceding the event will be necessary for model development. Event usability will be determined by the number and quality of scale measurements preceding an HF event. Scale-derived biomarkers may be leveraged (Table 1) as model input parameters. It is estimated that no more than 5 biomarkers will be incorporated into the final model. To approximate the model development sample size, a conservative assumption of requiring 10 events per predictor for model training was applied. An event rate of 25% is expected based on the populations being enrolled, which consists of a mix of postdischarge and general HF population with an HF event in the previous 12 months.1 This 25% event rate requires an enrollment of 200 patients to reach the target over the course of a year of data collection. To account for uncertainty in these assumptions, the sample size is further increased by 50% to yield 300 patients resulting in ≈75 HF events. It is expected that at least 50 HF events will have sufficient scale data preceding the event to be considered usable.
The model development will include training with cross-validation and will be compared to standard weight-only performance. According to a binomial distribution assumption of sensitivity at a given alert rate, the CI around the sensitivity can be approximated using the Wilson score interval. For a sensitivity above 0.5 and a sample size of over 25, this corresponds to a 95% CI of <±0.2 around the estimated sensitivity. Given the reference weight-only approaches have typical sensitivity below 0.30, a validation set sensitivity of above 0.5 will ensure that the lower bound of the CI will exceed the sensitivity of weight-only approaches. This demonstrates that a sample size of 50 events should be sufficient for development and initial validation of performance. Further, the estimated number of events for model development in this study is comparable to the MultiSENSE study (Multisensor Chronic Evaluation in Ambulatory Heart Failure Patients) that included 50 usable HF events.14
Results
Heart Function Index Development
Cardiac Scale Biomarker Selection
To optimize model simplicity and interpretability, a subset of the scale-derived biomarkers (such as those in Table 1) may be selected for inclusion in the final Bodyport heart function index. The most significant features will be identified by evaluating individual biomarker trends via univariate analysis leading up to an HF event. The biomarkers with a strong predictive value will be selected for inclusion in the model building. The number of features used for model training may be further reduced through principal component analysis and recursive feature elimination. The selected individual features will be weighted and assessed relative to changes from the patient’s own baseline and population-level comparisons to create the heart function index.
Assessing the Heart Function Index Performance
To assess model performance and determine accurate event predictions and alerts, a time window before each HF event must be established. If a predicted event from the model occurs in the window, it will be assessed as correct (true positive), and if it occurs outside the window, it will be assessed as incorrect (false positive). A shorter prediction window provides less time for effective interventions, while a long window may result in a model that is risk stratifying the population for long-term events, rather than detecting an imminent decompensation event. To account for these concerns, the model’s performance will be evaluated using a range of windows centered around 15 days and up to ≈30 days before the event. HF-related events, defined as events that meet 2 of 3 criteria for the primary end point of worsening HF or oral titration of diuretic therapy in the outpatient setting, will also be captured and used in evaluating the performance of the heart function index. The final model will be evaluated using the area under the curve of the receiver operating characteristic, sensitivity, and specificity among other statistics. We will assess the performance of the heart function index in key patient subgroups including HF with reduced ejection fraction versus HFpEF and in those with advanced HF. The model’s performance will also be compared with the performance of simple weight-based rule-of-thumb algorithms (eg, weight increase of 3 lbs in 1 day or 5 lbs in 7 days) that are often used in clinical practice. As part of SCALE-HF 1, we will collect data from other monitoring devices when available, including pulmonary artery pressure monitoring systems. These data will be used for exploratory analyses, and the data will not be incorporated into the Bodyport heart function index. Subsequent studies will validate the model and determine the clinical effectiveness of interventions, such as diuretic or guideline-directed medical therapy dose adjustments, based on the heart function index.
Discussion
The preliminary feasibility studies evaluating the biomarkers detailed in Table 1 support the potential use of this cardiac scale as a comprehensive tool for monitoring cardiovascular hemodynamic status. The SCALE-HF 1 study is designed to rigorously determine whether this cardiac scale with the ability to measure ballistocardiography, ECG, and impedance plethysmography signals can predict worsening HF events. The study is designed to be inclusive of both HFpEF and HF with reduced ejection fraction, with minimal exclusion criteria, to apply to a broad HF population. The Bodyport cardiac scale leverages the existing behavior in patients with HF of taking daily weight measurements, minimizing natural friction associated with technology adoption. Continuous wearable sensors can be challenged by inconvenience and limited patient adoption. A 20- to 30-s daily scale measurement optimizes patient usability and has the potential to integrate seamlessly into existing patient pathways and circumvent these barriers for adoption—a key point emphasized in the American Heart Association remote patient monitoring guidance statement.29 The noninvasive nature of the device is an advantage compared with invasive methods, such as pulmonary artery pressure sensors, and provides a scalable mechanism for remote cardiac monitoring.
The scale biomarkers will be utilized for model development against adjudicated HF events. There is a possibility that other scale-derived biomarkers will be used in the final model. Following SCALE-HF 1, the Bodyport heart function index will need to be implemented in clinical practice to determine whether it can improve patient outcomes. These studies have the potential to significantly improve remote cardiac monitoring and clinical outcomes for patients with HF and other cardiovascular conditions.
Conclusions
The Bodyport cardiac scale is a novel technology for remote-based cardiovascular monitoring. The analysis of ballistocardiography, ECG, and impedance plethysmography signals allows for the assessment of important cardiovascular biomarkers related to cardiac congestion and perfusion. The scale form factor integrates into an HF patient’s established behavior of weight monitoring, minimizing any friction for technology adoption and maximizing patient adherence. The SCALE-HF 1 study will provide clinically adjudicated HF events for the development of the Bodyport heart function index to predict worsening HF status. Future studies will be needed to determine the ability of heart function index–based clinical interventions to improve patient outcomes.
Article Information
Sources of Funding
The SCALE-HF (Surveillance and Alert-Based Multiparameter Monitoring to Reduce Worsening Heart Failure Events) program is sponsored by Bodyport Inc.
Disclosures
Dr Fudim was supported by the National Heart, Lung, and Blood Institute (NHLBI; K23HL151744), the American Heart Association (20IPA35310955), Doris Duke, Bayer, Bodyport, and Verily. He receives consulting fees from Abbott, Alio Health, Alleviant, Audicor, AxonTherapies, Bayer, Bodyguide, Bodyport, Boston Scientific, Cadence, Coridea, CVRx, Daxor, Deerfield Catalyst, Edwards LifeSciences, EKO, Feldschuh Foundation, Fire1, Gradient, Intershunt, Medtronic, NIMedical, NXT Biomedical, Pharmacosmos, PreHealth, ReCor, Shifamed, Splendo, Sumacor, SyMap, Verily, Vironix, Viscardia, and Zoll. Dr Sauer reports consulting for Abbott, Medtronic, Edwards Lifesciences, Boston Scientific, Impulse Dynamics, Story Health, and General Prognostics. Dr Sauer also reports significant research funding from Abbott, General Prognostics, and Impulse Dynamics, as well as serving on the clinical trial steering committees for Boston Scientific, Biotronik, Abbott, Impulse Dynamics, Story Health, and General Prognostics. Drs Yazdi and Ozonat are employees at Bodyport Inc. S. Smith and C. Centen are founders and employees of Bodyport Inc. Dr DeVore reports research funding through his institution from the American Heart Association, Biofourmis, Bodyport, Cytokinetics, American Regent Inc, the NHLBI, Novartis, and Story Health. He also provides consulting services for and receives honoraria from Abiomed, AstraZeneca, Cardionomic, InnaMed, LivaNova, Natera, Novartis, Procyrion, Story Health, Vifor, and Zoll. He has also received nonfinancial support from Abbott for educational and research activities. The other authors report no conflicts.
Nonstandard Abbreviations and Acronyms
- BNP
- B-type natriuretic peptide
- GUIDE-HF
- Haemodynamic-Guided Management of Heart Failure
- HF
- heart failure
- HFpEF
- heart failure with preserved ejection fraction
- MANAGE-HF
- Multiple Cardiac Sensors for Management of Heart Failure
- NT-proBNP
- N-terminal pro-B-type natriuretic peptide
- SCALE-HF 1
- Surveillance and Alert-Based Multiparameter Monitoring to Reduce Worsening Heart Failure Events
For Sources of Funding and Disclosures, see page 451.
Contributor Information
Marat Fudim, Email: marat.fudim@gmail.com.
Daniel Yazdi, Email: daniel@bodyport.com.
Ugochukwu Egolum, Email: Ugochukwu.Egolum@nghs.com.
Amir Haghighat, Email: haghimd@yahoo.com.
Anupama Kottam, Email: anupamareddy.kottam@gmail.com.
Andrew J. Sauer, Email: asauer@saint-lukes.org.
Hirak Shah, Email: Hshah6@kumc.edu.
Priya Kumar, Email: prvelappan@yahoo.com.
Val Rakita, Email: Val.Rakita@tuhs.temple.edu.
Corey Centen, Email: corey@bodyport.com.
Kivanc Ozonat, Email: kivanc@bodyport.com.
Sarah Smith, Email: sarah@bodyport.com.
References
- 1.Epstein AM, Jha AK, Orav EJ. The relationship between hospital admission rates and rehospitalizations. N Engl J Med. 2011;365:2287–2295. doi: 10.1056/NEJMsa1101942 [DOI] [PubMed] [Google Scholar]
- 2.Clarke DV, Newsam J, Olson DP, Adams D, Wolfe AJ, Fleisher LA. Acute hospital care at home: the CMS waiver experience. N Engl J Med Catalyst Commentary. 2021. Accessed November 21, 2022. https://catalyst.nejm.org/doi/full/10.1056/CAT.21.0338 [Google Scholar]
- 3.Fonarow GC, Corday E; ADHERE Scientific Advisory Committee. Overview of acutely decompensated congestive heart failure (ADHF): a report from the ADHERE registry. Heart Fail Rev. 2004;9:179–185. doi: 10.1007/s10741-005-6127-6 [DOI] [PubMed] [Google Scholar]
- 4.Adamson PB. Pathophysiology of the transition from chronic compensated and acute decompensated heart failure: new insights from continuous monitoring devices. Curr Heart Fail Rep. 2009;6:287–292. doi: 10.1007/s11897-009-0039-z [DOI] [PubMed] [Google Scholar]
- 5.Adamson PB, Smith AL, Abraham WT, Kleckner KJ, Stadler RW, Shih A, Rhodes MM; InSync III Model 8042 and Attain OTW Lead Model 4193 Clinical Trial Investigators. Continuous autonomic assessment in patients with symptomatic heart failure: prognostic value of heart rate variability measured by an implanted cardiac resynchronization device. Circulation. 2004;110:2389–2394. doi: 10.1161/01.CIR.0000139841.42454.78 [DOI] [PubMed] [Google Scholar]
- 6.Yancy CW, Jessup M, Bozkurt B, Butler J, Casey DE, Jr, Drazner MH, Fonarow GC, Geraci SA, Horwich T, Januzzi JL, et al. ; WRITING COMMITTEE MEMBERS. 2013 ACCF/AHA guideline for the management of heart failure: a report of the American College of Cardiology Foundation/American Heart Association Task Force on practice guidelines. Circulation. 2013;128:e240–e327. doi: 10.1161/CIR.0b013e31829e8776 [DOI] [PubMed] [Google Scholar]
- 7.Zhang J, Goode KM, Cuddihy PE, Cleland JGF; on behalf of the TEN-HMS Investigators. Predicting hospitalization due to worsening heart failure using daily weight measurement: analysis of the Trans-European Network-Home-Care Management System (TEN-HMS) study. Eur J Heart Fail. 2009;11:420–427. doi: 10.1093/eurjhf/hfp033 [DOI] [PubMed] [Google Scholar]
- 8.Amir O, Ben-Gal T, Weinstein JM, Schliamser J, Burkhoff D, Abbo A, Abraham WT. Evaluation of remote dielectric sensing (ReDS) technology-guided therapy for decreasing heart failure re-hospitalizations. Int J Cardiol. 2017;240:279–284. doi: 10.1016/j.ijcard.2017.02.120 [DOI] [PubMed] [Google Scholar]
- 9.Stehlik J, Schmalfuss C, Bozkurt B, Nativi-Nicolau J, Wohlfahrt P, Wegerich S, Rose K, Ray R, Schofield R, Deswal A, et al. Continuous wearable monitoring analytics predict heart failure hospitalization. Circ Heart Fail. 2020;13:e006513. doi: 10.1161/CIRCHEARTFAILURE.119.006513 [DOI] [PubMed] [Google Scholar]
- 10.Abraham WT, Stevenson LW, Bourge RC, Lindenfeld JA, Bauman JG, Adamson PB; CHAMPION Trial Study Group. Sustained efficacy of pulmonary artery pressure to guide adjustment of chronic heart failure therapy: complete follow-up results from the CHAMPION randomised trial. Lancet. 2016;387:453–461. doi: 10.1016/S0140-6736(15)00723-0 [DOI] [PubMed] [Google Scholar]
- 11.Sandhu AT, Goldhaber-Fiebert JD, Owens DK, Turakhia MP, Kaiser DW, Heidenreich PA. Cost-effectiveness of implantable pulmonary artery pressure monitoring in chronic heart failure. JACC Heart Fail. 2016;4:368–375. doi: 10.1016/j.jchf.2015.12.015 [DOI] [PMC free article] [PubMed] [Google Scholar]
- 12.Zile MR, Bennett TD, El Hajj S, Kueffer FJ, Baicu CF, Abraham WT, Bourge RC, Warner Stevenson L. Intracardiac pressures measured using an implantable hemodynamic monitor: relationship to mortality in patients with chronic heart failure. Circ Heart Fail. 2017;10:e003594. doi: 10.1161/CIRCHEARTFAILURE.116.003594 [DOI] [PubMed] [Google Scholar]
- 13.Lindenfeld J, Zile MR, Desai AS, Bhatt K, Ducharme A, Horstmanshof D, Krim SR, Maisel A, Mehra MR, Paul S, et al. Haemodynamic-Guided Management of Heart Failure (GUIDE-HF): a randomised controlled trial. Lancet. 2021;398:991–1001. doi: 10.1016/S0140-6736(21)01754-2 [DOI] [PubMed] [Google Scholar]
- 14.Boehmer JP, Hariharan R, Devecchi FG, Smith AL, Molon G, Capucci A, An Q, Averina V, Stolen CM, Thakur PH, et al. A multisensor algorithm predicts heart failure events in patients with implanted devices: results from the MultiSENSE study. JACC Heart Fail. 2017;5:216–225. doi: 10.1016/j.jchf.2016.12.011 [DOI] [PubMed] [Google Scholar]
- 15.Bekfani T, Fudim M, Cleland JGF, Jorbenadze A, von Haehling S, Lorber A, Rothman AMK, Stein K, Abraham WT, Sievert H, et al. A current and future outlook on upcoming technologies in remote monitoring of patients with heart failure. Eur J Heart Fail. 2021;23:175–185. doi: 10.1002/ejhf.2033 [DOI] [PubMed] [Google Scholar]
- 16.Multiple Cardiac Sensors for the Management of Heart Failure - Full Text View. ClinicalTrials.gov. Accessed December 23, 2021. https://clinicaltrials.gov/ct2/show/NCT03237858 [Google Scholar]
- 17.Pfeffer MA, Shah AM, Borlaug BA. Heart failure with preserved ejection fraction in perspective. Circ Res. 2019;124:1598–1617. doi: 10.1161/CIRCRESAHA.119.313572 [DOI] [PMC free article] [PubMed] [Google Scholar]
- 18.D’Onofrio A, Solimene F, Calò L, Calvi V, Viscusi M, Melissano D, Russo V, Rapacciuolo A, Campana A, Caravati F, et al. Combining home monitoring temporal trends from implanted defibrillators and baseline patient risk profile to predict heart failure hospitalizations: results from the SELENE HF study. Europace. 2022;24:234–244. doi: 10.1093/europace/euab170 [DOI] [PMC free article] [PubMed] [Google Scholar]
- 19.Heidenreich PA, Bozkurt B, Aguilar D, Allen LA, Byun JJ, Colvin MM, Deswal A, Drazner MH, Dunlay SM, Evers LR, et al. 2022 AHA/ACC/HFSA guideline for the management of heart failure: a report of the American College of Cardiology/American Heart Association joint committee on clinical practice guidelines. Circulation. 2022;145:e876–e894. doi: 10.1161/CIR.0000000000001062 [DOI] [PubMed] [Google Scholar]
- 20.Roberts ET, Mehrotra A. Assessment of disparities in digital access among medicare beneficiaries and implications for telemedicine. JAMA Intern Med. 2020;180:1386–1389. doi: 10.1001/jamainternmed.2020.2666 [DOI] [PMC free article] [PubMed] [Google Scholar]
- 21.Pieske B, Tschöpe C, de Boer RA, Fraser AG, Anker SD, Donal E, Edelmann F, Fu M, Guazzi M, Lam CSP, et al. How to diagnose heart failure with preserved ejection fraction: the HFA–PEFF diagnostic algorithm: a consensus recommendation from the Heart Failure Association (HFA) of the European Society of Cardiology (ESC). Eur J Heart Fail. 2020;22:391–412. doi: 10.1002/ejhf.1741 [DOI] [PubMed] [Google Scholar]
- 22.Reant P, Dijos M, Donal E, Mignot A, Ritter P, Bordachar P, Dos Santos P, Leclercq C, Roudaut R, Habib G, et al. Systolic time intervals as simple echocardiographic parameters of left ventricular systolic performance: correlation with ejection fraction and longitudinal two-dimensional strain. Eur J Echocardiogr. 2010;11:834–844. doi: 10.1093/ejechocard/jeq084 [DOI] [PubMed] [Google Scholar]
- 23.Kim CS, Ober SL, McMurtry MS, Finegan BA, Inan OT, Mukkamala R, Hahn JO. Ballistocardiogram: mechanism and potential for unobtrusive cardiovascular health monitoring. Sci Rep. 2016;6:31297. doi: 10.1038/srep31297 [DOI] [PMC free article] [PubMed] [Google Scholar]
- 24.Ramos M, Goodman R, Aldea DA, Saffarian M, Singhal P, Miklin DJ, Kingsford P, Kwong J, Onaka L, Patel S, et al. Outpatient heart failure monitoring with a novel cardiac scale: tracking volume status. J Am Coll Cardiol. 2022;79:2319. doi: 10.1016/s0735-1097(22)03310-1 [Google Scholar]
- 25.Kubicek WG, Kottke J, Ramos MU, Patterson RP, Witsoe DA, Labree JW, Remole W, Layman TE, Schoening H, Garamela JT. The Minnesota impedance cardiograph- theory and applications. Bio-Med Eng. 1974;9:410–416. [PubMed] [Google Scholar]
- 26.Yazdi D, Sridaran S, Smith S, Centen C, Patel S, Wilson E, Gillon L, Kapur S, Tracy JA, Lewine K, et al. Noninvasive scale measurement of stroke volume and cardiac output compared with the direct Fick method: a feasibility study. J Am Heart Assoc. 2021;10:e021893. doi: 10.1161/JAHA.121.021893 [DOI] [PMC free article] [PubMed] [Google Scholar]
- 27.Borlaug BA, Olson TP, Abdelmoneim SS, Melenovsky V, Sorrell VL, Noonan K, Lin G, Redfield MM. A randomized pilot study of aortic waveform guided therapy in chronic heart failure. J Am Heart Assoc. 2014;3:e000745. doi: 10.1161/JAHA.113.000745 [DOI] [PMC free article] [PubMed] [Google Scholar]
- 28.Yazdi D, Patel S, Ozonat K, Fudim M, Smith S, Centen C. Feasibility of a cardiac scale in measuring blood pressure. J Cardiovasc Transl Res. 2022;15:1212–1214. doi: 10.1007/s12265-022-10243-y [DOI] [PMC free article] [PubMed] [Google Scholar]
- 29.Using remote patient monitoring technologies for better cardiovascular disease outcomes guidance. American Heart Association. Accessed January 25, 2022. https://www.heart.org/-/media/files/about-us/policy-research/policy-positions/clinical-care/remote-patient-monitoring-guidance-2019.pdf?la=en [Google Scholar]


