

Summary
Myoblast fusion is an indispensable process in skeletal muscle development and regeneration. Studies in Drosophila led to the discovery of the asymmetric fusogenic synapse, where one cell invades its fusion partner with actin-propelled membrane protrusions to promote fusion. However, the timing and sites of vertebrate myoblast fusion remain elusive. Here we show that fusion between zebrafish fast muscle cells is mediated by an F-actin-enriched invasive structure. Two cell adhesion molecules, Jam2a and Jam3b, are associated with the actin structure, with Jam2a being the major organizer. The Arp2/3 actin nucleation-promoting factors, WAVE and WASP, but not the bipartite fusogenic proteins, Myomaker or Myomixer, promote the formation of the invasive structure. Moreover, the convergence of fusogen-containing microdomains and the invasive protrusions is a prerequisite for cell membrane fusion. Thus, our study provides unprecedented insights into the cellular architecture and molecular determinants of the asymmetric fusogenic synapse in an intact vertebrate animal.
In brief
Luo et al. demonstrate an F-actin-enriched invasive structure at the site of fusion between zebrafish fast muscle cells. The formation of this structure is triggered by cell adhesion and promoted by actin nucleation-promoting factors. This study reveals the asymmetric fusogenic synapse in an intact vertebrate animal.
Graphical Abstract
Introduction
Cell-cell fusion is a fundamental process in the development and physiology of multicellular organisms (Aguilar et al., 2013; Brukman et al., 2019; Chen et al., 2007; Chen and Olson, 2005). The fusion between mononucleated muscle cells to form multinucleated myofibers is a critical step in skeletal muscle development and regeneration (Millay, 2022). Studies of the invertebrate model Drosophila have yielded unprecedented insights into the molecular and cellular mechanisms underlying myoblast fusion (Deng et al., 2017; Kim et al., 2015a; Lee and Chen, 2019; Schejter, 2016). In particular, Drosophila studies revealed an asymmetric fusogenic synapse, where one muscle cell invades its fusion partner with F-actin-propelled protrusions to promote plasma membrane juxtaposition and fusion (Chen, 2011; Sens et al., 2010). Despite these findings in Drosophila, the cellular architecture and molecular determinants of myoblast fusion in intact vertebrate animals remain largely unknown.
In Drosophila, myoblast fusion occurs between two distinct types of muscle cells, muscle founder cell and fusion competent myoblast (FCM), the fates of which are specified by distinct sets of transcription factors (Abmayr et al., 2003; Chen and Olson, 2004; Richardson et al., 2008). The recognition and adhesion between these two types of muscle cells are mediated by Ig domain-containing cell adhesion molecules, including Dumbfounded (Duf) and Roughest (also known as IrreC) in founder cells (Ruiz-Gomez et al., 2000; Strunkelnberg et al., 2001), and Sticks and stones (Sns) and Hibris in fusion competent myoblasts (Artero et al., 2001; Bour et al., 2000; Dworak et al., 2001; Shelton et al., 2009). Following cell adhesion, the FCM generates an F-actin-enriched podosome-like structure (PLS) that propels several invasive membrane protrusions into the apposing founder cell (Sens et al., 2010). The formation of the F-actin-rich core of the PLS requires redundant functions of two actin nucleation-promoting factors (NPFs) for the Arp2/3 complex, Wiskott-Aldrich syndrome proteins (WASP) and WASP-family verprolin-homologous protein (WAVE, also known as Scar) (Kim et al., 2007; Massarwa et al., 2007; Richardson et al., 2007; Schafer et al., 2007; Sens et al., 2010). The invasive protrusions from the PLS increase the contact areas between the two apposing cell membranes, dynamically push the two membranes into close proximity, and trigger mechanosensory responses in the founder cell, ultimately leading to cell membrane merger (Duan et al., 2012; Duan et al., 2018; Jin et al., 2011; Kim et al., 2015b; Shilagardi et al., 2013; Zhang et al., 2020).
Zebrafish (Danio rerio) is an ideal vertebrate model to study myoblast fusion in vivo, owing to transparent embryos that develop rapidly outside of the mother. Zebrafish skeletal muscle derives from the somitic mesoderm (Keenan and Currie, 2019) and contains two major lineages – slow-twitch muscle and fast-twitch muscle (Devoto et al., 1996). Slow muscle cells, originating from the adaxial cells adjacent to the notochord, are mononucleated and migrate laterally from the notochord to the outer layer of the somite during somitogenesis (Cortes et al., 2003; Daggett et al., 2007). In contrast, fast muscle cells fuse to form multinucleated myofibers and constitute the bulk volume of each myotome (Henry and Amacher, 2004; Stickney et al., 2000). It has been shown that the migration of slow muscle cells and the fusion of fast muscle cells are intimately coordinated during somitogenesis (Cortes et al., 2003; Henry and Amacher, 2004; Hromowyk et al., 2020; Roy et al., 2001; Yin et al., 2018). In addition, live imaging experiments revealed the dynamic elongation and intercalation of fast muscle cells, leading to their attachment to both the anterior and posterior myosepta and spanning the entire width of the myotome (Snow et al., 2008; Yin et al., 2018). It has been proposed that fast muscle cell fusion (or myoblast fusion hereafter) occurs either after the cells attached to both anterior and posterior myosepta (Snow et al., 2008), or after one fusion partner attached to the anterior myoseptum (Hromowyk et al., 2020). However, the precise timing and sites of myoblast fusion have remained elusive.
Several molecular components have been implicated in myoblast fusion during zebrafish myogenesis. Genetic experiments demonstrated that the muscle-specific transcription factor Myogenin is required for myoblast fusion (Ganassi et al., 2018). In addition, a pair of Ig domain-containing cell adhesion molecules, Jamb (Jam2a) and Jamc (Jam3b), are required for the fusion process (Powell and Wright, 2011). Transplantation experiments suggest that Jam2a and Jam3b are engaged in heterophilic interactions to mediate myoblast fusion. However, the subcellular localization of Jam2a and Jam3b during the fusion process remains unknown. Two other transmembrane (TM) proteins have been shown to function at later stages of myoblast fusion in vertebrates. The seven-pass TM protein Myomaker and the single pass TM micropeptide Myomixer (also known as Myomerger and Minion) were initially found to be essential for myoblast fusion in mice (Bi et al., 2017; Millay et al., 2013; Quinn et al., 2017; Zhang et al., 2017) and later in zebrafish embryos (Di Gioia et al., 2017; Shi et al., 2017; Shi et al., 2018; Zhang and Roy, 2017).
Myomaker and Myomixer are specifically expressed in the developing zebrafish myotome and deleting either one of them results in a severe myoblast fusion defect (Di Gioia et al., 2017; Shi et al., 2017; Shi et al., 2018; Zhang and Roy, 2017). Co-expressing Myomaker and Myomixer in cultured fibroblasts induces cell-cell fusion, suggesting that these two proteins may function as a bipartite myoblast fusogen (Bi et al., 2017; Quinn et al., 2017; Zhang et al., 2017). Using Myomaker and Myomixer knockout mouse muscle cells, Leikina et al. showed that Myomaker is essential for the formation of the hemifusion stalk, whereas Myomixer is involved in the subsequent step of fusion pore formation (Leikina et al., 2018). Despite these findings, how fusogens are localized relative to the fusion sites has yet to be revealed.
Besides the fusion-promoting genes uncovered by genetic analyses, morpholino knockdown studies implicated several additional components in zebrafish myoblast fusion, such as the Ig domain-containing cell adhesion molecules Kirrel3l (zebrafish homolog of the Drosophila Duf) (Srinivas et al., 2007) and Nephrin (zebrafish homolog of the Drosophila Sns) (Sohn et al., 2009), the SH2 and SH3 domain-containing adaptor proteins Crk and Crkl (Moore et al., 2007), the small GTPase Rac1 and its guanine nucleotide exchange factors (GEFs) Dock1 and Dock5 (Moore et al., 2007), and the pleckstrin homology (PH) domain-containing protein, casein kinase 2 interacting protein-1 (Ckip-1) (Baas et al., 2012). Due to the potential off-target effects of morpholinos, the in vivo functions of these proteins are yet to be verified by genetic analyses. Nevertheless, the potential involvement of Rac1 in zebrafish myoblast fusion suggests that the actin cytoskeleton may play a role in the fusion process as in Drosophila. Compared to the Drosophila genome in which a single WASP and a single WAVE are encoded, the zebrafish genome encodes four WASP family members, Wasp1/Wasb, Wasp2/Wasa, N-Waspa/Wasla, and N-Waspb/Waslb, as well as four WAVE family members, Wave1/Wasf1, Wave2/Wasf2, Wave3a/Wasf3a and Wave3b/Wasf3b. Previous gene knockdown studies in zebrafish implicated Wasp1 and Wasp2 in the inflammatory responses of macrophages during wound healing (Cvejic et al., 2008; Jones et al., 2013), N-Waspa and N-Waspb in hematopoiesis (Bielczyk-Maczynska et al., 2014), and WAVE2 in heart development (Edwards et al., 2020). However, whether WASP and WAVE are involved in zebrafish muscle development, especially myoblast fusion, remains unknown.
In this study, we identified an F-actin-enriched invasive structure that marks each site of zebrafish myoblast fusion. We found that the cell adhesion molecules Jam2a and Jam3b are enriched at the site of fusion, with Jam2a being the major organizer of the actin structure. Both WASP and WAVE family members, but not the fusogenic proteins, promote the formation of the invasive structure. The convergence of fusogen-containing microdomains and the invasive protrusions is a prerequisite for cell membrane fusion. Thus, our study has revealed the cellular architecture and molecular determinants of the asymmetric fusogenic synapse in an intact vertebrate animal.
Results
The presence of F-actin foci in the developing zebrafish myotome
To test whether actin polymerization plays a role in zebrafish myoblast fusion, we stained 19.5, 20 and 24 hour post-fertilization (hpf) embryos with phalloidin. Strikingly, many F-actin-enriched foci with various sizes were observed in the developing myotome (Figure 1A; Figures S1A-S1C). Interestingly, the number of the F-actin foci per somite varied along the anteroposterior (A-P) axis. At each time point, the number of the actin foci per somite exhibited a bell-shaped distribution along the A-P axis, with a gradual increase from the anterior to the trunk somites and a gradual decrease thereafter. Moreover, there was a posterior shift of the somite exhibiting the peak foci number as the embryo grew older. For example, the highest foci number was observed in the 7th somite at 19.5 hpf (21-somite stage), 9th somite at 20 hpf (23-somite stage), and 15th somite at 24 hpf (29-somite stage) embryos, respectively (Figure 1B; Figures S1A-S1C). Given that somitic development proceeds along the A-P axis, the bell-shaped distribution of foci number at a given time point and the posterior shift of the peak along with embryonic growth suggest that the F-actin foci may coincide with the timing of muscle development, in particular myoblast fusion.
Figure 1. Zebrafish myoblast fusion is mediated by F-actin foci.
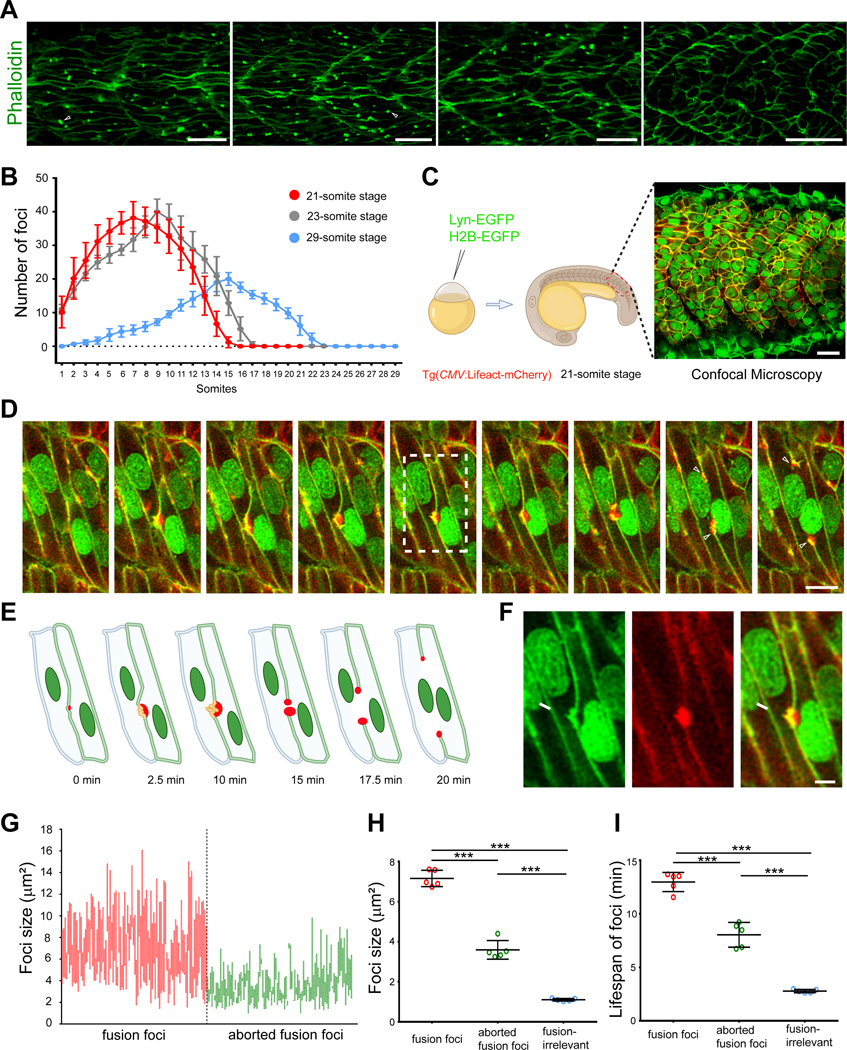
(A) F-actin foci are present in 20 hpf zebrafish myotome. Arrowheads indicate a few randomly selected foci. Scale bars, 25 μm.
(B) A graph showing the average F-actin foci number in each somite along the A-P axis of 19.5 hpf (21-somite stage, red), 20 hpf (23-somite stage, grey) and 24 hpf (29-somite stage, blue) embryos, respectively. Six embryos were analyzed for each stage. The error bars represent standard deviation.
(C) Schematic diagram of live embryo imaging. Plasma membrane (green) and nuclei (green) were labelled by Lyn-EGFP and H2B-EGFP, respectively. F-actin (red) was labelled by the transgene Tg(CMV:Lifeact-mCherry).
(D) Still images of a myoblast fusion event between two mononucleated muscle cells. The nuclei of the two fusing myoblasts are indicated with a and b. The fusion pore formed at ~t=15 min followed by the merging of the two cells. Arrowheads indicate the split actin focus that remained at the rim of the expanding fusion pore. Scale bar, 10 μm.
(E) Schematic drawings of the fusion event at several representative time points displayed in (D).
(F) Enlarged image from boxed area at t=10 min in (D) showing the inward curvatures on the plasma membrane (arrow) caused by invasive protrusions. Scale bar, 5 μm.
(G) The range of F-actin foci size during myoblast fusion. Red lines and green lines represent the size range of individual fusion foci and aborted fusion foci during their lifespans, respectively.
(H) Dot plot of the average size of fusion foci, aborted fusion foci, and fusion-irrelevant foci. Each data point represents the average value per embryo, instead of the actual value of each focus, to reflect the differences between embryos in this and all the subsequent dot plots.
(I) Dot plot of the average lifespan of fusion foci, aborted fusion foci, and fusion-irrelevant foci.
In (B), (H) and (I), mean ± s.d. values are shown, and significance was determined by the unpaired parametric t test. *** p < 0.001.
Invasive F-actin foci mediate zebrafish myoblast fusion
To explore the potential link between the F-actin foci and myoblast fusion, we generated a transgenic line Tg(CMV:Lifeact-mCherry) that expressed Lifeact-mCherry under the control of a ubiquitous promoter (CMV) to monitor F-actin in live zebrafish embryos. Lyn-EGFP and H2B-EGFP mRNAs were co-injected into Tg(CMV:Lifeact-mCherry) embryos to mark plasma membrane and nuclei, respectively. Time-lapse imaging with a time interval of 2.5 minutes was conducted to visualize F-actin and myoblast fusion on somites 14–18 of 21-somite stage embryos (Figure 1C; Video S1). Strikingly, each fusion event occurred at a membrane contact site where there was an F-actin focus (Figures 1D–1F; Video S2), indicating that the positions of these foci coincide with the sites of cell fusion. These F-actin foci were highly dynamic and constantly changing their shapes and sizes. The size of a single focus could vary between 2 μm2 to 16 μm2, with an average size of 7.16 ± 0.41 μm2 (100 foci from 5 embryos) (Figures 1G and 1H, data points in red). Each focus already exhibited a substantial size (>2 μm2) when they first appeared, suggesting that there was a burst of actin polymerization at the initial stage of foci formation. Subsequently, these foci gradually increased their sizes until fusion pore formation. After pore opening, the actin focus would be split into two halves, each of which remained at the rim of the expanding fusion pore until pore expansion was completed (Figure 1D; Video S2). The lifespan of a single focus could vary between 7.5 min to 20 min, with an average lifespan of 12.97 ± 0.90 min (100 foci from 5 embryos) (Figure 1I). Once the multinucleated myotubes attached to the myosepta on both ends and became parallelogram shaped, few actin foci were observed along these fully elongated myofibers (Video S1).
Interestingly, all fusion-associated foci exhibited dynamic invasive behaviors toward neighboring cells by projecting membrane protrusions, causing inward curvatures on the neighboring cell’s membrane (Figure 1F). To examine these invasive protrusions at the ultrastructural level, we performed transmission electron microscopy (EM) analyses of 20 hpf zebrafish embryos. Indeed, EM analyses revealed finger-like protrusions projected by muscle cells into their neighbors (Figure 2A), corresponding to the invasive protrusions observed by confocal microscopy (Figure 1F). In wild-type embryos, each actin structure propelled ~ 2 invasive protrusions (2.29 ± 1.10 per focus, 31 foci from 3 embryos) into the neighboring muscle cell (Figure 2D). The average width of the actin base and the maximal depth of invasion were 1.70 ± 0.89 μm (31 foci from 3 embryos) (Figure 2E) and 1.10 ± 0.38 μm (31 foci from 3 embryos) (Figure 2F), respectively. Together, our live imaging and EM analyses led to the discovery of an F-actin-propelled invasive structure at the site of myoblast fusion, which will be referred to as the zebrafish fusogenic synapse. The muscle cell that generates the fusion focus will be called the “invading cell”, and the cell being invaded the “receiving cell”. The F-actin foci that lead to successful fusion events will be referred to as the “fusion foci” hereafter.
Figure 2. The invasive F-actin structure consists of fingerlike protrusions.

(A-C) EM micrographs of fast muscle cells in 21-somite stage wild-type (A), myomaker−/− (B) and myomixer−/− (C) embryos. The invading cells are pseudo-colored in light magenta. Note the invasive membrane protrusions projected from an F-actin base (gray coloration) devoid of intracellular organelles. The boundary of the F-actin-enriched area is delineated by a white dashed line. Scale bar, 500 nm.
(D-F) Dot plots showing the number of invasive protrusions (D), width of the actin base (E) and the maximal depth of invasion (F) in wild-type, myomaker−/− and myomixer−/− embryos. The width of the actin base was measured as the distance between the base of the outermost invasive protrusions. Mean ± s.d. values are shown in dot plots, and statistical analysis was performed for each parameter in n=3 embryos using the unpaired parametric t test. * p < 0.05, ** p < 0.01, and *** p < 0.001.
Besides the fusion foci, two other types of F-actin foci were also present in muscle cells. They could be distinguished from the fusion foci by their location, size, lifespan and/or invasive behavior. One of the two types of F-actin foci also localized to muscle cell contact sites and exhibited invasive behavior toward neighboring cells, as the fusion foci. However, they exhibited smaller size (3.59 ± 0.46 μm2, 100 foci from 5 embryos) and shorter lifespan (8.04 ± 1.16 min, 100 foci from 5 embryos). These foci failed to induce fusion, and therefore will be referred to as “aborted fusion foci” (Figures 1G–1I). The other type of foci appeared randomly in the cytosol and/or at the cell cortex. They were non-invasive and even smaller (1.10 ± 0.06 μm2, 100 foci from 5 embryos) and shorter lived (2.78 ± 0.16 min, 100 foci from 5 embryos) than the aborted fusion foci (Figures 1H–1I). These foci are considered as “fusion-irrelevant foci”.
The zebrafish muscle cells are not predetermined to be invaders or receivers
To further understand the behaviors of fusion partners, we analyzed the 100 fusion events mediated by fusion foci presented in Figure 1G. Among these 100 events, fusion between two mononucleated myoblasts was more frequent (86/100 events) (an example is shown in Figure 1D; Video S2) than fusion events involving a mononucleated myoblast with two neighboring mononucleated myoblasts or with a bi-nucleated myotube (14/100) (Figure 3). In contrast to Drosophila myoblast fusion in which the invading and receiving fusion partners are predetermined by transcription regulation (for example, founder cells/myotubes are always receivers and FCMs are always invaders), the same muscle cell in zebrafish could be either an invader or a receiver with different neighboring cells. For example, cell b in Figure 3A was a receiver to cell a, but while the fusion pore was forming between a and b, cell b was seen invading cell c (Figure 3A; Video S3). In addition, the same two fusion partners could reverse their identities as an invader or a receiver through dynamic interactions (cell ab and c in Figure 3B; Video S4). Furthermore, unlike in Drosophila where multinucleated myotubes are always receivers, bi-nucleated cells in zebrafish could also behave as invaders (an example is shown in Figure 3C; Video S5). Interestingly, a single muscle cell could be invaded by two neighbors simultaneously, although the actual fusion events may occur at different time points (Figure 3D; Video S6). Taken together, our live imaging experiments revealed increased muscle cell plasticity regarding their identity (invader or receiver) during zebrafish myoblast fusion compared to Drosophila.
Figure 3. Cellular plasticity in zebrafish myoblast fusion.
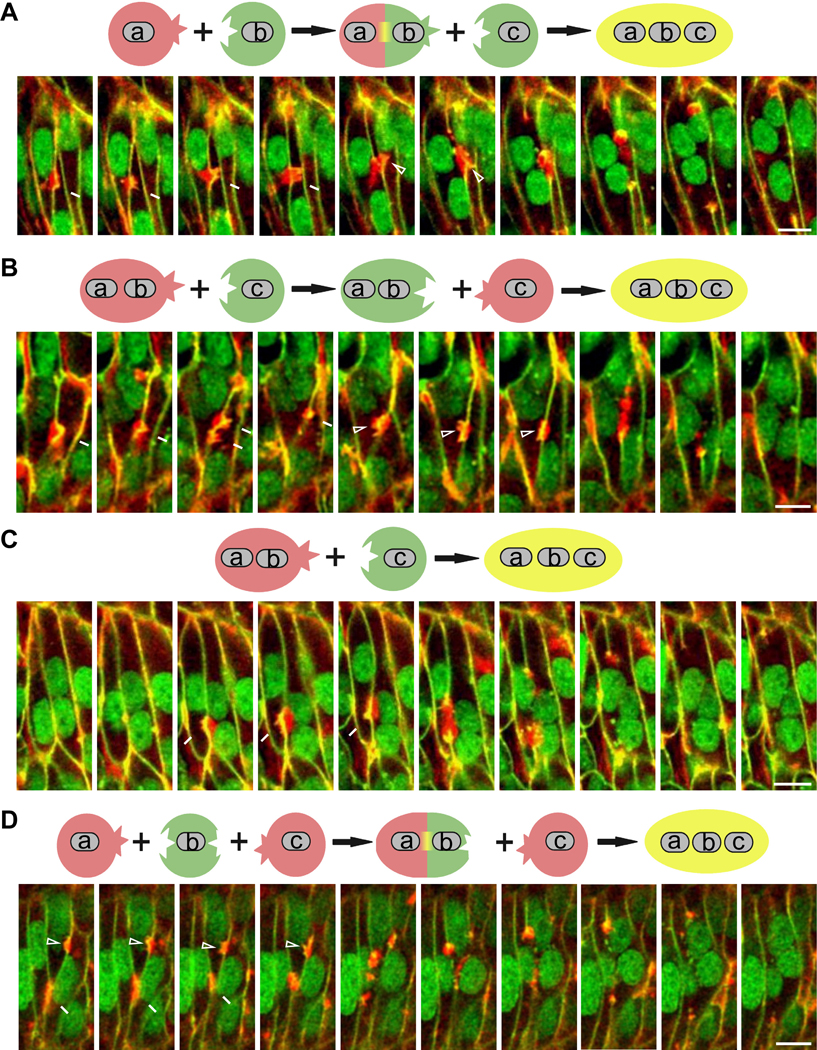
In all panels, plasma membrane (green) and nuclei (green) were labelled by Lyn-EGFP and H2B-EGFP, respectively. F-actin (red) was labelled by the transgene Tg(CMV:Lifeact-mCherry). A schematic representation of the fusion event is shown above each panel.
(A) Still images of two sequential myoblast fusion events in which the same myoblast (b) was an invader and a receiver. The nuclei of three fusing myoblasts are marked as a, b and c. Invasive protrusions (arrows) projected from cell a into cell b resulted in a-b fusion (~t=17.5 min), generating the binucleated cell ab. Subsequently, invasive protrusions (arrowheads) projected from cell b (17.5 min) and cell ab (after 17.5 min) into cell c resulted in ab-c fusion (~t=22.5 min), generating the tri-nucleated cell abc. Scale bar, 10 μm. See also Video S3.
(B) Still images of a myoblast fusion event in which the identities of invading and receiving cells were reversed. The nuclei of two fusing muscle cells are marked as ab and c. Invasive protrusions (arrows) projected from the bi-nucleated cell ab into the mononucleated cell c did not result in fusion. However, invasive protrusions projected from cell c into ab at a later time point (~t=22.5 min) led to ab-c fusion, generating the tri-nucleated cell abc. Scale bar, 10 μm. See also Video S4.
(C) Still images of a myoblast fusion event in which a bi-nucleated muscle cell invaded a mononucleated myoblast. The nuclei of the two fusing muscle cells are marked with ab and c. Invasive protrusions (arrows) projected from the bi-nucleated cell ab into the mononucleated cell c resulted in ab-c fusion (~t=12.5 min), generating the tri-nucleated cell abc. Scale bar, 10 μm. See also Video S5.
(D) Still images of two fusion events in which two myoblasts invaded the same receiving cell. The nuclei of the three fusing myoblasts are marked as a, b and c. Invasive protrusions (arrows) projected from cell a into b resulted in the formation of the bi-nucleated cell ab (~t=7.5 min). Invasive protrusions (arrowheads) projected from cell c into b and later ab resulted in the formation of the tri-nucleated cell abc at ~t=10 min.
Scale bar, 10 μm. See also Video S6.
Jam2a and Jam3b are required for F-actin foci formation and are enriched at the fusogenic synapse
Previous studies have shown that zebrafish myoblast fusion is mediated by the heterophilic interactions between two Ig domain-containing cell adhesion molecules, Jam2a and Jam3b (Powell and Wright, 2011). To understand the potential link between cell adhesion and the actin cytoskeleton during the fusion process, we investigated whether Jam2a and Jam3b are involved in F-actin foci formation. We stained the 23-somite stage wild-type, jam2a−/− and jam3b−/− mutant embryos with phalloidin, and found that both jam2a−/− and jam3b−/− mutant embryos exhibited a significant overall reduction of F-actin foci number (Figures 4A–4D). The few residual F-actin foci in jam2a−/− and jam3b/− mutant embryos are consistent with the low level of myoblast fusion in these embryos shown by Powell and Wright (Powell and Wright, 2011), perhaps mediated by the weak homophilic interactions of Jam2a or Jam3b (Powell and Wright, 2011). Live imaging of 23-somite stage jam2a−/− and jam3b−/− mutant embryos revealed that the small number of invasive foci present in these mutant embryos had significantly reduced sizes (2.93 ± 0.41 μm2, 60 foci from 5 jam2a−/− embryos; 3.65 ± 0.21 μm2, 60 foci from 5 jam3b-/ -embryos) compared to the wild-type fusion foci (7.16 ± 0.41 μm2, 100 foci from 5 embryos) (Figure 4E). In addition, the lifespan of these few mutant foci was also reduced (8.27 ± 1.41 min, 60 foci from 5 jam2a−/−embryos; 9.14 ± 1.24 min, 60 foci from 5 jam3b−/− embryos) compared to the wild-type fusion foci (12.97 ± 0.90 min, 100 foci from 5 embryos) (Figure 4F). Not surprisingly, all 60 foci were aborted foci in jam2a−/− mutant embryos, and 53 out of 60 were aborted foci in jam3b−/− mutant embryos. Taken together, the significant reduction in the number, size and lifespan of the F-actin foci in the jam2a−/− and jam3b−/− mutants correlates with a severe myoblast fusion defect, strongly suggesting that Jam2a and Jam3b are required for organizing the formation of the fusion foci.
Figure 4. Jam2a and Jam3b organize actin foci formation and are localized at the fusogenic synapse.

(A-D) Reduction of F-actin foci number in jam2a−/− and jam3b−/− mutant embryos. Confocal images of 23-somite stage wild-type (A), jam2a−/− (B), and jam3b−/− (C) mutant embryos. Arrowheads indicate a few randomly selected actin foci. Scale bar, 25 μm.
(D) A graph showing the number of average foci number in each somite of fixed wild-type, jam2a−/−, and jam3b−/− mutant embryos. F-actin foci of >2 μm2 (including the fusion foci and aborted fusion foci) were counted. Data are represented as mean ± s.d. Statistical analysis was performed for foci number in somite 9 of n=6 embryos using the unpaired parametric t test. *** p < 0.001.
(E) Reduction of F-actin foci size in jam2a−/− and jam3b−/− mutant embryos. Dot plot showing the average size of the F-actin foci during their lifespan in live embryos.
(F) Reduced lifespan of F-actin foci in jam2a−/− and jam3b−/− mutant embryos.
In (E) and (F), each data point represents the mean value of an embryo. Mean ± s.d. values are shown in the dot plot, and significance was determined by the unpaired parametric t test. *** p < 0.001.
(G and H) Subcellular localization of mCherry-tagged Jam2a and Jam3b (G) or mNeonGreen-tagged Jam2a and Jam3b (H) in 23-somite stage embryos. The F-actin foci (arrows) were visualized by phalloidin staining. Scale bar, 25 μm.
We next examined whether Jam2a and Jam3b are present at the fusogenic synapse. We first constructed fluorescently (mCherry or mNeonGreen) tagged Jam2a and Jam3b and tested their abilities to rescue myoblast fusion in jam2a−/− and jam3b−/− mutant embryos, respectively. Injecting the mRNA of fluorescently tagged full-length Jam2a and Jam3b into jam2a−/− and jam3b−/− mutant embryos, respectively, rescued the myoblast fusion defects (Figures 5C–5E), demonstrating that these fluorescently tagged proteins are functional and thus can be used for localization studies. As shown in Figures 4G and 4H, both Jam2a and Jam3b were closely associated, but not completely overlapping, with the F-actin foci, consistent with their role as adhesion molecules localized on the cell membrane at the fusogenic synapses (Figures 4G and 4H). Taken together, these data demonstrate that myoblast fusion in zebrafish embryos is initiated by the Ig domain-containing adhesion molecules, which organize the formation of the fusion foci at the fusogenic synapse to promote myoblast fusion.
Figure 5. Differential activities of Jam2a and Jam3b in organizing the F-actin foci.

(A and B) Schematic diagrams of Jam2a and Jam2aΔC (A), and Jam3b and Jam3bΔC
(B).
(C) Confocal images of 48 hpf jam2a−/− mutant embryos either un-injected or injected with Jam2a-mCherry or Jam2aΔC-mCherry mRNA. Note that Jam2a-mCherry, but not Jam2aΔC-mCherry, significantly rescued the fusion defect in jam2a−/− mutant embryos.
(D) Confocal images of 48 hpf jam3b−/− mutant embryos either un-injected or injected with Jam3b-mCherry or Jam3bΔC-mCherry mRNA. Note that both Jam3b-mCherry and Jam3bΔC-mCherry rescued the fusion defect in jam3b−/− mutant embryos.
In (C) and (D), nuclei were labelled with Tg(mylpfa:H2B-EGFP) (green) and membranes with Lyn-mCherry (red). Scale bar, 25 μm.
(E) Quantification of the rescue experiments in (C) and (D). Dot plot showing the nuclei number per myofiber (in somites 10–12) of jam2a−/− (un-injected or injected with Jam2aΔC-mCherry or Jam2a-mCherry mRNA) and jam3b−/− mutant (un-injected or injected with Jam3bΔC-mCherry or Jam3b-mCherry mRNA) embryos at 48 hpf.
(F) Confocal images of 23-somite stage jam2a−/− mutant embryos un-injected or injected with Jam2a-mCherry or Jam2aΔC-mCherry mRNA. Note that the F-actin foci number was significantly rescued by Jam2a-mCherry, but not by Jam2aΔC-mCherry, expression in jam2a−/− mutant embryos.
(G) Confocal images of 23-somite stage jam3b−/− mutant embryos either un-injected or injected with Jam3b-mCherry or Jam3bΔC-mCherry mRNA. Note that the F-actin foci number was rescued by either Jam3b-mCherry or Jam3bΔC-mCherry expression in jam3b−/− mutant embryos.
In (F) and (G), the F-actin foci were visualized by phalloidin staining (arrowheads). Scale bar, 25 μm.
(H) Quantification of the F-actin foci numbers in jam2a−/− and jam3b−/− mutant embryos in (F) and (G). Dot plot showing the foci number in jam2a−/− embryos un-injected (41.55 ± 7.75), injected with Jam2aΔC-mCherry (63.09 ± 14.87) or Jam2a-mCherry mRNA (149.00 ± 30.24), and in jam3b−/− embryos un-injected (43.82 ± 6.84), injected with Jam3bΔC-mCherry (123.10 ± 33.98) or Jam3b-mCherry mRNA (115.10 ± 24.69) at 23-somite stage. In each experiment, the foci numbers in somite 9–16 of n=11 embryos were quantified.
(I) Quantification of the F-actin foci sizes in jam2a−/− and jam3b−/− mutant embryos in (F) and (G). Dot plot showing the foci size in jam2a−/− embryos un-injected (3.31 ± 0.32 μm2), injected with Jam2aΔC-mCherry (3.70 ± 0.27 μm2) or Jam2a-mCherry mRNA (5.26 ± 0.43 μm2), and in jam3b−/− embryos un-injected (3.55 ± 0.28 μm2), injected with Jam3bΔC-mCherry (5.35 ± 0.33 μm2) or Jam3b-mCherry mRNA (5.18 ± 0.31μm2) at 23-somite stage. In each experiment, the foci sizes in somite 9–16 of n=11 embryos were quantified.
In (E), (H) and (I), each data point represents the mean value of an embryo. Mean ± s.d. values are shown in the dot plot, and significance was determined by the unpaired parametric t test. ** p < 0.01; *** p < 0.001.
(J) Schematic drawing summarizing the results of the rescue experiments in jam2a−/− and jam3b−/− mutants. Note that Jam2a, but not Jam3b, is the major organizer of the actin focus.
The F-actin foci are primarily organized by Jam2a instead of Jam3b
Given that the F-actin focus exhibited an asymmetry at the fusogenic synapse, we asked whether Jam2a or Jam3b or both are involved in organizing foci formation. Toward this, we performed genetic rescue experiments using C-terminally truncated Jam2a (Jam2aΔC) and Jam3b (Jam3bΔC) in jam2a−/− and jam3b−/− mutant embryos, respectively. Both Jam2aΔC and Jam3bΔC have the intact ectodomain and TM domain but lack the cytoplasmic domain, allowing them to mediate cell adhesion normally without initiating intracellular signaling, such as organizing actin foci formation (Figures 5A and 5B; Figures S2A and S2B). Indeed, the abilities of Jam2aΔC and Jam3bΔC to mediate cell adhesion was confirmed by S2 cell aggregation assays. When these truncated proteins were expressed in two groups of cultured Drosophila S2 cells, they promoted robust inter-group cell-cell aggregation via heterophilic interactions, as did their full-length counterparts Jam2a and Jam3b (Figures S2C and S2D).
Injecting Jam2aΔC mRNA barely rescued (1.12 ± 0.06 nuclei/fiber; 1788 myofibers from n=24 embryos) the myoblast fusion defect in jam2a−/− mutant embryos (1.05 ± 0.04 nuclei/fiber; 1028 myofibers from n=15 embryos), compared to the rescue by the full-length Jam2a (2.00 ± 0.12 nuclei/fiber; 735 myofibers from n=10 embryos) (Figures 5C and 5E). Consistent with this, the F-actin foci number and size in jam2a−/− embryos expressing Jam2aΔC were significantly lower and smaller than those in jam2a−/− embryos expressing Jam2a, respectively (Figures 5F, 5H and 5I). These results suggest that the endogenous Jam3b, while engaging with Jam2aΔC, failed to organize F-actin foci. Strikingly, injecting Jam3bΔC mRNA into jam3b−/− mutant embryos significant rescued the fusion defect from 1.09 ± 0.03 nuclei/fiber (985 myofibers from n=15 embryos) to 2.05 ± 0.15 nuclei/fiber (967 myofibers from n=10 embryos), similar to the rescuing effect of the full-length Jam3b (1.93 ± 0.11 nuclei/fiber; 980 myofibers from n=10 embryos) (Figures 5D and 5E). Correspondingly, jam3b−/− mutant embryos expressing Jam3bΔC or Jam3b exhibited similar number and size of the F-actin foci (Figures 5G–5I). Because Jam3bΔC could not organize F-actin foci formation due to the lack of the C-terminal domain, the F-actin foci generated in these rescued embryos must have been organized by the endogenous full-length Jam2a at the fusogenic synapses. Thus, these results demonstrate that Jam2a, but not Jam3b, is the major organizer of fusion foci formation at the fusogenic synapses (Figure 5J).
To further study the roles of Jam2a and Jam3b in myoblast fusion, we overexpressed the full-length proteins and the truncated forms in wild-type embryos. While overexpressing the full-length Jam2a in wild-type embryos did not affect myoblast fusion, overexpressing Jam2aΔC caused a dominant negative effect, likely by competing with the endogenous Jam2a for Jam3b binding and thus interfering with endogenous Jam2a’s activity in organizing the actin foci (Figure S2E). In contrast, overexpressing either Jam3b or Jam3bΔC in wild-type embryos resulted in increased myoblast fusion (Figure S2E). As shown previously by Powell and Wright, the initial mesodermal expression of Jam3b is restricted to a subset of somitic cells and at a relatively low level compared to the high level of Jam2a expression in all somitic cells (Powell and Wright, 2011). Thus, overexpression of Jam3b and Jam3bΔC likely enhanced the level and expanded the domain of Jam3b expression, thus attracting more Jam2a-expressing neighboring cells to fuse with them. The different effects of Jam2aΔC vs. Jam3bΔC overexpression in wild-type embryos support the role for Jam2a, but not Jam3b, as the major actin foci organizer in myoblast fusion.
Both WAVE and WASP promote myoblast fusion and F-actin foci formation in zebrafish embryos
Since myoblast fusion in zebrafish is mediated by an invasive F-actin structure, we asked whether the Arp2/3 NPFs are involved in the fusion process. Toward this end, we generated loss-of-function mutants of the wave and wasp family of genes using the CRISPR/Cas9 system (Figures S3 and S4; Key Resource Table) and analyzed the myoblast fusion phenotype by counting the nuclei number in muscle fibers of 48 hpf embryos. In wild-type embryos, each muscle fiber in somite 10–12 contained 3.51 ± 0.22 nuclei (1254 fibers from n=15 embryos). Among the four single mutants of WAVE family members, only wasf3b−/− mutant exhibited a mild fusion defect with 2.39 ± 0.23 nuclei per fiber (1374 fibers from n=15 embryos) (Figures S5A and S5B). The wasf2−/−; wasf3b−/− double mutant embryos exhibited a severe fusion defect with 1.49 ± 0.17 nuclei per fiber (1359 fibers from n=15 embryos) (Figures 6A and 6B). Further mutating wasf1 and wasf3a did not enhance the fusion defect, indicating that Wasf2 and Wasf3b are the major WAVE proteins that function redundantly in myoblast fusion. The fusion defect in the wasf2−/−; wasf3b−/− double mutant embryos was rescued to 2.09 ± 0.10 nuclei per fiber (n=15 embryos) by Wasf2 expression, and to 2.30 ± 0.13 nuclei per fiber (n=15 embryos) by Wasf2 and Wasf3b co-expression, consistent with both Wasf2 and Wasf3b contributing to myoblast fusion (Figures S5D and S5F). For the WASP family members, all single and double mutants, as well as the n-waspb−/−; wasp1−/−; wasp2−/− triple mutant, did not show any fusion defect. However, two triple mutants, n-waspa−/−; wasp1−/−; wasp2/- and n-waspa−/−; n-waspb−/−; wasp1−/−, exhibited mild fusion defects, with 2.79 ± 0.47 (n=15 embryos) and 2.39 ± 0.35 (n=15 embryos) nuclei per fiber, respectively (Figures 6A and 6B; Figures S5A and S5C). The n-waspa−/−; n-waspb−/−; wasp1−/−; wasp2−/− quadruple mutant also showed a similar fusion defect (2.41 ± 0.18 nuclei per fiber, n=15 embryos) (Figures S5A and S5C). The fusion defect in the n-waspa−/−; n-waspb−/−; wasp1−/− triple mutant embryos was rescued to 3.04 ± 0.15 nuclei per fiber (n=15 embryos) by N-waspa expression, and to 3.13 ± 0.22 nuclei per fiber (n=15 embryos) by N-waspa&N-waspb&Wasp1 co-expression (Figures S5E and S5G), suggesting that N-waspa may partially compensate for the loss of the other WASP family members. Thus, WASP family members, in particular N-waspa, N-waspb and Wasp1, have redundant functions in promoting myoblast fusion. Taken together, these experiments demonstrate that both WASP and WAVE family proteins promote myoblast fusion, with the WAVE family making a more significant contribution.
Key resources table
| REAGENT or RESOURCE | SOURCE | IDENTIFIER |
|---|---|---|
| Bacterial and virus strains | ||
| DH5α E. coli | Invitrogen | 18265017 |
| Chemicals, peptides, and recombinant proteins | ||
| ProLong Gold Antifade Mountant | Invitrogen | P36930 |
| PBS pH7.4(1X) (phosphate buffered saline) | Gibco | 10010–023 |
| Alexa Fluor™ 488 phalloidin | Invitrogen | A12379 |
| Alexa Fluor™ 568 Phalloidin | Invitrogen | A12380 |
| Alexa Fluor™ 647 Phalloidin | Invitrogen | A22287 |
| Cas9 protein | PNABio | CP01 |
| Tween 20 | RPI | P20370–0.5 |
| Triton (X-100) | Thermo Scientific™ | A16046-AP |
| Fetal bovine serum | Gibco | 26140079 |
| Schneider’s Drosophila medium | Gibco | 21720024 |
| Horse serum | Sigam-Aldrich | H0146 |
| Effectene transfection reagent | Qiagen | 301427 |
| Hoechest | Invitrogen | H3570 |
| Paraformaldehyde solution 4% in PBS | Thermo Scientific™ | J19943-K2 |
| CaCl2 | SIGMA | C5080 |
| 2.5% Glutaraldehyde in 0.1M Sodium Cacodylate Buffer, pH 7.4 | Electron Microscopy Sciences | 15960–1L |
| Sucrose | Sigma-Aldrich | 57–50-1 |
| Osmium Tetroxide 4%Aqueous solution | Electron Microscopy Sciences | 19150 |
| Sodium Cacodylate Buffer, 0.2M, pH 7.4 | Electron Microscopy Sciences | 11652 |
| Uranyl acetate.hydrate | Electron Microscopy Sciences | 22450 |
| Paraformaldehyde 16% Aqueous solution | Electron Microscopy Sciences | 15710-S |
| Bovine Serum Albumin | SIGMA | A9647 |
| Critical commercial assays | ||
| MEGAclear Kit | Invitrogen | AM1908 |
| MEGAscript T7 Transcription Kit | Invitrogen | AM1333 |
| AccuStart II PCR Genotyping Kit | Quantabio | 95135 |
| mMESSAGE mMACHINE™ SP6 Transcription Kit | Invitrogen | AM1340 |
| NEBuilder HiFi DNA Assembly Master Mix | NEB | E2621S |
| Experimental models: Cell lines | ||
| Drosophila S2 cell | Duojia Pan, UTSW | N/A |
| Experimental models: Organisms/strains | ||
| Tg(CMV:Lifeact-mCherry) | This manuscript | N/A |
| Tg(CMV:Lifeact-EGFP) | This manuscript | N/A |
| Tg(mylpfa:H2B-EGFP) | This manuscript | N/A |
| Zebrafish: jam2aHU3319 | Gavin Wright, Wellcome Trust Sanger Institute, UK | ZDB-ALT-100506–2 |
| Zebrafish: jam3bsa0037 | Gavin Wright, Wellcome Trust Sanger Institute, UK |
ZDB-ALT-100315–1 |
| Zebrafish: myomakermb14 | Shaojun Du, University of Maryland, USA |
ZDB-ALT-180316–4 |
| Zebrafish: myomixersw101 | Elizabeth Chen, UTSW, USA | ZDB-ALT-211229–7 |
| Zebrafish: n-waspa−/− (Δ59) | This manuscript | N/A |
| Zebrafish: n-waspb−/− (Δ49) | This manuscript | N/A |
| Zebrafish: wasp1−/− (Δ23) | This manuscript | N/A |
| Zebrafish: wasp2−/− (Δ11) | This manuscript | N/A |
| Zebrafish: wasf1−/− (Δ44) | This manuscript | N/A |
| Zebrafish: wasf2−/− (Δ32) | This manuscript | N/A |
| Zebrafish: wasf3a−/− (Δ35) | This manuscript | N/A |
| Zebrafish: wasf3b−/− (Δ10) | This manuscript | N/A |
| Oligonucleotides | ||
| N-waspa genotyping primer F: 5’ ATGTCACCCTACTCTCCTCAAATAG 3’ R: 5’ GCATAGAGCATCAGAACTAAGGCAG 3’ |
This manuscript | N/A |
| N-waspb genotyping primer F: 5’ GCATTCTCTTAATGAGTTCTTGATC 3’ R: 5’ GGAAAGTAACCTACCACACCACCT 3’ |
This manuscript | N/A |
| Wasp1 genotyping primer F: 5’ GTCACAGAAAGACTTTAGGCAGGTACAC 3’ R: 5’ CTCTTCCACATTAGACTGACTTATTCCTCC 3’ |
This manuscript | N/A |
| Wasp2 genotyping primer F: 5’ GCATTTAGGCATGTCAGTCATCTTG 3’ R: 5’ GTGCAGTCTCCTGGAACAGAACTGG 3’ |
This manuscript | N/A |
| Wasf1 genotyping primer F: 5’ CAGTGTCTCTTCAGGACATCACCATGAG 3’ R: 5’ ATACATTAGTGTTCCAGGAAGTCAC 3’ |
This manuscript | N/A |
| Wasf2 genotyping primer F: 5’ CCTTGTTGCCTTCCTGCCTTTTATG 3’ R: 5’ CCTACTCAACAACAGGGAAAGCGTG 3’ |
This manuscript | N/A |
| Wasf3a genotyping primer F: 5’ AACTTGTTACTTCACACCACTGCAT 3’ R: 5’ TACCTGTAGTCTGTTGGAGGAAGTG 3’ |
This manuscript | N/A |
| Wasf3b genotyping primer F: 5’ TGGTAATTGGCACAGGTCTCACGGA 3’ R: 5’ TGATGGTGTGTGATGCTGGTGGAGG 3’ |
This manuscript | N/A |
| N-waspa sgRNA target sequence S1: CAGTGGTCCAGGTTTACGGGG S2: GGTTGTCTTTCACCAAACAGG |
This manuscript | N/A |
| N-waspb sgRNA target sequence S1: ACATGTGTGGCATTTCTGAGG S2: AGAAGCAAGGAGGAGTAGAGG |
This manuscript | N/A |
| Wasp1 sgRNA target sequence S1: AAGGCAAAAGCAAAGGGCAGG S2: CTGCAAGAGCTGCTGGGCAGG |
This manuscript | N/A |
| Wasp2 sgRNA target sequence S1: AGCGTTCAGGTGGAATGGAGG |
This manuscript | N/A |
| Wasf1 sgRNA target sequence S1: TCCTGGATGGTGGAGCTGCGG S2: CTCTCCCCGTCCCCATGCAGG |
This manuscript | N/A |
| Wasf2 sgRNA target sequence S1: AGGTGGGAGAGGAGAGCCGGG |
This manuscript | N/A |
| Wasf3a sgRNA target sequence S1: AGGGCCTGGAGCTGCGGACGG |
This manuscript | N/A |
| Wasf3b sgRNA target sequence S1: ATTACCGCAGCGGGTCAATGG |
This manuscript | N/A |
| Recombinant DNA | ||
| pCS2-Lyn-EGFP | This manuscript | N/A |
| pCS2-Lyn-mCherry | This manuscript | N/A |
| pCS2-mRFP | Brian Ciruna, The Hospital for Sick Children, Canada | N/A |
| pCS2-FA transposase | Addgene | 133032 |
| pCS2-Jam2a-mCherry | This manuscript | N/A |
| pCS2-Jam2a-mNeonGreen | This manuscript | N/A |
| pCS2-Jam2aΔC-mCherry | This manuscript | N/A |
| pCS2-Jam3b-mCherry | This manuscript | N/A |
| pCS2-Jam3b-mNeonGreen | This manuscript | N/A |
| pCS2-Jam3bΔC-mCherry | This manuscript | N/A |
| pCS2-Myomaker | This manuscript | N/A |
| pCS2-Myomixer | This manuscript | N/A |
| pCS2-mCherry-Myomixer | This manuscript | N/A |
| pCS2–8NmCherry | Addgene | 34936 |
| pCS2–8NmCherry-N-waspa | This study | NA |
| pCS2–8NmCherry-N-waspb | This study | NA |
| pCS2–8NmCherry-N-wasp1 | This study | NA |
| pCS2–8NmCherry-Wasf2 | This study | NA |
| pCS2–8NmCherry-Wasf3b | This study | NA |
| pminiTol2-CMV:Lifeact-mCherry | This manuscript | N/A |
| pminiTol2-CMV:Lifeact-EGFP | This manuscript | N/A |
| pminiTol2-mylpfa:H2B-EGFP | This manuscript | N/A |
| Software and algorithms | ||
| GraphPad Prism v9 | Graph Pad | N/A |
| Fiji/ImageJ | (Schindelin et al., 2012) | https://imagej.net/Fiji |
| NIS–Elements Acquisition | Nikon | https://microscope.healthcare.nikon.com/products/software/nis-elements |
| BioRender | BioRender | https://biorender.com |
| Adobe Photoshop CS6 | Adobe Photoshop | https://adobe.com/products/photoshop |
| Other | ||
| Glass-bottom petri dish (35 mm) | MatTek | P35G-1.5–14-C |
Figure 6. WAVE and WASP proteins promote myoblast fusion and F-actin foci formation.

(A) Myoblast fusion defect in wave and wasp mutant embryos. Confocal images of 48 hpf wild-type, wasf2−/−; wasf3b−/− double mutant, and n-waspa−/−; n-waspb−/−; wasp1−/− triple mutant embryos expressing a membrane-localized mRFP (cyan). Embryos were stained with Hoechst to visualize the nuclei (red). Scale bar, 25 μm.
(B) Quantification of the myoblast fusion defect in wave and wasp mutant embryos in (A). Dot plot showing the nuclei number per myofiber per embryo. The nuclei number in somites 10–12 from n=15 embryos were quantified for each genotype. The same wild-type dataset was used in Figures S5B and S5C.
(C-E) Reduced F-actin foci number in wave and wasp mutant embryos. Confocal images of 23-somite stage wild-type (C), wasf2−/−; wasf3b−/− double mutant (D), and n-waspa−/−; n-waspb−/−; wasp1−/− triple mutant (E) embryos. Arrowheads indicate a few randomly selected foci. Scale bar, 25 μm.
(F) Quantification of the F-actin foci number in wave and wasp mutant embryos. A graph showing the average foci number in each somite of fixed wild-type, wasf2−/−; wasf3b−/− double mutant and n-waspa−/−; n-waspb−/−; wasp1−/− triple mutant embryos. Data are represented as mean ± s.d. Statistical analyses were performed for the foci number in somite 9 of n=6 embryos using the unpaired parametric t test. *** p < 0.001.
(G) Quantification of the F-actin foci size in wave and wasp mutant embryos. Dot plot showing the F-actin foci size per embryo. The foci size in n=5 embryos were quantified for each genotype.
In (B) and (G), each data point represents the mean value of an embryo. Mean ± s.d. values are shown in the dot plot, and significance was determined by the unpaired parametric t test. *** p < 0.001.
See also Figures S3, S4, and S5.
We next asked whether the WAVE and WASP family proteins are required for F-actin foci formation. In the wasf2−/−; wasf3b−/− double mutant embryos, the number of F-actin foci was significantly reduced compared to that in wild-type embryos (Figures 6C, 6D and 6F). Similarly but to a less extent, the n-waspa−/−; n-waspb−/−; wasp1−/− triple mutant embryos also had fewer F-actin foci (Figures 6C, 6E and 6F). In addition, the sizes of the actin foci also decreased in wasf2−/−; wasf3b−/− double mutant (3.79 ± 0.31 μm2, 299 foci from 5 embryos) and n-waspa−/−; n-waspb−/−; wasp1−/− triple mutant (4.54 ± 0.18 μm2, 505 foci from 5 embryos) compared to those in wild-type embryos (5.63 ± 0.31 μm2, 680 foci from 5 embryos) (Figure 6G). The decrease in F-actin foci number and size correlates with the myoblast fusion defects in these mutants and demonstrates that WAVE and WASP family proteins promote F-actin foci formation at the fusogenic synapse during myoblast fusion.
Myomaker and Myomixer are not required for F-actin foci formation
To investigate whether the fusogenic proteins, Myomaker and Myomixer, are involved in F-actin foci formation, we first performed phalloidin staining in myomaker−/− and myomixer−/− mutant embryos. In both mutants, the number of actin foci in each somite was significantly increased compared to that in wild-type embryos (Figures 7A-7D). Consistent with this, live imaging experiments revealed that the actin foci persisted longer at muscle cell contact sites in myomaker−/− and myomixer−/− mutant embryos. An F-actin focus could linger for 30–107.5 min in myomaker−/− mutant (average 53.55 ± 6.60 min, 120 foci from 5 embryos), and for 30–120 min in myomixer−/− mutant (average 58.99 ± 5.96 min, 120 foci from 5 embryos) (Figure 7E), compared to 7.5–20 min in wild-type embryos (average 12.97 ± 0.90 min, 100 foci from 5 embryos). The size of the actin foci also increased, ranging from 2–24 μm2 in myomaker−/− mutant (average 8.10 ± 0.74, 120 foci from 5 embryos) and 2–25 μm2 in myomixer−/− mutant embryos (average 9.39 ± 0.69 μm2, 120 foci from 5 embryos), compared to 2–16 μm2 in wild-type embryos (average 7.16 ± 0.41 μm2, 100 foci from 5 embryos) (Figure 7F). EM analyses showed that the average number of invasive protrusions in each actin focus in myomaker−/− (3.81 ± 1.63, 41 foci from 3 embryos) and myomixer−/− (3.67 ± 1.46, 48 foci from 3 embryos) mutant embryos significantly increased compared to that in wild type embryos (2.29 ± 1.10, 31 foci from 3 embryos) (Figures 2B–2D). Moreover, in myomixer−/− mutant embryos, the maximal depth of invasion (1.63 ± 0.60 μm, 48 foci from 3 embryos) and the width of the actin structure at the base (2.25 ± 0.89 μm, 48 foci from 3 embryos) also significantly increased compared to those of wild type (1.10 ± 0.38 μm and 1.70 ± 0.89 μm, respectively; 31 foci from 3 embryos) (Figures 2E and 2F). These increases likely account for the larger foci size in myomaker−/− and myomixer−/− mutants observed by confocal microscopy.
Figure 7. Myomaker and Myomixer are not required for F-actin foci formation but converge with the F-actin foci to induce myoblast fusion.

(A-C) F-actin foci were present in myomaker−/− and myomixer−/− mutant embryos. Confocal images of 23-somite stage wild-type (A), myomaker−/− (B), and myomixer−/− (C) mutant embryos. Arrowheads indicate a few randomly selected foci. Scale bar, 25 μm.
(D) A graph showing the average F-actin foci number in each somite of fixed wild-type, myomaker−/− and myomixer−/− mutant embryos. Data are represented as mean ± s.d. Statistical analysis was performed for the foci number in somite 9 of n=6 embryos using the unpaired parametric t test. *** p < 0.001.
(E and F) Quantification of lifespan (E) and size (F) of the F-actin foci in myomaker−/− and myomixer−/− mutant embryos. The lifespan and size of the foci were recorded by live imaging. Each data point represents the mean value of an embryo. Mean ± s.d. values are shown in the dot plot, and significance was determined by the unpaired parametric t test. * p < 0.05; *** p < 0.001.
(G and H) Confocal images showing two examples of invasive F-actin foci (arrows) in myomaker−/− (G) and myomixer−/− (H) mutant embryos, respectively. Plasma membrane (green) and nuclei (green) were labelled by Lyn-EGFP and H2B-EGFP, respectively. F-actin (red) was labelled by the transgene Tg(CMV:Lifeact-mCherry). Scale bar, 10 μm.
(I) Confocal images of subcellular localization of mCherry-Myomixer in a 23-somite stage wild-type embryo. Two areas containing F-actin foci are shown. F-actin was visualized by Tg(CMV:Lifeact-EGFP), although not all muscle cells expressed Lifeact-EGFP. Arrowheads point to a few Myomixer punctae associated with the F-actin foci. Scale bar, 10 μm.
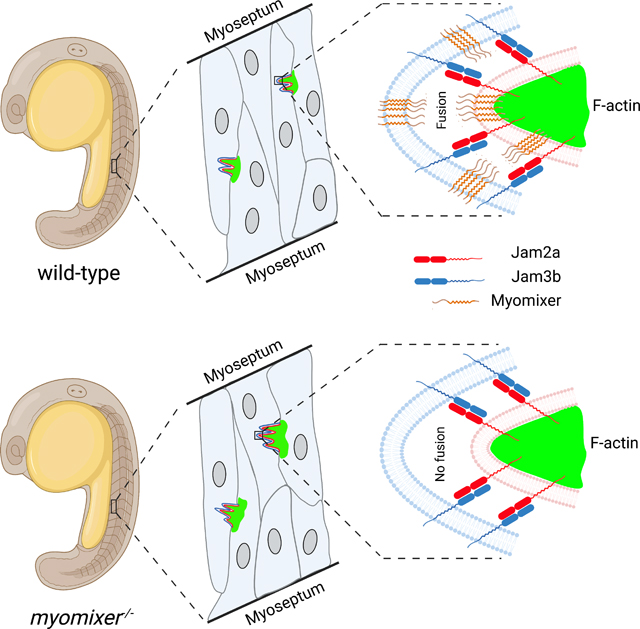
(J) A model describing the molecular and cellular events at the zebrafish fusogenic synapse. The heterophilic interactions between Jam2a and Jam3b lead to the formation of an F-actin-enriched structure organized by Jam2a. The F-actin structure propels invasive membrane protrusions into the neighboring cell to promote close plasma membrane juxtaposition, whereas the fusogenic proteins (e.g. Myomixer) form microclusters throughout the plasma membrane and in the cytosol (the latter is not depicted). The convergence between the fusogen microclusters and the invasive protrusions will lead to fusion pore formation and membrane merger.
Furthermore, live imaging experiments showed that these large invasive foci underwent dynamic shape changes and occasionally split into two halves before converging into one focus again. They also frequently moved along the muscle cell contact zone. Due to the lack of fusogen, none of these foci were able to induce fusion (Figures 7G and 7H; Videos S7 and S8). Eventually, these actin foci disappeared after the mononucleated muscle cells were fully elongated. Taken together, these data demonstrate that Myomaker and Myomixer are not required for the formation of Jam2a/3b-organized F-actin foci, but function at a later step to induce fusion pore formation.
We next asked whether Myomaker and Myomixer are localized at the fusogenic synapse. Since antibodies against these zebrafish proteins are not available, we generated fluorescently tagged Myomaker and Myomixer and tested their functions in genetic rescue experiments. Although expressing non-tagged Myomaker and Myomixer rescued the myoblast fusion defect in myomaker−/− and myomixer−/− mutant embryos, respectively (Figures S6A and S6B), we were only able to generate a functional N-terminally tagged Myomixer (mCherry-Myomixer). Expressing mCherry-Myomixer in myomixer−/− mutant embryos led to the formation of bi- and tri-nucleated fibers (2.04 ± 0.16 nuclei/fiber; n=6 embryos) (Figures S6C and S6D). Thus, this functional form of Myomixer (mCherryMyomixer) was used to examine its localization at the fusogenic synapse. As shown in Figure 7I, Myomixer was localized in a punctate pattern on the plasma membrane and in the cytosol of fast muscle cells (Figure 7I). No high level enrichment of Myomixer was observed at the fusogenic synapse, suggesting that Myomixer is not specifically recruited to the fusion sites. However, each fusion focus was associated with several small Myomixer punctae (Figure 7I), indicating that each fusion focus was able to encounter multiple Myomixer microclusters on the plasma membrane during its lifespan. Thus, the fusogenic proteins (at least Myomixer) form microdomains throughout the plasma membrane and those converging with the fusogenic synapse would likely promote fusion pore formation.
Discussion
In this study, we have uncovered the asymmetric fusogenic synapse in zebrafish myogenesis and revealed the temporal and spatial order of the molecular and cellular events during myoblast fusion. Myoblast fusion in zebrafish embryos is initiated by the heterophilic interaction of two Ig domain-containing cell adhesion molecules, Jam2a and Jam3b. Jam2a organizes the formation of the F-actin focus (fusion focus), which propels invasive membrane protrusions into the neighboring cell to promote membrane contact and juxtaposition. Subsequently, the fusogenic protein Myomixer (and likely Myomaker) converges with the invasive protrusions to induce fusion pore formation (Fig. 7J). The identification of the fusion foci allows one to precisely pinpoint the timing and sites of myoblast fusion. We found that myoblast fusion proceeds while muscle cells are in the process of elongating and that the frequency of fusion events significantly decreases after the myofibers fully attach to the myosepta and take on a parallelogram shape.
Our study has identified actin-propelled invasive protrusions as an evolutionarily conserved cellular structure that promotes myoblast fusion in vivo. Similar to the podosome-like structure that was initially identified in Drosophila myoblast fusion, each zebrafish fusion focus also contains a cluster of fingerlike protrusions projected from an F-actin-enriched base. Such a tight organization of the invasive protrusions results from localized enrichment of the cell adhesion molecules, which in turn organizes actin polymerization in a focal domain. Although the average lifespan of zebrafish fusion foci (13.0 min, this study) is similar to their Drosophila counterparts (11.9 min) (Richardson et al., 2007), the size of the zebrafish fusion foci is significantly larger (7.2 ± 1.7 μm2) than that in Drosophila (1.9 ± 0.8 μm2) (Sens et al., 2010). The difference in the actin foci size between zebrafish and Drosophila likely results from the different shape and morphology of the two fusing cells. While in Drosophila, the invading fusion-competent cell has a tear-drop shape and the actin focus is restricted within the narrow tip of the cell, the zebrafish fusion partners have elongated shapes and share a wider cell-cell contact zone. Thus, the zebrafish fusion foci are not as physically constricted as the Drosophila foci and have the space to expand laterally. These fusion foci, in turn, can mediate close membrane juxtaposition across large membranous areas, thus enhancing the possibility of fusogen engagement and fusion pore formation.
The relationship and potential coordination between the fusion foci and fusogens have been a longstanding question. Using a functional, fluorescently tagged fusion peptide Myomixer, we revealed the relative localization of Myomixer and the fusion foci. Instead of being enriched primarily at the fusogenic synapse, Myomixer is present in a punctate pattern throughout the cell membrane and the cytosol. Importantly, a few Myomixer punctae are always associated with each fusion focus, raising the possibility that membrane fusion may occur at one of these microdomains. In the absence of either Myomaker or Myomixer, the actin foci grow larger, persist longer, and dynamically move along the contact zone between two apposing cells. Although these aberrant behaviors will enhance the probability of close membrane juxtaposition, these actin foci have no fusogens to encounter and fusion does not occur in the myomaker−/− and myomixer−/− mutant embryos. Thus, although fusion foci formation and fusogen localization on the plasma membrane appear to be two independent processes in zebrafish embryos, the convergence of the fusion foci and the fusogen is a prerequisite for cell membrane merger.
Our study also revealed increasing cellular plasticity in vertebrate myoblast fusion compared to insects. Myoblast fusion in Drosophila occurs between two populations of muscle cells that are specified by different transcription factors. As a result, the two cell populations express distinct cell adhesion molecules and only the FCM-specific adhesion molecule Sns can organize the formation of the invasive F-actin structure, thus making the FCM an invading fusion partner. In contrast, the mononucleated zebrafish fast muscle cells are not specified into distinct populations and each muscle cell co-expresses the fusion-promoting cell adhesion molecules Jam2a and Jam3b (Powell and Wright, 2011). The uniform identity of the mononucleated muscle cells in zebrafish allows more plasticity during myoblast fusion than the two distinct populations of Drosophila muscle cells. For example, each zebrafish muscle cell can be either an invader or a receiver, and binucleated muscle cells can also be an invader. Such cellular plasticity creates more flexibility for pairing fusion partners and thus enhances the efficiency of myoblast fusion in a highly dynamic cellular environment such as the developing zebrafish myotome.
Interestingly, despite the overall increase in the cellular plasticity, the zebrafish has a builtin system to ensure the asymmetry at the fusogenic synapse. Once two muscle cells encounter each other during their elongation and intercalation, the potential site of fusion will be determined by Jam2a and Jam3b engagement across the two apposing membranes. Because the invasive fusion focus is primarily organized in the Jam2a-contributing cell, the apposing Jam3b-contributing cell would therefore become the receiving fusion partner. Thus, unlike in Drosophila where the identities of the two fusion partners are pre-specified, the identity of a muscle cell as an invader or a receiver in a particular fusion event in zebrafish embryos is determined via its dynamic interaction with its neighboring cell. It is conceivable that in higher vertebrates, such as in mammals, the balance between the intrinsic asymmetric determinants and cellular plasticity may shift further to the latter. Future studies are required to uncover how different species adjust this balance to achieve an optimal level of myoblast fusion during myogenesis.
It is worth noting that despite the requirement for Jam2a and Jam3b in myoblast fusion during embryogenesis, both cell adhesion molecules are no longer indispensable for myoblast fusion in post-embryonic growth, because fast muscle fibers in jam2a and jam3b mutants are multinucleated in adult fish (Hromowyk et al., 2020; Si et al., 2019). The differential requirements for Jam2a and Jam3b in myoblast fusion during embryogenesis and adult growth may be due to the different cellular dynamics within the myotomic tissue environment. During embryogenesis, the highly dynamic fast muscle cells require Jam2a and Jam3b to rapidly secure fusogenic synapses via cell adhesion, and subsequently organize the invasive actin structure to promote myoblast fusion. It is conceivable that in the adult myotome, the fully attached and aligned myofibers provide stable surfaces for fusion partners to interact, which may bypass the strong cell adhesion mediated by Jam2a and Jam3b. Future studies will be needed to reveal the mechanisms underlying myoblast fusion in adult zebrafish.
Limitations of the study
One limitation is that we used fluorescently tagged proteins to visualize the localization of Jam2a, Jam3b and Myomixer due to the lack of antibodies. Although we have demonstrated that these proteins are functional by rescue experiments, it is possible that the tagged proteins may be expressed at higher levels and in wider domains than the endogenous proteins. Another limitation is that the electron micrographs only show part of the invasive structure due to their 70 nm thickness. Thus, the number and depth of protrusions, as well as the width of the actin base, could be underestimated.
STAR★Methods
Resource availability
Lead contact
Further information and requests for resources and reagents should be directed and will be fulfilled by the lead contact, Elizabeth H. Chen (Elizabeth.Chen@UTSouthwestern.edu).
Materials availability
Unique materials generated in this study are available from the lead contact without restriction.
Data and code availability
Microscopy data reported in this paper will be shared by the lead contact upon request. This paper does not report original code.
Any additional information required to reanalyze the data reported in this paper is available from the lead contact upon request.
Experimental model and subject details
Cell culture
The Drosophila S2 cell line was a kind gift from Duojia Pan (UT Southwestern, USA). S2 cells were grown in Schneider’s Drosophila medium (Gibco) containing 10% fetal bovine serum (Gibco) at 25°C.
Zebrafish husbandry
Zebrafish work described in this manuscript has been approved and conducted under the oversight of the UT Southwestern Institutional Animal Care and Use Committee. The following mutant lines were previously described: jam2aHU3319 and jam3bsa0037 (Powell and Wright, 2011), myomakermb14 (Shi et al., 2018), and myomixersw101 (Shi et al., 2017). Embryos were raised in the E3 medium at 28.5°C. 0.00001% (wt/vol) methylene blue was added in the E3 medium to inhibit mold growth. Clutch siblings were used as controls and all embryos were maintained at 28.5°C throughout development and experiments. All zebrafish experiments were performed at the embryonic stage and therefore the sex of the organism was not yet determined.
Method details
Zebrafish genetics
All knockout lines used in this study were generated using the CRISPR/Cas9 system. To mutate the WASP and WAVE family of genes, we designed the target sequences of the sgRNAs (shown in the Key Resource Table) using ZiFiT Targeter version 4.2 (zifit.partners.org/ZiFiT/ChoiceMenu.aspx). To make the DNA template of an sgRNA, a gene-specific forward primer including the target sequence and a common reverse primer were used to generate a PCR product using the pDR274 vector as a template. The sgRNA was then synthesized with the MEGAscript T7 Transcription Kit (Invitrogen) and purified with the MEGAclear Kit (Invitrogen). Two hundred embryos were injected at the single-cell stage with a mixture of 500 ng/μl sgRNA and 1000 ng/μl Cas9 protein (PNA Bio). Ten embryos were randomly collected to evaluate the targeting efficiency by sequencing analysis (genotyping primers are shown in the Key Resource Table). Each F0 mosaic fish was outcrossed with wild type to obtain heterozygotes. Heterozygous siblings were then crossed to generate homozygous mutants. For double, triple and quadruple mutants, the corresponding single mutants were crossed to generate heterozygous fish, followed by sibling cross to generate homozygous mutant. If the homozygous mutants were not viable, homozygous mutant embryos were obtained by sibling crosses between the heterozygous lines.
To make transgenic lines, Tg(CMV:Lifeact-mCherry), Tg(CMV:Lifeact-EGFP), and Tg(mylpfa:H2B-EGFP), we co-injected the pminiTol2 plasmid carrying the appropriate transgene fused with mCherry or EGFP (25 ng/μl) and the mRNA of the Tol2 transposase (25 ng/μl; synthesized from pCS2FA-transposase, a gift from Dr. James Amatruda, Addgene plasmid #133032) into one-cell stage embryos. mCherry- or EGFP-positive embryos were selected and raised to adulthood. Founders were outcrossed to wild-type fish and mCherry- or EGFP-positive progenies were selected and raised.
Genomic DNA isolation and genotyping
Genotyping was performed using the AccuStart II PCR Genotyping Kit (Quantabio). To isolate genomic DNA from fin clip, the tissue was dissolved in 25 μl extraction reagent for 5 min at 95°C. An equal volume of stabilization buffer was added after the samples were cooled down to room temperature. The reaction mix was span at 10,000 g for 5 min, and the supernatant was stored at 4°C. To isolate DNA from paraformaldehyde-fixed embryos, the head region was amputated and lysed in 12.5 μl extraction reagent for 15 min at 95°C, followed by the addition of 12.5 μl stabilization buffer. For PCR genotyping, 2.5 μl of the genomic DNA was added to 22.5 μl PCR reaction mix. The PCR reaction consisted of initial denaturing at 94°C for 3 min, followed by 35 cycles of denaturing at 94°C for 30 s, annealing at 55°C for 30 s, and extension at 72°C for 20–30 s. All the PCR primers for genotyping are shown in the Key Resource Table.
Plasmid construction and mRNA synthesis for microinjection
For live imaging of myoblast fusion, the following plasmids were constructed: pminiTol2-CMV:Lifeact-mCherry, pminiTol2-CMV:Lifeact-EGFP, pCS2-Lyn-EGFP and pCS2-H2B-EGFP. All mRNAs used in this study were synthesized from linearized plasmids (by NotI digestion) of the corresponding pCS2 constructs using the mMESSAGE mMACHINE™ SP6 Transcription Kit (Invitrogen) and purified using the MEGAclear Kit (Invitrogen).
To visualize Jam2a (or Jam2aΔC) and Jam3b (or Jam3bΔC) in the muscle cells, pCS2-Jam2a-mCherry, pCS2-Jam2a-mNeonGreen, pCS2-Jam2aΔC-mCherry, pCS2-Jam3b-mCherry, pCS2-Jam3b-mNeonGreen, and pCS2-Jam3bΔC-mCherry were constructed. The full-length coding sequence (CDS) or C-terminal truncated form of Jam2a (and Jam3b) were amplified using 24 hpf embryonic cDNA as a template. Jam2a CDS and mCherry (or mNeonGreen), Jam3b CDS and mCherry (or mNeonGreen), Jam2aΔC (or Jam3bΔC) and mCherry were then assembled into pCS2 vector using NEBuilder HiFi DNA Assembly Master Mix (NEB). The GS linker (GSGGGGSGASG) was inserted between mCherry/mNeonGreen and the CDS of Jam2a, Jam2aΔC, Jam3b or Jam3bΔC.
To mark the muscle cell membranes, mRNA of membrane-targeted red fluorescent protein (mRFP) was synthesized from the plasmid pCS2-mRFP generously provided by Dr. Brian Ciruna. In addition, the mRNA of Lyn-mCherry was synthesized from plasmid pCS2-Lyn-mCherry.
To visualize Myomixer localization, pCS2-mCherry-Myomixer was constructed. The full-length CDS of Myomixer was amplified using 24 hpf embryonic cDNA as a template. mCherry and Myomixer CDS were then assembled into the pCS2 vector using the NEBuilder HiFi DNA Assembly Master Mix (NEB). The GS linker (GSGGGGSGASG) was inserted between mCherry and the Myomixer CDS.
Whole-mount fluorescent staining and imaging
Zebrafish whole-mount immunostaining was performed according to standard methods (Shi et al., 2017). Briefly, 48 hpf embryos were fixed with 4% PFA in PBS for 1 hour at room temperature, washed with PBST (0.1% Tween 20) 3 times for 10 min each, and treated with 2% Triton X-100 in PBS for 30 min. Nuclei were visualized by Hoechst staining (1:200 dilution; Molecular Probes) for 15 min at room temperature. Plasma membrane was visualized by the injection of 100 pg mRNA of mRFP at one-cell stage embryos. Embryos were mounted in ProLong Gold Antifade Mountant (Molecular Probes) for imaging. Confocal images were collected using a Nikon A1R confocal microscope. Images were acquired with the NIS–Elements Acquisition software and processed using Fiji ImageJ and Adobe Photoshop CS6.
To visualize the F-actin foci, 21-, 23-, and 29-somite embryos were fixed with 4% PFA in PBS for 1 hour at room temperature, washed with PBST (0.1% Tween 20) 3 times for 10 min each, and transferred to BDP (0.5% BSA, 1% DMSO, 1X PBS) for 1 hour. Whole embryos or the truck region of the embryos were stained with Alexa Fluor® 488 phalloidin (1:50 dilution in BDP; Invitrogen) for 1 hour at room temperature. Embryos were mounted in ProLong Gold Antifade Mountant (Molecular Probes). Confocal images were acquired using either a Nikon A1R or a Leica SP8 confocal microscope with the NIS–Elements Acquisition or the LAS X Life Science software. Images were processed using ImageJ and Adobe Photoshop CS6. The numbers of the F-actin foci were counted manually, and the sizes of the foci were measured using the NIS-Elements analysis software.
Rescue and overexpression experiments
To rescue the wasp mutants, 4 nl of 150 ng/μl mCherry-N-waspa mRNA alone or 4 nl of 150 ng/μl (final concentration of each) mCherry-N-waspa&mCherry-N-waspb&mCherry-Wasp1 mRNAs were injected into one-cell stage embryos from the n-waspa−/−; n-waspb+/−; wasp1−/− parents. To rescue the wave mutant, 4 nl of 200 ng/μl mCherry-Wasf2 mRNA alone or 4 nl of 200 ng/μl (final concentration of each) mCherry-Wasf2&mCherry-Wasf3b mRNAs were injected into one-cell stage embryos from the wasf3b−/−; wasf2+/− parents. In all the rescue experiments, 25 ng/μl mRFP mRNA was included in the injection mixture for cell membrane labeling.
To rescue the jam2a−/− mutant, 2 nl of 160 ng/μl Jam2a-mCherry or Jam2aΔC-mCherry mRNA was injected into one-cell stage jam2a−/− mutant embryos. To rescue the jam3b−/− mutant, 2 nl of 160 ng/μl Jam3b-mCherry or Jam3bΔC-mCherry mRNA was injected into one-cell stage jam3b−/− mutant embryos. The same mRNAs were injected into one-cell stage wild-type embryos to assess the overexpression phenotype.
To rescue the myomixer−/− mutant, 2 nl of 160 ng/μl Myomixer or mCherry-Myomixer mRNA was injected into one-cell stage embryos from myomixer+/− parents. To rescue the myomaker−/− mutant, 2 nl of 160 ng/μl Myomaker mRNA was injected into one-cell stage embryos from myomaker+/− parents. In the above rescue experiments, 75 ng/μl Lyn-mCherry mRNA was included in the injection mixture for cell membrane labeling.
Time-lapse imaging
21-somite stage embryos were manually dechorionated, anesthetized with Tricaine (0.2 mg/mL; Sigma-Aldrich), and mounted onto 35 mm glass-bottom petri dishes (MatTek) with 0.3% low melting agarose (Invitrogen) dissolved in embryo medium. Somite 14 to 19 of the mounted embryos were imaged on a Leica SP8 confocal microscope using a 40x oil-immersion objective at 2.5 min intervals. The sizes of the F-actin foci were measured using Fiji Image J software (https://imagej.net/Fiji).
S2 cell transfection and aggregation assay
S2 cells were grown in Schneider’s Drosophila medium (Gibco) containing 10% fetal bovine serum (Gibco) and transfected using Effectene (Qiagen) according to the manufacturer’s instructions. C-terminal mCherry or mNeonGreen tagged full-length or truncated Jam2a and Jam3b were subcloned into the pAc-V5His expression vectors for transfection (Invitrogen). Cell aggregation assays were performed as described (Bieber, 1994) with modifications. In brief, S2 cells were divided into two groups, with one group transfected with a construct carrying an mCherry-tagged gene and the other with a construct carrying an mNeonGreen-tagged gene. The two groups of cells were incubated separately for 24 hours for protein expression. Then the cells were dissociated by repeated pipetting and the percentage of transfected cells was calculated for each group using a hemocytometer and immunofluorescent microscopy. Similar numbers of mCherry- and mNeonGreen-positive cells from the two groups were mixed to reach 1×10⁶ total cells per ml and agitated at 100 RPM at 25°C for 16 h. Cell aggregates were visualized and photographed on a Leica SP8 confocal microscope. The aggregation efficiency was calculated as the percentage of mCherry-positive cells within bi-color cell aggregates (containing three or more cells) versus the total number of mCherry-positive cells. Thirty random 20x microscopic fields were analyzed in three independent experiments.
Electron microscopy
Zebrafish embryos were fixed with a solution containing 3% paraformaldehyde, 2% glutaraldehyde, 1% sucrose, 3 mM CaCl2 in 0.1 M sodium cacodylate buffer (~pH 7.4) at 4°C overnight. On day two, samples were washed with 0.1 M cacodylate buffer containing 3% sucrose and 3 mM CaCl2, and post fixation was performed with 1% osmium tetroxide in 0.1 M sodium cacodylate buffer for 1.5 hours on ice. Embryos were stained with 2% uranyl acetate (0.22 μm filtered), dehydrated, and embedded in EPON. Resin-embedded samples were cut into 70-nm thick sections using Leica ultramicrotome (UC6) and collected on Copper slot grids. These sections were post-stained with 2% uranyl acetate and Reynold’s lead solution and examined using a JEOL 1400 transmission electron microscope.
Generation of schematics
All schematic diagrams were created with BioRender.com (https://biorender.com/).
Quantification and Statistical analysis
All dot plots and graphs were generated using the Prism 9 software (GraphPad Software, La Jolla, CA). Each data point represents the mean value per embryo. Data are represented as mean ± s.d. Unpaired two-tailed parametric t-tests were performed to determine whether differences between two groups were statistically significant. * p < 0.05; ** p < 0.01; *** p < 0.001.
Supplementary Material
Plasma membrane and nuclei were labelled with Lyn-EGFP (green) and H2B-EGFP (green), and F-actin (red) was labelled with the transgene Tg(CMV:Lifeact-mCherry). Embryos were images at 21–24 somite stage with a time interval of 2.5 min.
Video S1. Related to Figure 1. Muscle development in somites 14–18. Note the dynamic changes in the actin cytoskeleton associated with myoblast fusion events. As the multinucleated muscle cells attached to the myosepta on both ends and became parallelogram shaped, the dynamic rearrangements of the actin cytoskeleton significantly decreased along the muscle fibers.
Video S2. Related to Figure 1D. A myoblast fusion event showing the fusion of two mononucleated myoblasts (a and b). Selected stills are shown in Figure 1D.
Video S3. Related to Figure 3A. Two sequential myoblast fusion events showing that the same myoblast (b) could be both a receiving cell for (a) and an invading cell for (c). Selected stills are shown in Figure 3A.
Video S4. Related to Figure 3B. A myoblast fusion event showing that a cell (ab) started off as an invading cell but later reversed to be a receiving cell. Selected stills are shown in Figure 3B.
Video S5: Related to Figure 3C. A myoblast fusion event showing a binucleated muscle cell (ab) invading a mononucleated myoblast (c). Selected stills are shown in Figure 3C.
Video S6. Related to Figure 3D. Two myoblast fusion events in which two myoblasts (a and c) invaded the same receiving cell (b). Selected stills are shown in Figure 3D.
Plasma membrane and nuclei were labelled with Lyn-EGFP (green) and H2B-EGFP (green). F-actin (red) was labelled with the transgene Tg(CMV:Lifeact-mCherry). Embryos were images at 21–24 somite stage with a time interval of 2.5 min.
Video S7. An F-actin focus in myomaker−/− mutant. Related to Figure 7G. Note the dynamic shape and size changes of the F-actin focus as it moved along the cell-cell dynamic shape and size changes of the F-actin focus as it moved along the cell-cell contact zone. The F-actin focus persisted for 90 min (36 frames).
Video S8. An F-actin focus in myomixer−/− mutant. Related to Figure 7H. Note the dynamic shape and size changes of the F-actin focus as it moved along the cell-cell contact zone. The F-actin focus persisted for 105 min (42 frames).
Highlights.
Zebrafish myoblast fusion is mediated by an F-actin-enriched invasive structure
Cell adhesion molecules organize the formation of the invasive structure
WASP and WAVE proteins promote actin polymerization within the invasive structure
Fusogens converge with the invasive protrusions to initiate cell membrane fusion
Acknowledgements
We thank Dr. Gavin Wright for the jam2a and jam3b mutants; Dr. Brian Ciruna for the membrane-localized GFP and RFP constructs; Drs. Benjamin Ravaux, Bo-Jui Chang and Reto Fiolka for helping with live imaging studies; Drs. James Amatruda and Xiaoying Bai for sharing the zebrafish facility; and the UT Southwestern Animal Resource Center for maintaining the zebrafish facility. EM imaging experiments were supported in part by an NIH grant (1S10OD021685-01A1). This work was supported by NIH grants (R01AR075005, R01AR053173, and R35GM136316) to E.H.C.
Footnotes
Competing Interests
The authors declare no competing interests.
Publisher's Disclaimer: This is a PDF file of an unedited manuscript that has been accepted for publication. As a service to our customers we are providing this early version of the manuscript. The manuscript will undergo copyediting, typesetting, and review of the resulting proof before it is published in its final form. Please note that during the production process errors may be discovered which could affect the content, and all legal disclaimers that apply to the journal pertain.
References
- Abmayr SM, Balagopalan L, Galletta BJ, and Hong SJ (2003). Cell and molecular biology of myoblast fusion. Int. Rev. Cytol 225, 33–89. [DOI] [PubMed] [Google Scholar]
- Aguilar PS, Baylies MK, Fleissner A, Helming L, Inoue N, Podbilewicz B, Wang H, and Wong M. (2013). Genetic basis of cell-cell fusion mechanisms. Trends Genet. 29, 427–437. [DOI] [PMC free article] [PubMed] [Google Scholar]
- Artero RD, Castanon I, and Baylies MK (2001). The immunoglobulin-like protein Hibris functions as a dose-dependent regulator of myoblast fusion and is differentially controlled by Ras and Notch signaling. Development 128, 4251–4264. [DOI] [PubMed] [Google Scholar]
- Baas D., Caussanel-Boude S., Guiraud A., Calhabeu F., Delaune E., Pilot F., Chopin E., Machuca-Gayet I., Vernay A., Bertrand S., et al. (2012). CKIP-1 regulates mammalian and zebrafish myoblast fusion. J. Cell Sci 125, 3790–3800. [DOI] [PubMed] [Google Scholar]
- Bi P, Ramirez-Martinez A, Li H, Cannavino J, McAnally JR, Shelton JM, Sanchez-Ortiz E, Bassel-Duby R, and Olson EN (2017). Control of muscle formation by the fusogenic micropeptide myomixer. Science 356, 323–327. [DOI] [PMC free article] [PubMed] [Google Scholar]
- Bieber AJ (1994). Analysis of cellular adhesion in cultured cells. Methods. Cell Biol 44, 683–696. [DOI] [PubMed] [Google Scholar]
- Bielczyk-Maczyńska E, Serbanovic-Canic J, Ferreira L, Soranzo N, Stemple DL, Ouwehand WH, and Cvejic A. (2014). A Loss of Function Screen of Identified Genome-Wide Association Study Loci Reveals New Genes Controlling Hematopoiesis. PLoS Genet. 10, e1004450. [DOI] [PMC free article] [PubMed] [Google Scholar]
- Bour BA, Chakravarti M, West JM, and Abmayr SM (2000). Drosophila SNS, a member of the immunoglobulin superfamily that is essential for myoblast fusion. Genes Dev. 14, 1498–1511. [PMC free article] [PubMed] [Google Scholar]
- Brukman NG, Uygur B, Podbilewicz B, and Chernomordik LV (2019). How cells fuse. J Cell Biol 218, 1436–1451. [DOI] [PMC free article] [PubMed] [Google Scholar]
- Chen EH (2011). Invasive podosomes and myoblast fusion. Curr. Top. Membr 68, 235–258. [DOI] [PMC free article] [PubMed] [Google Scholar]
- Chen EH, Grote E, Mohler W, and Vignery A. (2007). Cell-cell fusion. FEBS Lett. 581, 2181–2193. [DOI] [PubMed] [Google Scholar]
- Chen EH, and Olson EN (2004). Towards a molecular pathway for myoblast fusion in Drosophila. Trends Cell Biol. 14, 452–460. [DOI] [PubMed] [Google Scholar]
- Chen EH, and Olson EN (2005). Unveiling the mechanisms of cell-cell fusion. Science 308, 369–373. [DOI] [PubMed] [Google Scholar]
- Cortes F., Daggett D., Bryson-Richardson RJ., Neyt C., Maule J., Gautier P., Hollway GE., Keenan D., and Currie PD. (2003). Cadherin-mediated differential cell adhesion controls slow muscle cell migration in the developing zebrafish myotome. Dev. Cell 5, 865–876. [DOI] [PubMed] [Google Scholar]
- Cvejic A, Hall C, Bak-Maier M, Flores MV, Crosier P, Redd MJ, and Martin P. (2008). Analysis of WASp function during the wound inflammatory response--live-imaging studies in zebrafish larvae. J. Cell Sci 121, 3196–3206. [DOI] [PubMed] [Google Scholar]
- Daggett DF, Domingo CR, Currie PD, and Amacher SL (2007). Control of morphogenetic cell movements in the early zebrafish myotome. Dev. Biol 309, 169–179. [DOI] [PMC free article] [PubMed] [Google Scholar]
- Deng S, Azevedo M, and Baylies M. (2017). Acting on identity: Myoblast fusion and the formation of the syncytial muscle fiber. Semin. Cell Dev. Biol 72, 45–55. [DOI] [PMC free article] [PubMed] [Google Scholar]
- Devoto SH, Melancon E, Eisen JS, and Westerfield M. (1996). Identification of separate slow and fast muscle precursor cells in vivo, prior to somite formation. Development 122, 3371–3380. [DOI] [PubMed] [Google Scholar]
- Di Gioia SA., Connors S., Matsunami N., Cannavino J., Rose MF., Gilette NM., Artoni P., de Macena Sobreira NL., Chan WM., Webb BD., et al. (2017). A defect in myoblast fusion underlies Carey-Fineman-Ziter syndrome. Nat. Commun 8, 16077. [DOI] [PMC free article] [PubMed] [Google Scholar]
- Duan R, Jin P, Luo F, Zhang G, Anderson N, and Chen EH (2012). Group I PAKs function downstream of Rac to promote podosome invasion during myoblast fusion in vivo. J. Cell Biol 199, 169–185. [DOI] [PMC free article] [PubMed] [Google Scholar]
- Duan R, Kim JH, Shilagardi K, Schiffhauer ES, Lee DM, Son S, Li S, Thomas C, Luo T, Fletcher DA, et al. (2018). Spectrin is a mechanoresponsive protein shaping fusogenic synapse architecture during myoblast fusion. Nat. Cell Biol 20, 688–698. [DOI] [PMC free article] [PubMed] [Google Scholar]
- Dworak HA, Charles MA, Pellerano LB, and Sink H. (2001). Characterization of Drosophila hibris, a gene related to human nephrin. Development 128, 4265–4276. [DOI] [PubMed] [Google Scholar]
- Edwards JJ, Rouillard AD, Fernandez NF, Wang Z, Lachmann A, Shankaran SS, Bisgrove BW, Demarest B, Turan N, Srivastava D, et al. (2020). Systems Analysis Implicates WAVE2 Complex in the Pathogenesis of Developmental Left-Sided Obstructive Heart Defects. JACC Basic Transl. Sci 5, 376–386. [DOI] [PMC free article] [PubMed] [Google Scholar]
- Ganassi M, Badodi S, Ortuste Quiroga HP, Zammit PS, Hinits Y, and Hughes SM (2018). Myogenin promotes myocyte fusion to balance fibre number and size. Nat. Commun 9, 4232. [DOI] [PMC free article] [PubMed] [Google Scholar]
- Henry CA, and Amacher SL (2004). Zebrafish slow muscle cell migration induces a wave of fast muscle morphogenesis. Dev. Cell 7, 917–923. [DOI] [PubMed] [Google Scholar]
- Hromowyk KJ, Talbot JC, Martin BL, Janssen PML, and Amacher SL (2020). Cell fusion is differentially regulated in zebrafish post-embryonic slow and fast muscle. Dev. Biol 462, 85–100. [DOI] [PMC free article] [PubMed] [Google Scholar]
- Jin P, Duan R, Luo F, Zhang G, Hong SN, and Chen EH (2011). Competition between Blown Fuse and WASP for WIP Binding Regulates the Dynamics of WASP-Dependent Actin Polymerization In Vivo. Dev. Cell 20, 623–638. [DOI] [PMC free article] [PubMed] [Google Scholar]
- Jones RA., Feng Y., Worth AJ., Thrasher AJ., Burns SO., and Martin P. (2013). Modelling of human Wiskott-Aldrich syndrome protein mutants in zebrafish larvae using in vivo live imaging. J. Cell Sci 126, 4077–4084. [DOI] [PMC free article] [PubMed] [Google Scholar]
- Keenan SR, and Currie PD (2019). The Developmental Phases of Zebrafish Myogenesis. J. Dev. Biol 7, 12. [DOI] [PMC free article] [PubMed] [Google Scholar]
- Kim JH, Jin P, Duan R, and Chen EH (2015a). Mechanisms of myoblast fusion during muscle development. Curr. Opin. Genet. Dev 32, 162–170. [DOI] [PMC free article] [PubMed] [Google Scholar]
- Kim JH, Ren Y, Ng WP, Li S, Son S, Kee YS, Zhang S, Zhang G, Fletcher DA, Robinson DN, et al. (2015b). Mechanical tension drives cell membrane fusion. Dev. Cell 32, 561–573. [DOI] [PMC free article] [PubMed] [Google Scholar]
- Kim S, Shilagardi K, Zhang S, Hong SN, Sens KL, Bo J, Gonzalez GA, and Chen EH (2007). A critical function for the actin cytoskeleton in targeted exocytosis of prefusion vesicles during myoblast fusion. Dev. Cell 12, 571–586. [DOI] [PubMed] [Google Scholar]
- Lee DM, and Chen EH (2019). Drosophila Myoblast Fusion: Invasion and Resistance for the Ultimate Union. Annu. Rev. Genet 53, 67–91. [DOI] [PMC free article] [PubMed] [Google Scholar]
- Leikina E, Gamage DG, Prasad V, Goykhberg J, Crowe M, Diao J, Kozlov MM, Chernomordik LV, and Millay DP (2018). Myomaker and Myomerger Work Independently to Control Distinct Steps of Membrane Remodeling during Myoblast Fusion. Dev. Cell 46, 767–780. [DOI] [PMC free article] [PubMed] [Google Scholar]
- Massarwa R, Carmon S, Shilo BZ, and Schejter ED (2007). WIP/WASp-based actin-polymerization machinery is essential for myoblast fusion in Drosophila. Dev. Cell 12, 557–569. [DOI] [PubMed] [Google Scholar]
- Millay DP (2022). Regulation of the myoblast fusion reaction for muscle development, regeneration, and adaptations. Exp Cell Res 415, 113134. [DOI] [PMC free article] [PubMed] [Google Scholar]
- Millay DP, O’Rourke JR, Sutherland LB, Bezprozvannaya S, Shelton JM, Bassel-Duby R, and Olson EN (2013). Myomaker is a membrane activator of myoblast fusion and muscle formation. Nature 499, 301–305. [DOI] [PMC free article] [PubMed] [Google Scholar]
- Moore CA., Parkin CA., Bidet Y., and Ingham PW. (2007). A role for the Myoblast city homologues Dock1 and Dock5 and the adaptor proteins Crk and Crk-like in zebrafish myoblast fusion. Development 134, 3145–3153. [DOI] [PubMed] [Google Scholar]
- Powell GT, and Wright GJ (2011). Jamb and Jamc are essential for vertebrate myocyte fusion. PLoS Biol. 9, e1001216. [DOI] [PMC free article] [PubMed] [Google Scholar]
- Quinn ME, Goh Q, Kurosaka M, Gamage DG, Petrany MJ, Prasad V, and Millay DP (2017). Myomerger induces fusion of non-fusogenic cells and is required for skeletal muscle development. Nat. Commun 8, 15665. [DOI] [PMC free article] [PubMed] [Google Scholar]
- Richardson B, Beckett K, and Baylies M. (2008). Visualizing new dimensions in Drosophila myoblast fusion. Bioessays 30, 423–431. [DOI] [PMC free article] [PubMed] [Google Scholar]
- Richardson BE, Beckett K, Nowak SJ, and Baylies MK (2007). SCAR/WAVE and Arp2/3 are crucial for cytoskeletal remodeling at the site of myoblast fusion. Development 134, 4357–4367. [DOI] [PMC free article] [PubMed] [Google Scholar]
- Roy S, Wolff C, and Ingham PW (2001). The u-boot mutation identifies a Hedgehog-regulated myogenic switch for fiber-type diversification in the zebrafish embryo. Genes Dev. 15, 1563–1576. [DOI] [PMC free article] [PubMed] [Google Scholar]
- Ruiz-Gomez M, Coutts N, Price A, Taylor MV, and Bate M. (2000). Drosophila dumbfounded: a myoblast attractant essential for fusion. Cell 102, 189–198. [DOI] [PubMed] [Google Scholar]
- Schafer G, Weber S, Holz A, Bogdan S, Schumacher S, Muller A, Renkawitz-Pohl R, and Onel SF (2007). The Wiskott-Aldrich syndrome protein (WASP) is essential for myoblast fusion in Drosophila. Dev. Biol 304, 664–674. [DOI] [PubMed] [Google Scholar]
- Schejter ED (2016). Myoblast fusion: Experimental systems and cellular mechanisms. Semin. Cell Dev. Biol 60, 112–120. [DOI] [PubMed] [Google Scholar]
- Sens KL., Zhang S., Jin P., Duan R., Zhang G., Luo F., Parachini L., and Chen EH. (2010). An invasive podosome-like structure promotes fusion pore formation during myoblast fusion. J. Cell Biol 191, 1013–1027. [DOI] [PMC free article] [PubMed] [Google Scholar]
- Shelton C, Kocherlakota KS, Zhuang S, and Abmayr SM (2009). The immunoglobulin superfamily member Hbs functions redundantly with Sns in interactions between founder and fusion-competent myoblasts. Development 136, 1159–1168. [DOI] [PMC free article] [PubMed] [Google Scholar]
- Shi J, Bi P, Pei J, Li H, Grishin NV, Bassel-Duby R, Chen EH, and Olson EN (2017). Requirement of the fusogenic micropeptide myomixer for muscle formation in zebrafish. Proc. Natl. Acad. Sci. USA 114, 11950–11955. [DOI] [PMC free article] [PubMed] [Google Scholar]
- Shi J, Cai M, Si Y, Zhang J, and Du S. (2018). Knockout of myomaker results in defective myoblast fusion, reduced muscle growth and increased adipocyte infiltration in zebrafish skeletal muscle. Hum. Mol. Genet 27, 3542–3554. [DOI] [PubMed] [Google Scholar]
- Shilagardi K, Li S, Luo F, Marikar F, Duan R, Jin P, Kim JH, Murnen K, and Chen EH (2013). Actin-propelled invasive membrane protrusions promote fusogenic protein engagement during cell-cell fusion. Science 340, 359–363. [DOI] [PMC free article] [PubMed] [Google Scholar]
- Si Y., Wen H., and Du S. (2019). Genetic Mutations in jamb, jamc, and myomaker Revealed Different Roles on Myoblast Fusion and Muscle Growth. Mar. Biotechnol 21, 111–123. [DOI] [PMC free article] [PubMed] [Google Scholar]
- Snow CJ, Goody M, Kelly MW, Oster EC, Jones R, Khalil A, and Henry CA (2008). Time-Lapse Analysis and Mathematical Characterization Elucidate Novel Mechanisms Underlying Muscle Morphogenesis. PLoS Genet. 4, e1000219. [DOI] [PMC free article] [PubMed] [Google Scholar]
- Sohn RL, Huang P, Kawahara G, Mitchell M, Guyon J, Kalluri R, Kunkel LM, and Gussoni E. (2009). A role for nephrin, a renal protein, in vertebrate skeletal muscle cell fusion. Proc. Natl. Acad. Sci. USA 106, 9274–9279. [DOI] [PMC free article] [PubMed] [Google Scholar]
- Srinivas BP, Woo J, Leong WY, and Roy S. (2007). A conserved molecular pathway mediates myoblast fusion in insects and vertebrates. Nat. Genet 39, 781–786. [DOI] [PubMed] [Google Scholar]
- Stickney HL, Barresi MJ, and Devoto SH (2000). Somite development in zebrafish. Dev. Dyn 219, 287–303. [DOI] [PubMed] [Google Scholar]
- Strunkelnberg M, Bonengel B, Moda LM, Hertenstein A, de Couet HG, Ramos RG, and Fischbach KF (2001). rst and its paralogue kirre act redundantly during embryonic muscle development in Drosophila. Development 128, 4229–39. [DOI] [PubMed] [Google Scholar]
- Yin J, Lee R, Ono Y, Ingham PW, and Saunders TE (2018). Spatiotemporal Coordination of FGF and Shh Signaling Underlies the Specification of Myoblasts in the Zebrafish Embryo. Dev. Cell 46, 735–750. [DOI] [PubMed] [Google Scholar]
- Zhang Q, Vashisht AA, O’Rourke J, Corbel SY, Moran R, Romero A, Miraglia L, Zhang J, Durrant E, Schmedt C, et al. (2017). The microprotein Minion controls cell fusion and muscle formation. Nat. Commun 8, 15664. [DOI] [PMC free article] [PubMed] [Google Scholar]
- Zhang R., Lee DM., Jimah JR., Gerassimov N., Yang C., Kim S., Luvsanjav D., Winkelman J., Mettlen M., Abrams ME., et al. (2020). Dynamin regulates the dynamics and mechanical strength of the actin cytoskeleton as a multifilament actin-bundling protein. Nat. Cell Biol 22, 674–688. [DOI] [PMC free article] [PubMed] [Google Scholar]
- Zhang W, and Roy S. (2016). The zebrafish fast myosin light chain mylpfa:H2B-GFP transgene is a useful tool for in vivo imaging of myocyte fusion in the vertebrate embryo. Gene Expr. Patterns 20, 106–110. [DOI] [PubMed] [Google Scholar]
- Zhang W, and Roy S. (2017). Myomaker is required for the fusion of fast-twitch myocytes in the zebrafish embryo. Dev. Biol 423, 24–33. [DOI] [PubMed] [Google Scholar]
Associated Data
This section collects any data citations, data availability statements, or supplementary materials included in this article.
Supplementary Materials
Plasma membrane and nuclei were labelled with Lyn-EGFP (green) and H2B-EGFP (green), and F-actin (red) was labelled with the transgene Tg(CMV:Lifeact-mCherry). Embryos were images at 21–24 somite stage with a time interval of 2.5 min.
Video S1. Related to Figure 1. Muscle development in somites 14–18. Note the dynamic changes in the actin cytoskeleton associated with myoblast fusion events. As the multinucleated muscle cells attached to the myosepta on both ends and became parallelogram shaped, the dynamic rearrangements of the actin cytoskeleton significantly decreased along the muscle fibers.
Video S2. Related to Figure 1D. A myoblast fusion event showing the fusion of two mononucleated myoblasts (a and b). Selected stills are shown in Figure 1D.
Video S3. Related to Figure 3A. Two sequential myoblast fusion events showing that the same myoblast (b) could be both a receiving cell for (a) and an invading cell for (c). Selected stills are shown in Figure 3A.
Video S4. Related to Figure 3B. A myoblast fusion event showing that a cell (ab) started off as an invading cell but later reversed to be a receiving cell. Selected stills are shown in Figure 3B.
Video S5: Related to Figure 3C. A myoblast fusion event showing a binucleated muscle cell (ab) invading a mononucleated myoblast (c). Selected stills are shown in Figure 3C.
Video S6. Related to Figure 3D. Two myoblast fusion events in which two myoblasts (a and c) invaded the same receiving cell (b). Selected stills are shown in Figure 3D.
Plasma membrane and nuclei were labelled with Lyn-EGFP (green) and H2B-EGFP (green). F-actin (red) was labelled with the transgene Tg(CMV:Lifeact-mCherry). Embryos were images at 21–24 somite stage with a time interval of 2.5 min.
Video S7. An F-actin focus in myomaker−/− mutant. Related to Figure 7G. Note the dynamic shape and size changes of the F-actin focus as it moved along the cell-cell dynamic shape and size changes of the F-actin focus as it moved along the cell-cell contact zone. The F-actin focus persisted for 90 min (36 frames).
Video S8. An F-actin focus in myomixer−/− mutant. Related to Figure 7H. Note the dynamic shape and size changes of the F-actin focus as it moved along the cell-cell contact zone. The F-actin focus persisted for 105 min (42 frames).
Data Availability Statement
Microscopy data reported in this paper will be shared by the lead contact upon request. This paper does not report original code.
Any additional information required to reanalyze the data reported in this paper is available from the lead contact upon request.