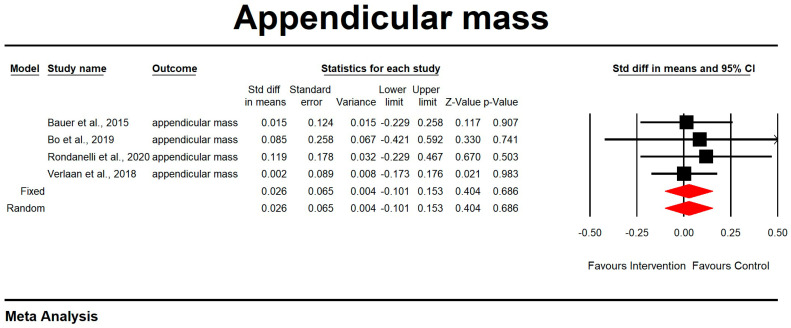
Figure 2.
The effect size for appendicular muscle mass rate when using whey protein intake vs. placebo. Q = 0.409, df (Q) = 3, p = 0.938, and I squared = 0.000. Black squares depict each study effect size; red diamonds represent merged effect sizes calculated in mixed and random models [24,27,32,33].

