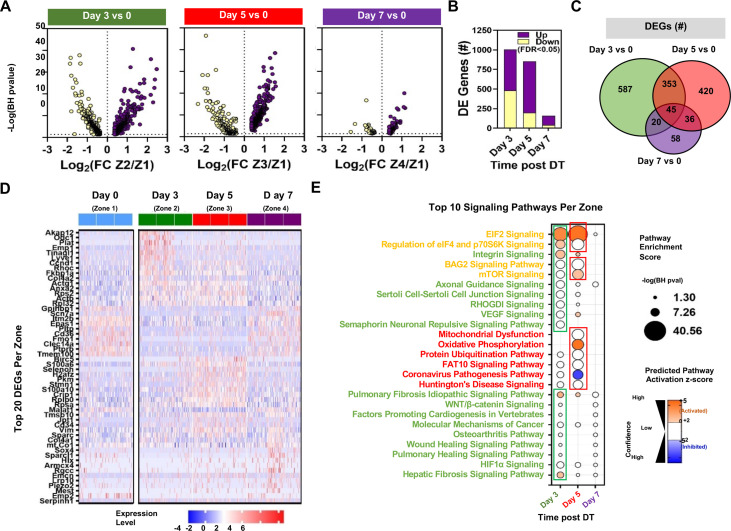
Figure 8. Differential expression and pathway enrichment analysis of time-dependent changes in Zones 1–4 of endothelial Cluster 1.
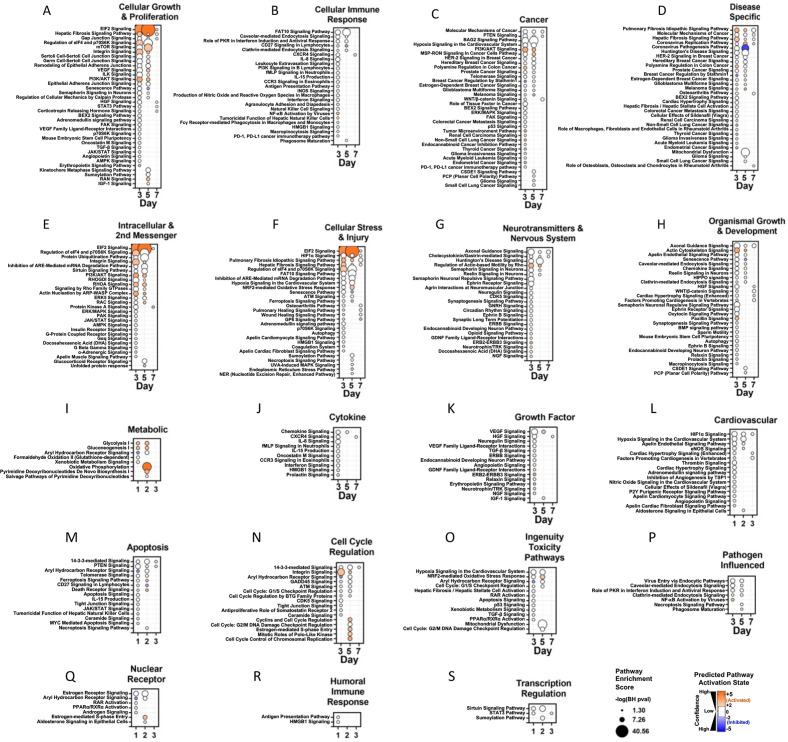
(A) Volcano plots showing the distribution of differentially expressed genes according to statistical significance, magnitude, and direction of fold change (FC) at different points following administration of diphtheria toxin (DT) in mice. Only genes that passed the false discovery rate (FDR) threshold <0.05 are shown (i.e. Enrichment score –log(BH p-value)>1.3). Zones 1, 2, 3, and 4 denote day 0, day 3, day 5, and day 7, respectively. (B) Summary of the number of differentially expressed (DE) genes in each comparison. Purple and yellow bars are stacked to show the proportion of genes that were upregulated and downregulated, respectively. (C) Venn diagram shows the degree of overlap in the identity of differentially expressed genes for each comparison. (D) Heatmap shows expression levels of 54 genes representing the top 20 differentially expressed genes at days 3, 5, and 7 versus day 0. Expression levels (z-score of log-transformed normalized counts) are shown for a sample of 50 cells from each mouse (n=3 mice/time point). (E) Pathway enrichment analysis using DE gene sets from panel B with Ingenuity Pathway Analysis. The top 10 signaling pathways (by enrichment score) are shown for each time zone. Circle size denotes the pathway enrichment score based on the Benjamini-Hochberg (BH) corrected p-value. A minimum score of 1.3 (i.e. FDR <0.05) was used as an inclusion threshold. Z-score color denotes the predicted activation state of the pathway based on the degree of matching between the expected and observed pattern of gene expression changes. Only pathways with z-score >+2 (activated) or <−2 (inhibited) are shown in color to highlight confident predictions. White circles denote pathways in which the activation state cannot be confidently predicted. The identities of all significantly enriched canonical pathways in Zones 1–4 of Cluster 1 are presented in Figure 8—figure supplement 1 with additional details in Figure 8—figure supplement 2.


