

Abstract
Background
Carfilzomib is an irreversible second-generation proteasome inhibitor that has a short elimination half-life but much longer pharmacodynamic (PD) effect based on its irreversible mechanism of action, making it amenable to longer dosing intervals. A mechanistic pharmacokinetic/pharmacodynamic (PK/PD) model was built using a bottom-up approach, based on the mechanism of action of carfilzomib and the biology of the proteasome, to provide further evidence of the comparability of once-weekly and twice-weekly dosing.
Methods
The model was qualified using clinical data from the phase III ENDEAVOR study, where the safety and efficacy of bortezomib (a reversible proteasome inhibitor) and carfilzomib were compared. Simulations were performed to compare the average proteasome inhibition across five cycles of treatment for the 20/70 mg/m2 once-weekly (70 QW) and 20/56 mg/m2 twice-weekly (56 BIW) regimens.
Results
Results indicated that while 70 QW had a higher maximum concentration (Cmax) and lower steady-state area under the concentration-time curve (AUC) than 56 BIW, the average proteasome inhibition after five cycles of treatment between the regimens was comparable. Presumably, the higher Cmax of carfilzomib from 70 QW compensates for the lower overall AUC compared with 56 BIW, and hence 70 QW is expected to have comparable proteasome inhibition, and therefore comparable efficacy, to 56 BIW. The comparable model-predicted proteasome inhibition between 70 QW and 56 BIW also translated to comparable clinical response, in terms of overall response rate and progression-free survival.
Conclusion
This work provides a framework for which mechanistic PK/PD modeling can be used to guide optimization of dosing intervals for therapeutics with significantly longer PD effects than PK, and help further justify patient-convenient, longer dosing intervals.
Supplementary Information
The online version contains supplementary material available at 10.1007/s40262-023-01242-6.
Key Points
| Carfilzomib is a second-generation, irreversible proteasome inhibitor approved to be administered once- or twice-weekly for the treatment of relapsed or refractory multiple myeloma (RRMM). |
| Based on the nuances of the mechanism of action of carfilzomib, together with the target enzyme biology and proteasome turnover, a bottom-up mechanistic pharmacokinetic/pharmacodynamic (PK/PD) model was built to predict proteasome inhibition, resultant M-protein decrease, and patient response following once- or twice-weekly administration of carfilzomib in RRMM patients. |
| The model predicted comparable proteasome inhibition between the once- and twice-weekly regimens, which were also consistent with the observed comparable rates of M-protein decline and clinical response. |
| This work provides a framework for the use of mechanistic PK/PD modeling to help guide optimization of longer dosing intervals for therapeutics with significantly longer PD effects than PK. |
Introduction
Multiple myeloma is the second most common hematologic malignancy and is characterized by the clonal expansion of plasma cells in the bone marrow. These malignant plasma cells generate and secrete large amounts of monoclonal proteins, also referred to as M proteins, and as such are reliant on the ubiquitin-proteasome system for continued cell growth and proliferation [1, 2]. For these reasons, M protein detection in serum and urine are often used in the diagnosis of multiple myeloma and in the assessment of treatment response [3]. Additionally, the reliance of these malignant plasma cells on the ubiquitin-proteasome system for protein degradation provides a suitable target for a class of drugs known as proteasome inhibitors.
Carfilzomib, a tetrapeptide epoxyketone, is a second-generation proteasome inhibitor indicated in the US for the treatment of adult patients with relapsed or refractory multiple myeloma as a single agent in those who have received one or more prior lines of therapy, or in combination with lenalidomide (KRd), dexamethasone alone (Kd), or daratumumab and dexamethasone (DKd) in those who have received one to three lines of therapy [4]. Carfilzomib is administered intravenously, and the recommended dosage and infusion length varies based on the dose of the prescribed combination. In the first week of treatment initiation, 20 mg/m2 intravenous carfilzomib is administered on day 1 of the first 28-day treatment cycle for once-weekly (QW) regimens, with an additional 20 mg/m2 intravenous dose on day 2 for twice-weekly (BIW) dosing regimens. Following the first week, 70 mg/m2 intravenous carfilzomib may be administered on days 8 and 15 for QW regimens (30-min infusion), while 27 (10-min infusion) or 56 (30-min infusion) mg/m2 intravenous carfilzomib may be administered on days 8, 9, 15, and 16 for BIW regimens. From the second treatment cycle onwards, carfilzomib may be administered at the planned target dose for all dosing days (i.e., 70 mg/m2 intravenous carfilzomib on days 1, 8 and 15 for QW regimens; 27 or 56 mg/m2 intravenous carfilzomib on days 1, 2, 8, 9, 15 and 16 for BIW regimens).
Carfilzomib is highly selective and binds irreversibly and preferentially to the chymotrypsin-like (CT-L) activity of the 20S proteasome, relative to the trypsin-like (T-L) and caspase-like (C-L) proteasome activities. The 20S proteasome exists in two forms: the constitutive proteasome, expressed ubiquitously throughout the body, and the immunoproteasome, expressed primarily in hematopoietic cells or in cytokine-exposed nonhematopoietic cells [5–7]. The three different catalytic activities of the constitutive proteasome are encoded by the β5, β2, and β1 subunits based on their substrate specificity for the CT-L, T-L, and C-L activities, respectively. In the immunoproteasome, low-molecular mass polypeptide 2 and 7 and multicatalytic endopeptidase complex-like 1 replace β1, β5, and β2, respectively. It has been shown that multiple myeloma cells express both constitutive and immunoproteasomes [8, 9]. The epoxyketone pharmacophore of carfilzomib forms an irreversible, covalent adduct with the N-terminal threonine residue of the CT-L active site of the 20S proteasome, while sparing nonproteosomal sites. As a result, proteasome substrates accumulate, ultimately stimulating arrest and apoptosis of tumor cells.
The mechanism of action of carfilzomib allows for deeper and durable proteasome inhibition, based on its ability to covalently bind and irreversibly inhibit the proteasome, as proteasome activity can only be recovered by target re-synthesis. For these reasons, carfilzomib is amenable to longer dosing intervals, despite its short plasma elimination pharmacokinetic (PK) half-life (≤ 1 h), which is a result of its atypical metabolism, namely via epoxide hydrolases and peptidases [10]. Due to the rapid clearance of carfilzomib and its short elimination half-life, it is challenging to accurately capture the true concentration-time data for characterization of exposure–response relationships, especially in phase III studies, which are designed primarily for safety and efficacy, and often only with a smaller subset of patients available for PK characterization. These properties also make it difficult to make long-term inferences to guide dosing interval selection solely based on exposure–response relationships, as no drug accumulation is observed with continuous carfilzomib treatment due to the short elimination half-life. Therefore, it is expected that the understanding of the mechanism of action of carfilzomib would be a defining driver for the selection of optimal dosing intervals.
In the phase III ARROW trial, once-weekly carfilzomib in combination with dexamethasone (Kd) at 70 mg/mg2 was compared against twice-weekly Kd at 27 mg/m2 in subjects with relapsed and refractory multiple myeloma [11]. While regulatory approval was being sought for the Kd 70 mg/m2 once-weekly regimen, the control arm used Kd 27 mg/m2 twice-weekly, as it was the only approved carfilzomib dose at the time of the design of the study. However, with the eventual approval of Kd 56 mg/mg2 twice-weekly, cross-study clinical evaluations were needed to demonstrate comparability between the Kd 70 mg/mg2 once-weekly and Kd 56 mg/m2 twice-weekly regimens. To provide further evidence of the comparability of once- and twice-weekly dosing, a mechanistic PK/pharmacodynamic (PK/PD) model was built.
In this work, we showcase the model, which was built using a bottom-up approach based on the mechanism of action of carfilzomib and biology of the target, the proteasome. We use the model to describe the available clinical proteasome inhibition data for approved carfilzomib regimens. We then explore the impact of dosing interval on steady-state proteasome inhibition and correlate it with observed clinical response data (overall response rate [ORR]; progression-free survival [PFS]) to ascertain the feasibility of longer dosing intervals.
Methods
Model Building
In contrast to traditional exposure–response modeling, wherein the available data are used to determine both the model structure and the estimates of model parameters, this work employs the use of available information on the mechanism of action and published information in the literature to arrive at reasonable estimates of the model parameters of the molecular interactions to build the model. The resulting model was then qualified using clinical data from the phase III study, ENDEAVOR, in which the safety and efficacy of carfilzomib and bortezomib (a reversible proteasome inhibitor) were evaluated [12, 13].
Population Pharmacokinetic Model
A population PK model was developed using nonlinear mixed-effects modeling of pooled plasma PK data from previous carfilzomib clinical studies in which PK samples were collected using intense or sparse sampling strategies. A previously published population PK model served as the base model for this exercise [14]. The base model was then updated with available clinical PK data from the phase III ARROW [11] and CANDOR [15] studies, as well as the phase Ib/2 CHAMPION-1 study [16].
A two-compartment PK model with linear distribution, first-order elimination, and an effect of body surface area on clearance, best described the pooled data. Post hoc estimates from the population PK model following administration of the 56 BIW and 70 QW regimens (evaluated in the phase III ENDEAVOR and ARROW studies and the phase Ib/2 CHAMPION-1 study) were used for simulation of proteasome inhibition.
Proteasome Inhibition Model
The proteasome inhibition model was built on the mechanisms of proteasome inhibition via irreversible binding of carfilzomib to the proteasome. Pharmacological inhibition of the proteasome is among the early steps in carfilzomib efficacy that can lead to tumor cell apoptosis and is linked to the clinical response. Proteasome binding occurs intracellularly once the drug enters the cell, and is irreversible for carfilzomib, compared with reversible binding by bortezomib. Utilizing published kon and koff rates, the same model can also be used for other proteasome inhibitors, and the model predictions for bortezomib (first-generation proteasome inhibitor) were used to compare reversible versus irreversible binding. Figure 1a shows a schematic of the proteasomal binding to the drug, which forms the basis of the model.
Fig. 1.

Model of a proteasome binding kinetics and proteasomal recovery rates and b mechanistic basis of proteasome inhibition leading to clinical efficacy. a The core hypothesis of the model assumes that the drug binds and inhibits the proteasome as per the chemical kinetics described by the rate constants within the cell. The proteasome is assumed to have a synthesis rate that is responsible for its regeneration, and drug concentrations are assumed to follow the drug pharmacokinetics. b At the cellular level, inhibition of the proteasome leads to the accumulation of cellular proteins and results in cell death. Specifically for the tumor cell, the other processes that the extended model (not specified in this paper) can capture are the tumor cell proliferation and the cellular protein homeostasis leading to the secretion of M proteins, a key marker of multiple myeloma. Solid arrows indicate chemical interaction-based rate processes at the molecular and cellular levels; dashed arrows indicate inhibition or activation type interactions between state variables. Cell Prot misfolded proteins in the cell, D drug, k_degradation proteasomal degradation rate of the polyubiquitinated proteins, k_generation generation rate of the misfolded proteins, koff reverse reaction or dissociation rate of the drug-proteasome complex, kon forward reaction rate of binding of drug to the proteasome, ksyn synthesis or recovery rate of the proteasome, M-Prot M protein, P proteasome, P-I proteasome-drug complex, PK pharmacokinetics.
This mechanistic model takes the reported values of the binding of carfilzomib to the proteasome and its recovery and can predict proteasome inhibition for a given concentration of the drug. Post hoc PK parameters of subjects from the phase III ENDEAVOR and ARROW studies and the phase Ib/2 CHAMPION-1 study (n = 279) were generated using the population PK model described in Sect. 2.2.
The kinetic binding rate constants for carfilzomib and bortezomib used in the model were obtained from identical in vitro assays reported in the literature [17]. The values are reproduced in Table 1.
Table 1.
Kinetic and equilibrium parameters for the inhibition of chymotrypsin-like 20S proteasome activity
| Drug | kon (M−1 s−1) | koff (s−1) | t½off (min) |
|---|---|---|---|
| Bortezomib | (6.8 ± 1.4) × 104 | (3.8 ± 1.3) × 10-4 | 30 |
| Carfilzomib | (4.9 ± 0.5) × 104 | 0 | NA |
Kinetic and equilibrium parameters were based on values previously reported by Hasinoff [17]
koff reverse reaction or dissociation rate of the drug-proteasome complex, kon forward reaction rate of binding of drug to the proteasome, NA not applicable, t½off half-life of the complex based on koff
Baseline proteasome concentrations are reported to be in the range of 1.9–4.1 μM in red blood cells and 1–6 μM in white blood cells [18]; for the purposes of the model simulations, baseline proteasome concentrations were assumed to be 3 μM. The proteasome can be synthesized by nucleated cells and that synthesis is responsible for the observed recovery of the proteasomal activity in clinical data after carfilzomib dosing. The reported proteasomal recovery rates show a 50–100% recovery of proteasome activity in all tissues examined within 24 h after carfilzomib administration [18]. In anucleated cells such as red blood cells, which cannot synthesize new proteasomes, the recovery is slower and is based on new red blood cell synthesis with a half-life of approximately 15–17 weeks; hence, a prolonged PD effect is seen in such cells. Considering that clinical PD samples for proteasome inhibition were collected in whole blood, where a range of cells are present, a distribution of recovery rates (instead of a single number) was chosen, which was consistent with data from a mixture of different cell types. The proteasome synthesis rate (ksyn) was sampled from a log-normal distribution with mean proteasome synthesis half-life of 2 weeks, consistent with values reported in literature [18]. Interindividual variability was applied by sampling from a log-normal distribution, resulting in a range of proteasome synthesis half-lives of 4–47 days.
The intracellular concentration of the drug is assumed to be in rapid equilibrium with the extracellular drug concentrations, which in turn are governed by the drug PK. The PK parameters used in the model for carfilzomib were based on the population PK model, while those for bortezomib were based on published values [19].
Simulations were performed with this model to compare the average proteasome inhibition across five cycles of treatment for the 70 QW and 56 BIW regimens. Five cycles (i.e., five months) of treatment was chosen to represent a time frame in which subjects could achieve the deepest degrees of response, based on the median time to response data in the phase III ARROW and ENDEAVOR studies [11, 20].
Correlating the Proteasome Inhibition Model with Clinical Efficacy
The key question behind this effort was to compare the proteasome inhibition for the 70 QW and 56 BIW regimens, and further understand its implications on clinical efficacy for both regimens.
Figure 1b shows the mechanistic basis of connecting proteasome inhibition to the depletion of M protein and to the eventual killing of the tumor cells that leads to clinical benefit (e.g., ORR, PFS). The inhibition of the proteasome in rapidly dividing multiple myeloma tumor cells results in the accumulation of misfolded proteins in the cells, which in turn results in cell death. The reduction in the tumor cells subsequently leads to a reduction in M protein levels and induces the efficacious response, ultimately leading to PFS. Hence, the proteasome inhibition achieved in the first step is expected to be correlated with the observed rates of depletion of M protein, and the clinical efficacy endpoints, PFS and ORR.
The mathematical model equations for the proteasome inhibition model are presented in Eqs. (1) and (2):
| 1 |
| 2 |
where Cp is the population PK model-predicted plasma drug concentration, P is the proteasome activity level, [PCp] is the drug-proteasome complex, kon is the forward binding rate, koff is the dissociation rate of the complex, and ksyn is the physiological synthesis rate of the proteasome. The initial conditions and values are presented in electronic supplementary Table S1.
Results
Comparison of Model Predictions with Observed Clinical Proteasome Inhibition
The PK/PD model was qualified using clinical trial data from the phase III ENDEAVOR study [12, 13], in which proteasome inhibition was compared between bortezomib (a reversible proteasome inhibitor) and carfilzomib (an irreversible proteasome inhibitor). Predictions for proteasome activity in whole blood after treatment with bortezomib or carfilzomib compared with observed values are presented in Fig. 2. Post hoc PK profiles of subjects treated with carfilzomib at 56 BIW in combination with dexamethasone (n = 279) were generated using the population PK model and were used for simulation of proteasome inhibition.
Fig. 2.

Interplay of proteasome turnover and proteasome binding on steady-state inhibition of proteasomal activity. Model simulations using theoretical ranges of parameters were conducted to evaluate the sensitivity of the half-life of the drug-proteasome complex (koff) and target turnover (synthesis half-life). The color shows steady-state proteasome inhibition (lighter colors indicating higher degrees of proteasome inhibition). The model assumes one-compartment pharmacokinetics and the simulations shown here are for a constant dose and drug clearance
A distribution of recovery rates (instead of a single number) was chosen, considering that clinical PD samples for proteasome inhibition were collected in whole blood (Sect. 2.3). As differences in proteasome recovery rates are observed in various types of cells (e.g., nucleated cells with relatively faster recovery of the proteasome versus anucleated cells), a model-based sensitivity analysis was conducted to elucidate the impact of a range of proteasome recovery rates on the simulation results. In this analysis, model simulations were conducted to evaluate the effect of drug PK, target binding (koff), and target turnover (target synthesis half-life). The sensitivity analysis indicated that for a faster recovering target (lower target synthesis doubling time), drug presence is essential but may not be sufficient to sustain higher degrees of target inhibition. However, for irreversible inhibitors (covalent binders) such as carfilzomib (where the half-life of the drug-target complex almost reached infinity), drug presence is less critical, especially for targets with slower synthesis rates or lower relative abundance (Fig. 2); such therapeutics can be used in regimens with longer dosing intervals. The sensitivity analysis indicated that key aspects of the results regarding the effect of reversible versus irreversible inhibition remained unaltered by a range of possible proteasome recovery rates.
The simulated predictions from this model were compared with the observed proteasome inhibition for carfilzomib and were found to be in agreement (Fig. 3). Furthermore, the model with parameter estimates from the literature can capture the essential features of the observed data and is in line with data from both carfilzomib and bortezomib treatments (Fig. 3), reinforcing the confidence on the model structure and the decision to not make any parameter adjustments to fit the data. Subsequently, simulations were performed with this model to compare the average proteasome inhibition across five cycles of treatment for the 56 BIW and 70 QW regimens.
Fig. 3.
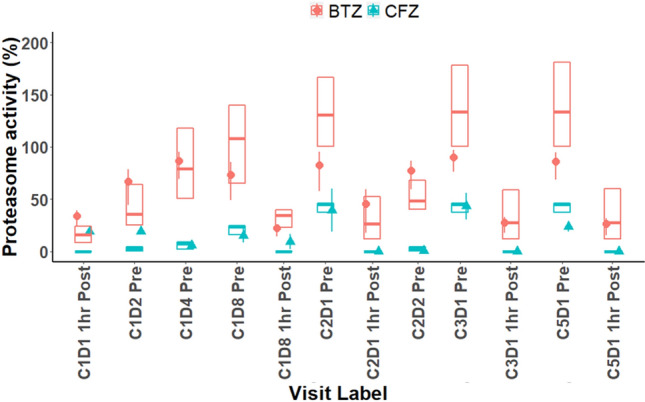
Observed and model-predicted proteasome activity in whole blood after CFZ and BTZ administration in the phase III ENDEAVOR study. CFZ and BTZ data are represented by orange and teal data elements, respectively. Solid shapes represent observed proteasome inhibition data as percentage change from baseline measured in the phase III ENDEAVOR study. The error bars on solid shapes represent the 90% confidence interval on the means. The box plots show the model-predicted proteasome inhibition following CFZ or BTZ administration (median and 90% confidence interval). Simulations were performed using pharmacokinetic parameters based on post hoc estimates of the population pharmacokinetic model for CFZ. The PK parameters used for BTZ were estimated using a two-compartment PK model (Vp = 20 L, CL = 25 L/h, Vt = 1500 L, Q = 150 L/h), which was consistent with PK results published in Reece et al. [19]. A 30% log-normal variability was superimposed on CL and Vp to capture the interindividual variability. Model-predicted proteasome inhibition confirmed a greater inhibition of proteasome activity following CFZ administration (versus BTZ), which was expected based on the irreversible binding of CFZ to the proteasome (versus reversible binding by BTZ). BTZ bortezomib, CFZ carfilzomib, CL clearance, PK pharmacokinetic, Q intercompartmental clearance, Vp peripheral volume of distribution, Vt tissue volume of distribution
Model Simulations to Compare Proteasome Inhibition for 20/70 mg/m2 Once Weekly and 20/56 mg/m2 Twice Weekly
The results from the model simulations indicate comparable proteasome inhibition for carfilzomib at 70 QW and 56 BIW (Table 2). The model simulations predict < 5% of baseline proteasome activity even after the 12- or 13-day treatment-free window between cycles (Fig. 4). These results are consistent with the observed proteasome activity in whole blood after administration of 70 QW and 56 BIW, and with the comparable efficacy of the two dosing regimens in the robust cross-study comparisons [21].
Table 2.
Summary of model-predicted proteasome inhibition results from simulations of Kd 20/70 mg/m2 once weekly and Kd 20/56 mg/m2 twice weekly
| Dosing regimen | Median (95% CI) steady-state carfilzomib exposures | Average proteasome inhibition across five cycles (%) | |
|---|---|---|---|
| Steady-state Cmax (ng/mL) | Average daily AUC at steady state (h⋅ng/mL) | Proteasome recovery rates (t½ ~2 weeks) | |
| 20/56 mg/m2 BIW | 953 (223–2833) | 107 (28–362) | 83 (63–93) |
| 20/70 mg/m2 QW | 1191 (278–3542) | 67 (18–226) | 79 (57–91) |
Steady state refers to a point in time after repeated treatment cycles (two or more) of carfilzomib in which the therapeutic dose of either 70 or 56 mg/m2 was administered during all dosing events. Proteasome inhibition reported is for predose of cycle six (assumed to be steady state) for all subjects receiving the mentioned dose
AUC area under the concentration-time curve, BIW twice weekly, CI confidence interval, Cmax maximum concentration, QW once weekly
Fig. 4.

Simulation of proteasome activity of Kd 20/70 mg/m2 QW and Kd 20/56 mg/m2 BIW in whole blood. Solid lines (median) and shaded areas (95% CI) are the results of the model simulations with parameters, as listed in Table 1 and electronic supplementary Table S1. The pharmacokinetic parameters were computed based on post hoc estimates of the population pharmacokinetic model. BIW twice weekly, CI confidence interval, Kd carfilzomib in combination with dexamethasone, QW once weekly
Comparison of Proteasome Inhibition with Observed Clinical Efficacy for 20/70 mg/m2 Once Weekly and 20/56 mg/m2 Twice Weekly
The observed target engagement, in the form of proteasome inhibition, was compared with the observed clinical efficacy data from subjects who received 70 QW and 56 QW. The efficacy comparison was performed for the observed depletion rates of serum M protein, ORR, and finally, PFS. The objective of this comparison was to evaluate if comparable proteasome inhibition, as predicted by the model for the two regimens, would also yield comparable clinical efficacy for carfilzomib administered using 70 QW and 56 BIW doses.
The M protein depletion rates are presented in Table 3, which were computed for the individual fits for the time course M protein data using a mono-exponential decay (not shown). Specifically, the rates were obtained by fitting the time course of the logarithm of the M protein levels after administration of 70 QW or 56 BIW in subjects with multiple myeloma after one to three prior lines of therapy from CHAMPION-1 and ENDEAVOR, respectively, using linear regression. This method can yield an approximation of the linear decay rates of M protein, which can be sufficient for comparison. As seen, the observed rate of decline in M protein levels were comparable for the 70 QW and 56 BIW regimens. The observed changes in the M protein levels with 70 QW and 56 BIW were consistent with the predicted levels of proteasome inhibition.
Table 3.
Observed rate of decline in M protein levels is comparable for subjects treated with Kd 56 mg/m2 twice weekly versus 70 mg/m2 once weekly, and is consistent with model-predicted proteasome inhibition
| Dosing regimen | Observed rate of M-protein decline (1/day) [median (95% CI)] | Average proteasome inhibition across five cycles (%) |
|---|---|---|
| 20/56 mg/m2 BIW | − 0.002 (− 0.009, 0.005) | 83 (63–93) |
| 20/70 mg/m2 QW | 9.2 × 10⁻⁵ (− 0.011, 0.007) | 79 (57–91) |
BIW twice weekly, CI confidence interval, Kd carfilzomib in combination with dexamethasone, QW once weekly
Furthermore, the model-predicted proteasome inhibition values for the 70 QW and 56 BIW regimens were also consistent with the observed PFS and ORR values described in the cross-study comparisons of efficacy between the two dosing regimens (Table 4).
Table 4.
Observed PFS and ORR are comparable for subjects treated with Kd 20/56 mg/m2 twice weekly versus 20/70 mg/m2 once weekly, and are consistent with model-predicted proteasome inhibition
| Dosing regimen | Average proteasome inhibition across five cycles (%) | Observed mPFSa [months] (95% CI) | Observed ORRa [%] (95% CI) |
|---|---|---|---|
| 20/56 mg/m2 BIW | 83 (63–93) | 14.5 (10.2–NE) | 72.4 (65.9–78.2) |
| 20/70 mg/m2 QW | 79 (57–91) | 12.1 (8.4–14.3) | 69.9 (61.7–77.2) |
BIW twice-weekly, CI confidence interval, Kd carfilzomib in combination with dexamethasone, ORR overall response rate, mPFS median progression-free survival, n number of subjects, NE not evaluable, PFS progression-free survival, QW once weekly
aObserved mPFS and ORR were previously reported in a cross-study comparison for efficacy in subjects with two to three prior lines of therapy from the phase III ENDEAVOR (n = 217) and ARROW + CHAMPION-1 studies (n = 146)[15]
Discussion
The mechanistic PK/PD model described above was developed to provide supportive evidence, in addition to several clinical cross-study comparisons, of the comparability of 70 QW dosing with 56 BIW dosing, in lieu of a phase III trial comparing these two regimens directly. The model was developed using a bottom-up approach that relies on the mechanism of action of proteasome inhibitors, and was based on kinetic parameters from available literature rather than on limited PK and PD data collected in phase III clinical studies. In addition, model parameters were not adjusted to fit the observed data. This approach is expected to avoid the limitations often associated with traditional exposure–response analyses, particularly for a drug with unique PK properties such as carfilzomib, where estimation of accurate PK parameters in larger phase III clinical studies may be difficult. The PK/PD model was qualified using clinical trial data from the phase III ENDEAVOR study [12, 13], and captured the essential features of the observed data from both carfilzomib and bortezomib treatment. Sensitivity analyses indicated that different proteasome recovery rates, based on the presence of both nucleated and anucleated cells in whole blood, was not found to be influential on simulation results for a covalent inhibitor such as carfilzomib. Model simulations also indicated comparable proteasome inhibition between the 70 QW and 56 BIW dosing regimens, which in turn were consistent with comparable trends in the rates of M protein decline, and clinical response measures of ORR and PFS, although 70 QW had a higher Cmax and lower steady-state AUC than 56 BIW. One hypothesis to address this observation could be that the higher Cmax of carfilzomib from 70 QW compensates for the lower overall AUC compared with 56 BIW. Previously published in vitro data suggested that sufficiently high concentrations of carfilzomib over a 1-h incubation period provided greater and sustained inhibition of chymotrypsin-L activity, relative to lower carfilzomib concentrations over a 48-h incubation period [22]. Notably, the deeper proteasome inhibition achieved with carfilzomib versus bortezomib was also reflected in the overall survival (OS) data (median OS of 47.6 and 40.0 months for carfilzomib and bortezomib, respectively) [12, 13].
As described above, the mechanistic PK/PD model was developed to provide supportive evidence of the comparability of 70 QW and 56 BIW dosing, considering the unique PK and PD properties of carfilzomib and given that the now-approved 56 BIW regimen was not available at the time of the design of the phase III ARROW study. Thus, this work provides a framework for future applications in the optimization of dosing intervals for carfilzomib, centered on its PD effect as an irreversible inhibitor of the proteasome, rather than solely using traditional metrics of drug exposure, such as trough concentrations or area under the concentration-time curve values. This application has several benefits and challenges.
In the selection of optimal dose and dosing regimens for molecular entities such as carfilzomib, mechanistic PK/PD modeling may help improve our understanding of exposure–response relationships for efficacy by overcoming temporal limitations associated with PK alone. Although carfilzomib-induced proteasome inhibition occurs irreversibly and rapidly following administration [23], the turnover of new proteasome targets (and hence, recovery of proteasome activity) will be a more critical parameter in dosing interval optimization. Although proteasome inhibition is not an established surrogate biomarker for multiple myeloma, M protein levels are used in the assessment of clinical response as described by the International Multiple Myeloma Working Group response criteria [3, 24, 25], Therefore, the direct involvement of proteasome inhibition in the apoptosis of multiple myeloma cells positions the biomarker to make inferences on clinical response by way of the dynamics of M protein levels measured throughout treatment.
The application of the mechanistic PK/PD model can also be extended to evaluate optimal dosing intervals after long-term carfilzomib treatment. The benefits of this application may translate into less frequent dosing intervals during long-term carfilzomib therapy, which may ultimately result in improved patient convenience and adherence. The introduction and approval of the 70 QW dosing regimen provided a desired option for less frequent clinic visits to receive therapy, reducing the overall burden on patients and caregivers [26]. With long-term carfilzomib therapy, various patient characteristics, in particular tumor burden, are likely to change, especially in cases where clinical efficacy is maintained. The mechanistic model can be employed to explore whether these changes can be supportive of even further reducing the frequency of carfilzomib dosing and thus extending the dosing interval.
Despite the applications of this model and the potential benefits it can provide to multiple myeloma patients, there are limitations with its use. As mentioned previously, proteasome inhibition has not been established as a surrogate biomarker of efficacy for multiple myeloma. Although it does provide direct evidence of target engagement, the cellular matrix that proteasome activity is measured will need to be considered as the proteasome turnover rates may be different in nucleated versus anucleated cells. Furthermore, the model alone may be considered exploratory in nature and may not be sufficient in convincing regulatory bodies of the overall effectiveness of a less frequent dosing interval that has not been formally evaluated in clinical trials. To do so, some degree of clinical data will be needed to support and validate the model findings.
Collecting the long-term data needed for such an effort may also provide many logistic challenges as well. Clinical trials will need to be designed with foresight for the need of this type of data, and the burden of these long-term visits and assessments on enrolled subjects will need to be carefully considered. It will also be important to distinguish any potential differences in the relationship of proteasome inhibition, M protein, and clinical efficacy in responders and nonresponders, which will again require a number of clinic visits and laboratory assessments.
Despite these various limitations, as drug development moves to incorporate more model-informed decision making, a mechanistic model such as this and a pairing with strategic clinical trial design may prove to be a valuable asset in establishing a proof of concept to guide drug development decisions.
Supplementary Information
Below is the link to the electronic supplementary material.
Declarations
Funding
This work was sponsored by Amgen, Inc.
Conflict of interest
Marc R. Yago, Khamir Mehta, Maitreyee Bose, Sharvari Bhagwat, Vivek S. Chopra, Sandeep Dutta, and Vijay V. Upreti are or were employed by Amgen, Inc., and own or have owned stock in Amgen, Inc., during the time this work was conducted.
Ethics approval
Not applicable.
Consent to participate
Not applicable.
Consent for publication
Not applicable.
Availability of data and material
For qualified researchers, additional information on data sharing can be found at http://www.amgen.com/datasharing.
Code availability
Model parameters and initial conditions are included in electronic supplementary Table S1. For qualified researchers, additional information on data sharing can be found at http://www.amgen.com/datasharing.
Author contributions
MRY, KM, MB, SB, VSC, SD, and VVU wrote the manuscript and designed the research. MRY, KM, MB, SB, SD, and VVU performed the research. MRY, KM, MB, SB, SD, and VVU analyzed the data.
Footnotes
Marc R. Yago and Khamir Mehta contributed equally to this work as first authors.
References
- 1.Gandolfi S, Laubach JP, Hideshima T, Chauhan D, Anderson KC, Richardson PG. The proteasome and proteasome inhibitors in multiple myeloma. Cancer Metastasis Rev. 2017;36(4):561–584. doi: 10.1007/s10555-017-9707-8. [DOI] [PubMed] [Google Scholar]
- 2.Ito S. Proteasome inhibitors for the treatment of multiple myeloma. Cancers (Basel). 2020 doi: 10.3390/cancers12020265. [DOI] [PMC free article] [PubMed] [Google Scholar]
- 3.Durie BG, Harousseau JL, Miguel JS, Blade J, Barlogie B, Anderson K, et al. International uniform response criteria for multiple myeloma. Leukemia. 2006;20(9):1467–1473. doi: 10.1038/sj.leu.2404284. [DOI] [PubMed] [Google Scholar]
- 4.Kyprolis (carfilzomib) [US prescribing information]. Thousand Oaks: Amgen, Inc.; 2021.
- 5.Nandi D, Jiang H, Monaco JJ. Identification of MECL-1 (LMP-10) as the third IFN-gamma-inducible proteasome subunit. J Immunol. 1996;156(7):2361–2364. doi: 10.4049/jimmunol.156.7.2361. [DOI] [PubMed] [Google Scholar]
- 6.Glynne R, Powis SH, Beck S, Kelly A, Kerr LA, Trowsdale J. A proteasome-related gene between the two ABC transporter loci in the class II region of the human MHC. Nature. 1991;353(6342):357–360. doi: 10.1038/353357a0. [DOI] [PubMed] [Google Scholar]
- 7.Martinez CK, Monaco JJ. Homology of proteasome subunits to a major histocompatibility complex-linked LMP gene. Nature. 1991;353(6345):664–667. doi: 10.1038/353664a0. [DOI] [PubMed] [Google Scholar]
- 8.Lee SJ, Levitsky K, Parlati F, Bennett MK, Arastu-Kapur S, Kellerman L, et al. Clinical activity of carfilzomib correlates with inhibition of multiple proteasome subunits: application of a novel pharmacodynamic assay. Br J Haematol. 2016;173(6):884–895. doi: 10.1111/bjh.14014. [DOI] [PMC free article] [PubMed] [Google Scholar]
- 9.Parlati F, Lee SJ, Aujay M, Suzuki E, Levitsky K, Lorens JB, et al. Carfilzomib can induce tumor cell death through selective inhibition of the chymotrypsin-like activity of the proteasome. Blood. 2009;114(16):3439–3447. doi: 10.1182/blood-2009-05-223677. [DOI] [PubMed] [Google Scholar]
- 10.Wang Z, Yang J, Kirk C, Fang Y, Alsina M, Badros A, et al. Clinical pharmacokinetics, metabolism, and drug-drug interaction of carfilzomib. Drug Metab Dispos. 2013;41(1):230–237. doi: 10.1124/dmd.112.047662. [DOI] [PubMed] [Google Scholar]
- 11.Moreau P, Mateos MV, Berenson JR, Weisel K, Lazzaro A, Song K, et al. Once weekly versus twice weekly carfilzomib dosing in patients with relapsed and refractory multiple myeloma (A.R.R.O.W.): interim analysis results of a randomised, phase 3 study. Lancet Oncol. 2018;19(7):953–964. doi: 10.1016/S1470-2045(18)30354-1. [DOI] [PubMed] [Google Scholar]
- 12.Dimopoulos MA, Moreau P, Palumbo A, Joshua D, Pour L, Hajek R, et al. Carfilzomib and dexamethasone versus bortezomib and dexamethasone for patients with relapsed or refractory multiple myeloma (ENDEAVOR): a randomised, phase 3, open-label, multicentre study. Lancet Oncol. 2016;17(1):27–38. doi: 10.1016/S1470-2045(15)00464-7. [DOI] [PubMed] [Google Scholar]
- 13.Dimopoulos MA, Goldschmidt H, Niesvizky R, Joshua D, Chng WJ, Oriol A, et al. Carfilzomib or bortezomib in relapsed or refractory multiple myeloma (ENDEAVOR): an interim overall survival analysis of an open-label, randomised, phase 3 trial. Lancet Oncol. 2017;18(10):1327–1337. doi: 10.1016/S1470-2045(17)30578-8. [DOI] [PubMed] [Google Scholar]
- 14.Ou Y, Doshi S, Nguyen A, Jonsson F, Aggarwal S, Rajangam K, et al. Population pharmacokinetics and exposure-response relationship of carfilzomib in patients with multiple myeloma. J Clin Pharmacol. 2017;57(5):663–677. doi: 10.1002/jcph.850. [DOI] [PubMed] [Google Scholar]
- 15.Dimopoulos M, Quach H, Mateos MV, Landgren O, Leleu X, Siegel D, et al. Carfilzomib, dexamethasone, and daratumumab versus carfilzomib and dexamethasone for patients with relapsed or refractory multiple myeloma (CANDOR): results from a randomised, multicentre, open-label, phase 3 study. Lancet. 2020;396(10245):186–197. doi: 10.1016/S0140-6736(20)30734-0. [DOI] [PubMed] [Google Scholar]
- 16.Berenson JR, Cartmell A, Bessudo A, Lyons RM, Harb W, Tzachanis D, et al. CHAMPION-1: a phase 1/2 study of once-weekly carfilzomib and dexamethasone for relapsed or refractory multiple myeloma. Blood. 2016;127(26):3360–3368. doi: 10.1182/blood-2015-11-683854. [DOI] [PMC free article] [PubMed] [Google Scholar]
- 17.Hasinoff BB. Progress curve analysis of the kinetics of slow-binding anticancer drug inhibitors of the 20S proteasome. Arch Biochem Biophys. 2018;639:52–58. doi: 10.1016/j.abb.2017.12.020. [DOI] [PubMed] [Google Scholar]
- 18.Dick LR, Fleming PE. Building on bortezomib: second-generation proteasome inhibitors as anti-cancer therapy. Drug Discov Today. 2010;15(5–6):243–249. doi: 10.1016/j.drudis.2010.01.008. [DOI] [PubMed] [Google Scholar]
- 19.Reece DE, Sullivan D, Lonial S, Mohrbacher AF, Chatta G, Shustik C, et al. Pharmacokinetic and pharmacodynamic study of two doses of bortezomib in patients with relapsed multiple myeloma. Cancer Chemother Pharmacol. 2011;67(1):57–67. doi: 10.1007/s00280-010-1283-3. [DOI] [PMC free article] [PubMed] [Google Scholar]
- 20.Weisel K, Mateos MV, Gay F, Delforge M, Cook G, Szabo Z, et al. Efficacy and safety profile of deep responders to carfilzomib-based therapy: a subgroup analysis from ASPIRE and ENDEAVOR. Leukemia. 2021;35(6):1732–1744. doi: 10.1038/s41375-020-01049-5. [DOI] [PMC free article] [PubMed] [Google Scholar]
- 21.Moreau P, Stewart KA, Dimopoulos M, Siegel D, Facon T, Berenson J, et al. Once-weekly (70 mg/m(2) ) vs twice-weekly (56 mg/m(2) ) dosing of carfilzomib in patients with relapsed or refractory multiple myeloma: A post hoc analysis of the ENDEAVOR, A.R.R.O.W., and CHAMPION-1 trials. Cancer Med. 2020;9(9):2989–2996. doi: 10.1002/cam4.2945. [DOI] [PMC free article] [PubMed] [Google Scholar]
- 22.Schafer J, Welti L, Seckinger A, Burhenne J, Theile D, Weiss J. Cellular effect and efficacy of carfilzomib depends on cellular net concentration gradient. Cancer Chemother Pharmacol. 2017;80(1):71–79. doi: 10.1007/s00280-017-3335-4. [DOI] [PubMed] [Google Scholar]
- 23.Suzuki E, Demo S, Deu E, Keats J, Arastu-Kapur S, Bergsagel PL, et al. Molecular mechanisms of bortezomib resistant adenocarcinoma cells. PLoS ONE. 2011;6(12):e27996. doi: 10.1371/journal.pone.0027996. [DOI] [PMC free article] [PubMed] [Google Scholar]
- 24.Kumar S, Paiva B, Anderson KC, Durie B, Landgren O, Moreau P, et al. International Myeloma Working Group consensus criteria for response and minimal residual disease assessment in multiple myeloma. Lancet Oncol. 2016;17(8):e328–e346. doi: 10.1016/S1470-2045(16)30206-6. [DOI] [PubMed] [Google Scholar]
- 25.Rajkumar SV, Harousseau JL, Durie B, Anderson KC, Dimopoulos M, Kyle R, et al. Consensus recommendations for the uniform reporting of clinical trials: report of the International Myeloma Workshop Consensus Panel 1. Blood. 2011;117(18):4691–4695. doi: 10.1182/blood-2010-10-299487. [DOI] [PMC free article] [PubMed] [Google Scholar]
- 26.Moreau P, Kumar S, Boccia R, Iida S, Goldschmidt H, Cocks K, et al. Convenience, satisfaction, health-related quality of life of once-weekly 70 mg/m(2) vs twice-weekly 27 mg/m(2) carfilzomib (randomized A.R.R.O.W. study) Leukemia. 2019;33(12):2934–2946. doi: 10.1038/s41375-019-0480-2. [DOI] [PubMed] [Google Scholar]
Associated Data
This section collects any data citations, data availability statements, or supplementary materials included in this article.