

Abstract
Objectives:
To evaluate whether socioeconomic factors affect pathologic stage, treatment delays, pathologic upstaging, and overall survival (OS) in patients with penile cancer (PC).
Patients and methods:
A total of 13,283 eligible patients diagnosed with PC from 1998 to 2012 were identified from the National Cancer Database. Socioeconomic, demographic and pathologic variables were used in multivariable regression models to identify predictors of pathologic T stage ≥2, pathologic lymph node positivity, cT to pT upstaging, treatment delays, and OS.
Results:
A 5-year OS was 61.5% with a median follow-up of 41.7 months. Pathologic T stage ≥2 was identified in 3,521 patients (27.2%), 1,173 (9.2%) had ≥pN1 and 388 (7.9%) experienced cT to pT upstaging. Variables associated with a higher likelihood of pathologic T stage ≥2 included no insurance (OR = 1.79, P < 0.001), lower higher education based on zip code (OR = 1.13, P = 0.027), black race (OR = 1.17, P = 0.046) and Hispanic ethnicity (OR = 1.66, P < 0.001). Patients with Hispanic ethnicity (OR = 1.46; P < 0.001) or living in nonmetropolitan areas were more likely to have ≥pN1 (P = 0.001). Lack of insurance was associated with cT to pT upstaging (OR = 2.05, P = 0.001) as was living in an urban vs. metropolitan area (OR = 1.35, P = 0.031). In addition to TNM stage, black vs. white race (HR = 1.56, P < 0.001), living in an urban vs. metropolitan area (hazard ratio [HR] = 1.18, P = 0.022), age (HR = 1.04, P < 0.001) and Charlson score (HR = 1.49, P < 0.001) wereassociatedwithlowerOS.
Conclusion:
Socioeconomic variables including no insurance, lower education, race, Hispanic ethnicity, and nonmetropolitan residence were found to be poor prognostic factors. Increased educational awareness of this rare disease may help reduce delays in diagnosis, improve prognosis and ultimately prevent deaths among socioeconomically disadvantaged men with PC.
Keywords: National Cancer Database, Penile cancer, Socioeconomic status, Disparities, Overall survival
1. Introduction
Penile cancer (PC) is a rare disease that accounts for approximately 0.2% of male related malignancies annually in the United States, and comprises roughly 1% of all cancers limited to the male genital system [1]. Outside of the United States, this incidence varies significantly. The variance in incidence has been linked to differences in religious practices and socioeconomic conditions [2–4]. The overwhelming majority of PCs are classified as squamous cell carcinoma (SCC) [4–7]. Risk factors for PC include smoking, human papilloma virus infection, phimosis, and lack of neonatal circumcision [4,8,9]. Mortality from this disease is primarily driven by tumor stage, grade, and lymph node involvement [1,10,11].
Factors including awareness, access to care and embarrassment are known to influence the decision to seek medical care and, ultimately survival [12,13]; however, few studies have investigated whether socioeconomic factors influence survival and the likelihood that a patient will be diagnosed with more aggressive PC. Identification of those most likely to be diagnosed with these adverse features may facilitate earlier identification, earlier treatment, and ultimately improved survival for these patients. A report from the NCDB published in 2016 by Sharma et al. [13] detailed racial and economic disparities in the treatment of penile SCC, ultimately demonstrating that black men presented with a higher disease stage and had worse survival, and men with private insurance and higher median income had better survival. Our study aims to explore whether socioeconomic factors influence survival, treatment delays, and adverse pathologic features including pathologic T stage ≥2, pathologic node positive disease, and cT to pT upstaging among patients diagnosed with PC. It is our hope that, compared to the aforementioned report from the NCDB, our analysis of a significantly larger cohort of a patients allows for both stronger conclusions to be made on the survival disparities in PC, and importantly investigate potential causes for treatment delays and upstaging of disease.
2. Patients and methods
The National Cancer Database was used to identify 14,395 patients with diagnosed PC. Patients with distant metastases (n = 311), no data on curative treatment received (n = 694) were excluded from analysis. Patients lacking data on all outcomes analyzed (n = 107) including pathologic T and N stage, cT to pT upstaging, time to treatment and overall survival (OS) data were also excluded. There were 13,283 patients with pathologically diagnosed PC from 1998 to 2012 for analysis.
Univariable and multivariable binary logistic regression models were used to identify whether demographic and socioeconomic variables independently predicted pathologic T stage ≥2, pathologic lymph node positivity and pathologic upstaging defined as an increase from >cT1 to >pT1, cT2 to >pT2, and cT3 to >pT3. Univariable and multivariable linear regression models were used to identify predictors of treatment delays defined as the number of days between diagnosis and the first treatment received. This value was log 10 transformed due to violations of the linear regression model assumptions before transformation. A univariable and multivariable cox regression model was used to assess the relationship of these demographic and socioeconomic variables in addition to pathologic TN stage and grade with survival.
Variables evaluated in the regression models included year of diagnosis, age, race, (black, white, and other), patient’s primary insurance carrier at the time of initial diagnosis (no insurance vs. any insurance), Charlson-Deyo score, income based on zip code (median household income of the patient’s zip code), education based on zip code (percent of adults in the patients residing area without a high school diploma), residential area of the patient (metropolitan, urban, and rural), cancer program type reporting the case (i.e., Community and Academic/Research), region of the cancer program in which the patient was treated, distance from the patient’s home to the program reporting the case (miles), histology (SCC vs. non-SCC), pathologic TN stage, and pathologic grade.
The covariate (e.g., age, income, and insurance) was included in the final multivariable model for the outcome analyzed (e.g., OS and upstaging) if in univariable analysis, the covariate was associated with the outcome at the P < 0.15 level.
Values for the Charlson-Deyo score were 0, 1, 2 (greater than 1) since the NCDB truncates Charlson-Deyo scores of >1 into 1 category (i.e., 2) due to the low number of patients with a Charlson-Deyo score >1. Charlon-Deyo score was not included in multivariable models for pTN stage or upstaging as this field is not available for patients diagnosed from 1998 to 2002 (n = 4,183) but was included in the model for OS due to the clinically significant relationship of comorbidities and OS. The lowest quartile of income (<$38,000) was compared to all other quartiles of income (≥$38,000) and the lowest quartile of education based on zip code (≥21% of adults in the patient’s zip code without a high school diploma) was compared to all other quartiles of education (<21% of adults in the patient’s zip code without a high school diploma) in the analysis.
Because a multivariable model omits patients with missing data on any covariate included in the model, only patients with complete data for covariates included in the regression model were analyzed for pathologic T stage (n = 8,717), pathologic lymph node positive disease (n = 5,724), upstaging (n = 4,723), treatment delays (n = 3,065), and survival (n = 4,316). All statistical analyses were conducted in R version 3.1.3 using a 2-tailed significance level of 0.05 for all multivariable models.
3. Results
3.1. Demographic and clinical characteristics
Patient demographic, socioeconomic, and clinical data are presented in Table 1. Median age was 66 years. Most patients were white (n = 11,399, 87.3%), 9.7% were Hispanic, most lived in a metropolitan area (n = 10,334, 80.8%). No insurance was listed for 718 (5.4%) patients, 2,904 (5.4%) patients were in the lowest quartile of income based on zip code (<$38,000), and 2,864 (22.4%) patients had the lowest education based on zip code. The median distance from the patient’s home to the facility reporting the case was 10.3 miles. The distribution of patients treated at community vs. academic/research hospitals was 58.3% and 41.7%, respectively. The most common hospital regions included the South Atlantic (21.2%), East North Central (17.8%), and Mid-Atlantic (14.0%) regions with the Mountain region being the least common (4.4%) region where patients were diagnosed with PC.
Table 1.
Demographic and socioeconomic characteristics of patients with penile cancer
| N | 13,283 |
|---|---|
| Year of diagnosis | 2006 (2001–2009) |
| Age | 66.0 (55.0–76.0) |
| Race | |
| White | 11,399 (87.3%) |
| Black | 1,282 (9.8%) |
| Other | 376 (2.9%) |
| Ethnicity | |
| Non-Hispanic | 11,053 (90.3%) |
| Hispanic | 1,185 (9.7%) |
| Charlson-Deyo score | |
| 0 | 6,805 (74.8%) |
| 1 | 1,698 (18.7%) |
| ≥2 | 597 (6.6%) |
| Primary insurance | |
| No insurance | 718 (5.4%) |
| Any insurance | 12,565 (94.6%) |
| Median income based on zip code | |
| <$38,000 (lowest quartile) | 2,904 (22.4%) |
| ≥$38,000 | 10,047 (77.6%) |
| Education based on zip code (% adults without high school diploma in residing area) | |
| ≥21% (lowest quartile) | 2,864 (22.1%) |
| < 21% | 10,101 (77.9%) |
| Residing area | |
| Metropolitan | 10,334 (80.8%) |
| Urban | 2,126 (16.6%) |
| Rural | 334 (2.6%) |
| Cancer program type | |
| Community | 7,739 (58.3%) |
| Academic/research | 5,533 (41.7%) |
| Region of Cancer Program | |
| New England | 855 (6.4%) |
| Mid-Atlantic | 1,853 (14.0%) |
| South Atlantic | 2,820 (21.2%) |
| East North Central | 2,364 (17.8%) |
| East South Central | 1,053 (7.9%) |
| West North Central | 1,105 (8.3%) |
| West South Central | 1,229 (9.3%) |
| Mountain | 583 (4.4%) |
| Pacific | 1,421 (10.7%) |
| Miles from the patient’s home to the treating hospital | 10.3 (4.3–27.7) |
For continuous variables, medians presented with interquartile range in parenthesis.
Spearman correlations of sociodemographic, clinical and pathologic outcome are presented in Fig. 1. Older age was negatively associated with lack of insurance (r = −0.23, <0.01), low education and low income were positively correlated (r = 0.49, P < 0.01), low income (r = 0.19, P < 0.01) and further distance from the treatment center were associated with rurality (r = 0.45, P < 0.01), non-Whiteo race was associated with lower income (r = 0.17, P < 0.01).
Fig. 1.
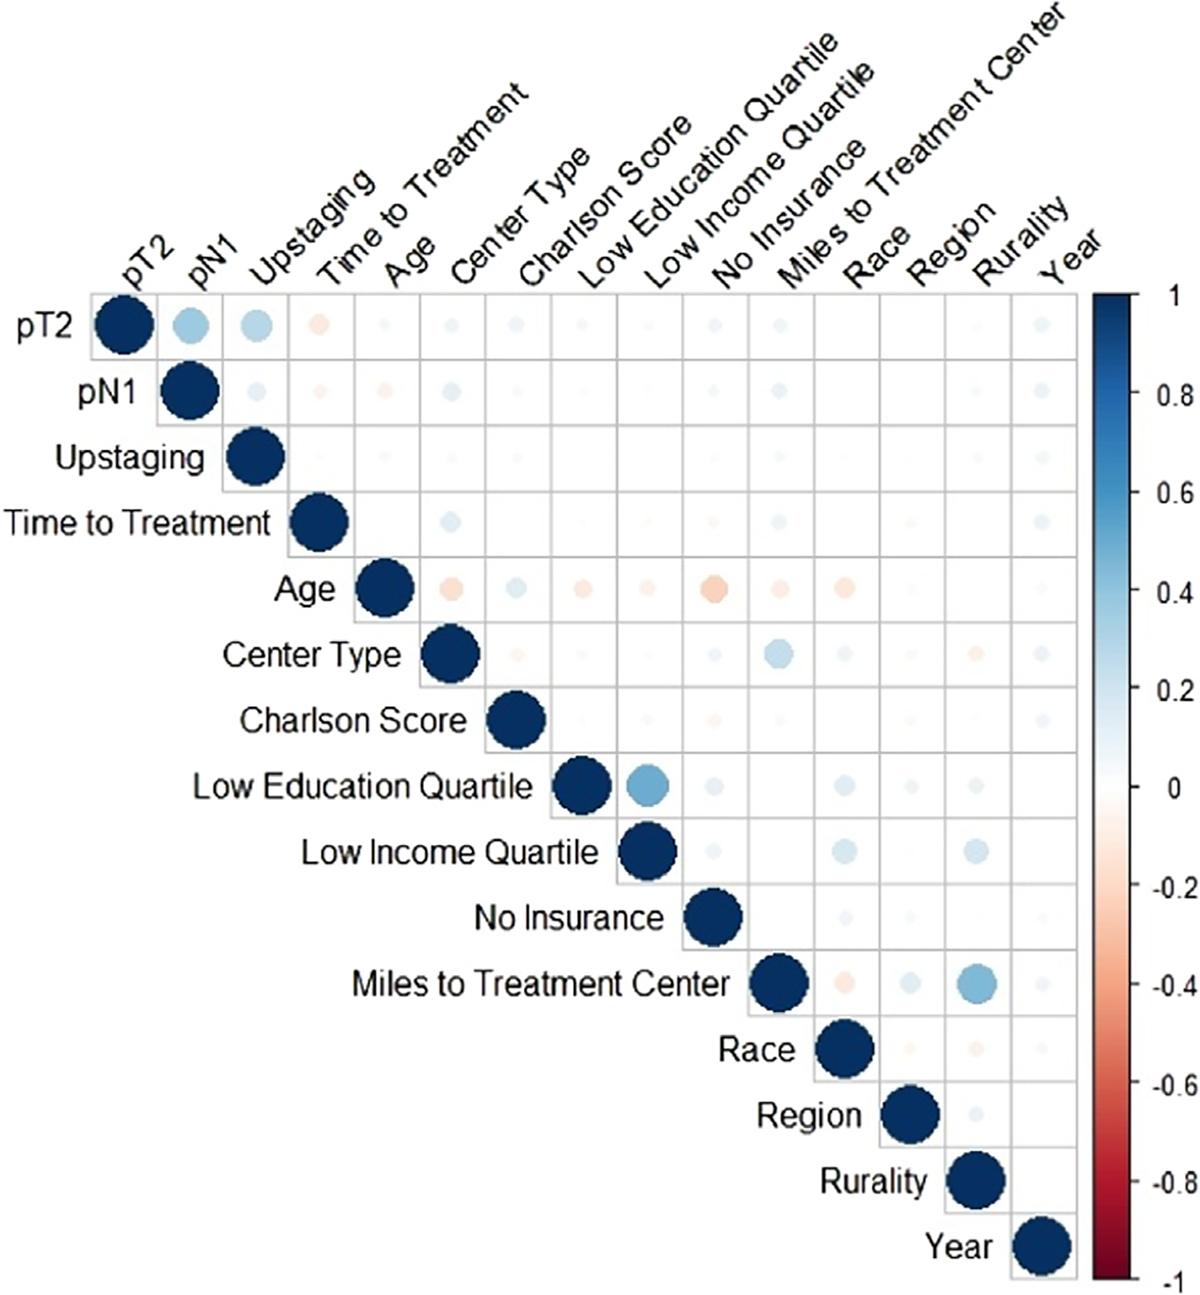
Plot of Spearman correlations between covariates and outcomes.
Note: The stronger the correlation, the darker the circle (blue or red), with a correlation close to or equal to 0 depicted by a white/blank box.
3.2. Pathologic outcome
Regarding pathologic characteristics, 3,521 (27.2%) patients had pathologic stage T2 or higher PC, 1,173 (9.2% overall, 18.3% among those with a lymph node dissection) patients had pathologic lymph node positive disease, and 388 (7.9%) experienced cT to pT upstaging (Table 2). Results from multivariable logistic regression analyses for pathologic ≥T2 and pathologic lymph node positive disease are presented in Table 3.
Table 2.
Clinical and pathologic characteristics of patients with penile cancer
| Clinical T stage | |
| 0 | 36 (0.3%) |
| A-IS | 2,574 (19.7%) |
| 1 | 2,967 (22.7%) |
| 2 | 1,193 (9.1%) |
| 3 | 566 (4.3%) |
| 4 | 139 (1.1%) |
| X | 5,579 (42.7%) |
| Clinical N stage | |
| 0 | 7,038 (53.9%) |
| + | 872 (6.7%) |
| X | 5,152 (39.4%) |
| Pathologic T stage | |
| 0 | 50 (0.4%) |
| A-IS | 2,497 (19.3%) |
| 1 | 3,807 (29.5%) |
| 2 | 2,251 (17.4%) |
| 3 | 1,129 (8.7%) |
| 4 | 141 (1.1%) |
| X | 3,039 (23.5%) |
| Pathologic N stage | |
| 0 | 5,247 (41.3%) |
| + | 1,173 (9.2%) |
| X | 6,281 (49.5%) |
| cT to pT upstaging | |
| No | 4,499 (92.1%) |
| Yes | 388 (7.9%) |
| Histologic subtype | |
| Squamous cell carcinoma | 11,399 (85.8%) |
| Non-squamous cell carcinoma | 1,884 (14.2%) |
| Verrucous | 574 (4.5%) |
| Bowen disease | 497 (3.9%) |
| Melanoma | 131 (1.0%) |
| Mammary Paget’s disease | 60 (0.5%) |
| Basal cell | 46 (0.4%) |
| Other | 433 (3.4%) |
| Grade | |
| 1 | 2,584 (31.2%) |
| 2 | 3,790 (45.8%) |
| 3 | 1,830 (22.1%) |
| 4 | 72 (0.9%) |
| Days to first treatment | 27.0 (13.0–47.0) |
Table 3.
Multivariable logistic regression analysis of pathologic TN stage
| ≥pT2 | ≥pN1 | |||
|---|---|---|---|---|
|
|
|
|||
| OR (95% CI) | P | OR (95% CI) | P | |
|
| ||||
| Year of diagnosis | 1.03 (1.02–1.04) | <0.001 | 1.04 (1.03–1.06) | <0.001 |
| Age | 1.01 (1.01–1.02) | <0.001 | 0.99 (0.99–0.99) | 0.001 |
| Race | ||||
| Black vs. White | 1.17 (1.00–1.36) | 0.046 | ||
| Other vs. White | 0.92 (0.70, 1.20) | 0.554 | ||
| Hispanic vs. non-Hispanic ethnicity | 1.66 (1.42–1.95) | <0.001 | 1.46 (1.19–1.80) | <0.001 |
| No insurance vs. any insurance | 1.79 (1.48–2.18) | <0.001 | 1.13 (0.87–1.47) | 0.359 |
| Income based on zip code | ||||
| <$38,000 vs. ≥$38,000 | 1.03 (0.91–1.16) | 0.662 | ||
| Education based on zip code (% without a HS diploma) | ||||
| ≥21% vs. <21% | 1.12 (0.98–1.27) | 0.081 | 0.97 (0.82–1.13) | 0.670 |
| Residential area | ||||
| Urban vs. metropolitan | 1.19 (1.05–1.35) | 0.007 | 1.37 (1.14, 1.63) | 0.001 |
| Rural vs. Metropolitan | 1.46 (1.10–1.93) | 0.008 | 1.69 (1.12–2.48) | 0.009 |
| Academic/research vs. community hospital | 1.32 (1.20–1.45) | <0.001 | 1.59 (1.39–1.82) | <0.001 |
| Distance to reporting program | 1.00 (1.00–1.00) | 0.295 | 1.00 (1.00–1.00) | 0.951 |
| Squamous vs. non-squamous cell | 2.79 (2.37–3.30) | <0.001 | 3.06 (2.31–4.12) | <0.001 |
| Geographic Region of Hospital | ||||
| West South Central vs. other | 0.90 (0.77–1.05) | 0.181 | ||
| Mountain vs. other | 1.17 (0.94–1.46) | 0.157 | ||
| Mid-Atlantic vs. other | 1.20 (0.98–1.47) | 0.076 | ||
| East North Central vs. other | 1.16 (0.96–1.39) | 0.117 | ||
P values in bold denote significance at P < 0.05 level.
Sociodemographic variables associated with an increased likelihood of pathologic ≥T2 included lowest quartile of education (OR = 1.13, P = 0.027), no insurance vs. any insurance (OR = 1.79,, P < 0.001) black vs. white race, (OR = 1.17, P = 0.046), Hispanic ethnicity (OR = 1.66, P < 0.001), residence in an urban vs. metropolitan (OR = 1.19, P = 0.007) and rural vs. metropolitan area (OR = 1.16 P = 0.008), treatment at an academic/research vs. community cancer program (OR, = 1.32, P < 0.001) and older age (OR = 1.01, P < 0.001). A subanalysis showed a significant increase in the likelihood of pathologic ≥T2 for the lowest vs. highest quartile of education (OR = 1.42, P < 0.001).
Sociodemographic variables associated with an increased likelihood of pathologic node positive disease included Hispanic ethnicity (OR = 1.46, P < 0.001), residence in an urban vs. metropolitan area (OR = 1.37, P = 0.001) and rural vs. metropolitan area (OR = 1.69, P = 0.009), younger age (OR = 1.04, P = 0.001), treatment at an academic/research hospital (OR = 1.59, P < 0.001) with a trend for greater pN+ likelihood in the Mid-Atlantic region of the United States (OR = 1.20, P = 0.076).
Sociodemographic variables associated with cT to pT upstaging included lack of insurance (OR = 2.05, P = 0.001), residence in an urban vs. metropolitan area (OR = 1.35, P = 0.031), treatment at an academic vs. community hospital (OR = 1.33, P = 0.012), living in a region other than the Mid-Atlantic (OR = 1.52, P = 0.019), East North central (OR = 1.39, P = 0.029) or West South Central (OR = 1.47, P = 0.065) regions, older age (OR = 1.02 P < 0.001) ≤cT1 vs. ≥cT2 (OR = 2.56, P < 0.001 and, year of diagnosis (OR = 1.05, P = 0.001). There was a trend for black vs. white race to be associated with a reduced likelihood of upstaging (OR = 0.71, P = 0.100).
3.3. Treatment delays
The median number of days from diagnosis to the first treatment received was 27 days (IQR: 13–47 days).
Sociodemographic variables associated with treatment delays included residence in an area other than the east south central region (P = 0.013) or west north central region (P = 0.033), non-Hispanic ethnicity (P = 0.015) and a trend distance from the patient’s home to the treatment center (P = 0.067). Year of diagnosis was associated with greater delay (P = 0.001) whereas treatment at an academic center was also associated with greater treatment delay (P < 0.001). ≥cT2 vs. ≤cT1 was associated with a shorter time to first treatment (P < 0.001).
3.4. Survival
Kaplan-Meier analyses showed a 61.5% 5-year OS. Median follow-up was 41.7 months.
Sociodemographic factors associated with worse OS in the multivariable Cox regression model included black race (hazard ratio [HR] = 1.56, P < 0.001), residence in an urban vs. metropolitan residence (HR = 1.18, P = 0.022) and older age (HR = 1.04, P < 0.001). Additional factors included Charlson score (HR = 1.49, P < 0.001), ≥cT2 vs. ≤cT1 (HR = 1.54, P < 0.001), cN+ vs. cN0 (HR = 3.19, P < 0.001); cN+ vs. cNx (HR = 2.66, P < 0.001) and squamous vs. non-SCC (HR = 1.29, P = 0.004). Additional trends identified included lack of insurance (HR = 1.25, P = 0.095) and lowest quartile of income (HR = 1.11, P = 0.113) (Figs. 2–4).
Fig. 2.

Overall survival for all patients in the NCDB with penile cancer.
Fig. 4.

Overall survival by residential group of the patient.
4. Discussion
In the present study in patients with PC, higher T stage and presence of clinical N1 disease are primary drivers of PC related death [1,10,11]. We identified several socioeconomic factors that increase the likelihood that a patient will have adverse pathologic features and ultimately worse OS. Specifically, we found that patients without insurance and patients with lower education based on zip code were more likely to be diagnosed with a worse pathologic T stage. A nonsignificant trend (P = 0.062) for patients living in nonmetropolitan areas to be diagnosed with a worse pathologic T stage was also identified. Additionally, patients living in a nonmetropolitan area were more likely to be diagnosed with lymph node metastases. Socioeconomic factors were also associated with survival as black vs. white patients, patients without insurance and patients with the lowest income based on zip code had worse OS.
Early diagnosis of PC is integral to preserve sexual function, avoid penile amputation, prevent progression, and improve survival for men with this disease [11]. PC, however, is a rare disease which implies that lack of awareness of the disease and its symptoms likely contribute to delays in diagnosis and ultimately a worse prognosis. In patients with lower education levels, the lack of awareness of PC and its symptoms is likely even higher. As evidenced in the present study, among patients with a lower education based on zip code, the likelihood of being diagnosed with a worse pathologic T stage was significantly higher. This has also been seen in a Swedish cohort in which Torbrand et al. [12] who found that men with low levels of education (≤9 years of school) were twice as likely to have pT3–pT4 vs. pT1–pT2 PC. Similarly, in a study by Bernard et al. [14], lower education and higher poverty were found to be associated with invasive PC incidence rates, among other human papilloma virus-associated cancers. Patient education and outreach programs in areas with lower levels of education are among the efforts that may reduce the adverse pathologic influence that a lower education appears to portend. Specifically, increased awareness, understanding and exposure to PC in educationally disadvantaged areas may prompt a more rapid pursuit of medical attention among these men and result in diagnosis and treatment of a lower stage of disease.
Interestingly, patients may not be the only group of people with limited awareness of this rare disease as medical providers may sometimes be faulted for a delay in diagnosis and treatment as well. In a study examining the sources of delay in referral to a urology clinic for PC, one-fifth of patients with PC were found to be first referred to specialties other than urology, which resulted in an average delay in appropriate diagnosis and treatment of up to 6 months [15]. Unsurprisingly with such delays, 47% of patients in the study were diagnosed with locally advanced disease. Professional vigilance and awareness of PC among medical professionals may also facilitate earlier diagnosis through proper referrals, which will potentially improve prognosis and outcomes for patients with PC.
Psychosocial factors including the patient’s experience [16–19], embarrassment and denial are also factors that exacerbate treatment delays [19–22]. Specifically, in a study by Skeppner et al. [21] which assessed initial factors and symptoms associated with delay in the diagnosis and treatment of PC, the most common reason for delay included feelings of embarrassment over symptoms localized to the genital area. As exposure to stimulus is known to enhance an individual’s attitude toward that stimulus, increased awareness, and education exposure to this disease may also reduce embarrassment, denial, and cause more men with PC symptoms to seek medical care [23].
Perhaps one of the most considerable reasons leading to a delay in diagnosis and treatment of any disease process is socioeconomic disadvantage and lack of access to health care services. Our data show that men with no insurance have a higher likelihood of pT ≥ 2 and that a lower income was associated with an increased risk of death. This has been previously observed; McIntyre et al. [24] found that uninsured patients were more likely to present with advanced disease. This was also substantiated in a study by Sharma et al. [13] finding that men with PC in United States who have private insurance were less likely to have higher stage and lymph node positive disease; and that men with a median income ≥$63,000 were more likely to have a lower pT stage. Similarly, a study of Swedish men with PC cited perceived discrimination and socioeconomic disadvantage as being independently associated with a delay in, or refrain from, seeking medical attention [25].
Disparities in access and quality of care may not only relate to socioeconomic status but likewise to race. According to the United States Department of Health and Human Services, black patients had worse access to care than whites for 32% of access measures and received worse care than white patients for 41% of quality measures [26]. Our study shows black vs. white race to be associated with lower OS, a finding observed in a previous study examining racial disparities in the treatment of PC [13]. Interestingly in our study, when adjusted for socioeconomic status and pathological factors, no difference was seen in access to care between black and white men with PC, however, black patients still had worse survival. This further argues for more targeted approaches in identifying those at increased risk for a poorer prognosis and worse outcome in order to increase awareness within these high-risk cohorts.
Evidence-based approaches that effectively reduce the socioeconomic disparities associated with outcomes of other cancers have been described in the literature. Initiatives to reduce these disparities are almost universally geared toward improving screening methods in high-risk populations. Although screening for PC may not be feasible given its rarity, efforts localized to socioeconomically disparate populations to raise awareness of the disease and to stress the importance of well-visits and general screening may reduce the psychological distress often associated with seeking initial medical attention for a genital lesion through exposure and access. Generalists often see patients for well-visits and refer for screening tests, thus, improving education among generalists in areas of men’s health to include PC allows for identification of men at higher risk for PC and stresses the importance of a thorough genitourinary examination in these men.
In the present study, we observed a trend for the time from diagnosis to treatment to be relatively prolonged in patients with lower income, suggesting that for lower income patients, treatment delay may be driving worse survival. The lack of an association between other socioeconomic factors and treatment delays suggests that worse survival and more aggressive presentation among men with PC stem not from the interval between diagnosis to treatment, but rather from the interval between initial symptomatology or disease presentation to evaluation and diagnosis. Notably, a significant factor associated with upstaging from diagnosis to treatment was clinical stage. Specifically, patients with a lower clinical stage (≤cT1 vs. ≥cT2) were more likely to be upstaged at final pathology. Stage of disease is a significant prognostic factor associated with OS. Thus, improving the accuracy of upfront clinical staging with more thorough clinical examination and imaging is necessary to improve stratification and to avoid under-staging of what is thought to be low T classification PC.
Limitations include the retrospective design and inability to adjust for several confounding factors such as smoking status and functional status. Additionally, income and education of the patients were inferred based on the patient’s zip code and is, therefore, a biased estimate of a patient’s actual income and education level. Furthermore, predictors of advanced disease stage, including chemotherapy and preoperative radiation therapy, were not elicited from this data set. We must also acknowledge that OS, and not cancer specific survival or metastasis-free survival, was captured in this database and so conclusions must bear this limitation in mind.
5. Conclusions
Our study is among the first to provide a comprehensive multivariable analysis of the relationship between socioeconomic factors and adverse pathologic features related to PC. Socioeconomic factors including education, area of residence, and insurance status were associated with pathologic ≥T2 and lymph node metastases. Black race and lack of insurance were associated with worse survival. Further investigation of the potentially modifiable risk factors for more advanced PC are necessary. Likewise, increased awareness of this rare disease may reduce treatment delays, improve prognosis, and ultimately prevent deaths among socioeconomically disadvantaged men with PC.
Fig. 3.

Overall survival by race.
References
- [1].Siegel RL, Miller KD, Jemal A. Cancer statistics. CA Cancer J Clin 2016;66:7–30. [DOI] [PubMed] [Google Scholar]
- [2].Barnholtz-Sloan JS, Maldonado JL, Pow-sang J, Giuliano AR. Incidence trends in primary malignant penile cancer. Urol Oncol 2007;25:361–7. [DOI] [PubMed] [Google Scholar]
- [3].Misra S, Chaturvedi A, Misra NC. Penile carcinoma: a challenge for the developing world. Lancet Oncol 2004;5:240–7. [DOI] [PubMed] [Google Scholar]
- [4].Bleeker MCG, Heideman DAM, Snijders PJF, Horenblad S, Dillner J, Meijer CJLM. Penile cancer: epidemiology, pathogenesis and prevention. World J Urol 2009;27:141–50. [DOI] [PubMed] [Google Scholar]
- [5].Rubin MA, Kleter B, Zhou M, et al. Detection and typing of human papillomavirus DNA in penile carcinoma. Am J Pathol 2001;159:1211–8. [DOI] [PMC free article] [PubMed] [Google Scholar]
- [6].Cubilla AL, Velazquez EF, Young RH. Epithelial lesions associated with invasive penile squamous cell carcinoma: a pathologic study of 288 cases. Int J Surg Pathol 2004;12:351–64. [DOI] [PubMed] [Google Scholar]
- [7].Goodman MT, Hernandez BY, Shvetsov YB. Demographic and pathologic differences in the incidence of invasive penile cancer in the United States, 1995–2003. Cancer Epidemiol Biomarkers Prev 2007;16:1833–9. [DOI] [PubMed] [Google Scholar]
- [8].Daling JR, Madeleine MM, Johnson LG, et al. Penile cancer: importance of circumcision, human papillomavirus and smoking in in situ and invasive disease. Int J Cancer 2005;116:606–16. [DOI] [PubMed] [Google Scholar]
- [9].Anic GM, Giuliano AR. Genital HPV infection and related lesions in men. Prev Med 2011;53:S36–41. [DOI] [PMC free article] [PubMed] [Google Scholar]
- [10].Kirrander P, Sherif A, Friedrich B, Hakansson Lambe M. Swedish national penile cancer register: incidence, tumour characteristics, management and survival. BJU Int 2016;117:287–92. [DOI] [PubMed] [Google Scholar]
- [11].Ficarra V, Akduman B, Bouchot O, Palou J, Tobias-Machado M. Prognostic factors in penile cancer. Urology 2010;76(2):S66–73. [DOI] [PubMed] [Google Scholar]
- [12].Torbrand C, Wigertz A, Drevin L, et al. Socioeconomic factors and penile cancer risk and mortality: a population-based study. BJU Int 2016;119(2):254–60. [DOI] [PubMed] [Google Scholar]
- [13].Sharma P, Ashouri K, Zargar-Shoshtari K, et al. Racial and economic disparities in the treatment of penile squamous cell carcinoma: Results from the National Cancer Database. Urol Oncol 2016;34(3):122–e9. [DOI] [PubMed] [Google Scholar]
- [14].Bernard VB, Johnson CJ, Thompson TD, et al. Examining the association between socioeconomic status and potential human papillomavirus-associated cancers. Cancer 2008;113:2910–8. [DOI] [PubMed] [Google Scholar]
- [15].Lucky MA, Rogers B, Parr NJ. Referrals into a dedicated British penile cancer centre and sources of possible delay. Sex Transm Infect 2009;85:527–30. [DOI] [PubMed] [Google Scholar]
- [16].Clegg LX, Reichman ME, Miller BA, et al. Impact of socioeconomic status on cancer incidence and stage at diagnosis: selected findings from the surveillance, epidemiology, and end result: national longitudinal mortality study. Cancer Causes Control 2009;20:417–35. [DOI] [PMC free article] [PubMed] [Google Scholar]
- [17].Richards MA, Smith P, Ramirez AJ, Fentiman IS, Rubens RD. The influence on survival of delay in the presentation and treatment of symptomatic breast cancer. Br J Cancer 1999;79:858. [DOI] [PMC free article] [PubMed] [Google Scholar]
- [18].Woods LM, Rachet B, Coleman MP. Origins of socio-economic inequalities in cancer survival: lessons from Danish studies. Eur J Cancer 2008;44:1933. [DOI] [PubMed] [Google Scholar]
- [19].Yu XQ, O’Connell DL, Gibberd RW, Armstrong BK. Assessing the impact of socio-economic status on cancer survival in New South Wales, Australia 1996–2001. Cancer Causes Control 2008;19:1383–90. [DOI] [PubMed] [Google Scholar]
- [20].Gao W, Song LB, Yang J, et al. Risk factors and negative consequence of patient’s delay for penile carcinoma. World J Surg Oncol 2016;14:124. [DOI] [PMC free article] [PubMed] [Google Scholar]
- [21].Skeppner E, Andersson SO, Johansson JE, Windahl T. Initial symptoms and delay in patients with penile carcinoma. Scand J Urol Nephrol 2012;46:319–25. [DOI] [PubMed] [Google Scholar]
- [22].Smith LK, Pope C, Botha JL. Patients’ help-seeking experiences and delay in cancer presentation: a qualitative synthesis. Lancet 2015;366:825–31. [DOI] [PubMed] [Google Scholar]
- [23].Zajonc RB. Attitudinal effects of mere exposure. J Person Soc Psychol 1968;9:1. [Google Scholar]
- [24].McIntyre M, Weiss A, Wahlquist A, Keane T, Clarke H, Savage S. Penile cancer: an analysis of socioeconomic factors at a southeastern tertiary referral center. Can J Urol 2011;18:5524–8. [PubMed] [Google Scholar]
- [25].Wamala S, Merlo J, Bostrom G, Hogstedt C. Perceived discrimination, socioeconomic disadvantage and refraining from seeking medical treatment in Sweden. J Epidemiol Community Health 2007;61:409–15. [DOI] [PMC free article] [PubMed] [Google Scholar]
- [26].Disparities in Healthcare Quality Among Racial and Ethnic Groups: Selected Findings from the 2011 National Healthcare Quality and Disparities Reports. September 2012; Agency for Healthcare Research and Quality, Rockville, MD. http://archive.ahrq.gov/research/findings/nhqrdr/nhqrdr11/minority.html. [accessed July 2016]. [Google Scholar]