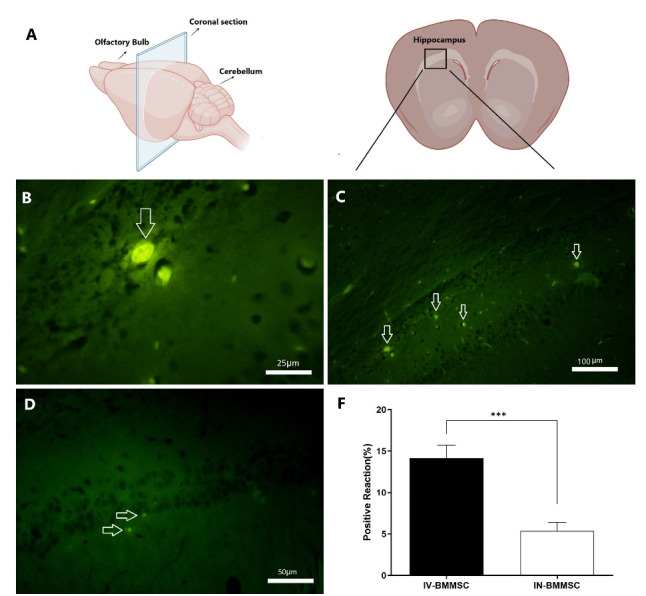
Fig. 2.

The location of BMMSCs after transplantation. (A), Schematic diagrams showing the rat brain regions examined (Retrieved from https://app.biorender.com/biorender-templates);(B), The BrdU-labeled BMMSCs exhibited clear nuclear and faint cytoplasmic green fluorescence. In comparison with the IV BMMSCs group, many BrdU-labeled cells were detected in the hippocampus of the BMMSC-treated group 14 days post-transplantation. (C), IV BMMSCs group; (D), IN BMMSCs group; (E), BMMSCs were significantly higher in IV-BMMSC group than in the IN-BMMSC (*** P <0.001).
