

Abstract
Thailand has set a goal of eliminating malaria by 2024 in its national strategic plan. In this study, we used the Thailand malaria surveillance database to develop hierarchical spatiotemporal models to analyze retrospective patterns and predict Plasmodium falciparum and Plasmodium vivax malaria incidences at the provincial level. We first describe the available data, explain the hierarchical spatiotemporal framework underlying the analysis, and then display the results of fitting various space–time formulations to the malaria data with the different model selection metrics. The Bayesian model selection process assessed the sensitivity of different specifications to obtain the optimal models. To assess whether malaria could be eliminated by 2024 per Thailand’s National Malaria Elimination Strategy, 2017–2026, we used the best-fitted model to project the estimated cases for 2022–2028. The study results based on the models revealed different predicted estimates between both species. The model for P. falciparum suggested that zero P. falciparum cases might be possible by 2024, in contrast to the model for P. vivax, wherein zero P. vivax cases might not be reached. Innovative approaches in the P. vivax-specific control and elimination plans must be implemented to reach zero P. vivax and consequently declare Thailand as a malaria-free country.
Subject terms: Diseases, Health care
Introduction
Thailand has successfully reduced indigenous malaria transmission, the cases contracted locally dropped from 150,000 cases in 2000 to 24,850 cases in 2015, with a morbidity rate of 0.38 per 1000 population1. Annual malaria-related mortality dropped significantly from 38,046 in 1949 to only 13 reported deaths in 2019 despite the resurgence of multidrug-resistant malaria over the decades2. Thailand’s last recorded 2836 indigenous cases in 2020 suggest that the designation of a malaria-free country by WHO is within reach2. In 2021, Thailand became one of 8 new countries eligible to eliminate malaria by 20252, and the country’s national malaria control program has set a goal of eliminating malaria by 2024 in its national strategic plan.
A deeper understanding of the epidemiology of malaria in the last few foci in the country is essential for targeted monitoring and timely elimination. Prediction modeling using spatiotemporal statistics as part of an integrated malaria management system could help refine the analysis, allowing for micro-level precision and informing the development of effective elimination strategies3. As we noted in our previous work, developing these quantitative models is essential for monitoring and forecasting large-scale spatiotemporal processes of malaria4. When using a disease mapping framework, selecting appropriate linear predictors remains critical, especially when data involve spatial and temporal structures. Many methods (e.g., variable selection, model averaging, and transformation selection) have been proposed and utilized to achieve these goals (see examples in5–7). In certain conditions, the model selection procedure may be more relevant than simply using variable selection5.
In this study, we used the Thailand malaria surveillance database to develop hierarchical spatiotemporal models to analyze retrospective patterns and predict Plasmodium falciparum and Plasmodium vivax malaria incidences at the provincial level. We first describe the available data, explain the hierarchical spatiotemporal framework underlying the analysis, and then display the results of fitting various space–time formulations to the malaria data with the different model selection metrics. The Bayesian model selection process assessed the sensitivity of different specifications to obtain the optimal models for the analyses. We also evaluated the malaria model performance retrospectively based on the 2015–2021 national surveillance data. To assess whether malaria could be eliminated by 2024 per Thailand’s National Malaria Elimination Strategy, 2017–2026, we used the best-fitted model to project the estimated cases for 2022–2028.
Methods
Malaria surveillance data
Previous literature suggests that a well-established and integrated surveillance system could serve as an instructive infrastructure for planning disease control and elimination strategies1,2,8. The dramatic reduction of malaria incidence in Thailand was partly because of an effective electronic-based malaria surveillance system which included inputs and actions from all related stakeholders at the national and local levels2. The Division of Vector-borne Diseases (DVBD), in collaboration with the Center of Excellence in Biomedical and Health Informatics (BIOPHICS) of the Faculty of Tropical Medicine, Mahidol University, has developed a web-based Malaria Information System8, which has been modified and scaled-up nationwide. The system collects assorted data, including incident cases, diagnostics, locations, travel histories, vector characteristics and behavior in endemic villages and prevention and control activities such as insecticide-treated net distributions and indoor spraying of houses. The system’s functionalities include analyses and automated presentations of information and reports in table, graph and map formats. The system also generates granular information on malaria cases and affected villages (foci) which can be used for planning and monitoring malaria elimination activities2,8. This study analyzed 2015–2021 data from this malaria information system. The analyses were conducted using secondary data. This study was waived for informed consent of participants and approved by the Institutional Review Board of the Faculty of Tropical Medicine, Mahidol University (MUTM EXMPT 2022-002). All methods were carried out in accordance with relevant guidelines and regulations.
Bayesian spatiotemporal modeling for provincial malaria incidence
To estimate malaria incidence, classical approaches do not consider the spatial dependence among the areas9. We applied Bayesian spatiotemporal modeling that considers both spatial and temporal dependence among space and time dimensions. A Bayesian disease mapping model consists of three components: likelihood (the distribution of the data given the parameters), the process model (a description of underlying spatiotemporal pattern) and the parameter model (the prior knowledge of the parameters to be estimated)10. We modeled the malaria data from the passive surveillance database consisting of aggregate case counts in each province. The Negative Binomial (NB) base distribution with an overdispersion parameter was considered to capture the variability in the likelihood. This gives rise to
| 1 |
where is the number of new malaria cases in province i and year t. Although the Poisson likelihood has been widely applied as a standard practice in Bayesian disease mapping11–14, assuming a negative binomial model was appealing because of overdispersion, i.e. its variance exceeds the mean, is evident relatively to the Poisson15. Particularly, is the conditional mean of the Negative Binomial base distribution and where is the offset defined as the population at risk for each location and time. The quantity is an overdispersion parameter and as , the negative binomial converges to a Poisson distribution corresponding to no overdispersion.
The process and parameter models were formulated to describe the underlying structure and associated parameters linked to the mean incidence. Many processes and models allowing for space and time variation of disease incidence have been proposed in the literature (see examples12,16–18). A log-linear model is usually applied in standard Bayesian disease mapping to link with the linear predictor as . We included both structured and unstructured random effects in the log-linear predictor to counter unmeasured confounders. The unstructured random effect, , is often modeled by a Normal prior distribution with zero mean and variance . The spatially structured effect, , is usually specified as the intrinsic conditional autoregressive (ICAR) model developed by Besag et al.19. This prior has a conditional form of where the vector represents the correlated effect of all except the ith province. , and are a set of the first-order spatial neighbors, cardinality and the average of the neighborhood of the ith province respectively. is the variance of spatial component. Thus, we have the spatial component of the model as where is the overall intercept.
To extend the process and parameter models to both space and time dimensions, Bernardinelli et al. proposed a Bayesian model with parametric time trends20. A main linear time effect and differential time trend for each location were added to the spatial components. The linear predictor is thus written as . The parameter represents an overall linear time trend whereas captures the interaction between the linear time trend and the location effect vi and ui, respectively. This formulation shares similarities with the random slope modeling. We imposed a linearity constraint on the differential temporal trend , nonetheless it is possible to remove it using a dynamic nonparametric formulation for the linear predictor as.
| 2 |
The nonparametric term represents the temporally structured effect which can be modeled as a random walk prior of order 1 or 2, or a Gaussian exchangeable prior. The specification of the prior on depends on the spatial and temporal main effects, which are assumed to interact. Four types of interactions are proposed21, and each interaction type can be interpreted in a different way creating a large number of possible models for the provincial malaria incidence. More details on model specification, hotspot analysis, and computation used in this study can be found in the “Supplementary Document”.
Model sensitivity analysis and selection criteria
To assess the model sensitivity and performance of different specifications in the previous section, we applied various evaluation metrics to measure model outcomes. Five metrics evaluated the performance of developed models: deviance information criterion (DIC), Watanabe-Akaike information criterion (WAIC), bias, root mean squared error (RMSE), and Spearman’s correlation coefficient. Forms of model assessment involve measuring the goodness-of-fit (GOF) to evaluate whether the particular data in space and time provide an adequate fit to the model. The deviance information criterion (DIC)22 has been widely used for overall model fit in Bayesian settings generalized from the Akaike information criterion (AIC) in the Frequentist framework. Another is the Watanabe-Akaike information criterion (WAIC)23 considered an improved DIC version. WAIC is fully Bayesian, applying the entire use of the posterior distribution, and unlike DIC, it is robust against different parametrizations and is valid for singular models24. To investigate the estimation uncertainty, we calculated the RMSE, as the squared root of the average squared deviation between the observed and estimated means across the provinces and study time periods. We also calculated the Spearman’s correlation coefficient between the observed and estimated malaria cases. Since the malaria incidence data in the elimination period are not normally distributed13,14, Spearman’s correlation coefficient was the most appropriate. Finally, we also employed the conditional predictive ordinate (CPO), a model assessment criterion with cross-validation using posterior sampling, computed as 17. For each observation, CPOit was calculated by fitting the model with all the data except for the observation yit. The metric was then computed as and a smaller value of this quantity indicates a better fit of the model to the data.
Model selection and prediction
In this study, we analyzed the surveillance data from 77 Thai provinces and selected hotspots of high-risk provinces along its three international borders: northwest (Thailand–Myanmar), northeast (Thailand–Cambodia) and south (Thailand–Malaysia). As the epidemiology of the two dominant malaria species in Thailand were different and elimination efforts would require different strategies, we performed separate model fits for P. falciparum and P. vivax.
Based on the identified best-fitted models for the observed surveillance cases per 100,000 population at the provincial level in 2015–2021, we predicted the number of cases per 100,000 population in 2022–2028. The predicted malaria cases were computed from the optimal models derived from the model selection process for each species.
Ethics approval
This study was waived for informed consent of participants and approved by the Institutional Review Board of the Faculty of Tropical Medicine, Mahidol University (MUTM EXMPT 2022-002). All methods were carried out in accordance with relevant guidelines and regulations.
Results
Reported malaria cases during 2015–2021
Thailand experienced a decrease in malaria cases from 2015 to 2021. As shown in Fig. 1, the total number of cases over the seven years was 10,967 cases for P. falciparum and 51,973 for P. vivax. The number of P. falciparum cases dropped from 5578 in 2015 to 52 in 2021. The number of P. vivax cases dropped from 13,675 in 2015 to 2817 in 2021.
Figure 1.
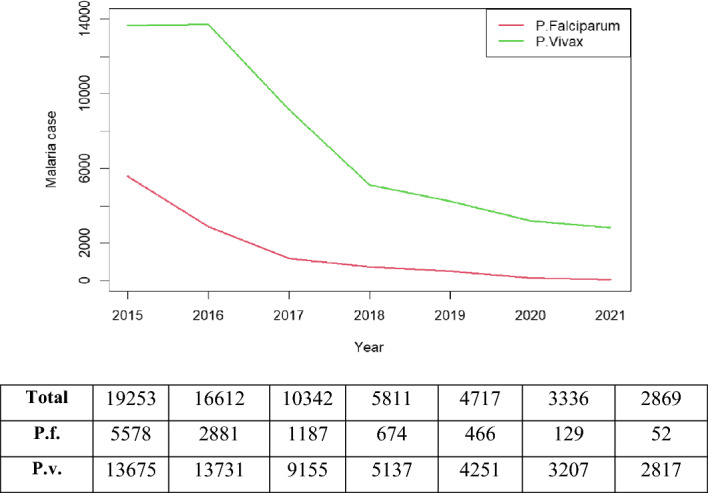
Annual number of P. falciparum and P. vivax malaria cases from the national passive surveillance database during 2015–2021. Note: Total = Pf + Pv. (Figure prepared using RStudio 2022.02.3 + 492 "Prairie Trillium", www.r-project.org/).
Spatiotemporal model specification
We constructed different spatiotemporal model formulations (see the Supplementary Document S1–S3 and S6 for more details) with evaluation measures. As random effects can be used in different ways, we thus included them in our models to account for additional space–time variation in either structured or unstructured terms. We proposed model variants with different forms of random effects. For spatial random effects, we applied an independent zero-mean Gaussian prior as the unstructured terms in the model, and an Intrinsic Conditional Autoregressive (ICAR), i.e. Besag and BYM, combined with the unstructured in other models. For the temporal dimension, the structured part was provided as the fixed effect of linear time (under log link) and the unstructured was modeled by Gaussian exchangeable prior. Thus, the model specifications covered various forms of space–time variation with both structured and unstructured terms.
Table 1 displays the results of all 18 model forms that we explored. In models 1–6, only the random intercept terms were included in the analysis. For the first two models, we captured the temporal variation in the parametric linear form with a common coefficient. The spatial random effect with the independent zero-mean Gaussian prior was only included in model 1, while the random intercept was implemented using both the unstructured and Besag (BYM) prior in model 2. Models 3–4 were similar to models 1–2, but the nonparametric dynamic trend was added to capture the temporal variation in addition to the parametric term. The models allowed for interaction between provinces and time periods, was added in models 5 and 6. Models 7–12 were specified as random slope modeling with a zero-mean Gaussian exchangeable prior on the temporal coefficient. Models 13–18 were assumed to have a BYM prior for each provincial slope while accounting for spatial structure on the temporal coefficient.
Table 1.
Spatiotemporal model selection for total malaria cases reported within the national malaria surveillance system under different evaluation measures.
| Model specification | P. falciparum | P. vivax | |||||||||
|---|---|---|---|---|---|---|---|---|---|---|---|
| DIC | WAIC | CPO | RMSE | Correlation | DIC | WAIC | CPO | RMSE | Correlation | ||
| 1 | 1952.04 | 1954.56 | 979.7706 | 1319.66 | 0.833 | 2937.93 | 2938.49 | 1481.57 | 5097.74 | 0.871 | |
| 2 | 1944.26 | 1948.84 | 976.6073 | 1389.93 | 0.833 | 2936.44 | 2937.27 | 1480.909 | 5134.02 | 0.871 | |
| 3 | 1951.87 | 1954.38 | 980.7353 | 1320.14 | 0.833 | 2937.96 | 2938.42 | 1480.313 | 5098.28 | 0.871 | |
| 4 | 1944.45 | 1948.23 | 975.7881 | 1388.12 | 0.834 | 2932.67 | 2933.84 | 1479.207 | 5582.71 | 0.870 | |
| 5 | 1950.35 | 1947.86 | 980.549 | 1219.11 | 0.838 | 2937.82 | 2937.01 | 1479.643 | 5091.68 | 0.871 | |
| 6 | 3265.29 | 3264.90 | 975.8496 | 14,786,840 | 0.047 | 2933.12 | 2934.33 | 1479.322 | 5582.75 | 0.870 | |
| 7 | 1928.09 | 1917.69 | 1269.74 | 1105.02 | 0.857 | 2866.06 | 2861.71 | 1456.68 | 4924.84 | 0.896 | |
| 8 | 3265.07 | 3265.04 | 1271.623 | 14,778,320 | 0.042 | 2864.84 | 2860.31 | 1482.521 | 4981.46 | 0.896 | |
| 9 | 1893.01 | 1895.27 | 958.7819 | 1106.91 | 0.855 | 2839.20 | 2836.38 | 1437.938 | 5122.64 | 0.897 | |
| 10 | 1889.57 | 1889.85 | 956.4324 | 1250.99 | 0.856 | 2839.23 | 2835.83 | 1437.876 | 5121.92 | 0.897 | |
| 11 | 3265.34 | 3265.06 | 16,985 | 14,692,530 | 0.051 | 4457.59 | 4457.41 | 2085.997 | 11,515,190 | 0.064 | |
| 12 | 3265.21 | 3265.00 | 36,325.52 | 14,793,130 | 0.042 | 2865.98 | 2861.49 | 1479.603 | 4940.03 | 0.896 | |
| 13 | 3265.18 | 3265.14 | 1293.974 | – | – | 4457.98 | 4457.53 | 1489.904 | – | – | |
| 14 | 1923.90 | 1915.88 | 1236.543 | 1290.56 | 0.857 | 4453.43 | 4457.44 | 1476.241 | 11,668,590 | 0.056 | |
| 15 | 1893.35 | 1896.39 | 961.5975 | 1329.73 | 0.850 | 4420.25 | 4423.98 | 1447.454 | 6,955,985 | -0.017 | |
| 16 | 1883.37 | 1886.50 | 953.3092 | 1512.20 | 0.852 | 67,920.58 | 103,280.35 | 1467.131 | 8.31E + 91 | -0.352 | |
| 17 | 1764.73 | 1747.49 | 959.8387 | 131.35 | 0.888 | 4457.60 | 4457.29 | 1886.988 | 11,619,540 | 0.060 | |
| 18 | 3265.37 | 3265.10 | 1394.047 | 14,871,990 | 0.038 | 4457.57 | 4457.33 | 1483.143 | 11,674,360 | 0.057 | |
Significant values are in [bold].
Various evaluation metrics were computed to assess the performance of different models for each malaria species. Based on these metrics, we selected the models that had the best overall performance. Table 1 shows the results of our model selection for total malaria cases. model 17, which contained the unstructured spatial random effect, temporal parametric with spatial random slope, nonparametric temporal and their interaction terms, had the best performance. Though models 16 and 17 had the lowest CPO values, with model 16 having a slightly better CPO value, considering other model criteria, model 17 had the best performance based on various model fit indicators and was selected as the best overall fit for total P. Falciparum malaria cases. For total P. vivax malaria cases, models 9 and 10 performed similarly. However, model 10, which included the BYM prior, temporal parametric with non-spatial random effect and nonparametric temporal terms, yielded a better CPO value with a better value of WAIC. Therefore, we selected model 10 to interpret the results for total P. vivax malaria cases. In Table 2, we presented the spatiotemporal model selection results for indigenous malaria cases under different evaluation measures. Model 9 was chosen to interpret the results for both spicies based on the best overall performance across these measures. (Note blank cells in Tables 1 and 2 were values that could not be computed. This might be because the model specifications were not suitable for the data used in this project.)
Table 2.
Spatiotemporal model selection for indigenous malaria cases who locally contracted with no evidence of importation or link to the imported case under different evaluation measures.
| Model specification | P. falciparum | P. vivax | |||||||||
|---|---|---|---|---|---|---|---|---|---|---|---|
| DIC | WAIC | CPO | RMSE | Correlation | DIC | WAIC | CPO | RMSE | Correlation | ||
| 1 | 1467.02 | 1466.48 | 577.4443 | 11,804.12 | 0.220 | 1720.01 | 1704.76 | 912.3844 | 10,413.75 | 0.770 | |
| 2 | 1812.61 | 1811.82 | 1170.011 | 2.46E + 07 | 0.065 | 2595.16 | 2594.97 | 856.6552 | 24,278,245 | 0.065 | |
| 3 | 1812.35 | 1811.91 | 575.8684 | 2.46E + 07 | 0.064 | 1719.35 | 1704.58 | 862.1396 | 10,414.83 | 0.770 | |
| 4 | 1254.99 | 3012.09 | 1211.504 | 4.00E + 22 | 0.675 | 1703.08 | 1695.45 | 857.2879 | 10,440.62 | 0.770 | |
| 5 | 1486.41 | 1488.43 | 42,276.31 | 11,795.26 | 0.192 | 2595.00 | 2594.99 | 861.7181 | 24,250,633 | 0.064 | |
| 6 | 1254.33 | 2973.00 | 1335.785 | 7.68E + 22 | 0.676 | 2595.17 | 2594.93 | 11,561.31 | 24,278,489 | 0.065 | |
| 7 | 1812.30 | 1812.12 | 696.9095 | 2.46E + 07 | 0.064 | 2595.21 | 2594.89 | 913.3691 | 24,264,984 | 0.064 | |
| 8 | 1812.52 | 1812.01 | 1787.722 | 2.46E + 07 | 0.0653 | 1710.08 | 1702.16 | 863.5288 | 10,711.53 | 0.777 | |
| 9 | 1071.32 | 1045.07 | 565.648 | 11,573.53 | 0.687 | 1670.22 | 1656.51 | 841.1158 | 10,338.08 | 0.791 | |
| 10 | 1242.40 | 5288.63 | 2191.439 | 1.37E + 23 | 0.680 | 2595.12 | 2594.94 | 956.2627 | 24,249,853 | 0.064 | |
| 11 | 1812.14 | 1812.46 | 706.4263 | 2.46E + 07 | 0.064 | 1631.72 | 1618.39 | 913.7699 | 10,167.02 | 0.701 | |
| 12 | 1812.15 | 1812.49 | 1840.642 | 2.46E + 07 | 0.065 | 2595.08 | 2595.08 | 933.7631 | 24,286,765 | 0.064 | |
| 13 | 1812.14 | 1812.02 | 6686.582 | – | – | 2595.37 | 2594.91 | 882.6302 | – | – | |
| 14 | 1812.26 | 1812.33 | 5852.4 | 2.47E + 07 | 0.064 | 2595.18 | 2595.16 | 869.6824 | 24,359,758 | 0.064 | |
| 15 | 1812.45 | 1811.95 | 4948.827 | 2.47E + 07 | 0.063 | 2595.12 | 2594.89 | 1373.024 | 24,292,479 | 0.063 | |
| 16 | – | 1004.89 | 5546.253 | – | 0.604 | 2595.16 | 2595.02 | 876.4885 | 24,318,188 | 0.064 | |
| 17 | 1812.07 | 1811.88 | 6722.076 | 2.47E + 07 | 0.063 | 2595.08 | 2595.22 | 86,827.36 | 24,330,567 | 0.063 | |
| 18 | – | 1046.85 | 5596.644 | 5.54E + 112 | 0.612 | 2595.12 | 2595.11 | 870.0114 | 24,358,246 | 0.064 | |
Significant values are in [bold].
Malaria incidence at provincial level and hotspots
Table 3 presents malaria incidence per 100,000 population for both species in hotspots of Thai provinces during 2015–2021, while plots in Fig. 2 showed malaria cases on the natural logarithm scale of all provinces and hotspots. The trend of malaria cases appeared to be approximately linear under the log scale during the study period. A hotspot could be defined as any isolated location or geographically-bounded region that displays an excess of disease risk or incidence in a particular time. Since we examined the data over a 7-year period, we performed the analysis to find persistent hotspots over the study period based on the population at risk in each province averaged over the study period. We determined hotspots using a space–time anomaly detection approach by identifying exceedance probability from the number of estimates in the posterior sample which exceed a pre-specified threshold (see Supplement Document S2 for hotspot analysis details).
Table 3.
Annual incidence of malaria cases per 100,000 population in 77 Thai provinces and 6 hotspot provinces during 2015–2021. Note that the other average is the case average over other provinces excluding the 6 hotspots.
| 2015 | 2016 | 2017 | 2018 | 2019 | 2020 | 2021 | |
|---|---|---|---|---|---|---|---|
| P. falciparum | |||||||
| Total | 9.52 | 9.53 | 9.12 | 8.54 | 8.35 | 8.07 | 7.94 |
| Tak | 8.85 | 8.38 | 8.24 | 7.34 | 7.27 | 6.88 | 6.94 |
| Mae Hong Son | 6.56 | 6.03 | 5.62 | 5.46 | 5.46 | 5.52 | 6.47 |
| Ubon Ratchatani | 7.73 | 6.32 | 5.21 | 5.83 | 4.63 | 2.83 | 2.20 |
| Si Sa Ket | 5.91 | 5.02 | 6.49 | 6.45 | 4.84 | 3.18 | 3.09 |
| Yala | 6.68 | 8.62 | 7.88 | 7.15 | 6.98 | 6.66 | 5.08 |
| Narathiwat | 2.71 | 5.72 | 4.98 | 4.19 | 4.11 | 3.37 | 2.20 |
| Other average | 5.18 | 5.18 | 4.78 | 4.20 | 4.01 | 3.73 | 3.60 |
| P.Vivax | |||||||
| Total | 8.63 | 7.97 | 7.08 | 6.51 | 6.14 | 4.86 | 3.95 |
| Tak | 7.38 | 6.00 | 5.33 | 5.45 | 4.98 | 3.37 | 1.79 |
| Mae Hong Son | 5.44 | 4.77 | 4.33 | 3.69 | 1.61 | 0.69 | 2.14 |
| Ubon Ratchatani | 6.87 | 5.04 | 3.69 | 4.03 | 2.20 | -Inf | -Inf |
| Si Sa Ket | 6.47 | 4.93 | 5.20 | 4.96 | 2.83 | 0.00 | -Inf |
| Yala | 5.58 | 6.82 | 5.64 | 4.42 | 4.95 | 2.94 | 1.61 |
| Narathiwat | 6.28 | 6.32 | 4.56 | 1.39 | 2.08 | 1.10 | 1.10 |
| Other average | 4.28 | 3.62 | 2.74 | 2.17 | 1.80 | 0.52 | -0.39 |
Figure 2.

Annual number of cases (log scale) in 77 Thai provinces and 6 Hotspot Provinces, during 2015–2021: (a) P. falciparum cases and (b) P. vivax cases. Note: log(1) = 0 and log(0) = − In. (Figure prepared using RStudio 2022.02.3 + 492 "Prairie Trillium", www.r-project.org/).
Since 2015, there have been only a few P. falciparum cases per 100,000 population, especially in the central, north, and northeastern regions, except for the border areas with neighboring countries. The hotspot analysis showed six high-risk provinces, two in the northwest (Tak and Mae Hong Son), the northeast (Ubon Ratchathani and Si Sa Ket) and the south (Yala and Narathiwat). The overall trend has been monotonic decreasing (Fig. 2) as in all provinces. However, in the west, P. falciparum cases showed a slower decline. Overall the number of P. vivax cases was gradually decline over the years. The hotspot analysis showed three persistent high-risk provinces in the northwest (Mae Hong Son and Tak) and one in the south (Yala); among the six hotspot provinces, slower declining trends in these three provinces were observed with higher incidences in 2021. The spatial pattern of vivax cases was similar to falciparum but more prevalent, particularly along the borders (Figs. 3, 4). Since 2020, the high-risk areas have decreased, mostly in the west and south among the hotspot provinces.
Figure 3.

Maps of observed surveillance (2015–2021) and prediction (2022–2028) of total P. Falciparum cases per 100,000 population at provincial level. (Figure prepared using RStudio 2022.02.3 + 492 "Prairie Trillium", www.r-project.org/).
Figure 4.

Maps of observed surveillance (2015–2021) and prediction (2022–2028) of total P. Vivax cases per 100,000 population at provincial level. (Figure prepared using RStudio 2022.02.3 + 492 "Prairie Trillium", www.r-project.org/).
Observed incidences (2015–2021) and predicted incidences (2022–2028)
Figures 3 and 4 depicted the maps of P. falciparum and P. vivax observed surveillance cases (2015–2021, top row) and prediction (2022–2028, bottom row) per 100,000 population at the provincial level (Table 1). Most provinces, especially in the central, east and northeast, displayed a decreasing trend for both species.
As shown in Fig. 3, the observed surveillance data showed that since 2020, P. falciparum cases had dropped to less than 1 case per 100,000 population in all provinces except in the west. The predicted P. falciparum cases will continue to decrease all over the country. The last region with < 1 case per 100,000 is the west, and the entire country will achieve < 1 case per 100,000 in 2024. From 2015 to 2021, the number of provinces with zero P. falciparum cases increased from 51 provinces (2015) to 73 provinces (2021). Based on our selected model, from 2024 onward, all 77 provinces would have zero P. falciparum cases. We also projected estimates for 2022–2024 in the six hotspots and, similarly, in all 77 provinces, which would have zero P. falciparum cases from 2024 onward (see Supplementary Document S4 presenting the plots of P. falciparum surveillance case estimates with 95% credible band of hotspot provinces).
P. vivax cases have been more prevalent in provinces (Fig. 4). The overall trend shows a decline with scattered increases in some regions. Hotspots in the west had the highest number of cases during 2015–2021 and will persist during the projected period. The number of provinces with zero P. vivax cases increased from 46 in 2015 to 62 in 2021. Our selected model predicts that 61 provinces will achieve zero P. vivax cases during 2023–2028. Our estimates for 2022–2024 in the 6 hotspots indicated unstable trends—a slow decrease in some hotspots but an increase in others with high prediction uncertainty; for example, a hotspot in the south (Yala Province) and the west could potentially have an increase with large uncertainty in the future (see Supplementary Document S4 and S5 showing plots of P. vivax surveillance case estimates with 95% credible band of hotspot provinces).
Figure 5 depicts the maps of predicted incidence per 100,000 population at the provincial level in 2022–2028 for only indigenous cases of P. falciparum (top row) and P. vivax (bottom row). Similar results were predicted for all malaria cases. Most provinces, especially in the central, east and northeast, had a decreasing trend in both species. However, based on the selected model, all 77 provinces would have zero indigenous P. falciparum cases from 2022 onward, and 65 provinces would have zero indigenous P. vivax cases during 2023–2028.
Figure 5.

Maps of prediction (2022–2028) of indigenous P. falciparum cases (top row) and P. vivax cases (bottom row) per 100,000 population at provincial level. (Figure prepared using RStudio 2022.02.3 + 492 "Prairie Trillium", www.r-project.org/).
Discussion
In keeping with WHO’s “zero malaria” campaign, Thailand has pushed forward to eliminate malaria by 2024. However, as in the Greater Mekong subregion (GMS), Thailand has been concerned about reaching this important goal due to the COVID-19 pandemic25–27. This study is the first to develop Bayesian hierarchical spatiotemporal models utilizing the Thai malaria surveillance database that included data during the pandemic (2019–2021) to predict malaria incidence for the two dominant species, P. falciparum and P. vivax, for 2022–2028. In the model development process, we applied Bayesian model selection techniques to choose the optimal models to retrospectively analyze observed surveillance malaria data and estimate future cases for appropriate disease planning. These methods offer a very flexible modeling approach which can accommodate and potentially select between a wide range of space–time linear predictors7,28–30.
We constructed hierarchical spatiotemporal models that confirmed a drastic decrease in both P. falciparum and P. vivax cases nationwide. A potential contributing factor could be the “1–3–7” surveillance strategy adopted by the National Malaria Elimination Strategy 2017–2026. The strategy includes case reporting within 24 h, case investigation and classification within 3 days, and foci investigation and response within 7 days. The strategy has proved effective in China2,31, reaching zero indigenous malaria cases in 2018. However, recent reports suggest China’s success was aided by the application of innovative genetics-based approaches32, which included surveying malaria parasite populations and drug resistance. To achieve zero malaria by 2024, Thailand may need to implement similar approaches at the local health facility level.
Despite the observed decrease in nationwide malaria cases, the developed models also reflected high spatial heterogeneity in malaria incidence across the country. Our spatiotemporal and hotspot analysis revealed persistent malaria transmission along the border areas with Myanmar, Cambodia and Malaysia. As noted in the President’s Malaria Initiative plan, the remaining active foci in Thailand are clustered in three border areas because high population mobility is associated with the importation of malaria parasites and drug resistance in the west (Myanmar) and the east (Cambodia), whereas civil unrest has disrupted service delivery in the south (Malaysia)33. Migration and cross-border population mobility may have influenced the disease incidence25,34. A recent study on the Thailand-Myanmar border found a higher probability of villages becoming a malaria infection hotspot where the border could be easily crossed35. Differing occupational activities and access to malaria diagnosis and treatment along the border between neighboring countries1,4,35 as well as mobility of asymptomatic individuals, re-introducing infection into communities, and drug-resistant populations could prevent achieving zero malaria35–37. Thus, the WHO’s operational framework for cross-border collaboration to secure a malaria-free South-East Asia Region (2018) suggested member states prevent and/or reduce transmission and disease burden with special emphasis on minimizing the risk of importation of malaria cases38
To achieve zero malaria by 2024, Thailand's medium-term goal is zero malaria transmission in 95% of all districts by 20211. Our models of provincial levels have shown that 73 of 77 provinces had zero P. falciparum cases in 2021. Further, our models estimate that all 77 provinces would have zero P. falciparum cases after 2024. However, for P. vivax, our models predict 62 provinces with zero P. vivax cases with no increase by 2028. WHO certification of malaria elimination requires applicant countries to provide evidence that the local malaria transmission has been fully interrupted, resulting in zero indigenous malaria cases for at least 36 months39. Our models predicted zero P. falciparum cases by 2024, but not zero P. vivax cases.
As discussed in previous reports, P. vivax malaria control efforts have been less successful than for P. falciparum40–42. The prediction model suggested that P. falciparum could be eliminated earlier than P. vivax; this may, in part, be due to the intensive effort of the national malaria control program to eliminate resistance to artemisinin combination therapies with early diagnosis and efficacious drug administratiion in the reported problematic areas. Although prompt diagnosis and treatment of symptomatic patients are effective measures to prevent severe disease and reduce transmission, their success may be undermined by asymptomatic individuals and hidden reservoirs not captured in the malaria database41. P. vivax-infected individuals may have very low asexual parasite densities, mixed infections with P. falciparum, or undetectable hypnozoites40. Eliminating P. vivax malaria would require different approaches from those seen with P. falciparum, such as targeted vector control and availability of detection services (microscopic tests, genetic-based technique, or bivalent rapid diagnostic tests)40. One such initiative is mass drug administration (MDA), wherein the antimalarial treatment is offered to communities regardless of an individual’s malaria infection status. For the radical cure of P. vivax, the MDA approach must be tailored to specific settings, including targeting high-risk populations and isolated communities27. A study in Brazil confirms that the standard treatment drug (i.e., primaquine) when administered at the right dose for a sufficient time, is effective in preventing the recurrence of P. vivax malaria.42. A cross-sectional mixed-methods study on MDA to reduce vivax malaria in a northern Myanmar township suggested that most respondents agreed to participate in the proposed mass treatment campaign and that the community engagement process increased community acceptance43. Another approach to accelerate P. vivax elimination is a safe and protective vaccine, but it is unlikely to be available in the near future44. For Thailand to reach zero P.vivax, there should be P. vivax-specific control and elimination plans with specific indicators on program coverage and disease incidence.
There are some limitations in model development and prediction of malaria incidence. Bayesian models are traditionally fitted through Markov Chain Monte Carlo sampling (MCMC). Due to the nature of the hierarchical models and random effects, the convergence of MCMC can be very slow. Integrated Nested Laplace Approximation has recently been developed as an alternative method to fit Bayesian hierarchical. However, one comparison shows thar INLA is equivalent to MCMC for parameter estimation in disease mapping studies. In addition, the overall computational burden of INLA was much lower45 We then applied INLA in this project; a comparison among posterior approximation methods will be further investigated. The hierarchical models constructed in this study included various forms of both space and time random effects, which accounted for some unmeasured confounding effects12,29. We did not consider vector and environmental factors that may influence the prediction model. We encountered a computing challenge when performing the model selection, specifically, the strength of incidence trend present in the data. If there was insufficient temporal evidence in the data, the model might not be precisely identified. The prediction model fitted well for P. falciparum hotspots. However, for P. vivax, our estimation failed to perform well with greater uncertainty. The wide credible band of P. vivax estimates might be because of spatial and temporal data fluctuations, particularly for P. vivax reported cases in malaria-endemic areas. Despite these limitations, we developed a flexible spatiotemporal modeling platform that can be further modified when more resources and data are available. We believe our investigation is beneficial to understanding the spatiotemporal malaria patterns to support decisions in malaria control and elimination activities in Thailand.
Conclusions
The estimation of malaria incidence was determined using Bayesian hierarchical spatiotemporal models. Hotspots analysis based on the best-fitted models for P. falciparum and P. vivax identified several Thai provinces that persistently carry a relatively high malaria burden compared to other provinces. To project the possibility of meeting WHO’s criteria of “zero malaria” country by 2024, the models can predict malaria incidence for 2022–2028. To receive WHO’s malaria-free certification is to have investigation forms and maps on focus management and response to demonstrate the effectiveness of activities to interrupt transmission in the last foci. The spatiotemporal maps based on the models revealed different predicted estimates between both species. The model for P. falciparum suggested that zero P. falciparum cases might be possible by 2024, in contrast to the model for P. vivax, wherein zero P. vivax cases might not be reached.
The challenges to eliminating P. vivax are well recognized. It likely requires timely radical cure. Innovative approaches and best practices to improve case detection and treatment rates are essential. Further, when evaluating malaria programs in low transmission areas, surveillance should be a case-based system that can identify high-risk groups in subnational areas so that all related stakeholders can timely review and take immediate action46. For Thailand, to monitor activities in moving towards zero malaria, effective methods for area stratification or classification according to transmission intensity are required. Innovative approaches in the P. vivax-specific control and elimination plans must be implemented to reach zero P. vivax and consequently declare Thailand as a malaria-free country.
Supplementary Information
Acknowledgements
We thank the BIOPHICS of the Faculty of Tropical Medicine, Mahidol University and DVBD for their kind support in conducting this study. This work was supported by the National Institute for Allergy and Infectious Diseases, The National Institute of Health (NIH) (U19 AI089672).
Author contributions
C.R. and J.K. designed the study and prepared the manuscript; S.L., P.S., and A.K. provided inputs for study design and assisted in data management for the analysis; J.S., L.M. and L.C. provided inputs for malaria conceptual framework for the data modelling; C.R. performed data modelling. All authors reviewed and edited the manuscript.
Data availability
The data used in this study were obtained from the Division of Vector Borne Diseases, Department of Disease Control, Thai Ministry of Public Health, but restrictions apply to the availability of these data, which were used with permission for the current study, and are therefore not publicly available. However, data may be available from the authors upon a reasonable request and with permission of the Division of Vector Borne Diseases.
Competing interests
The authors declare no competing interests.
Footnotes
Publisher's note
Springer Nature remains neutral with regard to jurisdictional claims in published maps and institutional affiliations.
Supplementary Information
The online version contains supplementary material available at 10.1038/s41598-023-35007-9.
References
- 1.Bureau of Vector Borne Diseases, Department of Disease Control, Ministry of Public Health, Thailand. Guide to Malaria Elimination for Thailand’s Local Administrative Organizations and the Health Network. (Bureau of Vector Borne Diseases, Department of Disease Control, Ministry of Public Health, Thailand, 2019).
- 2.World Health Organization (WHO). Thailand gears up to eliminate malaria by 2024. https://www.who.int/news-room/feature-stories/detail/thailand-gears-up-to-eliminate-malaria-by-2024#:~:text=Thailand(2021). Accessed 15 March 2022.
- 3.Hay SI, Omumbo JA, Craig MH, Snow RW. Earth observation, geographic information systems and Plasmodium falciparum Malaria in Sub-Saharan Africa. Adv. Parasitol. 2000;47:173–215. doi: 10.1016/S0065-308X(00)47009-0. [DOI] [PMC free article] [PubMed] [Google Scholar]
- 4.Zhou G, et al. Spatio-temporal distribution of Plasmodium falciparum and P. vivax malaria in Thailand. Am. J. Trop. Med. Hygiene. 2005;72:256–262. doi: 10.4269/ajtmh.2005.72.256. [DOI] [PubMed] [Google Scholar]
- 5.Carroll R, et al. Spatially-dependent Bayesian model selection for disease mapping. Stat. Methods Med. Res. 2016;27:250–268. doi: 10.1177/0962280215627298. [DOI] [PMC free article] [PubMed] [Google Scholar]
- 6.Bondell HD, Krishna A, Ghosh SK. Joint variable selection for fixed and random effects in linear mixed-effects models. Biometrics. 2010;66:1069–1077. doi: 10.1111/j.1541-0420.2010.01391.x. [DOI] [PMC free article] [PubMed] [Google Scholar]
- 7.Sadykova D, et al. Bayesian joint models with INLA exploring marine mobile predator–prey and competitor species habitat overlap. Ecol. Evol. 2017;7:5212–5226. doi: 10.1002/ece3.3081. [DOI] [PMC free article] [PubMed] [Google Scholar]
- 8.Division of Vector Borne Diseases, Department of Disease Control, Ministry of Public Health, Thailand. Malaria Online: The Digital Surveillance System for Thailand Malaria Elimination by Division of Vector Borne Diseases, Department of Disease Control, Ministry of Public Health, THAILAND.https://publicadministration.un.org/unpsa/Portals/0/UNPSA_Submitted_Docs/2019/3fe4c1ba-e00b-4250-8816-f513c3b209c6/2020%20UNPSA_Malaria%20online_full%20report_27112019_111848_f62725d9-bd75-4846-a44c-8524838f4e87.pdf?ver=1441-03-30-111848-927. Accessed 15 March 2022.
- 9.Semakula M, Niragire F, Faes C. Bayesian spatio-temporal modeling of malaria risk in Rwanda. PLoS ONE. 2020;15:e0238504. doi: 10.1371/journal.pone.0238504. [DOI] [PMC free article] [PubMed] [Google Scholar]
- 10.Lesaffre E, Lawson AB. Bayesian Biostatistics. Wiley; 2012. [Google Scholar]
- 11.Wakefield J. Disease mapping and spatial regression with count data. Biostatistics. 2007;8:158–183. doi: 10.1093/biostatistics/kxl008. [DOI] [PubMed] [Google Scholar]
- 12.Lawson AB, Banerjee S, Haining RP, Ugarte MD. Handbook of Spatial Epidemiology. CRC Press; 2016. [Google Scholar]
- 13.Rotejanaprasert C, Lee D, Ekapirat N, Sudathip P, Maude RJ. Spatiotemporal distributed lag modelling of multiple Plasmodium species in a malaria elimination setting. Stat. Methods Med. Res. 2021;30:22–34. doi: 10.1177/0962280220938977. [DOI] [PubMed] [Google Scholar]
- 14.Rotejanaprasert C, Ekapirat N, Sudathip P, Maude RJ. Bayesian spatio-temporal distributed lag modeling for delayed climatic effects on sparse malaria incidence data. BMC Med. Res. Methodol. 2021;21:287. doi: 10.1186/s12874-021-01480-x. [DOI] [PMC free article] [PubMed] [Google Scholar]
- 15.Rotejanaprasert C, Ekapirat N, Areechokchai D, Maude RJ. Bayesian spatiotemporal modeling with sliding windows to correct reporting delays for real-time dengue surveillance in Thailand. Int. J. Health Geograph. 2020;19(1):4. doi: 10.1186/s12942-020-00199-0. [DOI] [PMC free article] [PubMed] [Google Scholar]
- 16.Rotejanaprasert C, Lawpoolsri S, Pan-ngum W, Maude RJ. Preliminary estimation of temporal and spatiotemporal dynamic measures of COVID-19 transmission in Thailand. PLoS ONE. 2020;15:e0239645. doi: 10.1371/journal.pone.0239645. [DOI] [PMC free article] [PubMed] [Google Scholar]
- 17.Blangiardo M, Cameletti M, Baio G, Rue H. Spatial and spatio-temporal models with R-INLA. Spatial Spatio-temporal Epidemiol. 2013;4:33–49. doi: 10.1016/j.sste.2012.12.001. [DOI] [PubMed] [Google Scholar]
- 18.Best N, Richardson S, Thomson A. A comparison of Bayesian spatial models for disease mapping. Stat. Methods Med. Res. 2005;14:35–59. doi: 10.1191/0962280205sm388oa. [DOI] [PubMed] [Google Scholar]
- 19.Besag J, York J, Molli A. Bayesian image restoration, with two applications in spatial statistics. Ann. Inst. Stat. Math. 1991;43:1–20. doi: 10.1007/BF00116466. [DOI] [Google Scholar]
- 20.Bernardinelli L, et al. Bayesian analysis of space–time variation in disease risk. Stat. Med. 1995;14:2433–2443. doi: 10.1002/sim.4780142112. [DOI] [PubMed] [Google Scholar]
- 21.Knorr-Held L. Bayesian modelling of inseparable space-time variation in disease risk. Stat. Med. 2000;19:2555–2567. doi: 10.1002/1097-0258(20000915/30)19:17/18<2555::AID-SIM587>3.0.CO;2-#. [DOI] [PubMed] [Google Scholar]
- 22.Spiegelhalter DJ, Best NG, Carlin BP, van der Linde A. Bayesian measures of model complexity and fit. J. R. Stat. Society Series B (Stat. Methodol.) 2002;64:583–639. doi: 10.1111/1467-9868.00353. [DOI] [Google Scholar]
- 23.Watanabe S. Asymptotic equivalence of bayes cross validation and widely applicable information criterion in singular learning theory. J. Mach. Learn. Res. 2010;11:3571–3594. [Google Scholar]
- 24.Vehtari A, Gelman A, Gabry J. Practical Bayesian Model Evaluation Using leave-one-out cross-validation and WAIC. Stat. Comput. 2016;27:1413–1432. doi: 10.1007/s11222-016-9696-4. [DOI] [Google Scholar]
- 25.Cui L, et al. Malaria in the greater mekong subregion: Heterogeneity and complexity. Acta Trop. 2012;121:227–239. doi: 10.1016/j.actatropica.2011.02.016. [DOI] [PMC free article] [PubMed] [Google Scholar]
- 26.World Health Organization (WHO). World Malaria Day 2020; About the campaign. https://www.who.int/campaigns/world-malaria-day/world-malaria-day-2020/about-the-campaign (2020). Accessed 15 March 2022.
- 27.Price RN. Bold measures to accelerate malaria elimination. Lancet Infectious Diseases. 2021;21:1480–1481. doi: 10.1016/S1473-3099(21)00003-7. [DOI] [PubMed] [Google Scholar]
- 28.Rue H, Martino S, Chopin N. Approximate Bayesian inference for latent Gaussian models by using integrated nested laplace approximations. J. R. Stat. Society Series B (Stat. Methodol.) 2009;71:319–392. doi: 10.1111/j.1467-9868.2008.00700.x. [DOI] [Google Scholar]
- 29.Blangiardo M, Cameletti M. Spatial and Spatio-Temporal Bayesian Models with R-INLA. Wiley; 2015. [Google Scholar]
- 30.Martins TG, Simpson D, Lindgren F, Rue H. Bayesian computing with INLA: New features. Comput. Stat. Data Anal. 2013;67:68–83. doi: 10.1016/j.csda.2013.04.014. [DOI] [Google Scholar]
- 31.Lertpiriyasuwat C, et al. Implementation and success factors from Thailand’s 1–3–7 surveillance strategy for malaria elimination. Malaria J. 2021;20:201. doi: 10.1186/s12936-021-03740-z. [DOI] [PMC free article] [PubMed] [Google Scholar]
- 32.Chen JH, Fen J, Zhou XN. From 30 million to zero malaria cases in China: Lessons learned for China–Africa collaboration in malaria elimination. Infect Dis Poverty. 2021;10:51. doi: 10.1186/s40249-021-00839-y. [DOI] [PMC free article] [PubMed] [Google Scholar]
- 33.U.S. PRESIDENT’S MALARIA INITIATIVE. Thailand, Lao PDR, and Regional Malaria Operational Plan FY 2020. Retrieved from (https://www.pmi.gov). Accessed 15 March 2022.
- 34.Parker DM, et al. Microgeography and molecular epidemiology of malaria at the Thailand-Myanmar Border in the Malaria pre-elimination Phase. Malaria J. 2015;14:198. doi: 10.1186/s12936-015-0712-5. [DOI] [PMC free article] [PubMed] [Google Scholar]
- 35.Thway AM, et al. Bayesian spatiotemporal analysis of malaria infection along an international border: Hlaingbwe Township in Myanmar and Tha-Song-Yang District in Thailand. Malaria J. 2018;17:428. doi: 10.1186/s12936-018-2574-0. [DOI] [PMC free article] [PubMed] [Google Scholar]
- 36.Ashley EA, et al. Spread of artemisinin resistance in Plasmodium falciparum malaria. N. Engl. J. Med. 2014;371:411–423. doi: 10.1056/NEJMoa1314981. [DOI] [PMC free article] [PubMed] [Google Scholar]
- 37.Imwong M, et al. The Spread of artemisinin-resistant Plasmodium falciparum in the Greater Mekong subregion: A Molecular Epidemiology Observational Study. Lancet. Infect. Dis. 2017;17:491–497. doi: 10.1016/S1473-3099(17)30048-8. [DOI] [PMC free article] [PubMed] [Google Scholar]
- 38.World Health Organization (WHO). An urgent front: Cross-border collaboration to secure a malaria-free South-East Asia Region. (2018).
- 39.World Health Organization (WHO). Preparing for Certification of Malaria Elimination. (2020).
- 40.Global Malaria Programme, World Health Organization (WHO). Control and Elimination of Plasmodium Vivax malaria: A Technical Brief. (2015).
- 41.Thriemer K, Ley B, von Seidlein L. Towards the elimination of Plasmodium vivax malaria: Implementing the radical cure. PLoS Med. 2021;18:e1003494. doi: 10.1371/journal.pmed.1003494. [DOI] [PMC free article] [PubMed] [Google Scholar]
- 42.Greenwood B, Drakeley C. Primaquine and Plasmodium vivax malaria recurrence in Brazil. N. Engl. J. Med. 2022;386:1282–1283. doi: 10.1056/NEJMe2201725. [DOI] [PubMed] [Google Scholar]
- 43.Aung PL, et al. The acceptability of targeted mass treatment with primaquine for local elimination of vivax malaria in a Northern Myanmar township: A mixed-methods Study. Parasites Vectors. 2021;14:549. doi: 10.1186/s13071-021-05064-y. [DOI] [PMC free article] [PubMed] [Google Scholar]
- 44.World Health Organization. Zeroing in on Malaria elimination: Final Report of the E-2020 Initiative. apps.who.int (World Health Organization, 2021).
- 45.De Smedt T, Simons K, Van Nieuwenhuyse A, et al. Comparing MCMC and INLA for disease mapping with Bayesian hierarchical models. Arch Public Health. 2015;73(Suppl 1):O2. doi: 10.1186/2049-3258-73-S1-O2). [DOI] [Google Scholar]
- 46.Ashton RA, Prosnitz D, Andrada A, Herrera S, Yé Y. Evaluating malaria programmes in moderate- and low-transmission settings: practical ways to generate robust evidence. Malaria J. 2020;19:75. doi: 10.1186/s12936-020-03158-z. [DOI] [PMC free article] [PubMed] [Google Scholar]
Associated Data
This section collects any data citations, data availability statements, or supplementary materials included in this article.
Supplementary Materials
Data Availability Statement
The data used in this study were obtained from the Division of Vector Borne Diseases, Department of Disease Control, Thai Ministry of Public Health, but restrictions apply to the availability of these data, which were used with permission for the current study, and are therefore not publicly available. However, data may be available from the authors upon a reasonable request and with permission of the Division of Vector Borne Diseases.