

Summary:
In allogeneic hematopoietic stem cell transplantation, donor αβ T cells attack recipient tissues, causing graft-vs-host disease (GVHD), a major cause of morbidity and mortality. A central question has been how GVHD is sustained despite T cell exhaustion from chronic antigen stimulation. The current model for GVHD holds that disease is maintained through the continued recruitment of alloreactive effectors from blood into affected tissues. Here we show, using multiple approaches including parabiosis of mice with GVHD, that GVHD is instead primarily maintained locally within diseased tissues. By tracking 1203 alloreactive T cell clones we fitted a mathematical model predicting that within each tissue a small number of progenitor T cells maintain a larger effector pool. Consistent with this, we identified a tissue-resident TCF-1+ subpopulation that preferentially engrafted, expanded, and differentiated into effectors upon adoptive transfer. These results suggest that therapies targeting affected tissues and progenitor T cells within them would be effective.
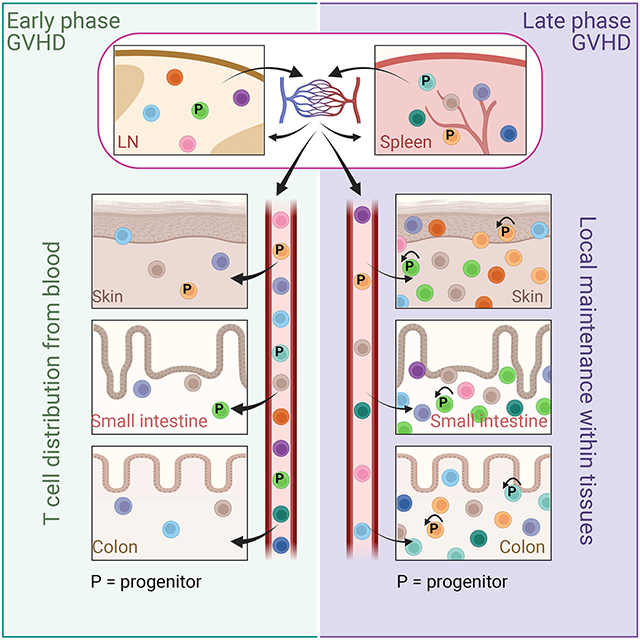
Graphical Abstract
Introduction:
Allogeneic hematopoietic stem cell transplantation (alloSCT) can be a curative therapy for malignant and nonmalignant disorders of hematopoietic cells 1. αβT cells in the donor graft that recognize recipients as “nonself ” (alloreactive) promote engraftment by attacking host hematopoietic and immune cells, and in the application of alloSCT for neoplastic diseases, such T cells can kill malignant blood-lineage cells, mediating the graft-versus-leukemia (GVL) effect. Unfortunately, alloreactive T cells also attack normal host tissues, causing graft-vs-host disease (GVHD) 2-4, and hence all recipients of T cell-replete grafts receive immunosuppressive agents. Nonetheless, GVHD and the sequelae of immunosuppression remain major causes of post-transplant morbidity and mortality. This fundamental problem has prevented a broader application of alloSCT in treating malignant diseases, as a curative therapy for inherited disorders of blood cells (e.g. sickle cell anemia and thalassemias) and common debilitating autoimmune diseases (e.g. lupus and multiple sclerosis), and to create tolerance to solid organs transplanted from the hematopoietic stem cell donor.
While the initiation of the alloreactive T cell response has been well studied 3-5, much less is known about how GVHD is established and maintained after early alloreactive T cell activation 6. We considered two principal hypotheses for GVHD maintenance. The first is the widely held notion that alloreactive T cells are continually activated and expanded in secondary lymphoid tissues (SLTs) and subsequently recruited into GVHD target tissues from blood. Such a model predicts that over time T cell clones in target tissues will mirror the clonal compositions of the SLTs from which they are replenished. This model has been a rationale for using systemic immunosuppression to treat GVHD and for the testing of agents that block T cell recruitment into tissues 7-9. Alternatively, once established, GVHD could be maintained within tissues with a relatively small input from blood-derived T cells. In this case the prediction would be that T cell clonal compositions in distinct tissues would differ and would not become more related to each other over time, as they are mostly autonomously maintained independent from a common SLT-derived clone pool.
A challenge to either model of GVHD maintenance is that chronic alloantigen stimulation induces T cell exhaustion, which reduces effector function 10-13. Hence, any explanation of GVHD maintenance must also account for how disease is sustained despite T cell exhaustion. In the present work we show through detailed T cell clone analysis and parabiosis that, once established, GVHD is largely maintained locally with tissues. We identified a tissue-resident Tcf7-expressing (protein product is TCF-1) T cell subset as a likely candidate population critical for this local intratissue GVHD maintenance. These TCF-1-expressing cells shared features with “exhausted progenitor” (Texp) CD8+ T cells described in chronic viral infections and in anti-tumor responses 14-19. Taken together, our data support a model wherein GVHD begins as a conventional systemic immune response initiated by alloreactive T cell clones distributed from SLTs, and subsequently morphs into a very different kind of systemic disease that is the sum of locally maintained inflammatory T cell responses to continued antigen exposure within each target tissue.
Clone analysis reveals local GVHD maintenance.
If GVHD is maintained locally in affected tissues, the clonal compositions of alloreactive T cells in different locations should differ due to unequal seeding and/or to heterogeneity in the conditions that maintain these clones. Alternatively, if GVHD was maintained systemically by the continued influx of new effectors expanded in SLTs, the clonal compositions of different tissues should become more related over time (Figure S1A). Distinguishing these mechanisms required the ability to track and enumerate the progeny of alloreactive GVHD-inducing single cells. We reasoned this could not be achieved in a controlled manner in multiantigen, polyclonal T-cell systems. To enable such tracking, we took advantage of a T cell receptor (TCR) transgenic GVHD model wherein GVHD is mediated by CD4+ T cells which recognize a model minor histocompatibility antigen (miHA) expressed in all recipient tissues 20,21. In this system, BALB/c Rag2−/− TCR-transgenic CD4+ T cells (TS1 cells), which recognize the S1 peptide from hemagglutinin (HA) 22, and BALB/c Rag2−/− (BALB/c) bone marrow (BM) are transplanted into irradiated BALB/c Rag2−/− HA104 mice (HA104), which express HA as a transgene expressed in all tissues 23. GVHD in such transplanted mice involves the skin, ear, liver, small bowel and colon, and has histopathology typical of GVHD mediated by polyclonal T cells (Figure S1B) 20. As all TCRs are identical, potential effects of TCR specificity or affinity on differential clonal expansion are filtered out. To create TS1 cells that could be distinguished, we crossed TS1 transgenic mice to combinations of congenic BALB/c Rag2−/− mice expressing CD45.1, CD45.2, CD90.1, CD90.2 and GFP, thereby creating a matrix of TS1 cells identifiable by flow cytometry (Figure 1A) 24. Five hundred naïve (TN) TS1 cells of one congenic type (given to induce GVHD; “bulk”) and 6-8 single uniquely marked congenic TN TS1 cells distributed by single-cell sorting were infused into irradiated Rag2−/− HA104 mice along with Rag2−/− BALB/c BM. Rag2−/− BM and hosts were used to facilitate the detection of low frequency TS1 clonal progeny. We employed this system to track the progeny of single TS1 cells across tissues in individual mice, thereby allowing us to distinguish the two hypotheses for GVHD maintenance.
Figure 1. TS1 clonal progeny distribute unequally.

(A) Experimental design. Irradiated BALB/c Rag2−/− HA104 mice were reconstituted with BALB/c Rag2−/− BM, 500 TS1 of one clonotype and single cell-sorted TS1 of 6-8 additional clonotypes. (B) Percentages of infused clones (#detected/#infused) recovered at analysis timepoints; error bars represent 95% confidence intervals obtained with nonparametric Bootstrap 57. Statistical significance was determined by Fisher’s exact test. (C) Clone distributions in 4 representative mice. Each mouse received 6-8 of 9 possible clones. (D) Clone frequencies represented as a heat map (see Supplemental Methods) at each time point. Each cell in a column depicts the frequency of a single clone in a single mouse in each tissue. Clones are ordered left to right from highest to lowest frequency. White rectangles indicate technical failures in cell isolations and gray boxes represent clones that were not detected. (E) Fraction of clones detected in 0-9 tissues. Data are from the analysis of 1203 infused clones recovered from a total of 186 mice (17 at week 1; 61 at week 2; 30 at week 3; 38 at week 4; and 40 at week 5. See Figure S1.
We tracked the progeny of 1203 infused single TS1 cells across multiple tissues in mice from 1 to 5 weeks post-transplant in 9 experiments. Clonal progeny detection was specific (Figure S1C-E). At least 10,000 TS1+ events were acquired in most samples beyond week 1 (Figure S1F). The recovery of the progeny of the trackable single TS1 cells (clones) was robust, ranging from 46% at week 1 to 87% at week 3 with 949/1203 infused clones detected, highlighting how conducive the post-transplant environment is for T cell priming (Figure 1B).
For each mouse, the frequency of the progeny of every clone in spleen, BM, mesenteric LN (mLN), epidermis, dermis, small intestine (SI) intraepithelial lymphocytes (IEL), SI lamina propria lymphocytes (LPL), colon and liver was determined. In individual mice clone distributions ranged from relatively uniform to widely discrepant frequencies across tissues (Figure 1C). Indeed, many clones are not in equilibrium across tissues within individual mice including high frequency clones (Figure 1D), consistent with local GVHD maintenance.
Many clones were undetectable at week 1 post-transplant (Figure 1E). However, between weeks 1 and 3, the fraction of undetectable clones declined, coincident with an increase in the number of clones present in all 9 tissues. Indeed, most clones were found in more than 1 tissue, though only ~30-50% were in all 9 tissues after week 2 (Figure 1E). This pattern of clone distribution was not driven by more sensitive clone detection (Figure S1G). These data highlight that, even though each TS1 clone is primed at a single location, most clones generate progeny capable of entering multiple tissues.
That most clones were present in two or more tissues could give the impression that GVHD remains dependent on the continued influx of blood-derived T cells. Rather, the data suggest a gradual switch from the early distribution of clones to tissues to a state of local GVHD maintenance. That is, if the initial supply of TS1 clones from SLTs into blood and then into tissues were to continue, all clones should eventually be found in all locations and equilibrate in frequency. Indeed, over the first 3 weeks there was a temporal trend towards the global equilibrium of clones, manifest by the progressive detection of more unique clones in all 9 tissues. However, this trend stopped and reversed (Figure 1E), suggesting that from week 3 onward, GVHD was less reliant on T cells entering from blood and was instead dominantly maintained locally within tissues.
To better understand clone priming we compared clone frequencies in spleen and mLN, likely locations of TS1 priming 25-27. At week 1, many clones were only in spleen, suggesting they were primed there. Fewer clones were only in mLN, indicative of mLN priming. Even as early as week 1, some clones were shared (Figure 2A), generally at a higher frequency in either the spleen or in the mLN, the likely site of clone priming. By week 2, a higher fraction of clones was shared, with similar frequencies in spleen and mLN (Figure 2B), demonstrating efficient TS1 exchange between spleen and mLN. Consistent with this distribution, we found CD62L+CD44+ TS1 cells in blood (Figure S2A). Immigrant T cells primed at other sites should increase the number of unique clones in a given lymphoid tissue, and indeed, clone numbers grew in spleen and mLN until week 3 (Figure 2C). This increase was again not due to more sensitive clone detection (Figure S1F).
Figure 2. GVHD initiation and maintenance as revealed by clone frequency analyses.

(A) Comparison of clone frequencies in spleen and mLN 1-week post-transplant. Solid and dashed lines represent the inverse of the average number of TS1 events recorded in spleen and mLN, respectively (smaller values indicate more sensitive clone detection). Red and blue clones have higher frequencies in spleen or mLN (respectively). Shared clones in the gray area likely originated in spleen, diluted by TS1 originating in the mLN. Clones in the blue area likely originated in mLN, diluted by clones originating in spleen. (B) As in (A) but for week 2. (C) The fraction of clones detected in spleen or mLN. (D) The fraction of clones detected in mLN or spleen (SLT) and in all other locations. (E) Clone frequencies in spleen versus other tissues. Solid lines are the inverse of the average number of TS1 events analyzed. Dot color (blue to red) indicates each clone’s frequency in mLN. “r” denotes Spearman’s rank correlation coefficients with upper and lower 95% confidence limits obtained via nonparametric bootstrap. Data are from the analysis of 1203 infused clones recovered from a total of 186 mice (17 at week 1; 61 at week 2; 30 at week 3; 38 at week 4; and 40 at week 5). See Figure S2.
However, more unique clones were recovered in GVHD target tissues than in mLN and spleen combined (Figure 2D); this difference sets a lower limit for the number of clones primed at sites other than mLN and spleen. To confirm priming in SLTs other than spleen and mLN, we performed a clonality experiment wherein mice were treated beginning on day +1 with the sphingosine-1-phosphate (S1P) receptor (S1PR) inhibitor FTY720, which retards T cell egress from LNs 28,29, thereby increasing our ability to detect TS1 clones. We observed several large clones in LNs not present or present in only small numbers at other locations (Figure S2B), consistent with their being primed locally. A detailed analyses of comparative clone frequencies indicate that 12-25% of TS1 were primed in the spleen, 10-15% in the mLN and 45-63% in unobserved locations (Figure S2C-E); Supplemental Methods).
Clone compositions of several tissues become less related to each other over time.
Next, we determined how clonal compositions in every tissue were related to the compositions in every other tissue and whether clone compositions became more or less similar over time. At week 1, there were few TS1 cells in most target tissues (Figure S1F) which prevented accurate comparisons of clone compositions across tissues. At week 2, tissue-versus-tissue clone frequencies were significantly correlated, though clone compositions were never identical in any two tissues, including some clones being exclusively in one or the other location (spleen versus other tissues, Figure 2E; colon vs other tissues, Figure 3A). Unexpectedly, however, the clone compositions in many tissues became less related to each other between weeks 3 and 5 (Figure 3B). This progressive divergence was most profound for SI-IEL TS1 clones, which decorrelated even relative to the surrounding SI-LPL TS1 cells. While epidermis and dermis clone compositions decorrelated from those in other tissues, they remained highly correlated with each other, suggesting that TS1 cells transited between them. Although clone compositions did not become less related to each other in all cross-tissue comparisons, in no comparison did clone compositions become more related, which would be predicted if TS1 populations in tissues relied on the continued influx of TS1 cells from blood.
Figure 3. Clonal compositions of some tissues become less related to each other over time.

(A) Clone frequency plots from weeks 1 to 5 post-transplant comparing TS1 clone frequencies in colon to TS1 clone frequencies in all other tissues. Solid lines are the inverse of the average number of TS1 analyzed for each tissue, “r” are Spearman’s rank correlation coefficients with upper and lower 95% confidence limits obtained via nonparametric bootstrap. (B) Spearman rank correlation coefficients for cross-tissue clonal composition comparisons. * Denotes a statistically significant divergence between tissues over time (Brown-Forsythe test with p<0.05; see Supplemental Methods). Data are from the analysis of 1203 infused clones recovered from a total of 186 mice (17 at week 1; 61 at week 2; 30 at week 3; 38 at week 4; and 40 at week 5). Error bars (B) and bounds on r values (A) show upper and lower 95% confidence limits obtained via nonparametric bootstrap.
The local GVHD maintenance model predicts that preventing egress of LN TS1 cells into blood after GVHD is established should not impact cross-tissue correlations of clone compositions as the contributions from LN-derived T cells would already be small relative to the local generation of T cells within a given tissue. Conversely, if LNs continued to be important sources of tissue-derived TS1 cells, then preventing egress from LNs would increase cross-tissue clone decorrelations. To test this hypothesis, we induced GVHD in HA104 mice with bulk TS1 cells along with 5 single congenic TS1 cells. Beginning 3 weeks post-transplant, mice were treated with FTY720 or vehicle until sacrifice 2 weeks later. FTY720 did not affect the percentage of TS1 cells recovered from any tissue, except for the skin where there was a small reduction (Figure S2F). Importantly, FTY720 failed to increase clone decorrelation in any tissue-vs-tissue comparison (Figure S2G), consistent with GVHD being dominantly sustained within tissues.
Taken together, clonal analyses suggest a model wherein early post-transplant there was widespread, though unequal, dissemination of alloreactive T cell clones. However, over time clone compositions in tissues grew progressively independent, and rather than becoming more related to each other, as predicted by the systemic model of GVHD, tissue clone compositions maintained their differences or became less related over time, consistent with local GVHD maintenance. Maintenance of GVHD locally within tissues, however, does not explain why in some tissue-versus-tissue comparisons, clone compositions became less related. That is, local maintenance could occur without such a divergence. To gain insights into the underlying biology we applied computational modeling.
Computational modeling predicts GVHD maintenance by a progenitor cell subset.
While the observed evolution of clone compositions in GVHD tissues supports local maintenance, in principle, both local self-renewal of TS1 cells within tissues (local maintenance) and continued influx of TS1 cells from SLTs via blood (global maintenance) could contribute in varying proportions to maintaining GVHD in target tissues (Figure 4A). To address this, we developed a family of mathematical models of GVHD, exhibiting only global or local maintenance, or a mixture of both (Figure 4B), and asked which model(s) account for the experimental data that show increasing divergence of clone frequencies in SI-IEL and several other tissues (Figure 4C). Specifically, we described the dynamics of TS1 cells in a target tissue mathematically as a result of the balance of influx (μ), self-renewal (λ) and loss (δ) (Figure 4B, Supplemental Methods). To model continued influx from SLTs, we took the measured clone frequencies in spleen or mLN as the source for clones in other locations; we found that our results are independent of the source SLT used in the simulations, consistent with extensive mixing of clones in the SLTs. We then ran this model with varying degrees of influx and intratissue self-renewal (Figure 4D). In the case of purely global maintenance, clone frequencies in tissues converged with those in SLTs, which clearly differs from the divergence of clone frequencies in the experimental data (Figure 4D, left panels showing SI-IEL as the target tissue; Figure S3A showing the same for colon). T cells entering blood from tissues other than spleen or mLN would also be expected to drive clone frequencies in tissues to become more similar over time. Shifting GVHD maintenance from global maintenance towards models with a greater contribution by local self-renewal of TS1 cells (Figure 4D and Figure S3A, middle panels, with 70% local maintenance) or fully local maintenance (Figure 4D and Figure S3A, right panels) slowed the convergence of clone frequencies. That is, clone compositions in SLT and target tissues did not become more related to each other in contrast to the global model. However, the partial or complete local maintenance models did not produce the observed decorrelation. Hence, local maintenance alone does not explain the decorrelation of clone frequencies.
Figure 4. Modeling GVHD maintenance.

(A) T cells in GVHD target tissues could be maintained by self-renewal of tissue-resident T cells (local maintenance; blue curved arrows) and/or influx of T cells from SLTs via blood (global maintenance; red arrow). (B) Models wherein T cells are maintained only by influx from SLTs (upper row), a combination of influx and self-renewal (middle row), or solely self-renewal (lower row). Influx (μ); self-renewal (λ); and loss (δ). (C) Clonal divergence is manifest by tissue-versus-tissue (e.g., spleen vs IEL) clone frequencies becoming less similar over time. (D) Clonal divergence in mathematical models and experimental data. Upper row, clone frequencies in spleen and SI-IEL at week 5 simulated with the models in (B) and using the observed clone frequencies at week 2 as the initial condition. The “mixed” model assumes 30% maintenance by influx. Lower row, clonal divergence over time for global, mixed, and local maintenance models, comparing SI-IEL to the spleen or mLN. (E) Models with a progenitor (P)-effector (E) hierarchy, maintaining the T cell population only by influx from SLTs (upper row), a combination of influx and self-renewal (middle row), or solely self-renewal (lower row). (F) For each clone, during the seeding phase relatively rare T cells with progenitor potential can be unequally distributed to tissues through stochastic effects. This will cause the frequency of each clone’s contribution to the entire progenitor pool to be different from the frequency of that clone among all effector cells. With time, clone frequencies of effector cells will shift to parallel that of the seeded progenitors which could be a driver of later clone divergence. (G) Clonal divergence in mathematical models as in (D) except now incorporating the progenitor-effector cell relationships as in (E) and (F). (H) Stochastic effects on clone frequency changes over time (blue, red, and green shaded areas indicate 0.05-quantile ranges) are inversely proportional to the number of colonizing progenitors and the clone frequency itself (top panel). The bottom panel shows this concept applied to simulations of clone correlations between spleen or mLN with SI-IEL (same data as in G), colon and SI-LPL which have high, intermediate, and little clone decorrelation. The simulations fit the observed data assuming 300, 3000 and 30,000 colonizing progenitors in SI-IEL, colon, and SI-LPL, respectively, by week 2 post-transplant. Error bars show upper and lower 95% confidence limits obtained via nonparametric bootstrap. See Figure S3.
Seeking another explanation for clone decorrelation, we hypothesized that for each clone, the bulk effector T cell population is maintained by a smaller subset of critical T cells, which we term “progenitors” (Figure 4E). Consequently, heterogeneity in local conditions for generation or/and maintenance of comparatively small numbers of these GVHD progenitors could, via stochastic effects intrinsic to small cell numbers, cause progenitor frequencies to differ in different tissues 30. In turn, this could drive the progressive decorrelation in bulk clone frequencies across tissues (Figure 4F). To examine this hypothesis, we modeled two subpopulations of alloreactive T cells: effectors (“E”) with a limited proliferative potential and lifetime, and progenitors (“P”) that can self-renew and generate new effectors (Figure 4E). Stochasticity in division and survival properties of these model progenitors (due to unsynchronized cell cycles and variable differentiation times) generated substantial variability in the tissue distribution of progenitors for each clone (Supplemental Methods). The net effects of this process were an array of clones with different progenitor frequencies and, for individual clones, unequal contributions of their progenitors to the total TS1 progenitor pool in each tissue. Over time, each clone’s contribution to the total number of TS1 cells drifted towards the clone’s representation in the total progenitor pool (Figure 4F) 31. When simulating this progenitor-effector model (Supplemental Methods), we accurately recapitulated the observed clone decorrelations in target tissues (Figure 4G and Figure S3B, right panels). However, complete (100%) or substantial (30%) maintenance by influx from SLTs did not yield the observed decorrelation of clone frequencies (Figure 4G and Figure S3B, left and middle panels); therefore, for clone decorrelation to occur, most new T cells in a tissue must be locally derived.
Another feature revealed by the modeling is that the magnitude of progenitor stochasticity is inversely related to the number of progenitors colonizing a given tissue. Hence, the smaller number of progenitors seeding a tissue, the greater impact stochastic effects can have on clone size (Figure 4H, top panel, shaded triangles). Likewise, the lower the frequency of a clone, the smaller number of progenitors within that clone, and therefore the greater the susceptibility to stochastic effects on clone size over time (Figure 4H, top panel, blue, red, and green shaded areas). We applied this concept to clone correlations between spleen or mLN with the SI-IEL, colon and SI-LPL, which have high, intermediate, and little clone decorrelation. The simulations predicted that the number of colonizing progenitors is lowest for SI-IEL, intermediate for colon, and greatest for the SI-LPL (Figure 4H, lower panel). Taken together, this modeling suggested that GVHD is maintained in target tissues by a subset of progenitor-like cells.
Parabiosis confirms a component of local GVHD maintenance.
Efficient TS1 seeding could have masked the extent of local GVHD maintenance. To directly test the local maintenance model, we performed parabiosis of mice with established GVHD after T cell dissemination from SLTs to GVHD target tissues had peaked (3-4 weeks post-transplant). We first conjoined HA104 GVHD mice wherein the partner mice received congenic TS1 cells and donor BM (Figure 5A). Unexpectedly, neither partner-derived TS1 cells nor CD11b+ cells comprised 50% of either population in blood. This could have been due to their recruitment into inflamed tissues prior to their entry into the partner circulation. To account for this, we normalized partner TS1 and CD11b+ cell contributions in tissues to their representations in blood. TS1 cells from the conjoined partner were a small minority of tissue TS1 cells (Figure 5B) with partner contributions far lower than in blood (Figure 5C). In contrast, contributions from partner CD11b+ cells were closer to that in blood (Figure 5B, C), indicating that the paucity of partner TS1 cells was not due to tissue inaccessibility to all blood-derived cells. Partner-derived TS1 cells were also underrepresented in mLN, which are targeted by GVHD 32-34. The ongoing TS1 response against LN-derived HA may maintain a population of TS1 cells that are not readily diluted by partner-derived TS1 cells. In addition, most TS1 cells in blood by week 2 post-transplant were already CD62L− (Figure S2A) and therefore would not efficiently cross high endothelial venules into LNs. In some pairs, one parabiosed mouse received single-cell-sorted congenic TS1 clones at the time of transplant. Few of these crossed to the other partner, even to the partner of a mouse in which 60% of SI-IELs were derived from a single clone (Figure S4A).
Figure 5. Parabiosis demonstrates a component of local GVHD maintenance.

(A) Experimental design and representative staining of blood from a pair at sacrifice. (B, C) Percentages of partner-derived TS1 and CD11b+ cells in tissues (B), normalized to their percentages in blood (C). (D) Experimental design for parabiosis of F1 mice. (E, F) Contributions by partner-derived polyclonal CD4+ and CD8+ T cells and CD11b+ cells (E), normalized to their ratios in blood (F). (G) Host-derived/partner-derived ratios of tissue TS1 cells (left panel) and normalized to the host/partner ratio of polyclonal CD4+ T cells in blood (right panel). (H) Experimental design for parabiosis of B6actH60 mice. (I) Ratio of host/partner TetH60+ cells, also normalized to the ratios of polyclonal CD8+ T cells in blood. (J) Percentage of all partner-derived CD8+ T cells and CD11b+ cells normalized to their ratios in blood. Data are mean ± SEM from a total of n=19 (B, C), n=16 (E-G) and n=4 (I, J) mice. Statistical significance was determined by one-way ANNOVA (p**<0.01, p***<0.001, p***<0.0001). See Figure S4.
We next performed parabiosis in a polyclonal GVHD model wherein TS1 cells were only one of many alloreactive T cells. Irradiated F1(HA104 x B10.D2; H-2d) mice were reconstituted with BALB/c BM (CD45.1 or CD45.2) and polyclonal CD4+ and CD8+ T cells (CD45.2 or CD45.1) with 100 TS1 cells (CD90.1 or CD90.1/2; Figure 5D and Figure S4B, C). In this model, TS1 cells react against HA whereas BALB/c T cells respond to B10.D2-derived miHAs. In these parabionts, partner cell contributions in blood were close to 50% (Figure 5E). In all GVHD tissues, contributions from the parabiotic partner polyclonal CD4+ and CD8+ T cells, some of which were alloreactive, were well below that in blood (Figure 5E, F). Blood TS1 cells were too few to accurately enumerate. Nonetheless, few tissue TS1 cells were partner-derived (Figure 5G; Figure S4D).
In these parabiosis experiments, the only miHA-reactive T cells we could track were TS1 cells. We therefore performed additional parabiosis experiments in a polyclonal GVHD model wherein CD8+ T cells reactive against the miHA H60 could be identified with MHCI-tetramers (TetH60+; Figure 5H) 13,35. Irradiated B6actH60 mice (which express H60 ubiquitously 35) were reconstituted with either C3H.SW (H-2b; H60−) CD45.1+CD45.2+ BM and CD8 cells or C3H.SW CD45.2+ DsRed+ BM and CD8+ T cells. To increase the likelihood of having sufficient H60-reactive CD8+ T cells in GVHD target tissues to enumerate, mice also received C3H.SW CD45.1+ or CD45.1+CD45.2+ memory CD8+ T cells specific for H60 generated by vaccination (TMH60; 35). Tissue histology confirmed the development of GVHD (Fig S4E). Mean percentages of partner derived CD8+ and CD11b+ in blood were 45% and 35%, respectively (Figure S4F). Too few TetH60+ cells were present in blood to compare tissue and blood frequencies. Still, very few tissue TetH60+ cells were partner-derived (Figure 5I). Similarly, few total TetH60− CD8+ T cells from the conjoined partner were detected in any GVHD target tissue whereas CD11b+ cells were better equilibrated (Figure 5J).
In summary, parabiosis experiments in three models tracking miHA-reactive CD4+ and CD8+ T cells demonstrate a major component of local GVHD maintenance, consistent with the clone analysis and model simulations.
Alloreactive T cells proliferate in GVHD tissues.
Local GVHD maintenance would require that T cells divide within target tissues to replace dying effectors. To test this, we induced GVHD in HA104 mice with TS1 cells of a single clonotype and BrdU-pulsed mice 30 minutes prior to sacrifice on weeks 1, 2 and 4-5 post-transplant. TS1 cells proliferated in all tissues at all time-points (Figure S5A, B). Tissue-resident TS1 cells and polyclonal CD4+ and CD8+ T cells also proliferated in-situ in the F1(HA104 x B10.D2) GVHD model (Figure S5C, D).
Single cell RNAseq (scRNAseq) reveals tissue-resident Tcf7-expressing clusters.
In search of progenitors predicted by the simulations, we performed scRNAseq of TS1 cells extracted from spleen, skin, SI-IEL, SI-LPL and colon 4 weeks post-transplant of GVHD mice generated by TS1 cells of a single clonotype. Dimensionality reduction revealed tissue-of-origin and proliferation status as the main drivers of transcriptome variability (Figure 6A, B; Figure S6A, B), which was confirmed by unsupervised clustering (Figure S6C). We leveraged transcriptome differences between sorted SI-LPL and SI-IEL to identify colon TS1 similar to small intestine IELs or LPLs and IEL-like cells from among LPL cells (Figure S6D-G) and used these additional clusters in downstream analyses. Due to the strength of the tissue-of-origin signature, we separately analyzed TS1 cells from each tissue (Figure 6C). We identified a cluster in spleen, characterized by expression of Tcf7, which was also prominent in the SI-LPL. These Tcf7-expressing clusters were compelling candidates for the progenitor cells predicted by the modeling as they resemble the “exhausted progenitor” subset of T cells that develop in chronic viral infections and in anti-tumor responses, which have the ability to divide and replenish the effector T cell pool with chronic antigen exposure 14-19. Transcriptionally related Tcf7-expressing clusters were found in all tissues, including a small but highly proliferative subset among SI-IELs (Figure 6C-F).
Figure 6. scRNAseq reveals progenitor-like clusters.

TS1 cells extracted from spleen, colon, SI-IEL, SI-LPL and skin 28 days post-transplant underwent scRNAseq (2 biologic replicates; See Methods). (A) Transcriptomes grouped in UMAP space segregated by tissue-of-origin driven by genes shown in (B). (C) Left panels, UMAP representations. Based on core expressed genes, clusters were labeled as having signatures of being in cell cycle (cc), effectors (eff1, eff2), interferon response (ifn) or being progenitor-like (prog). Right panels. Relative expression of selected genes in each cluster. (D) Frequency of Tcf7-expressing cells that also have a cell cycle signature. (E) Gene overlap of clusters across tissues. (F) Significance of marker gene overlap across clusters and tissue. Cluster grouping and annotation as in (E). See Figure S6.
TCF-1+ T cells are present in tissues and outperform TCF-1− cells in vitro and after adoptive transfer.
Consistent with the scRNAseq data, flow cytometry revealed TCF-1+ TS1 cells in all tissues at weeks 2 and 4-5 post-transplant with a CD39lo phenotype akin to TCF-1+ CD8 cells described in chronic LCMV infections and in tumors (Figure 7A, B) 14-17. Their frequencies among all TS1 cells varied by tissue, with the highest CD39loTCF-1+ percentage in mLN and SI-LPL TS1 cells, tissues with the least time-dependent clone decorrelation, and fewest in SI-IELs, which had the greatest clone decorrelation (see Figure 3B). This is in agreement with the modeling (see Figure 4H; Supplemental Methods) which predicts greater clone frequency divergence when progenitor cell numbers are small. The transcription factor TOX is required for the generation of CD8+TCF-1+ Texp in virus and tumor models 14-17. Consistent with this, TOX was strongly expressed by splenic TS1 cells at week 1 and less so at week 2 (Figure 7C), potentially enabling the subsequent generation of CD39loTCF-1+ cells.
Figure 7. TCF-1+ T cells develop and have greater proliferation and survival.

(A) Representative CD39 and TCF-1 staining, 5 weeks post-transplantation. (B) Frequencies of CD39hiTCF-1− and CD39loTCF-1+ TS1 cells at the indicated times post-transplantation. (C) TOX expression of splenic TS1. (D) Percentage of BrdU+ CD39hiTCF-1− and CD39loTCF-1+ TS1 cells from the indicated tissues, 5 weeks post-transplantation. (E) Frequencies of IFN-γ+TNF-α+ among CD39hiTCF-1− and CD39loTCF-1+ TS1 cells 4 weeks post-transplant after stimulation with S1 peptide-pulsed splenocytes. (F) CD39hi and CD39lo TS1 cells sorted from the indicated tissues 4 weeks post-transplant were cultured with S1 peptide-pulsed splenocytes. Numbers of cells and representative CTV dilution histograms are shown. (G) Design for the competitive adoptive transfer experiments. (H-K) Recipients were analyzed 1 (H, I) and 4 weeks (J, K) post-transplant. (H, J) Representative flow cytometry. (I, K) Percentages of total TS1 cells derived from the progeny of adoptively transferred CD39lo and CD39hi TS1 cells. (L, M) Percentages of CD39loTCF-1+ (L) and IFN-γ+ (M) cells among progeny of adoptively transferred CD39lo and naïve TS1 cells. Data are representative of 2 independent experiments (A, D-L), or pooled from one (C, M) or two (B) experiments with n=3-4 mice/group per experiment. Bar graphs depict means ± SEM. Statistical significance was determined by two-tailed Student’s t-test (p*<0.05, p**<0.01, p***<0.001). See Figure S7.
CD39loTCF-1+ donor CD4 cells also developed in the MHC-mismatched B6 (H-2b)→BALB/c (H-2d) GVHD model. Irradiated BALB/c mice were reconstituted with B6 BM and CD4+ T cells. By week 2 post-transplant, there were clear populations of CD39loTCF-1+ donor-derived CD4+ T cells in spleen, mLN, liver, colon, SI-LPL, SI-IEL, and skin (Figure S7A). TOX was also induced in a subset of CD4+ T cells, indicative of sustained TCR stimulation (Figure S7B).
Next, we investigated the biology of TCF-1+ alloreactive T cells in greater depth in the TS1 GVHD model. To quantitate the proliferation of tissue-resident TCF-1+ TS1 cells in vivo, we BrdU-pulsed mice 3 weeks post-transplant and costained recovered TS1 cells for BrdU, CD39 and TCF-1. Similar fractions of CD39loTCF-1+ and CD39hiTCF-1− cells incorporated BrdU, with the exception of those from SI-IEL wherein CD39loTCF-1+ TS1 cells were more proliferative (Figure 7D), consistent with the scRNAseq data and the magnitude of SI-IEL clone decorrelation from other tissues.
We next incorporated these division rates into the mathematical simulations (Supplemental Methods). We used the BrdU-incorporation data and frequencies of CD39loTCF-1+ TS1 cells (Figure S3C) to compute their proliferative rates (Figure S3D; Supplemental Methods). These rates were then applied to the progenitor-effector model (Figure S3E) to simulate both the mixed (30% global/70% local) and local (100% intratissue) GVHD maintenance conditions (Figures S3F and G; Supplemental Methods). In these new simulations, only the 100% local model was able to accurately recapitulate the observed divergence of clone frequencies, especially for the SI-IEL which have the greatest degree of clone decorrelation from other tissues (Figure S3F).
In contrast to overall similar rates of proliferation of CD39hiTCF-1− and CD39loTCF-1+, fewer tissue-resident CD39loTCF-1+ TS1 cells recovered from mice 4 weeks post-transplant produced both IFN-γ and TNF-α (Figure 7E). This is consistent with a model wherein TCF-1+ cells differentiate into TCF-1− cells with greater effector function, though the production of IFN-γ by some TCF-1+ TS1 cells suggests that they too could directly cause tissue damage.
CD39loTS1 cells sorted from SI-LPL, spleen, BM and liver had far better survival in vitro than did CD39hi TS1 cells after culture with S1-peptide-pulsed splenocytes; whereas in skin, CD39hi TS1 cells outperformed CD39lo cells, though both populations were more robust than CD39hi cells from other tissues (Figures 7F and S7C). Peptide-stimulated CD39lo cells divided in vitro as did the few remaining progeny of CD39hi TS1 cells (Figure 7F).
CD39lo TS1 cells also outperformed CD39hi TS1 cells in adoptive co-transfer experiments. We coinfused congenic CD39hi and CD39lo TS1 cells sorted from the spleen or SI-LPL of week 4 GVHD mice into newly transplanted mice (spleen- and SI-LPL-derived TS1 cells into separate mice) that also received 500 CD90.1 naïve TS1 cells (Figures 7G; S7C). At week 1 after transplantation, progeny of splenic and SI-LPL CD39lo TS1 cells far outnumbered counterpart CD39hi TS1 cells in spleen, BM, and mLN (Figure 7H, I). At week 4, CD39lo progeny again outnumbered CD39hi progeny in BM, spleen and mLN and also in GVHD target tissues (Figure 7J, K). CD39lo CD4 cells recovered from B6→BALB/c GVHD mice 3 weeks post-transplantation also outcompeted CD39hi CD4 cells in a competitive adoptive transfer experiment (Figure S7D). While most progeny of adoptively transferred CD39lo TS1 cells were CD39hiTCF-1−, a fraction remained CD39loTCF-1+ suggesting an ability to self-renew (Figure 7L; Figure S7E-G). In each tissue the frequency of CD39loTCF-1+ cells among the progeny of the transferred cells paralleled the frequencies of CD39loTCF-1+ progeny of CD90.1+ naïve TS1 cells infused on day 0 of the second transplant. Likewise, similar fractions of splenic and SI-LPL CD39lo-derived TS1 cells and CD90.1 TS1 TN progeny produced IFN-γ (Figure 7M; Figure S7H). The similar phenotypes of the progeny of the CD39lo TCF-1+ and the naïve CD90.1 TS1 support the idea that CD39loTCF-1+ progenitors are the source of most mature TS1 effectors.
Discussion:
Here we have demonstrated, using clone analyses and parabiosis, that GVHD is in good part maintained by alloreactive T cells resident in GVHD target tissues, rather than dominantly by the continued influx of blood-derived effectors. What begins as a systemic immune response by a shared pool of alloreactive T cell clones distributed from SLTs, later morphs into a systemic immune response that is instead locally maintained within each target tissue with a smaller input from blood-derived T cells. Mathematical modeling of the clone data, scRNAseq, immunophenotyping of tissue-infiltrating T cells and adoptive transfer experiments all suggested that a small population of TCF-1+ progenitor-like T cells are a likely key tissue-resident source of GVHD-inducing effectors.
The central question of our studies was to determine if and to what degree GVHD is locally maintained within tissues. A key requirement for such an analysis is that T cells reactive to defined miHAs be specifically identified. Addressing this by tracking and enumerating clones in a TCR transgenic system wherein a single ubiquitously expressed miHA is targeted, enabled this and had important advantages over other approaches, such as the tracking of T cell clones by TCR sequencing in polyclonal GVHD models or from clinical specimens 36-38. Within a given tissue post-transplant there could be several categories of T cells including: 1) T cells reactive against miHAs expressed in that tissue; 2) T cells that are not alloreactive, but which gained the ability to enter tissues through lymphopenia-induced proliferation39; 3) residual recipient tissue-resident T cells, including tissue resident memory cells TRM 40,41; and 4) donor-derived antipathogen T cells. An additional source of complexity is that distinct miHAs may be differentially expressed in different target tissues. As there is antigen-driven T cell proliferation in tissues 5,6, this could further skew TCR repertoires whether or not ongoing recruitment of T cells from blood is important. TCR sequencing alone cannot readily discriminate these subsets, and therefore its application cannot with high confidence determine the extent by which GVHD is reliant upon the continued influx of blood-derived alloreactive T cells.
The time-dependent decorrelation of clone compositions across some tissue-versus-tissue comparisons led to computation-based insights as to the nature of intratissue T cells that sustain GVHD. Our simulations of clonal dynamics could only recapitulate the observed clone decorrelations if within tissues a small population of T cells sustained a bulk effector population. We also simulated other potential models of GVHD maintenance. Those with a substantial degree of ongoing input from blood-derived T cells led clone compositions to grow more similar to each other over time, which was not observed in our experiments. Dominant intratissue maintenance alone was sufficient to maintain stable differences in clone compositions (i.e., they did not become more similar) but could not generate the decrease in clone relatedness observed in some tissue comparisons. Only when we added to the local maintenance model that a small number of progenitors sustain a larger effector population were stochastic effects sufficient to generate time-dependent clone decorrelation.
These computational results directed us to experimentally search for TS1 cells with transcriptomes that might predict for a high proliferative capacity, which would be expected to be a feature of progenitor-like cells. Transcriptomes were heterogeneous within and across tissues, largely clustering by tissue of origin, even though they had identical TCRs responding to the same ubiquitously expressed miHA. This highlights the transcriptional plasticity of T cells and the power of local environments to influence T cell fates 39,42. Importantly, we identified related clusters with Tcf7 expression as a contributing feature. Consistent with the scRNAseq data, TCF-1+ TS1 cells were present in all tissues at frequencies that correlated with the frequencies of Tcf7-expressing cells revealed by scRNAseq and inversely with the degree to which their clone compositions diverged from other tissues, as was predicted by the simulations. TS1 cells enriched for those that were TCF-1+ responded better to peptide stimulation (except for skin) and those from spleen and SI-LPL greatly outperformed TCF-1− TS1 cells after adoptive transfer. The failure of CD39hi cells to durably engraft and differentiate into TCF-1+ cells suggests that CD39loTCF-1+ cells primarily form in SLTs during initial antigen exposure and subsequently disseminate to potential sites of GVHD. We also observed similar populations of CD39loTCF-1+ in the B6→BALB/c MHC-mismatched model of GVHD which also outperformed CD39hiTCF-1− cells upon adoptive transfer.
An important aspect of our work is the characterization of CD4+ T cells with similarities to CD8+ Texp. Texp were initially identified as a subset of CD8+ T cells that arise in chronic LCMV infection which undergo a proliferative burst in response to PD-1-blockade 18,19,43,44. The development of these cells was found to depend on TOX 14,15,17,45,46 Alloreactive T cells in GVHD share the persistent antigen exposure experienced by CD8+ T cells in chronic viral infections, are induced to express TOX and likely engage similar signaling and transcriptional networks.
TCF-1+ T cells have been reported previously in mouse alloSCT models. TOX+PD-1+ alloreactive CD8+ T cells develop in spleen and BM early post-transplant followed by the emergence of CD39loTim3loTCF-1+ cells 13 demonstrating that initial alloreactive T cell activation post-alloSCT can generate antigen exposure sufficient to induce cells with the immunophenotype of Texp. Engel et al described TCF-1+ CD4+ T cells in the mLN in an alloSCT delayed T cell infusion model 47. However, these T cells were studied only a few days post-transfer and Tox expression was not elevated. Therefore, it is questionable whether there was the strength and duration of antigen exposure necessary to create the Texp described in our studies and by others.
Taken together, our analyses and modeling contribute to a granular picture of GVHD establishment and maintenance. The population of alloreactive T cells in a given location is determined by rates of division, death, egress and entry of cells from blood. Infused T cells are efficiently activated, largely in SLTs 25,26,48-50, and their progeny distribute to other SLTs and to GVHD target tissues. Early post-transplant, when there are few T cells in tissues, the number of alloreactive T cells that enter a tissue and persist is large relative to the total number of resident T cells, which accounts for the early high degree of clone correlation across tissues. However, clones are not identically distributed even at early times. The maintenance of this difference, the failure of tissue clone compositions to become more related to each other over time, and their further divergence allowed us to conclude that GVHD is largely locally maintained. Later post-transplant, when the total numbers of tissue alloreactive T cells are higher, the number of blood-derived alloreactive T cells that enter and engraft is small relative to tissue-resident T cells, which are sustained by dividing intra-tissue progenitor-like cells. In some locations these progenitor-like cells are likely to be TCF-1+. TCF-1+ TS1 cells were in SLTs and blood early post-transplantation, suggesting that the progenitors that sustain GVHD in tissues were in good part seeded from SLTs early post transplantation, which is also consistent with the relative stability of clone compositions over time. However, we cannot exclude that the program to maintain Tcf7 expression can also be induced after entry into target tissues as may be the case for anti-tumor immunity 15,51.
Our results bear on other types of tissue inflammation, in particular autoimmune diseases wherein antigen is not cleared. For example, infiltrating T cells in lupus nephritis have features of exhaustion 52, and disease could be locally maintained within the kidney by Tcf7-expressing cells. On the other hand, persistent intratissue T cell responses could be fueled by cells with properties of TRM 53,54. In cancer, roles for both Tcf7+ and TRM cells have been suggested 15,19,43,53-56 The reliance on one or the other could depend on the nature of antigen exposure. In our work, T cells with TRM cell-like properties could have a role in the skin wherein CD39hi and CD39lo TS1 both responded to peptide stimulation.
Our work suggests that therapies targeted to affected tissues should be efficacious and less globally immunosuppressive than are systemic treatments. The narrow targeting of the key subpopulations of tissue-resident alloreactive T cells—preventing their development, their early trafficking to GVHD target tissues or inhibiting their function once established—could be even more specific. This would especially be true for Tcf7-dependent progenitors as many pathogens cleared by acute responses do not depend on such cells.
Limitations of the study
While the mathematical modeling and in vivo and in vitro characterization of TCF-1+ T cells suggest that such cells are strong candidates for a critical subpopulation of tissue-resident cells that maintain GVHD locally, more definitive proof of this will require an approach to selectively deplete TCF-1+ cells from individual tissues while leaving them intact elsewhere. And while parabiosis and clone analysis support a degree of local GVHD maintenance in the skin by a progenitor-like cell, our data suggest there could be a TCF-1− cells that contribute to maintaining the effector population. Our data also do not address the degree to which TCF-1+ cells may directly mediate tissue damage.
STAR METHODS
RESOURCE AVAILABILITY
Lead contact
Lead contact: Further information and requests for resources and reagents should be directed to and will be fulfilled by the lead contact, Warren Shlomchik (warrens@pitt.ed).
Materials availability
This study did not generate new unique reagents.
Data and code availability
Single-cell RNAseq data have been deposited at GEO and are publicly available as of the date of publication. Accession number is listed in the key resource table. Flow cytometry gating strategies are included in the Supplementary Figures.
Key resources table
| REAGENT or RESOURCE | SOURCE | IDENTIFIER |
|---|---|---|
| Antibodies | ||
| Anti-mouse CD4 BV421, Clone GK1.5 | BioLegend | Cat#: 100443; RRID: AB_10900241 |
| Anti-mouse CD5 Alexa647, Clone 53-7.3 | In house | N/A |
| Anti-mouse CD5 BUV395, Clone 53-7.3 | BD Bioscience | Cat#: 740206; RRID: AB_2739956 |
| Anti-mouse CD8 BUV395, Clone 53-6.7 | BD Bioscience | Cat#: 563786; RRID: AB_2732919 |
| Anti-mouse CD11b FITC, Clone M1/70 | BioLegend | Cat#: 101206; RRID: AB_312789 |
| Anti-mouse CD11b BUV395, Clone M1/70 | BD Biosciences | Cat#: 563553 RRID: AB_2738276 |
| Anti-mouse CD25 PE, Clone 3C7 | BioLegend | Cat#: 101904; RRID: AB_312847 |
| Anti-mouse CD25 biotin, Clone PC61 | BiloLegend | Cat#: 102203; RRID: AB_312853 |
| Anti-mouse CD39 PerCP-eFluor710, Clone 24DMS1 | eBioscience | Cat#: 46-0391-82 RRID: AB_10717953 |
| Anti-mouse CD45.1 Alexa700, Clone A20 | In house | N/A |
| Anti-mouse CD45.1 BV421, Clone A20 | BioLegend | Cat#: 110732 RRID: AB_2562563 |
| Anti-mouse CD45.2 PE-Cy7, Clone 104 | BioLegend | Cat#: 109830 RRID: AB_1186098 |
| Anti-mouse CD45.2 BV421; Clone 104 | BioLegend | Cat#: 109832 RRID: AB_2565511 |
| Anti-human/mouse CD44 APC-Cy7, Clone IM7 | BioLegend | Cat#: 103028 RRID: AB_830785 |
| Anti-mouse CD49b PE, Clone DX5 | BioLegend | Cat#: 108908 RRID: AB_313415 |
| Anti-mouse CD62L PE-Cy7, Clone Mel14 | BioLegend | Cat#: 104418 RRID: AB_313103 |
| Anti-mouse CD90.1 PE, Clone OX7 | BioLegend | Cat#: 202524 RRID: AB_1595524 |
| Anti-mouse CD90.1 PerCP-Cy5.5, Clone OX7 | BioLegend | Cat#: 202516 RRID: AB_961437 |
| Anti-mouse CD90.2 BV605, Clone 30H12 | BioLegend | Cat#: 105343 RRID: AB_2632889 |
| Anti-mouse F4/80 FITC, Clone BM8 | BioLegend | Cat#: 123108 RRID: AB_893502 |
| Anti-mouse Gr1 FITC, Clone RB6-8C5 | BioLegend | Cat#: 108406 RRID: AB_313371 |
| Anti-mouse IFNγ PE, Clone XMG1.2 | eBioscience | Cat#: 12-7311-82 RRID: AB_466193 |
| Anti-mouse TCF-1 Alexa647, Clone C63D9 | Cell Signaling | Cat#: 6709S RRID: AB_2797631 |
| Anti-mouse Ter119 PE, Clone Ter119 | BioLegend | Cat#: 116208 RRID: AB_313709 |
| Tetramer H60 BV421 | NIH | N/A |
| Anti-mouse TNFα PE-Cy7, Clone MAb11 | eBioscience | Cat#: 25-7349-82 RRID: AB_469686 |
| Anti-human/mouse TOX PE, Clone TXRX10 | eBioscience | Cat#: 12-6502-82 RRID: AB_10855034 |
| TotalSeq™-A0301 anti-mouse Hashtag 1 Antibody, Clones M1/42, 30-F11 | BioLegend | Cat#: 155801 RRID: AB_2750032 |
| TotalSeq™-A0302 anti-mouse Hashtag 2 Antibody; Clones M1/42, 30-F11 | BioLegend | Cat#: 155803 RRID: AB_2750033 |
| TotalSeq™-A0303 anti-mouse Hashtag 3 Antibody; Clones M1/42, 30-F11 | BioLegend | Cat#: 155805 RRID: AB_2750034 |
| TotalSeq™-A0304 anti-mouse Hashtag 4 Antibody; Clones M1/42, 30-F11 | BioLegend | Cat#: 155807 RRID: AB_2750035 |
| TotalSeq™-A0305 anti-mouse Hashtag 5 Antibody; Clones M1/42, 30-F11 | BioLegend | Cat#: 155809 RRID: AB_2750036 |
| TotalSeq™-A0306 anti-mouse Hashtag 6 Antibody; Clones M1/42, 30-F11 | BioLegend | Cat#: 155811 RRID: AB_2750037 |
| TotalSeq™-A0307 anti-mouse Hashtag 7 Antibody; Clones M1/42, 30-F11 | BioLegend | Cat#: 155813 RRID: AB_2750039 |
| TotalSeq™-A0308 anti-mouse Hashtag 8 Antibody; Clones M1/42, 30-F11 | BioLegend | Cat#: 155815 RRID: AB_2750040 |
| TotalSeq™-A0309anti-mouse Hashtag 9 Antibody; Clones M1/42, 30-F11 | BioLegend | Cat#: 155817 RRID: AB_2750042 |
| TotalSeq™-A0310 anti-mouse Hashtag 10 Antibody; Clones M1/42, 30-F11 | BioLegend | Cat#: 155819 RRID: AB_2750043 |
| Chemicals, peptides, and recombinant proteins | ||
| Fixable Viability Dye eFluor506 | eBioscience | Cat#: 65-0866-14 |
| Fixable Viability Dye eFluor780 | eBioscience | Cat#: 65-0865-14 |
| Cell Trace Violet | Molecular Probes | Cat#:C34557 |
| FTY720 | Sigma | Cat#: SML0700 |
| Phorbol 12-myristate 13-acetate | Sigma | Cat#: P8139 |
| Ionomycin calcium salt | Sigma | Cat#: I0634 |
| Collagenase, Type IV | Sigma | Cat#: C5138 |
| Dispase II | Gibco | Cat#: 17105041 |
| DNase I recombinant, RNase-free | Sigma | Cat#: 10104159001 |
| Liberase TL Research Grade | Sigma | Cat#: 05401020001 |
| EDTA | Invitrogen | Cat#: 15575020 |
| DL-Dithiothreitol | Thermo Scientific | Cat#: R0861 |
| Histopaque-1077 | Sigma | Cat#: SD10771A |
| Opti-prep Density Gradient Medium | Sigma | Cat#: D1556 |
| RPMI 1640 | Gibco | Cat#: 11875119 |
| HBSS | Gibco | Cat#: 14170161 |
| Calf Serum | Gibco | Cat#: 16170060 |
| HEPES | Gibco | Cat#:15630-130 |
| Recombinant murine IL-2 | BioLegend | Cat#: 575402 |
| Critical commercial assays | ||
| EasySep CD4 Isolation Kit | Stem Cell | Cat#: 19852 |
| EasySep CD8 Isolation Kit | Stem Cell | Cat#: 19853 |
| EasySep CD902. Selection Kit | Stem Cell | Cat#: 19851 |
| Foxp3 Transcription Factor Staining Buffer Set | eBioscience | Cat#: 50-112-8857 |
| BD Cytofix/Cytoperm Kit with GolgiPlug | BD Biosciences | Cat#: BD555128 |
| Phase Flow FITC BrdU Kit | BioLegend | Cat#: 370704 |
| Chromium Single Cell 3’ Library and Gel Bead Kit | 10X Genomics | Cat#: PN-1000075 |
| Deposited data | ||
| scRNAseq on TS1 cells isolated from spleen, small intestine (IELs and LPLs), colon and skin of GVHD mice 4 weeks post-transplant. | This manuscript | NCBI Accession: GSE207485 |
| Experimental models: Organisms/strains | ||
| TS1 | Kirberg et al. 1994 | RRID:MMRRC_043834-JAX |
| HA104 | Caton et al. 1996 | MMRRC Strain #043831-JAX |
| BALB/cJ | Jackson Laboratory | RRID:IMSR_JAX:000651 |
| B10.D2 | Jackson Laboratory | RRID:IMSR_JAX:000463 |
| C3H.SW | Zhou et al.2020 | RRID:IMSR_JAX:000438 |
| actH60 | Zhou et al.2020 | N/A |
| B6 TCF7-DTR | Siddiqui et al. 2019 | N/A |
| Software and algorithms | ||
| FlowJo (v9 and 10) | https://www.flowjo.com | RRID:SCR_008520 |
| Prism (v9.4.1) | https://www.graphpad.com | RRID:SCR_002798 |
| Adobe Illustrator CS | http://www.adobe.com/products/illustrator.html | RRID: SCR_010279 |
| Biorender | http://biorender.com | RRID:SCR_018361 |
| Cell Ranger (v3.1.0) | https://github.com/10XGenomics/cellranger | RRID:SCR_017344 |
| Python (v3.8.5) | http://www.python.org | RRID:SCR_008394 |
| RStudio (v2022.07.0) | http://www.rstudio.com | RRID:SCR_000432 |
| Seurat (3.3.2) | http://seurat.r-forge.r-project.org | RRID:SCR_007322 |
| Scran (v1.16.0) | https://bioconductor.org/packages/release/bioc/html/scran.html | RRID:SCR_016944 |
| Scater (v.1.16.2) | https://bioconductor.org/packages/release/bioc/html/scater.html | RRID:SCR_015954 |
| Cowplot (1.1.0) | https://cran.r-project.org/web/packages/cowplot/index.html | RRID:SCR_018081 |
| Mclust (v5.4.7) | https://debian.pkgs.org/11/debian-main-amd64/r-cran-mclust_5.4.7-1_amd64.deb.html | N/A |
| DropletUtils (v1.8.0) | https://tracker.debian.org/pkg/r-bioc-dropletutils | N/A |
| NumPy (v1.19.2) | http://www.numpy.org | RRID:SCR_008633 |
| Pandas (v1.1.3) | https://pandas.pydata.org | RRID:SCR_018214 |
| Scipy (v1.7.3) | http://www.scipy.org | RRID:SCR_008058 |
| MatPlotLib (3.3.2) | http://matplotlib.sourceforge.net | RRID:SCR_008624 |
This paper does not report original code.
Any additional information required to reanalyze the data reported in this paper is available from the lead contact upon request.
EXPERIMENTAL MODEL AND SUBJECT DETAILS
Mice
BALB/c Rag2−/− TS1 22, BALB/c Rag2−/− HA104 23, C57BL/6 actH60 13,35, C3H.SW and B10.D2 (The Jackson Laboratory) mice were maintained at the University of Pittsburgh. BALB/c mice were obtained from The Jackson Laboratory. TS1 mice were crossed to BALB/c Rag2−/− CD45.1, CD90.1 and GFP mice. B10.D2 mice were bred to BALB/c mice to create F1s. C3H.SW CD45.1 and dsRed mice were created as described 13. B6 TCF7DTR-GFP bacterial artificial chromosome (BAC) transgenic mice were created by and obtained from Werner Held 51. Mice were housed under specific pathogen-free conditions at the University of Pittsburgh and handled in accordance with experimental protocols approved by Institutional Animal Care and Use Committee of the University of Pittsburgh. Male and female donor and recipient mice between 7 and 14 weeks of age were employed.
Bone marrow transplantation
Irradiation was from a cesium source. HA104, F1(B10.D2xBALB/c), actH60 mice and BALB/c mice received 750cGy, 900cGy, 1000cGy and 900cGy, respectively. Each recipient received 5-7x10⁶ BM cells. HA104 mice received 500 bulk TS1 with or without single TS1 clones. F1 mice received 2x10⁶ BALB/c CD4 cells with a 50% Treg depletion, 106 BALB/c CD8 cells and 100 TS1 cells. actH60 mice received 106 CD8 cells from unmanipulated C3H.SW mice and 104 sorted CD8+CD44+CD62L+ cells from C3H.SW mice that were immunized against H60 35 at least 10 weeks prior. BALB/c mice received 0.5x10⁶ B6 CD4 cells.
METHOD DETAILS
T cell purifications and cell sorting
All cell sorting was with a FACS Aria (BD Biosciences). TS1 TN used to induce GVHD (“bulk”) were sorted from spleen based on their not expressing CD11b, Gr-1, DX5, F480, Ter119, CD25 and CD44 and expressing CD62L. For single-cell sorting, splenic TN (CD5+CD44−CD62L+) from each TS1 clonotype were consecutively sorted into serum-coated wells of 96 well plates preseeded with 104 BALB/c Rag2−/− BM cells. For experiments with polyclonal donor T cells, CD4 or CD8 cells were purified with EasySep negative selection kits from combined lymph node and spleen cells. Treg-depletion of CD4 cells was accomplished by adding biotinylated anti-CD25 antibody to the EasySep antibody cocktail. T cell depletion of BM was with anti-CD90.2 microbeads (EasySep).
Parabiosis
Parabiosis was performed as described previously 58. Briefly, age, size and gender matched GVHD mice were anesthetized, and a longitudinal skin incision made from elbow to knee joint. Elbow and knee joints were attached using surgical non-absorbable sutures and skin was closed in the ventral and dorsal areas.
Flow cytometry
Single cell suspensions were incubated with Fc-blocking (CD16/32) antibody and fixable viability dies (eBioscience) for 10 minutes at 4°C prior to staining with fluorochrome-conjugated antibodies for 30 minutes at 4°C. For staining of TCF-1 and TOX, cells were fixed and permeabilized after cell surface staining using the FoxP3 intracellular staining kit (eBioscience) and incubated for 30 minutes at room temperature with fluorochrome-conjugated antibodies. Cytofix/Cytoperm Plus kit (BD Biosciences) was used for intracellular cytokine staining of PMA and ionomycin-treated cells. Flow cytometry acquisition was with LSR2 or Fortessa instruments and analysis with Flowjo v9 or v10 (BD Biosciences).
Tissue processing
Small intestines were excised, sectioned, and incubated in RPMI containing 5mM EDTA, 1mM DTT and 3% calf serum at 37°C for 20 minutes. The resulting digest was passed through a cell strainer and IELs isolated by centrifugation over a Histopaque gradient (Sigma). For LPL isolation, tissues were minced and digested with Liberase TL (Roche) (2.5mg/ml) and DNAse (Sigma) (0.02mg/ml) at 37°C for 30 minutes and passed through a cell strainer. Colons were processed the same as SI-LPLs without an IEL separation. Livers were perfused with PBS, excised, minced, passed through a cell strainer, and incubated in Collagenase IV (Sigma) (1mg/ml) and DNAse (0.02mg/ml) at 37°C for 40 minutes. Lymphocytes were separated on 25% Optiprep gradient (Accurate Chemical & Scientific). For skin lymphocyte isolation, mouse ears were digested in HBSS containing Dispase (Sigma) (4U/ml) at 37°C for 1 hour. Epidermal and dermal layers were separated, minced, and further digested with Collagenase IV (1mg/ml) at 37°C for 2 hours. The resulting digest was passed through a cell strainer.
BrdU labeling and in vitro stimulation
GVHD mice were injected i.p. with 1mg of BrdU 30 minutes prior to sacrifice. Cells were stained for BrdU using a BrdU staining kit according to the manufacturer’s protocol (BioLegend). For in vitro proliferation, TS1 were sorted into CD5+CD39hi and CD5+CD39lo cells (Figure S6A) and cultured with S1 peptide-pulsed (10μg/ml) irradiated BALB/c splenocytes in the presence of IL-2 (5ng/ml) (BioLegend) for 64 hours in 96 well plates. Live cells were enumerated with cell counting beads (BD Biosciences) combined with flow cytometry. For cytokine production, TS1 cells were stimulated with PMA (5ng/ml) and ionomycin (500ng/ml) and cultured in the presence of GolgiPlug (BD Biosciences) for 6 hours.
FTY720 treatment
Mice received daily i.p. injections of FTY720 (2-amino-2-(2[4-octylphenyl]ethyl)-1,3-propanediol hydrochloride, Cayman Chemical), 1mg/kg dissolved in saline, beginning day +1 or between weeks 3 and 5 post-transplantation.
Intravascular staining of leukocytes
For discrimination of intravascular and tissue-resident cells, 3μg of fluorochrome-conjugated anti-CD45.1 and/or CD45.2 antibodies were injected i.v. into mice 3 minutes prior to sacrifice and tissue harvest.
Adoptive transfer experiments
Irradiated HA104 mice were reconstituted with BALB/c Rag2−/− BM and 500 CD45.1 or CD45.2 TS1 cells. Four weeks post-transplant, splenic and SI-LPL CD5+CD39hi and CD5+CD39lo cells from each clonotype were sort-purified (Figure S7C) and transferred (104 cells) in a 1:1 ratio into newly transplanted HA104 mice (spleen and SI-LPL cells into separate mice) which also received 500 CD90.1 TS1 cells 24-hours prior. TS1 cells from each source were enumerated and phenotyped by flow cytometry 1- and 4- weeks post-transplant. For adoptive transfer experiments in the B6→ BALB/c system, GVHD was induced by CD4 cells from B6 CD45.1 or B6 Tcf7-DTR-GFP CD45.2 mice. Three weeks later, CD4+ CD39hi CD45.1+ and GFP+ CD45.2 donor B6-derived T cells were sorted from the spleens of GVHD mice and transferred along with 0.5x10⁶ CD90.1 B6 CD4 cells into freshly irradiated BALB/c mice. The progeny of these cells were enumerated 2 weeks post-transplant.
scRNAseq experimental design
Irradiated HA104 mice were reconstituted with BALB/c Rag2−/− and 500 TS1 cells. At week 4, spleen, skin, colon, SI-LPL and SI-IEL were processed from 4 individual mice. Cell preparations from 2 mice were pooled to create 2 biological replicates. Live, blood-excluded CD5+ cells were sorted from these preparations, and each were stained with hashing antibody cocktails against MHCI and CD45 (BioLegend). Live cells were enumerated and then processed in the 10x Genomics Chromium instrument.
scRNAseq analysis
Demultiplexing and quality control.
Demultiplexing was performed by using a Gaussian Mixture Model (GMM) on hashtag (HTO) frequencies using the mclust function from the mclust package in R. Execution of the method using six Gaussian modes which returned distributions corresponding to each tissue, while a distribution for cells with low HTOs could not be assigned. Cells that were confidently assigned to a gaussian distribution (assignment probability > 1-10−4) were retained for downstream analysis. A second HTO filtering step was performed in order to ensure that the cells retained were not multiplets. To do so, the R library DropletUtils was used to further exclude cells for which more than one HTO was enriched with respect to ambient profiles using emptyDrops and hashedDrops functions. Poor-quality cells for each population and condition were identified as outliers using the isOutlier function from the R scran package. Given that a skin and a spleen sample displayed a large number of poor-quality cells, the median and MAD metrics were shared across tissues to make outlier detection more robust. In addition, cells with less than 1000 counts, or 200 detected genes, or more than 10% of mitochondrial reads were excluded. In total, the following numbers of cells passed quality control for each tissue: Spleen: 1145, Skin: 1483, SI-LPL: 3079, SI-IEL: 3087, Colon: 2145.
Normalization and feature selection (3000 genes retained) were performed using the sct method described in 59. We observed that, despite increased precision in cluster detection 59, marker detection using sct-normalized values yielded markers expressed by very few cells. To obtain a more robust set of markers, we normalized the data used the pooling method from scran 60 and used these values when detecting markers. Thirty principal components were retained and used to compute UMAP embedding (runUMAP function from scater package in R) and clustering (FindCluster from the Seurat package in R). Cell-cycle quantification was performed as described 61.
IEL detection in colon and SI.
In addition to the sorted SI-IEL cells, a population of IEL-like cells was expected to be detected in both SI-LPL and colon. In order to detect these IEL-like populations, we used the following procedure: (1) A putative SI-IEL population among the sorted SI-LPL cells was annotated via expression of sorted SI-IEL markers in transcriptome clusters (using FindCluster from the Seurat package with resolution 1.5, marker detection was performed using the findMarker function from the scran package with binomial testing). (2) Within the sorted SI-LPL cells, differential gene expression between putative LPL and IEL identified during step 1 was used to select 500 features, followed by repeating normalization, dimensionality reduction and clustering processes. Expression of IEL markers was used to refine the assignment of cells from the sorted SI-LPL tissue to LPL or IEL-like cells. (3) By using the same procedure as in (2), cells from the colon were assigned to IEL-like and LPL-like subsets. The procedure resulted in putative populations of 711 Colon-IEL cells, 1434 Colon-LP cells, 2430 SI-LPL cells and 649 SI-IEL cells (given the availability of sorted SI-IEL cells, this transcriptionally isolated subset was not used in further analysis).
Tissue-specific analysis.
Cells from each tissue were analyzed separately, and dimensionality reduction and clustering steps were performed. Given that number of cells and dissociation procedure were different for different tissues, clustering resolution was selected to retain a number of clusters between 4 and 7. A previously reported cluster (n= 244) related to the tissue dissociation was detected in the skin 62 and hence excluded from further analysis.
Mapping of clusters across tissues.
A maximum of 100 markers were detected across tissue-specific clusters from all tissues (FDR < 0.01, findMarkers function from the scran package with the following parameters: direction = ‘up’, test.type = ‘wilcox’, pval.type = ‘some’, see function documentation for further details; the test was restricted to the union of the top 1000 highly variable genes across all tissues; given the low number of colon-IEL cells, markers for this population were detected using pval.type = ‘any’). By using cells of the same tissue as contrast, genes expressed ubiquitously in specific tissues (i.e., tissue markers) were not detected as markers, as desired. Overlap between sets of cluster markers were quantified as the size of their intersection divided by the size of their union; overlap significance was quantified using a one-tailed Fisher test; the overlaps between clusters were clustered hierarchically using complete linkage (operation performed from the pheatmap function in the pheatmap package).
Supplementary Material
Alloreactive T cells cause graft-versus-host disease (GVHD), but how GVHD is maintained once established is unclear. Using T cell clone tracking, parabiosis of GVHD mice and computational modeling, Sacirbegovic et al demonstrate that progenitor-like T cells within affected tissues maintain GVHD locally, mostly independent of blood-derived T cells.
During early GVHD, alloreactive T cell clones enter target tissues broadly but unevenly
Late phase GVHD is maintained within affected tissues with only minor input from blood
Tissue-resident TCF-1+ T cells maintain effector cells within most affected tissues
Acknowledgements:
We thank the animal technicians, the flow cytometry and 10X-Genomics scRNAseq core facilities. This work was supported by NIH R01 HL143349 (W.D.S.) and Marie Skłodowska-Curie Actions H2020-MSCA-ITN-2017 Grant no. 764698 (T.H.). F.S. was supported by the Thomas E. Starzl fellowship in transplantation biology. W.H. is supported in part by a grant from the Swiss National Science Foundation (310030_200898).
Footnotes
Publisher's Disclaimer: This is a PDF file of an unedited manuscript that has been accepted for publication. As a service to our customers we are providing this early version of the manuscript. The manuscript will undergo copyediting, typesetting, and review of the resulting proof before it is published in its final form. Please note that during the production process errors may be discovered which could affect the content, and all legal disclaimers that apply to the journal pertain.
Declaration of interests:
Warren D. Shlomchik is a cofounder, stockholder, and compensated advisor for BlueSphere Bio. He is also a compensated advisor for Orca Bio.
Data and materials availability: Raw scRNAseq data is deposited into Gene Expression Omnibus (GEO) database (accession number: GSE207485). All other data needed to evaluate the conclusions of the paper are available in the manuscript or the supplementary materials.
References:
- 1.Copelan EA (2006). Hematopoietic stem-cell transplantation. New England Journal of Medicine 354, 1813–1826. [DOI] [PubMed] [Google Scholar]
- 2.Hill GR, Betts BC, Tkachev V, Kean LS, and Blazar BR (2021). Current Concepts and Advances in Graft-Versus-Host Disease Immunology. Annu Rev Immunol 39, 19–49. 10.1146/annurev-immunol-102119-073227. [DOI] [PMC free article] [PubMed] [Google Scholar]
- 3.Zeiser R, and Blazar BR (2017). Acute Graft-versus-Host Disease - Biologic Process, Prevention, and Therapy. N Engl J Med 377, 2167–2179. 10.1056/NEJMra1609337. [DOI] [PMC free article] [PubMed] [Google Scholar]
- 4.Shlomchik WD (2007). Graft-versus-host disease. Nat Rev Immunol 7, 340–352. [DOI] [PubMed] [Google Scholar]
- 5.Koyama M, Kuns RD, Olver SD, Raffelt NC, Wilson YA, Don AL, Lineburg KE, Cheong M, Robb RJ, Markey KA, et al. (2011). Recipient nonhematopoietic antigen-presenting cells are sufficient to induce lethal acute graft-versus-host disease. Nat Med 18, 135–142. 10.1038/nm.2597. [DOI] [PubMed] [Google Scholar]
- 6.Koyama M, Mukhopadhyay P, Schuster IS, Henden AS, Hulsdunker J, Varelias A, Vetizou M, Kuns RD, Robb RJ, Zhang P, et al. (2019). MHC Class II Antigen Presentation by the Intestinal Epithelium Initiates Graft-versus-Host Disease and Is Influenced by the Microbiota. Immunity 51, 885–898 e887. 10.1016/j.immuni.2019.08.011. [DOI] [PMC free article] [PubMed] [Google Scholar]
- 7.Kekre N, Kim HT, Hofer J, Ho VT, Koreth J, Armand P, Nikiforow S, Gooptu M, Romee R, Alyea EP, et al. (2021). Phase II trial of natalizumab with corticosteroids as initial treatment of gastrointestinal acute graft-versus-host disease. Bone Marrow Transplant 56, 1006–1012. 10.1038/s41409-020-01049-0. [DOI] [PubMed] [Google Scholar]
- 8.Bacigalupo A, Angelucci E, Raiola AM, Varaldo R, Di Grazia C, Gualandi F, Benedetti E, Risitano A, Musso M, Zallio F, et al. (2020). Treatment of steroid resistant acute graft versus host disease with an anti-CD26 monoclonal antibody-Begelomab. Bone Marrow Transplant 55, 1580–1587. 10.1038/s41409-020-0855-z. [DOI] [PubMed] [Google Scholar]
- 9.Danylesko I, Bukauskas A, Paulson M, Peceliunas V, Gedde-Dahl DYT, Shimoni A, Shouval R, Griskevicius L, Floisand Y, and Nagler A (2019). Anti-alpha4beta7 integrin monoclonal antibody (vedolizumab) for the treatment of steroid-resistant severe intestinal acute graft-versus-host disease. Bone Marrow Transplant 54, 987–993. 10.1038/s41409-018-0364-5. [DOI] [PubMed] [Google Scholar]
- 10.Asakura S, Hashimoto D, Takashima S, Sugiyama H, Maeda Y, Akashi K, Tanimoto M, and Teshima T (2010). Alloantigen expression on non-hematopoietic cells reduces graft-versus-leukemia effects in mice. J Clin Invest 120, 2370–2378. [DOI] [PMC free article] [PubMed] [Google Scholar]
- 11.Ni X, Song Q, Cassady K, Deng R, Jin H, Zhang M, Dong H, Forman S, Martin PJ, Chen YZ, et al. (2017). PD-L1 interacts with CD80 to regulate graft-versus-leukemia activity of donor CD8+ T cells. J Clin Invest 127, 1960–1977. 10.1172/JCI91138. [DOI] [PMC free article] [PubMed] [Google Scholar]
- 12.Flutter B, Edwards N, Fallah-Arani F, Henderson S, Chai JG, Sivakumaran S, Ghorashian S, Bennett CL, Freeman GJ, Sykes M, and Chakraverty R (2010). Nonhematopoietic antigen blocks memory programming of alloreactive CD8+ T cells and drives their eventual exhaustion in mouse models of bone marrow transplantation. The Journal of clinical investigation 120, 3855–3868. 10.1172/JCI41446. [DOI] [PMC free article] [PubMed] [Google Scholar]
- 13.Zhou M, Sacirbegovic F, Zhao K, Rosenberger S, and Shlomchik W (2020). T cell exhaustion and a failure in antigen presentation drive leukemia resistance to the graft-versus-leukemia effect. Nature communications. [DOI] [PMC free article] [PubMed] [Google Scholar]
- 14.Yao C, Sun HW, Lacey NE, Ji Y, Moseman EA, Shih HY, Heuston EF, Kirby M, Anderson S, Cheng J, et al. (2019). Single-cell RNA-seq reveals TOX as a key regulator of CD8(+) T cell persistence in chronic infection. Nat Immunol 20, 890–901. 10.1038/s41590-019-0403-4. [DOI] [PMC free article] [PubMed] [Google Scholar]
- 15.Scott AC, Dundar F, Zumbo P, Chandran SS, Klebanoff CA, Shakiba M, Trivedi P, Menocal L, Appleby H, Camara S, et al. (2019). TOX is a critical regulator of tumour-specific T cell differentiation. Nature 571, 270–274. 10.1038/s41586-019-1324-y. [DOI] [PMC free article] [PubMed] [Google Scholar]
- 16.Chen Z, Ji Z, Ngiow SF, Manne S, Cai Z, Huang AC, Johnson J, Staupe RP, Bengsch B, Xu C, et al. (2019). TCF-1-Centered Transcriptional Network Drives an Effector versus Exhausted CD8 T Cell-Fate Decision. Immunity 51, 840–855 e845. 10.1016/j.immuni.2019.09.013. [DOI] [PMC free article] [PubMed] [Google Scholar]
- 17.Alfei F, Kanev K, Hofmann M, Wu M, Ghoneim HE, Roelli P, Utzschneider DT, von Hoesslin M, Cullen JG, Fan Y, et al. (2019). TOX reinforces the phenotype and longevity of exhausted T cells in chronic viral infection. Nature 571, 265–269. 10.1038/s41586-019-1326-9. [DOI] [PubMed] [Google Scholar]
- 18.Utzschneider DT, Charmoy M, Chennupati V, Pousse L, Ferreira DP, Calderon-Copete S, Danilo M, Alfei F, Hofmann M, Wieland D, et al. (2016). T Cell Factor 1-Expressing Memory-like CD8(+) T Cells Sustain the Immune Response to Chronic Viral Infections. Immunity 45, 415–427. 10.1016/j.immuni.2016.07.021. [DOI] [PubMed] [Google Scholar]
- 19.Im SJ, Hashimoto M, Gerner MY, Lee J, Kissick HT, Burger MC, Shan Q, Hale JS, Lee J, Nasti TH, et al. (2016). Defining CD8+ T cells that provide the proliferative burst after PD-1 therapy. Nature 537, 417–421. 10.1038/nature19330. [DOI] [PMC free article] [PubMed] [Google Scholar]
- 20.Juchem KW, Anderson BE, Zhang C, McNiff JM, Demetris AJ, Farber DL, Caton AJ, Shlomchik WD, and Shlomchik MJ (2011). A repertoire-independent and cell-intrinsic defect in murine GVHD induction by effector memory T cells. Blood 118, 6209–6219. 10.1182/blood-2011-01-330035. [DOI] [PMC free article] [PubMed] [Google Scholar]
- 21.Juchem KW, Sacirbegovic F, Zhang C, Sharpe AH, Russell K, McNiff JM, Demetris AJ, Shlomchik MJ, and Shlomchik WD (2018). PD-L1 Prevents the Development of Autoimmune Heart Disease in Graft-versus-Host Disease. J Immunol 200, 834–846. 10.4049/jimmunol.1701076. [DOI] [PMC free article] [PubMed] [Google Scholar]
- 22.Kirberg J, Baron A, Jakob S, Rolink A, Karjalainen K, and von Boehmer H (1994). Thymic selection of CD8+ single positive cells with a class II major histocompatibility complex-restricted receptor. Journal of Experimental Medicine 180, 25–34. [DOI] [PMC free article] [PubMed] [Google Scholar]
- 23.Caton AJ, Swartzentruber JR, Kuhl AL, Carding SR, and Stark SE (1996). Activation and negative selection of functionally distinct subsets of antibody-secreting cells by influenza hemagglutinin as a viral and a neo-self antigen. J Exp Med 183, 13–26. [DOI] [PMC free article] [PubMed] [Google Scholar]
- 24.Buchholz VR, Flossdorf M, Hensel I, Kretschmer L, Weissbrich B, Graf P, Verschoor A, Schiemann M, Hofer T, and Busch DH (2013). Disparate individual fates compose robust CD8+ T cell immunity. Science 340, 630–635. 10.1126/science.1235454. [DOI] [PubMed] [Google Scholar]
- 25.Anderson BE, Taylor PA, McNiff JM, Jain D, Demetris AJ, Panoskaltsis-Mortari A, Ager A, Blazar BR, Shlomchik WD, and Shlomchik MJ (2008). Effects of donor T-cell trafficking and priming site on graft-versus-host disease induction by naive and memory phenotype CD4 T cells. Blood 111, 5242–5251. [DOI] [PMC free article] [PubMed] [Google Scholar]
- 26.Beilhack A, Schulz S, Baker J, Beilhack GF, Nishimura R, Baker EM, Landan G, Herman EI, Butcher EC, Contag CH, and Negrin RS (2008). Prevention of acute graft-versus-host disease by blocking T-cell entry to secondary lymphoid organs. Blood 111, 2919–2928. [DOI] [PMC free article] [PubMed] [Google Scholar]
- 27.Silva IA, Olkiewicz K, Askew D, Fisher JM, Chaudhary MN, Vannella KM, Deurloo DT, Choi SW, Pierce EM, Clouthier SG, et al. (2010). Secondary lymphoid organs contribute to, but are not required for the induction of graft-versus-host responses following allogeneic bone marrow transplantation: a shifting paradigm for T cell allo-activation. Biol Blood Marrow Transplant 16, 598–611. 10.1016/j.bbmt.2009.12.007. [DOI] [PMC free article] [PubMed] [Google Scholar]
- 28.Brinkmann V, Billich A, Baumruker T, Heining P, Schmouder R, Francis G, Aradhye S, and Burtin P (2010). Fingolimod (FTY720): discovery and development of an oral drug to treat multiple sclerosis. Nat Rev Drug Discov 9, 883–897. 10.1038/nrd3248. [DOI] [PubMed] [Google Scholar]
- 29.Matloubian M, Lo CG, Cinamon G, Lesneski MJ, Xu Y, Brinkmann V, Allende ML, Proia RL, and Cyster JG (2004). Lymphocyte egress from thymus and peripheral lymphoid organs is dependent on S1P receptor 1. Nature 427, 355–360. 10.1038/nature02284. [DOI] [PubMed] [Google Scholar]
- 30.Klein AM, and Simons BD (2011). Universal patterns of stem cell fate in cycling adult tissues. Development 138, 3103–3111. 10.1242/dev.060103. [DOI] [PubMed] [Google Scholar]
- 31.Grassmann S, Mihatsch L, Mir J, Kazeroonian A, Rahimi R, Flommersfeld S, Schober K, Hensel I, Leube J, Pachmayr LO, et al. (2020). Early emergence of T central memory precursors programs clonal dominance during chronic viral infection. Nat Immunol 21, 1563–1573. 10.1038/s41590-020-00807-y. [DOI] [PubMed] [Google Scholar]
- 32.Dertschnig S, Evans P, Santos ESP, Manzo T, Ferrer IR, Stauss HJ, Bennett CL, and Chakraverty R (2020). Graft-versus-host disease reduces lymph node display of tissue-restricted self-antigens and promotes autoimmunity. J Clin Invest 130, 1896–1911. 10.1172/JCI133102. [DOI] [PMC free article] [PubMed] [Google Scholar]
- 33.Brochu S, Rioux-Masse B, Roy J, Roy DC, and Perreault C (1999). Massive activation-induced cell death of alloreactive T cells with apoptosis of bystander postthymic T cells prevents immune reconstitution in mice with graft-versus-host disease. Blood 94, 390–400. [PubMed] [Google Scholar]
- 34.Suenaga F, Ueha S, Abe J, Kosugi-Kanaya M, Wang Y, Yokoyama A, Shono Y, Shand FH, Morishita Y, Kunisawa J, et al. (2015). Loss of lymph node fibroblastic reticular cells and high endothelial cells is associated with humoral immunodeficiency in mouse graft-versus-host disease. J Immunol 194, 398–406. 10.4049/jimmunol.1401022. [DOI] [PubMed] [Google Scholar]
- 35.Li N, Matte-Martone C, Zheng H, Cui W, Venkatesan S, Tan HS, McNiff J, Demetris AJ, Roopenian D, Kaech S, and Shlomchik WD (2011). Memory T cells from minor histocompatibility antigen-vaccinated and virus-immune donors improve GVL and immune reconstitution. Blood 118, 5965–5976. 10.1182/blood-2011-07-367011. [DOI] [PMC free article] [PubMed] [Google Scholar]
- 36.Kanakry CG, Coffey DG, Towlerton AM, Vulic A, Storer BE, Chou J, Yeung CC, Gocke CD, Robins HS, O'Donnell PV, et al. (2016). Origin and evolution of the T cell repertoire after posttransplantation cyclophosphamide. JCI Insight 1. 10.1172/jci.insight.86252. [DOI] [PMC free article] [PubMed] [Google Scholar]
- 37.Meyer EH, Hsu AR, Liliental J, Lohr A, Florek M, Zehnder JL, Strober S, Lavori P, Miklos DB, Johnson DS, and Negrin RS (2013). A distinct evolution of the T-cell repertoire categorizes treatment refractory gastrointestinal acute graft-versus-host disease. Blood 121, 4955–4962. 10.1182/blood-2013-03-489757. [DOI] [PMC free article] [PubMed] [Google Scholar]
- 38.Koyama D, Murata M, Hanajiri R, Akashi T, Okuno S, Kamoshita S, Julamanee J, Takagi E, Miyao K, Sakemura R, et al. (2019). Quantitative Assessment of T Cell Clonotypes in Human Acute Graft-versus-Host Disease Tissues. Biol Blood Marrow Transplant 25, 417–423. 10.1016/j.bbmt.2018.10.012. [DOI] [PubMed] [Google Scholar]
- 39.Tkachev V, Kaminski J, Potter EL, Furlan SN, Yu A, Hunt DJ, McGuckin C, Zheng H, Colonna L, Gerdemann U, et al. (2021). Spatiotemporal single-cell profiling reveals that invasive and tissue-resident memory donor CD8(+) T cells drive gastrointestinal acute graft-versus-host disease. Sci Transl Med 13. 10.1126/scitranslmed.abc0227. [DOI] [PMC free article] [PubMed] [Google Scholar]
- 40.de Almeida GP, Lichtner P, Eckstein G, Brinkschmidt T, Chu CF, Sun S, Reinhard J, Madler SC, Kloeppel M, Verbeek M, and Zielinski CE (2022). Human skin-resident host T cells can persist long term after allogeneic stem cell transplantation and maintain recirculation potential. Sci Immunol 7, eabe2634. 10.1126/sciimmunol.abe2634. [DOI] [PubMed] [Google Scholar]
- 41.Strobl J, Pandey RV, Krausgruber T, Bayer N, Kleissl L, Reininger B, Vieyra-Garcia P, Wolf P, Jentus MM, Mitterbauer M, et al. (2020). Long-term skin-resident memory T cells proliferate in situ and are involved in human graft-versus-host disease. Sci Transl Med 12. 10.1126/scitranslmed.abb7028. [DOI] [PMC free article] [PubMed] [Google Scholar]
- 42.Santos ESP, Cire S, Conlan T, Jardine L, Tkacz C, Ferrer IR, Lomas C, Ward S, West H, Dertschnig S, et al. (2018). Peripheral tissues reprogram CD8+ T cells for pathogenicity during graft-versus-host disease. JCI Insight 3. 10.1172/jci.insight.97011. [DOI] [PMC free article] [PubMed] [Google Scholar]
- 43.Hudson WH, Gensheimer J, Hashimoto M, Wieland A, Valanparambil RM, Li P, Lin JX, Konieczny BT, Im SJ, Freeman GJ, et al. (2019). Proliferating Transitory T Cells with an Effector-like Transcriptional Signature Emerge from PD-1(+) Stem-like CD8(+) T Cells during Chronic Infection. Immunity 51, 1043–1058 e1044. 10.1016/j.immuni.2019.11.002. [DOI] [PMC free article] [PubMed] [Google Scholar]
- 44.Wu T, Ji Y, Moseman EA, Xu HC, Manglani M, Kirby M, Anderson SM, Handon R, Kenyon E, Elkahloun A, et al. (2016). The TCF1-Bcl6 axis counteracts type I interferon to repress exhaustion and maintain T cell stemness. Sci Immunol 1. 10.1126/sciimmunol.aai8593. [DOI] [PMC free article] [PubMed] [Google Scholar]
- 45.Mann TH, and Kaech SM (2019). Tick-TOX, it's time for T cell exhaustion. Nat Immunol 20, 1092–1094. 10.1038/s41590-019-0478-y. [DOI] [PubMed] [Google Scholar]
- 46.Khan O, Giles JR, McDonald S, Manne S, Ngiow SF, Patel KP, Werner MT, Huang AC, Alexander KA, Wu JE, et al. (2019). TOX transcriptionally and epigenetically programs CD8(+) T cell exhaustion. Nature 571, 211–218. 10.1038/s41586-019-1325-x. [DOI] [PMC free article] [PubMed] [Google Scholar]
- 47.Engel JA, Lee HJ, Williams CG, Kuns R, Olver S, Lansink LI, Soon MS, Andersen SB, Powell JE, Svensson V, et al. (2020). Single-cell transcriptomics of alloreactive CD4+ T cells over time reveals divergent fates during gut graft-versus-host disease. JCI Insight 5. 10.1172/jci.insight.137990. [DOI] [PMC free article] [PubMed] [Google Scholar]
- 48.Wysocki CA, Panoskaltsis-Mortari A, Blazar BR, and Serody JS (2005). Leukocyte migration and graft-versus-host disease. Blood 105, 4191–4199. [DOI] [PMC free article] [PubMed] [Google Scholar]
- 49.Panoskaltsis-Mortari A, Price A, Hermanson JR, Taras E, Lees C, Serody JS, and Blazar BR (2004). In vivo imaging of graft-versus-host-disease in mice. Blood 103, 3590–3598. [DOI] [PubMed] [Google Scholar]
- 50.Coghill JM, Carlson MJ, Panoskaltsis-Mortari A, West ML, Burgents JE, Blazar BR, and Serody JS (2010). Separation of graft-versus-host disease from graft-versus-leukemia responses by targeting CC-chemokine receptor 7 on donor T cells. Blood 115, 4914–4922. 10.1182/blood-2009-08-239848. [DOI] [PMC free article] [PubMed] [Google Scholar]
- 51.Siddiqui I, Schaeuble K, Chennupati V, Fuertes Marraco SA, Calderon-Copete S, Pais Ferreira D, Carmona SJ, Scarpellino L, Gfeller D, Pradervand S, et al. (2019). Intratumoral Tcf1(+)PD-1(+)CD8(+) T Cells with Stem-like Properties Promote Tumor Control in Response to Vaccination and Checkpoint Blockade Immunotherapy. Immunity 50, 195–211 e110. 10.1016/j.immuni.2018.12.021. [DOI] [PubMed] [Google Scholar]
- 52.Tilstra JS, Avery L, Menk AV, Gordon RA, Smita S, Kane LP, Chikina M, Delgoffe GM, and Shlomchik MJ (2018). Kidney-infiltrating T cells in murine lupus nephritis are metabolically and functionally exhausted. J Clin Invest 128, 4884–4897. 10.1172/JCI120859. [DOI] [PMC free article] [PubMed] [Google Scholar]
- 53.Masopust D, and Soerens AG (2019). Tissue-Resident T Cells and Other Resident Leukocytes. Annu Rev Immunol 37, 521–546. 10.1146/annurev-immunol-042617-053214. [DOI] [PMC free article] [PubMed] [Google Scholar]
- 54.Szabo PA, Miron M, and Farber DL (2019). Location, location, location: Tissue resident memory T cells in mice and humans. Sci Immunol 4. 10.1126/sciimmunol.aas9673. [DOI] [PMC free article] [PubMed] [Google Scholar]
- 55.Jansen CS, Prokhnevska N, Master VA, Sanda MG, Carlisle JW, Bilen MA, Cardenas M, Wilkinson S, Lake R, Sowalsky AG, et al. (2019). An intra-tumoral niche maintains and differentiates stem-like CD8 T cells. Nature 576, 465–470. 10.1038/s41586-019-1836-5. [DOI] [PMC free article] [PubMed] [Google Scholar]
- 56.Amsen D, van Gisbergen K, Hombrink P, and van Lier RAW (2018). Tissue-resident memory T cells at the center of immunity to solid tumors. Nat Immunol 19, 538–546. 10.1038/s41590-018-0114-2. [DOI] [PubMed] [Google Scholar]
- 57.Efron B, and Tibshirani R (1994). An Introduction to the Bootstrap (Chapman and Hall/CRC; ). 10.1007/978-1-4899-4541-9. [DOI] [Google Scholar]
- 58.Kamran P, Sereti KI, Zhao P, Ali SR, Weissman IL, and Ardehali R (2013). Parabiosis in mice: a detailed protocol. Journal of visualized experiments : JoVE. 10.3791/50556. [DOI] [PMC free article] [PubMed] [Google Scholar]
- 59.Hafemeister C, and Satija R (2019). Normalization and variance stabilization of single-cell RNA-seq data using regularized negative binomial regression. Genome Biol 20, 296. 10.1186/s13059-019-1874-1. [DOI] [PMC free article] [PubMed] [Google Scholar]
- 60.Lun AT, Bach K, and Marioni JC (2016). Pooling across cells to normalize single-cell RNA sequencing data with many zero counts. Genome Biol 17, 75. 10.1186/s13059-016-0947-7. [DOI] [PMC free article] [PubMed] [Google Scholar]
- 61.Pei W, Shang F, Wang X, Fanti AK, Greco A, Busch K, Klapproth K, Zhang Q, Quedenau C, Sauer S, et al. (2020). Resolving Fates and Single-Cell Transcriptomes of Hematopoietic Stem Cell Clones by PolyloxExpress Barcoding. Cell stem cell 27, 383–395 e388. 10.1016/j.stem.2020.07.018. [DOI] [PubMed] [Google Scholar]
- 62.van den Brink SC, Sage F, Vertesy A, Spanjaard B, Peterson-Maduro J, Baron CS, Robin C, and van Oudenaarden A (2017). Single-cell sequencing reveals dissociation-induced gene expression in tissue subpopulations. Nat Methods 14, 935–936. 10.1038/nmeth.4437. [DOI] [PubMed] [Google Scholar]
Associated Data
This section collects any data citations, data availability statements, or supplementary materials included in this article.
Supplementary Materials
Data Availability Statement
Single-cell RNAseq data have been deposited at GEO and are publicly available as of the date of publication. Accession number is listed in the key resource table. Flow cytometry gating strategies are included in the Supplementary Figures.
Key resources table
| REAGENT or RESOURCE | SOURCE | IDENTIFIER |
|---|---|---|
| Antibodies | ||
| Anti-mouse CD4 BV421, Clone GK1.5 | BioLegend | Cat#: 100443; RRID: AB_10900241 |
| Anti-mouse CD5 Alexa647, Clone 53-7.3 | In house | N/A |
| Anti-mouse CD5 BUV395, Clone 53-7.3 | BD Bioscience | Cat#: 740206; RRID: AB_2739956 |
| Anti-mouse CD8 BUV395, Clone 53-6.7 | BD Bioscience | Cat#: 563786; RRID: AB_2732919 |
| Anti-mouse CD11b FITC, Clone M1/70 | BioLegend | Cat#: 101206; RRID: AB_312789 |
| Anti-mouse CD11b BUV395, Clone M1/70 | BD Biosciences | Cat#: 563553 RRID: AB_2738276 |
| Anti-mouse CD25 PE, Clone 3C7 | BioLegend | Cat#: 101904; RRID: AB_312847 |
| Anti-mouse CD25 biotin, Clone PC61 | BiloLegend | Cat#: 102203; RRID: AB_312853 |
| Anti-mouse CD39 PerCP-eFluor710, Clone 24DMS1 | eBioscience | Cat#: 46-0391-82 RRID: AB_10717953 |
| Anti-mouse CD45.1 Alexa700, Clone A20 | In house | N/A |
| Anti-mouse CD45.1 BV421, Clone A20 | BioLegend | Cat#: 110732 RRID: AB_2562563 |
| Anti-mouse CD45.2 PE-Cy7, Clone 104 | BioLegend | Cat#: 109830 RRID: AB_1186098 |
| Anti-mouse CD45.2 BV421; Clone 104 | BioLegend | Cat#: 109832 RRID: AB_2565511 |
| Anti-human/mouse CD44 APC-Cy7, Clone IM7 | BioLegend | Cat#: 103028 RRID: AB_830785 |
| Anti-mouse CD49b PE, Clone DX5 | BioLegend | Cat#: 108908 RRID: AB_313415 |
| Anti-mouse CD62L PE-Cy7, Clone Mel14 | BioLegend | Cat#: 104418 RRID: AB_313103 |
| Anti-mouse CD90.1 PE, Clone OX7 | BioLegend | Cat#: 202524 RRID: AB_1595524 |
| Anti-mouse CD90.1 PerCP-Cy5.5, Clone OX7 | BioLegend | Cat#: 202516 RRID: AB_961437 |
| Anti-mouse CD90.2 BV605, Clone 30H12 | BioLegend | Cat#: 105343 RRID: AB_2632889 |
| Anti-mouse F4/80 FITC, Clone BM8 | BioLegend | Cat#: 123108 RRID: AB_893502 |
| Anti-mouse Gr1 FITC, Clone RB6-8C5 | BioLegend | Cat#: 108406 RRID: AB_313371 |
| Anti-mouse IFNγ PE, Clone XMG1.2 | eBioscience | Cat#: 12-7311-82 RRID: AB_466193 |
| Anti-mouse TCF-1 Alexa647, Clone C63D9 | Cell Signaling | Cat#: 6709S RRID: AB_2797631 |
| Anti-mouse Ter119 PE, Clone Ter119 | BioLegend | Cat#: 116208 RRID: AB_313709 |
| Tetramer H60 BV421 | NIH | N/A |
| Anti-mouse TNFα PE-Cy7, Clone MAb11 | eBioscience | Cat#: 25-7349-82 RRID: AB_469686 |
| Anti-human/mouse TOX PE, Clone TXRX10 | eBioscience | Cat#: 12-6502-82 RRID: AB_10855034 |
| TotalSeq™-A0301 anti-mouse Hashtag 1 Antibody, Clones M1/42, 30-F11 | BioLegend | Cat#: 155801 RRID: AB_2750032 |
| TotalSeq™-A0302 anti-mouse Hashtag 2 Antibody; Clones M1/42, 30-F11 | BioLegend | Cat#: 155803 RRID: AB_2750033 |
| TotalSeq™-A0303 anti-mouse Hashtag 3 Antibody; Clones M1/42, 30-F11 | BioLegend | Cat#: 155805 RRID: AB_2750034 |
| TotalSeq™-A0304 anti-mouse Hashtag 4 Antibody; Clones M1/42, 30-F11 | BioLegend | Cat#: 155807 RRID: AB_2750035 |
| TotalSeq™-A0305 anti-mouse Hashtag 5 Antibody; Clones M1/42, 30-F11 | BioLegend | Cat#: 155809 RRID: AB_2750036 |
| TotalSeq™-A0306 anti-mouse Hashtag 6 Antibody; Clones M1/42, 30-F11 | BioLegend | Cat#: 155811 RRID: AB_2750037 |
| TotalSeq™-A0307 anti-mouse Hashtag 7 Antibody; Clones M1/42, 30-F11 | BioLegend | Cat#: 155813 RRID: AB_2750039 |
| TotalSeq™-A0308 anti-mouse Hashtag 8 Antibody; Clones M1/42, 30-F11 | BioLegend | Cat#: 155815 RRID: AB_2750040 |
| TotalSeq™-A0309anti-mouse Hashtag 9 Antibody; Clones M1/42, 30-F11 | BioLegend | Cat#: 155817 RRID: AB_2750042 |
| TotalSeq™-A0310 anti-mouse Hashtag 10 Antibody; Clones M1/42, 30-F11 | BioLegend | Cat#: 155819 RRID: AB_2750043 |
| Chemicals, peptides, and recombinant proteins | ||
| Fixable Viability Dye eFluor506 | eBioscience | Cat#: 65-0866-14 |
| Fixable Viability Dye eFluor780 | eBioscience | Cat#: 65-0865-14 |
| Cell Trace Violet | Molecular Probes | Cat#:C34557 |
| FTY720 | Sigma | Cat#: SML0700 |
| Phorbol 12-myristate 13-acetate | Sigma | Cat#: P8139 |
| Ionomycin calcium salt | Sigma | Cat#: I0634 |
| Collagenase, Type IV | Sigma | Cat#: C5138 |
| Dispase II | Gibco | Cat#: 17105041 |
| DNase I recombinant, RNase-free | Sigma | Cat#: 10104159001 |
| Liberase TL Research Grade | Sigma | Cat#: 05401020001 |
| EDTA | Invitrogen | Cat#: 15575020 |
| DL-Dithiothreitol | Thermo Scientific | Cat#: R0861 |
| Histopaque-1077 | Sigma | Cat#: SD10771A |
| Opti-prep Density Gradient Medium | Sigma | Cat#: D1556 |
| RPMI 1640 | Gibco | Cat#: 11875119 |
| HBSS | Gibco | Cat#: 14170161 |
| Calf Serum | Gibco | Cat#: 16170060 |
| HEPES | Gibco | Cat#:15630-130 |
| Recombinant murine IL-2 | BioLegend | Cat#: 575402 |
| Critical commercial assays | ||
| EasySep CD4 Isolation Kit | Stem Cell | Cat#: 19852 |
| EasySep CD8 Isolation Kit | Stem Cell | Cat#: 19853 |
| EasySep CD902. Selection Kit | Stem Cell | Cat#: 19851 |
| Foxp3 Transcription Factor Staining Buffer Set | eBioscience | Cat#: 50-112-8857 |
| BD Cytofix/Cytoperm Kit with GolgiPlug | BD Biosciences | Cat#: BD555128 |
| Phase Flow FITC BrdU Kit | BioLegend | Cat#: 370704 |
| Chromium Single Cell 3’ Library and Gel Bead Kit | 10X Genomics | Cat#: PN-1000075 |
| Deposited data | ||
| scRNAseq on TS1 cells isolated from spleen, small intestine (IELs and LPLs), colon and skin of GVHD mice 4 weeks post-transplant. | This manuscript | NCBI Accession: GSE207485 |
| Experimental models: Organisms/strains | ||
| TS1 | Kirberg et al. 1994 | RRID:MMRRC_043834-JAX |
| HA104 | Caton et al. 1996 | MMRRC Strain #043831-JAX |
| BALB/cJ | Jackson Laboratory | RRID:IMSR_JAX:000651 |
| B10.D2 | Jackson Laboratory | RRID:IMSR_JAX:000463 |
| C3H.SW | Zhou et al.2020 | RRID:IMSR_JAX:000438 |
| actH60 | Zhou et al.2020 | N/A |
| B6 TCF7-DTR | Siddiqui et al. 2019 | N/A |
| Software and algorithms | ||
| FlowJo (v9 and 10) | https://www.flowjo.com | RRID:SCR_008520 |
| Prism (v9.4.1) | https://www.graphpad.com | RRID:SCR_002798 |
| Adobe Illustrator CS | http://www.adobe.com/products/illustrator.html | RRID: SCR_010279 |
| Biorender | http://biorender.com | RRID:SCR_018361 |
| Cell Ranger (v3.1.0) | https://github.com/10XGenomics/cellranger | RRID:SCR_017344 |
| Python (v3.8.5) | http://www.python.org | RRID:SCR_008394 |
| RStudio (v2022.07.0) | http://www.rstudio.com | RRID:SCR_000432 |
| Seurat (3.3.2) | http://seurat.r-forge.r-project.org | RRID:SCR_007322 |
| Scran (v1.16.0) | https://bioconductor.org/packages/release/bioc/html/scran.html | RRID:SCR_016944 |
| Scater (v.1.16.2) | https://bioconductor.org/packages/release/bioc/html/scater.html | RRID:SCR_015954 |
| Cowplot (1.1.0) | https://cran.r-project.org/web/packages/cowplot/index.html | RRID:SCR_018081 |
| Mclust (v5.4.7) | https://debian.pkgs.org/11/debian-main-amd64/r-cran-mclust_5.4.7-1_amd64.deb.html | N/A |
| DropletUtils (v1.8.0) | https://tracker.debian.org/pkg/r-bioc-dropletutils | N/A |
| NumPy (v1.19.2) | http://www.numpy.org | RRID:SCR_008633 |
| Pandas (v1.1.3) | https://pandas.pydata.org | RRID:SCR_018214 |
| Scipy (v1.7.3) | http://www.scipy.org | RRID:SCR_008058 |
| MatPlotLib (3.3.2) | http://matplotlib.sourceforge.net | RRID:SCR_008624 |
This paper does not report original code.
Any additional information required to reanalyze the data reported in this paper is available from the lead contact upon request.