

Abstract
Objective:
To determine the prognostic role of metastatic lymph node (LN) number and the minimal number of LNs for optimal staging of patients with pancreatic neuroendocrine tumors (pNETs).
Background:
Prognosis relative to number of LN metastasis (LNM), and minimal number of LNs needed to evaluate for accurate staging, have been poorly defined for pNETs.
Methods:
Number of LNM and total number of LN evaluated (TNLE) were assessed relative to recurrence-free survival (RFS) and overall survival (OS) in a multi-institutional database. External validation was performed using Surveillance, Epidemiology and End Results (SEER) registry.
Results:
Among 854 patients who underwent resection, 233 (27.3%) had at least 1 LNM. Patients with 1, 2, or 3 LNM had a comparable worse RFS versus patients with no nodal metastasis (5-year RFS, 1 LNM 65.6%, 2 LNM 68.2%, 3 LNM 63.2% vs 0 LNM 82.6%; all P < 0.001). In contrast, patients with ≥4 LNM (proposed N2) had a worse RFS versus patients who either had 1 to 3 LNM (proposed N1) or node-negative disease (5-year RFS, ≥4 LNM 43.5% vs 1–3 LNM 66.3%, 0 LNM 82.6%; all P < 0.05) [C-statistics area under the curve (AUC) 0.650]. TNLE ≥8 had the highest discriminatory power relative to RFS (AUC 0.713) and OS (AUC 0.726) among patients who had 1 to 3 LNM, and patients who had ≥4 LNM in the multi-institutional and SEER database (n = 2764).
Conclusions:
Regional lymphadenectomy of at least 8 lymph nodes was necessary to stage patients accurately. The proposed nodal staging of N0, N1, and N2 optimally staged patients.
Keywords: lymph node status, neuroendocrine tumor, pancreas, prognosis, surgery
Pancreatic neuroendocrine tumors (pNETs) are a group of uncommon tumors that have varied clinical behavior. pNETs account for roughly 2% to 4% of all pancreatic neoplasms diagnosed in the general population.1,2 Partially due to the widespread use of cross-sectional imaging and subsequent increased disease detection, the incidence of pNETs has increased from 1.07 in 1973 to 5.25 per 100,000 in 2014.3 While some pNETs are associated with hormone secretion, such as insulin, gastrin, glucagon, or other hormones, most pNETs are sporadic and nonfunctional. The natural history of pNETs can also vary widely as most tumors have an indolent behavior with slow and expansive growth, yet other pNETs can display an aggressive phenotype with local invasion and distant metastasis.4,5
Surgical resection is the mainstay of therapy for pNETs, particularly for localized disease. While the prognosis of pNETs is superior to pancreatic adenocarcinoma, a subset of patients have more aggressive disease with a poor prognosis.4,6–8 In particular, pNETs associated with lymph node metastasis (LNM) generally have worse long-term outcomes.4,9–12 As such, the 8th edition of the American Joint Committee on Cancer (AJCC) tumor node metastasis (TNM) and European Neuroendocrine Tumor Society (ENETS) staging systems include nodal status defined on final pathologic examination as part of the staging scheme.13–17 Specifically, the presence of LNM renders disease as stage III according to both the AJCC and ENETS staging systems.13–17 The staging of nodal disease for some cancers, such as pancreatic adenocarcinoma, perihilar, and gallbladder cholangiocarcinoma, has been further classified as N0 (no nodal metastasis), N1 (1–3 LNM), and N2 (≥4 LNM).14 In contrast, prognosis relative to number of LNM, and also the minimal number of lymph nodes (LNs) needed to evaluate for optimal staging, have not been defined among patients undergoing curative resection for pNETs. As such, the objective of the current study was to characterize how the number of metastatic LN may impact disease-free survival (DFS), and also overall survival (OS). In addition, we sought to determine the minimal number of LNs needed to examine to achieve optimal staging of patients undergoing resection of pNETs.
METHODS
Study Cohort
Patients who underwent curative-intent resection for pNETs between 2000 and 2016 were identified from the US Neuroendocrine Tumor Study Group (US-NETSG). US-NETSG was established in 2016 as a collaboration of 8 institutions (The Ohio State University Wexner Medical Center and James Comprehensive Cancer Center, Columbus, OH; Winship Cancer Institute, Emory University, Atlanta, GA; Stanford University, Palo Alto, CA; Virginia Mason Medical Center, Seattle, WA; University of Wisconsin, School of Medicine and Public Health, Madison, WI; Washington University, School of Medicine, St. Louis, MO; Vanderbilt University, Nashville, TN; University of Michigan, Ann Arbor, MI). All included patients were histologically diagnosed with pNETs. Patients with metastatic disease, and also individuals with mortality within 30 days were excluded. The Institutional Review Board of each participating institution approved the study.
Data Collection and Pathological Assessment
Details on patient demographic, clinicopathologic, and perioperative data were collected based on a prospectively maintained database. Surgical specimens were reviewed by expert pancreatic pathologists at each institution. In particular, the number of LNs harvested and the number of LNM were recorded. The LN ratio (LNR) was defined as the ratio of number of metastatic LNs relative to the total number of LN examined (TNLE).18 Tumor staging was based on the guidelines of the AJCC Cancer Staging Manual, 8th edition.13,14 Patients were regularly followed after surgery with ultrasound, abdominal computed tomography (CT) and/or magnetic resonance imaging (MRI) scanning. Recurrence-free survival (RFS) was defined as time duration from the date of surgery to tumor recurrence. Recurrence was defined as identification of suspicious imaging findings or biopsy-proven tumor. OS and disease-specific survival (DSS) were also calculated from the date of surgery.
Data Collection From the Surveillance, Epidemiology and End Results Registry
The proposed nodal staging derived from the multi-intuitional dataset was externally validated using the Surveillance, Epidemiology and End Results (SEER) database. Specifically, patients who underwent surgical resection for pNET between 1973 and 2015 were identified from the SEER database using the 3rd edition International Classification of Disease for Oncology (ICD-O-3). Patients with pNET were identified using the primary site code for pancreas (C25.0–C25.9) and the histology code for carcinoid tumor (8240), neuroendocrine carcinoid (8246), islet-cell adenocarcinoma (8150), malignant beta-cell tumor (8151), malignant alpha-cell tumor (8152), G-cell tumor (8153), VIPoma (8155), malignant somatostatinoma (8156), malignant enteroglucagonoma (8157), argentaffin carcinoid tumor (8241), enterochromaffin cell tumor (8242), mucocarcinoid tumor (8243), and atypical carcinoid tumor (8249). Using this algorithm, 9481 patients with pNET were identified. Only patients with microscopically confirmed pNET who underwent cancer-directed surgery (surgery of primary site codes: 20–90) were included (n = 4032). Patients with no data on lymphadenectomy (n = 1162) or who had missing data on the pathologic examination of LN (n = 47) were excluded. As such, a total of 2764 patients with pNETs constituted the external validation cohort.
Statistical Analysis
Continuous and categorical variables were expressed as medians [interquartile ranges (IQRs)] and totals (percentages), respectively. Statistical analyses were performed with the Mann–Whitney U test, chi-square test, or Fisher exact test, as appropriate. Survival probabilities were estimated using Kaplan–Meier methodology and compared with log-rank analysis. The receiver-operating characteristic curve (ROC) analysis was used to investigate the discriminatory ability of TNLE relative to the number of LNM. Variables with a P value less than 0.05 on univariate analysis were included in the multivariable analyses; results were reported as hazard ratios (HRs) or odds ratio (ORs) with 95% confidence intervals (95% CIs). Statistical analysis was performed using SPSS 22.0 (IBM SPSS, IL) and STATA 14.0 (StataCorp, College Station, TX). To assess the predictive ability of number of LN needed to be examined, the c-index for time-to-event data was calculated with the bootstrapping resample method (n = 5000) with the R CRAN package Hmisc (v. 3.6.0, 2019). All tests were 2-sided, and a P value <0.05 was considered statistically significant.
RESULTS
Baseline Characteristics
In all, 854 patients who underwent curative-intent resection for pNETs were included in the multi-institutional analytic cohort (Table 1). Median age was 58 (IQR 47–66) years, and 48.2% (n = 412) individuals were male. A majority of patients (n = 749, 87.3%) had nonfunctional tumors, whereas roughly one-half of patients (n = 457, 53.5%) were symptomatic. The most common tumor location was the pancreatic tail (n = 346, 40.5%) followed by head/uncinate (n = 307, 35.9%). Distal pancreatectomy (n = 525, 61.5%) was the most common procedure followed by pancreaticoduodenectomy (n = 278, 32.6%).
TABLE 1.
Clinicopathologic Characteristics and Operative Details of Patients Undergoing Curative Resection for Pancreatic Neuroendocrine Tumors (pNETs)
| Overall (N = 854) | |
|---|---|
|
| |
| Age (yrs) | 58 (47–66) |
| Male | 412 (48.2%) |
| BMI (kg/m2) | 27.8 (24.3–33.0) |
| Functional tumor | 105 (12.3%) |
| Symptomatic | 457 (53.5%) |
| Primary location | |
| Head/uncinate | 307 (35.9%) |
| Neck/body | 200 (23.4%) |
| Tail | 346 (40.5%) |
| Largest tumor size (cm) | 2.2 (1.4–3.8) |
| Multiple tumors | 89 (10.4%) |
| Type of resection | |
| Pancreaticoduodenectomy | 278 (32.6%) |
| Distal pancreatectomy | 525 (61.5%) |
| Enucleation | 51 (6.0%) |
| Splenectomy | 458 (53.6%) |
| Additional enucleation | 21 (2.5%) |
| Major vascular resection | 46 (5.4%) |
| Operation time (min) | 240 (190–322) |
| Estimated blood loss (mL) | 200 (100–400) |
| No. of lymph node retrieved | 10 (5–16) |
| Lymph nodes status | |
| Negative | 621 (72.7%) |
| Positive | 233 (27.3%) |
| Lymph node ratio | |
| 0 | 621 (72.8%) |
| 1%-25% | 145 (17.0%) |
| 26%-50% | 45 (5.3%) |
| >50% | 42 (4.9%) |
| Tumor differentiation | |
| Well differentiated | 658 (77.0%) |
| Moderately differentiated | 81 (9.5%) |
| Poorly differentiated | 20 (2.3%) |
| NA | 95 (11.1%) |
| Margin status | |
| R0 | 727 (85.1%) |
| R1 | 127 (14.9%) |
| Ki-67 | |
| <3% | 347 (40.6%) |
| 3%-20% | 227 (26.6%) |
| >20% | 26 (3.0%) |
| Mitotic rate | |
| <2 | 418 (48.9%) |
| 2–20 | 94 (11.0%) |
| >20 | 8 (0.9%) |
| WHO classification | |
| G1 | 434 (50.8%) |
| G2 | 220 (25.8%) |
| G3 | 29 (3.4%) |
| Unknown | 171 (20.0%) |
| AJCC T status | |
| T1 | 354 (41.5%) |
| T2 | 278 (32.6%) |
| T3 | 212 (24.8%) |
| T4 | 3 (0.4%) |
| Unknown | 7 (0.8%) |
| Lympho-vascular invasion | 240 (28.1%) |
| Perineural invasion | 165 (19.3%) |
The median number of LN harvested was 10 (IQR 5–16); roughly 1 in 4 patients had at least 1 LNM (n = 233, 27.3%). Among the 233 patients who had metastatic nodal disease, the LNR ranged from 1% to 25% in 145 (17.0%) patients, 26% to 50% in 45 (5.3%) patients, and higher than 50% in 42 (4.9%) patients. On multivariable analysis, factors associated with LNM included TNLE ≥8 (OR 2.0, 95% CI 1.2–3.4, P = 0.007), AJCC stage (T2 vs T1, OR 1.8, 95% CI 1.0–3.2, P = 0.044; T3–T4 vs T1, OR 4.2, 95% CI 2.2–7.8, P < 0.001) and lympho-vascular invasion (OR 6.3, 95% CI 3.8–10.5, P < 0.001) (Table 2).
TABLE 2.
Factors Associated With Lymph Node Metastasis (N1) Among Patients With Pancreatic Neuroendocrine Tumors (pNETs)
| Univariate Analysis |
Multivariable Analysis |
|||
|---|---|---|---|---|
| OR (95% CI) | P | OR (95% CI) | P | |
|
| ||||
| Functional status | 0.133 | |||
| Nonfunctional | Ref. | |||
| Functional | 0.7 (0.4–1.1) | |||
| Genetic syndrome | 0.019 | 0.041 | ||
| Not associated | Ref. | Ref. | ||
| Associated | 1.7 (1.1–2.8) | 2.1 (1.0–4.3) | ||
| Symptomatic | 0.002 | 0.318 | ||
| No | Ref. | Ref. | ||
| Yes | 1.6 (1.2–2.2) | 1.3 (0.8–2.1) | ||
| AJCC T categories | ||||
| T1 | Ref. | Ref. | ||
| T2 | 3.0 (1.9–4.7) | <0.001 | 1.8 (1.0–3.2) | 0.044 |
| T3-T4 | 14.1 (9.0–22.1) | <0.001 | 4.2 (2.2–7.8) | <0.001 |
| Total lymph nodes examined | <0.001 | 0.007 | ||
| <8 | Ref. | Ref. | ||
| >8 | 2.5 (1.8–3.4) | 2.0 (1.2–3.4) | ||
| Multiple lesions | 1.0 (0.6–1.6) | 0.982 | ||
| Tumor differentiation | ||||
| Well differentiated | Ref. | Ref. | ||
| Moderately differentiated | 2.2 (1.4–3.7) | 0.001 | 1.7 (0.8 – 3.4) | 0.179 |
| Poorly differentiated | 5.8 (2.3–14.9) | <0.001 | 1.9 (0.5 – 8.0) | 0.371 |
| Lympho-vascular invasion | 10.9 (7.4–16.1) | <0.001 | 6.3 (3.8–10.5) | <0.001 |
| Perineural invasion | 4.3 (2.9–6.2) | <0.001 | 1.5 (0.9–2.6) | 0.153 |
Nodal Metastasis and Tumor Recurrence
With a median follow-up of 35 months, 138 out of 854 (16.2%) patients had experienced tumor recurrence. Patients with at least 1 LNM had a worse RFS compared with patients who had no nodal disease (5-year RFS, LNM 59.5% vs no nodal disease 82.6%; HR 2.8, 95% CI 2.0–3.9; P < 0.001) (Fig. 1A). Patients with 1, 2, or 3 LNM had a comparable worse RFS versus patients with no nodal metastasis (5-year RFS, 1 LNM 65.6%, 2 LNM 68.2%, 3 LNM 63.2% vs no nodal disease 82.6%; all P < 0.001) (Fig. 1B and C). In contrast, patients with ≥4 LNM (proposed N2) had a worse RFS versus patients who either had 1 to 3 LNM (proposed N1) or node-negative disease (5-year RFS, ≥4 LNM 43.5% vs 1–3 LNM 66.3%, no nodal disease 82.6%; all P < 0.05) (Fig. 1D and E). The predictive accuracy (discrimination) of the proposed N0 versus N1 versus N2 categorization was very good with a C-statistic to predict tumor recurrence of 0.650 in the training dataset and 0.645 with bootstrapping resamples (n = 5000) in the test dataset.
FIGURE 1.
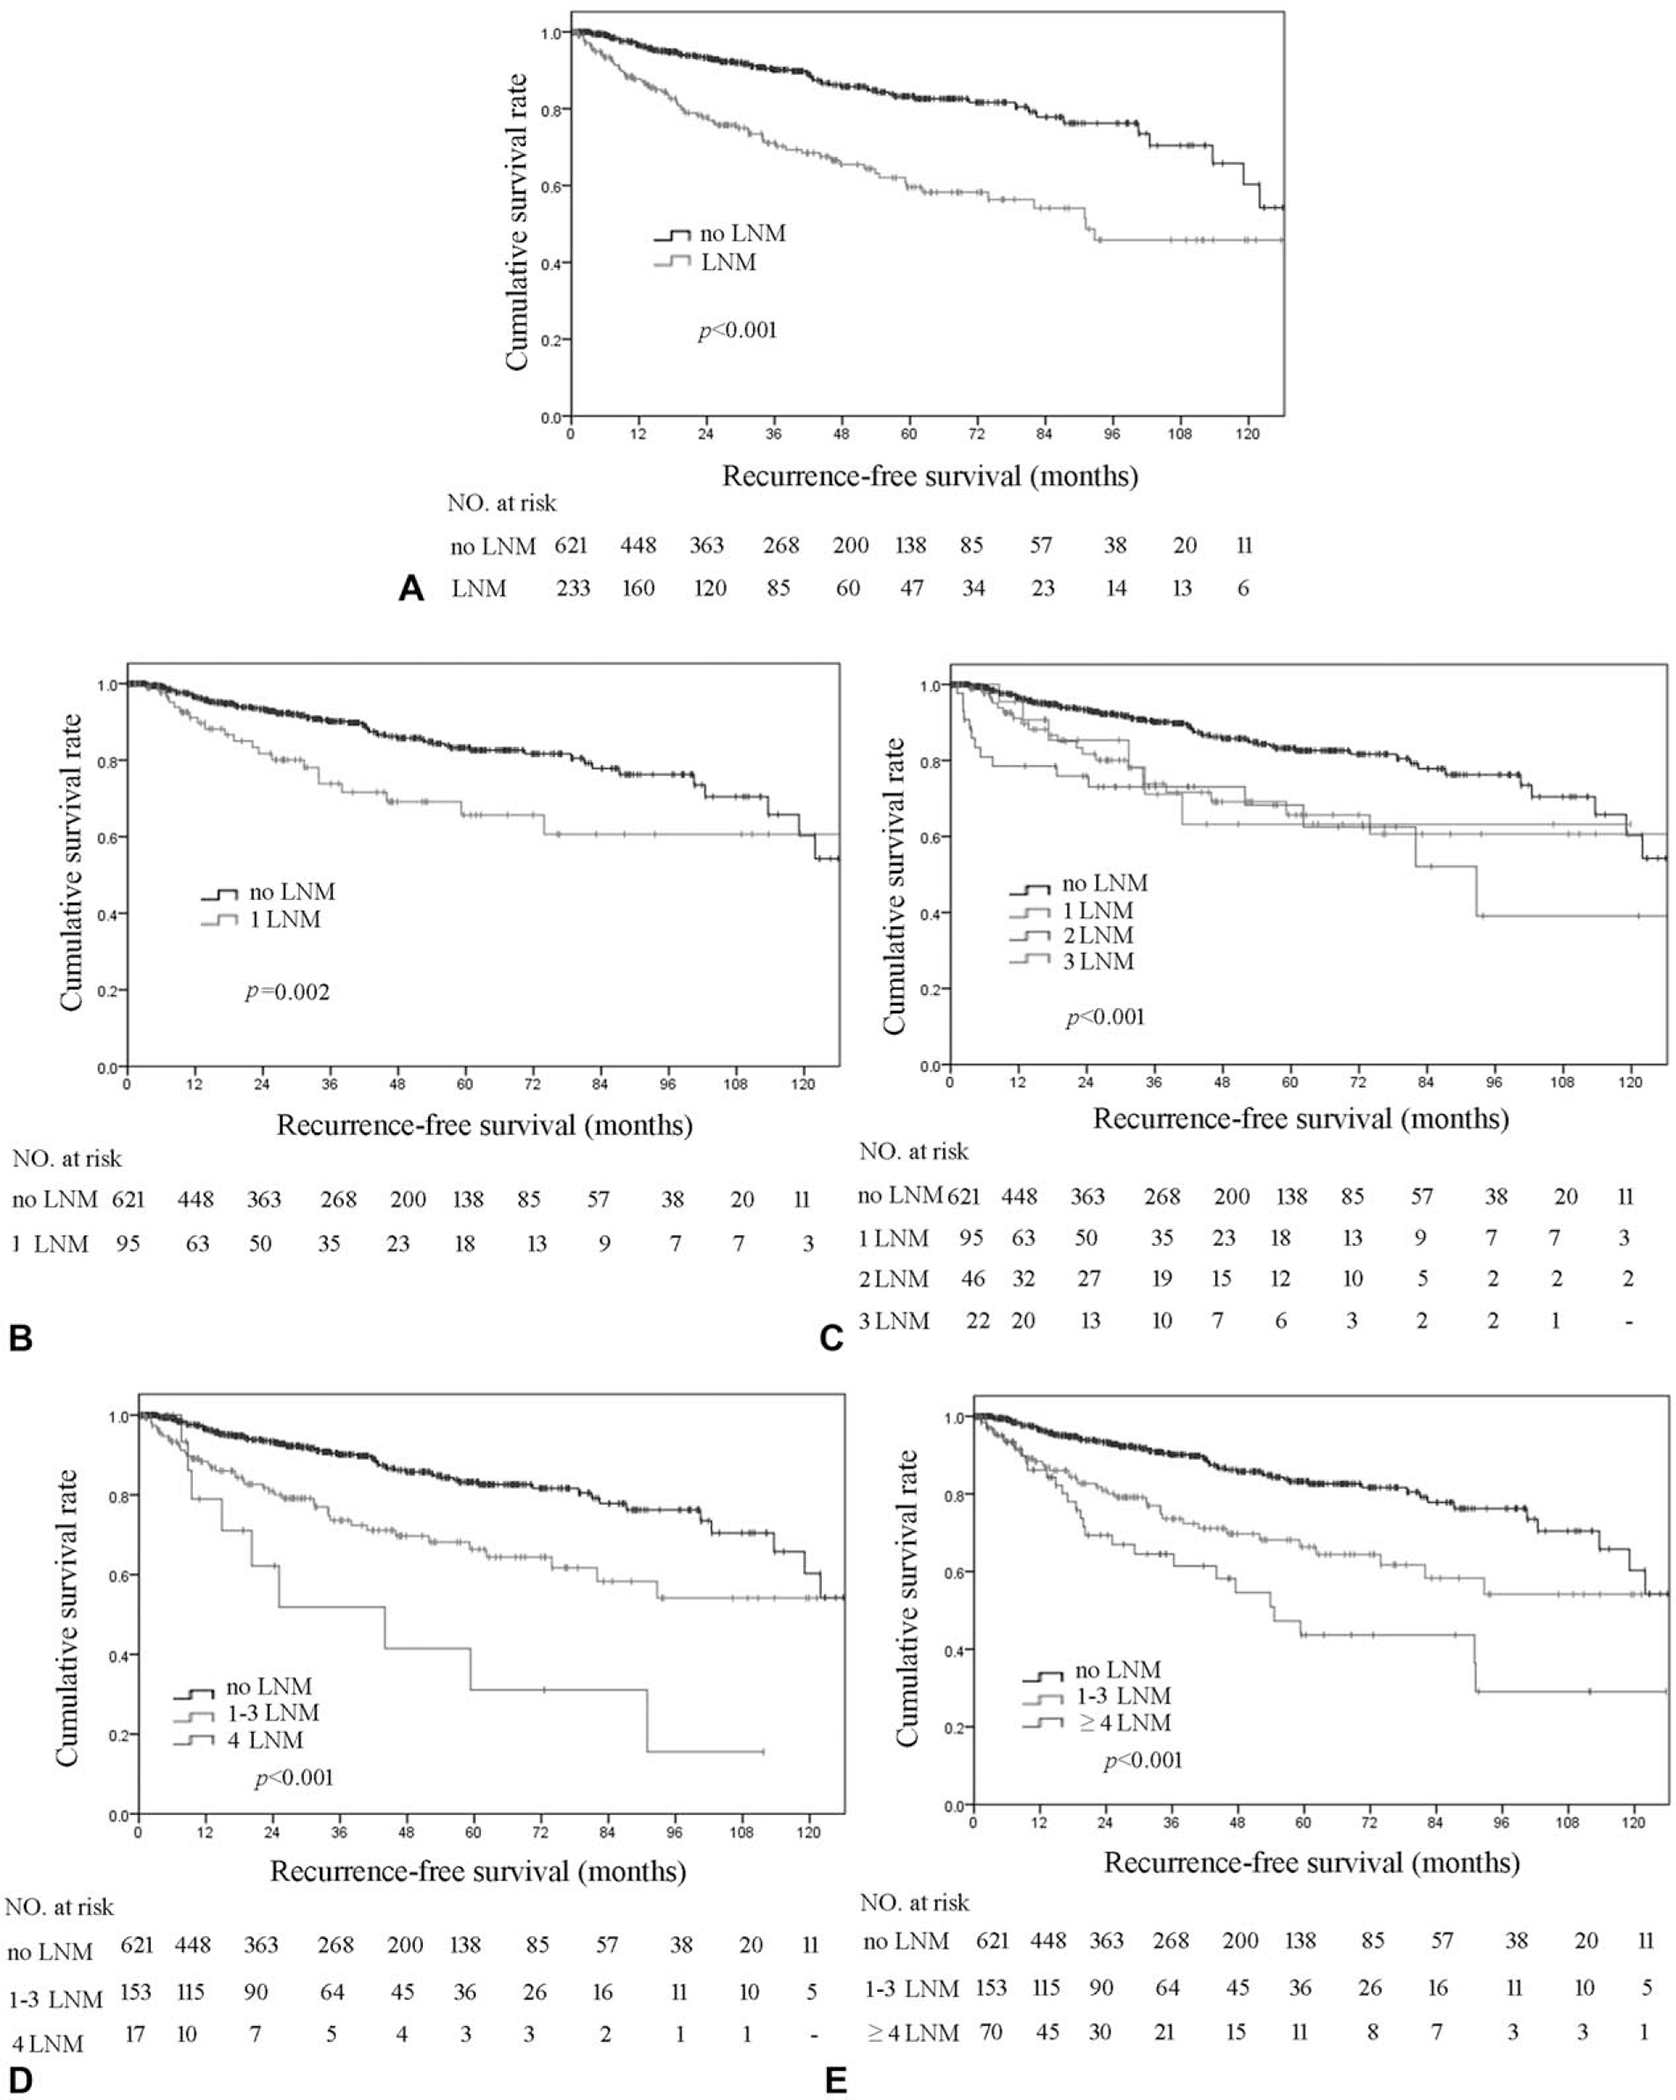
Kaplan–Meier analysis of recurrence-free survival (RFS) stratified by number of lymph node metastasis (LNM). (A) No LNM versus any LNM; (B) no LNM versus 1 LNM; (C) no LNM versus 1, 2, and 3 LNM; (D) no LNM versus 1 to 3 LNM versus 4 LNM; (E) no LNM versus 1 to 3 LNM versus ≥4 LNM.
On multivariable analysis, ≥4 LNM (HR 2.0, 95% CI 1.1–3.8, P = 0.031), LNR 26% to 50% (HR 2.0, 95% CI 1.1–4.3, P = 0.019), LNR >50% (HR 2.6, 95% CI 1.7–3.6, P = 0.001), and also other tumor-specific factors, such as AJCC T3 to T4 (both P < 0.05 in models 1 and 2), poor tumor differentiation (both P < 0.05 on models 1 and 2), and lympho-vascular invasion (both P < 0.01 in models 1 and 2) were strongly associated with worse RFS among patients undergoing curative-intent resection for pNETs (Table 3).
TABLE 3.
Factors Associated With Recurrence-free Survival After Curative Resection for Pancreatic Neuroendocrine Tumors (pNETs)
| Univariate Analysis |
Multivariable Analysis (Model 1) |
Multivariable Analysis (Model 2) |
||||
|---|---|---|---|---|---|---|
| HR (95% CI) | P | HR (95% CI) | P | HR (95% CI) | P | |
|
| ||||||
| AJCC T categories | <0.001 | |||||
| T1 | Ref. | Ref. | Ref. | |||
| T2 | 3.4 (2.0–5.9) | <0.001 | 1.9 (0.9–4.0) | 0.099 | 1.9 (1.0–3.8) | 0.067 |
| T3-T4 | 8.2 (4.9–13.8) | <0.001 | 2.7 (1.2–6.1) | 0.015 | 3.7 (1.8–7.8) | <0.001 |
| Multiple lesions | 0.7 (0.4–1.2) | 0.172 | ||||
| Surgical margin | 0.007 | 0.212 | 0.530 | |||
| R0 | Ref. | Ref. | Ref. | |||
| R1 | 1.7 (1.2–2.6) | 1.4 (0.8–2.3) | 1.2 (0.7–2.0) | |||
| Tumor differentiation | ||||||
| Well differentiated | Ref. | Ref. | Ref. | |||
| Moderately differentiated | 1.6 (0.9–2.7) | 0.098 | 0.8 (0.4–1.7) | 0.636 | 0.7 (0.3–1.4) | 0.270 |
| Poorly differentiated | 6.2 (3.2–12.1) | <0.001 | 3.7 (1.5–8.8) | 0.004 | 2.7 (1.1–6.6) | 0.028 |
| Nodal status | ||||||
| N0 | Ref. | Ref. | ||||
| 1–3 positive nodes | 2.2 (1.5–3.3) | <0.001 | 1.0 (0.6–1.8) | 0.925 | ||
| ≥4 positive nodes | 3.8 (2.3–6.0) | <0.001 | 2.0 (1.1–3.8) | 0.031 | ||
| Total lymph nodes examined | 0.241 | |||||
| <8 | Ref. | |||||
| ≥8 | 1.2 (0.9–1.7) | |||||
| Lymph node ratio | ||||||
| 0 | Ref. | Ref. | ||||
| 1%-25% | 2.6 (1.8–3.9) | <0.001 | 1.3 (0.8–2.2) | 0.351 | ||
| 26%-50% | 2.7 (1.5–4.8) | 0.001 | 2.0 (1.1–4.3) | 0.019 | ||
| >50% | 3.3 (1.9–5.8) | <0.001 | 2.6 (1.7–3.6) | 0.001 | ||
| Lympho-vascular invasion | 4.6 (3.1 –6.9) | <0.001 | 2.3 (1.3–4.1) | 0.006 | 2.2 (1.3–3.9) | 0.006 |
| Perineural invasion | 2.4 (1.6–3.7) | <0.001 | 1.3 (0.7–2.2) | 0.429 | 1.2 (0.7–2.1) | 0.403 |
Total Number of Lymph Node Examined and Nodal Status
Total Number of Lymph Node Examined impacted the chance of identifying LNM. Specifically, TNLE 8 had the highest discriminatory power relative to RFS among patients who had 1 to 3 LNM, and also patients who had ≥4 LNM (area under the curve [AUC] 0.713, Youden index 0.32) (Fig. 2A). In addition, TNLE ≥8 was associated with a higher incidence of identifying any LNM (TNLE <8: 57/332, 17.2% vs TNLE ≥8: 175/519, 33.7%; P < 0.001); on multivariable analyses, TNLE ≥8 remained independently associated with increased odds of identifying LNM (OR 2.0, 95% CI 1.2–3.4, P = 0.007). TNLE ≥8 was also associated with a higher number of LNM detected (TNLE <8: median, 1.0 vs TNLE ≥8: median, 2.0; P < 0.001). Of note, among patients with a TNLE <8, there was only a modest difference in 5-year RFS among patients who had 1 to 3 LNM (63.6%) versus ≥4 LNM (51.4%) (P = 0.265) (Fig. 2B). In contrast, among patients who had TNLE ≥8, there was a stepwise incremental worsening of RFS among patients who had no nodal disease, 1 to 3 LNM, and ≥4 LNM (5-year RFS, 82.4% vs 67.2% vs 42.6%, respectively; P < 0.05) (Fig. 2C). As enucleation may affect the number of LNs harvested, additional analyses were performed after exclusion of the 51 patients who underwent enucleation only; the results were consistent with the whole analytic cohort (Supplementary Fig. 1, http://links.lww.com/SLA/B702).
FIGURE 2.
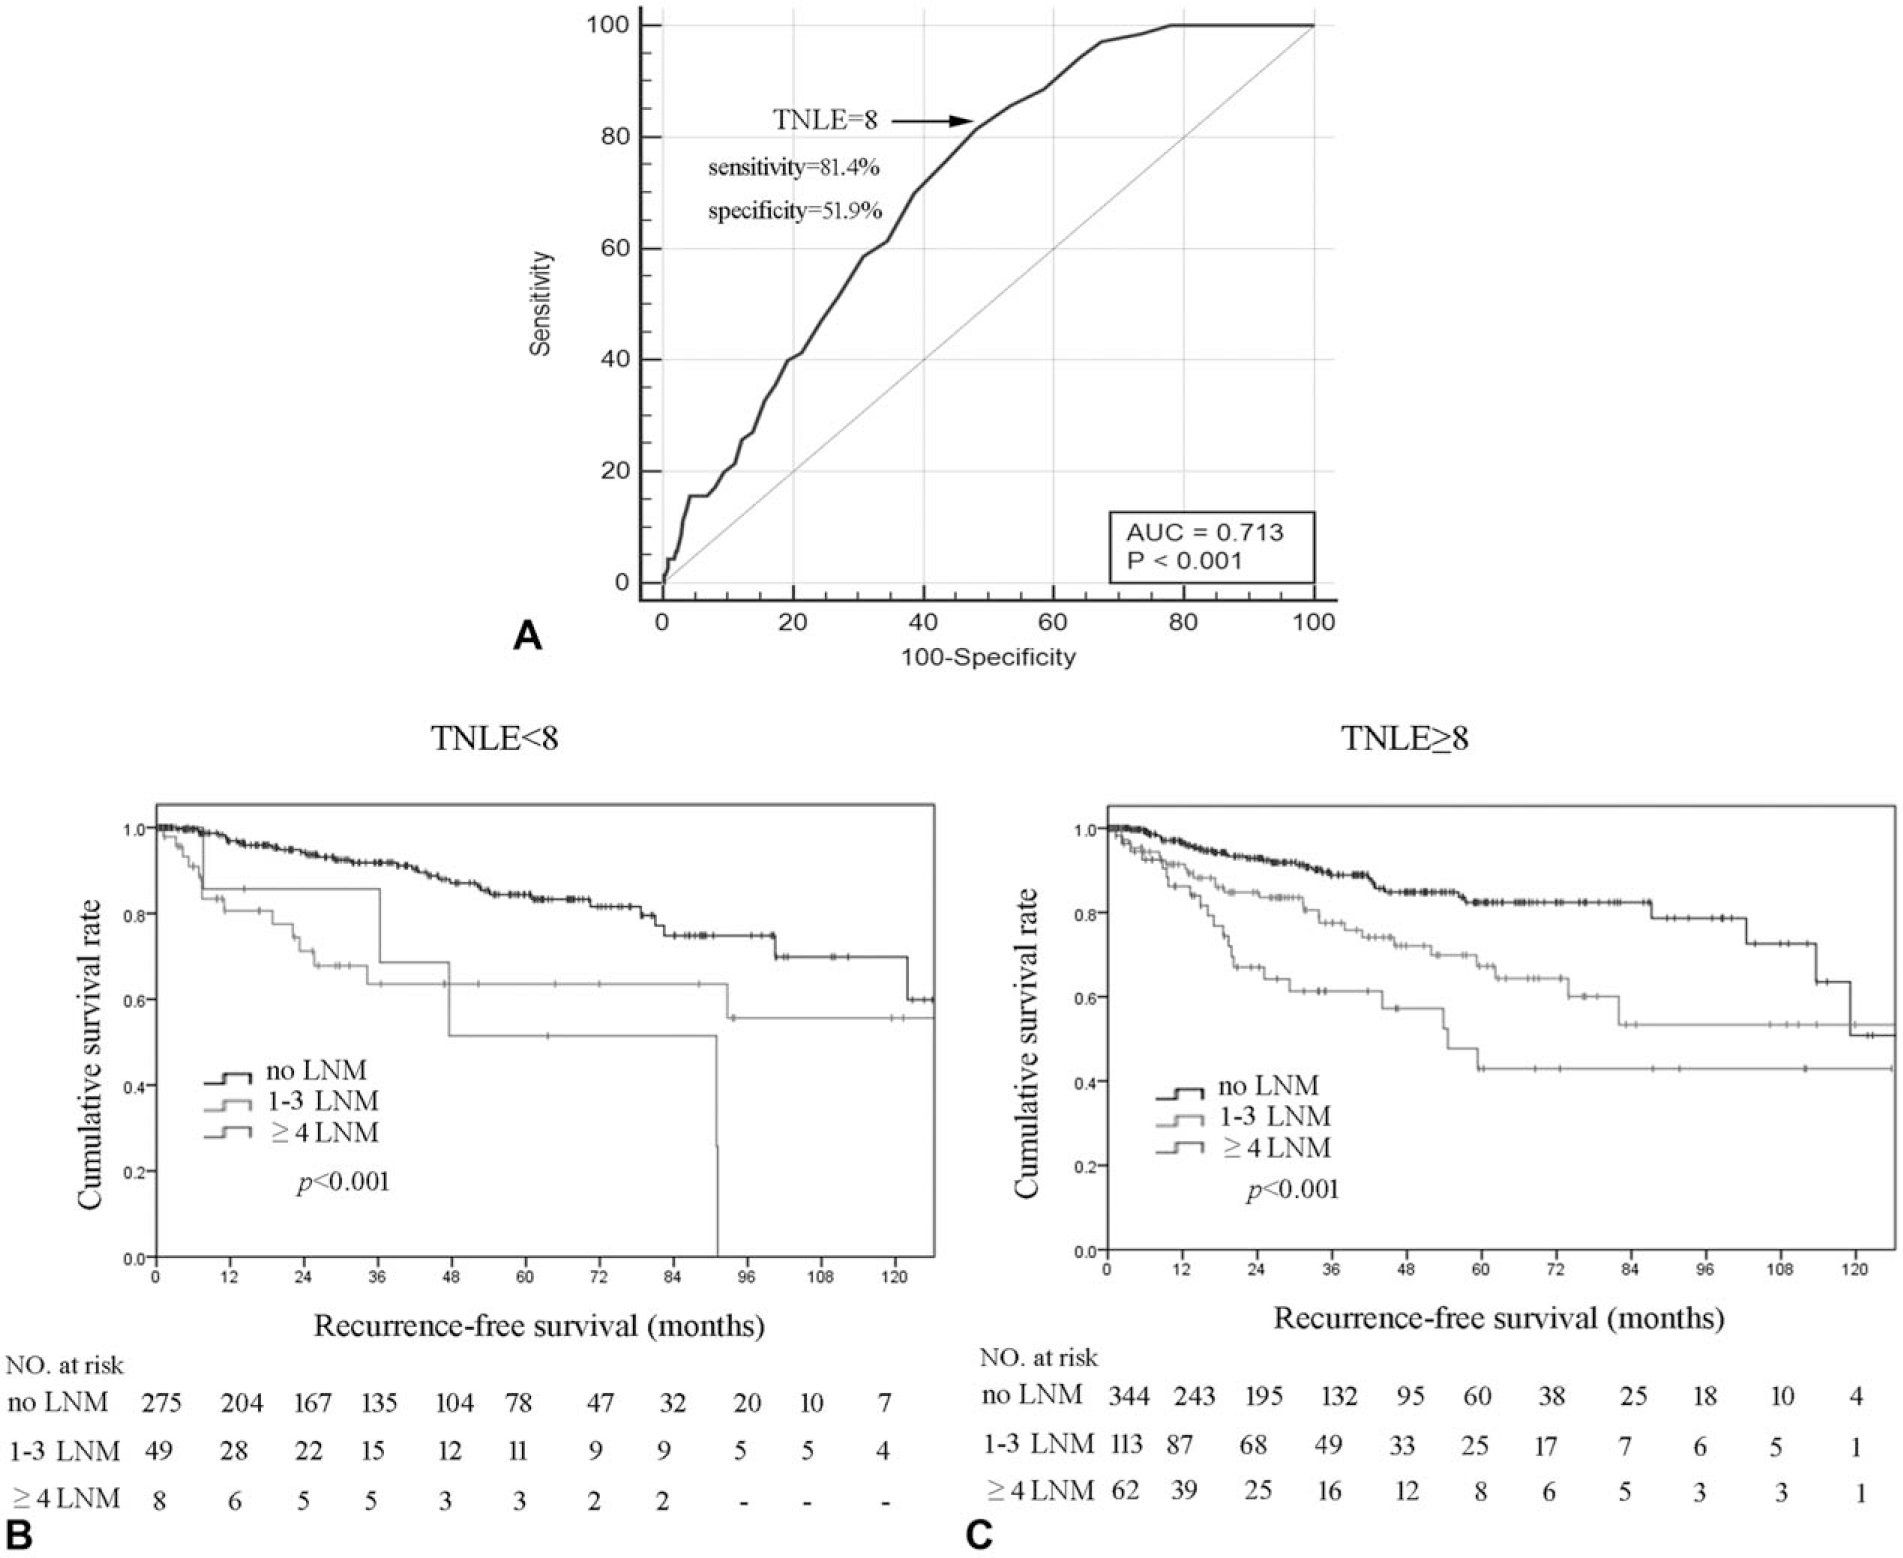
(A) Receiver-operating characteristic (ROC) analysis illustrating that total number of lymph nodes examined (TNLE) ≥8 had the highest discriminatory power relative to recurrence-free survival (RFS) among patients who had 1 to 3 lymph node metastasis (LNM) and patients who had ≥4 LNM (AUC 0.713, Youden index 0.32, sensitivity 81.4%, specificity 51.9%, P < 0.001); Kaplan–Meier RFS analysis of patients with 0, 1 to 3, and ≥4 LNM stratified by TNLE <8 (B) or ≥8 (C).
LNM and Long-term Survival
Among the 854 patients in the multi-institutional database, patients with node-negative disease, 1 to 3 LNM, and ≥4 LNM had an increasingly worse OS (5-year OS, N0 91.3% vs proposed N1 87.5% vs proposed N2 67.0%; P < 0.05) (Fig. 3A), and also DSS (5-year DSS, N0 98.1% vs proposed N1 92.0% vs proposed N2 75.3%; P < 0.05) (Fig. 3B). The proposed N stage was then examined using the SEER database. Specifically, among the 2764 patients identified in the SEER dataset who underwent surgical resection for pNETs, 1000 (36.2%) patients had at least 1 LNM on final pathologic analysis. Of note, patients who had node-negative disease, 1 to 3 LNM, and ≥4 LNM had a progressive worse OS (5-year OS, N0 84.2% vs N1 75.0% vs N2 62.6%; P < 0.001) (Fig. 4A). In addition, TNLE ≥8 had the highest discriminatory power relative to OS among N1 versus N2 patients (C-statistic AUC 0.726) (Fig. 4B). Specifically, among patients who had TNLE <8, there was no difference in OS among patients who had 1 to 3 LNM versus patients who had ≥4 LNM (5-year OS, N1 69.8% vs N2 60.0%; P = 0.409) (Fig. 4C). In contrast, when TNLE was 8, there was a stepwise incremental worsening among patient with no nodal disease, 1 to 3 LNM, and ≥4 LNM (5-year OS, N0 84.2% vs proposed N1 78.7% vs proposed N2 63.0%; P < 0.01) (Fig. 4D).
FIGURE 3.
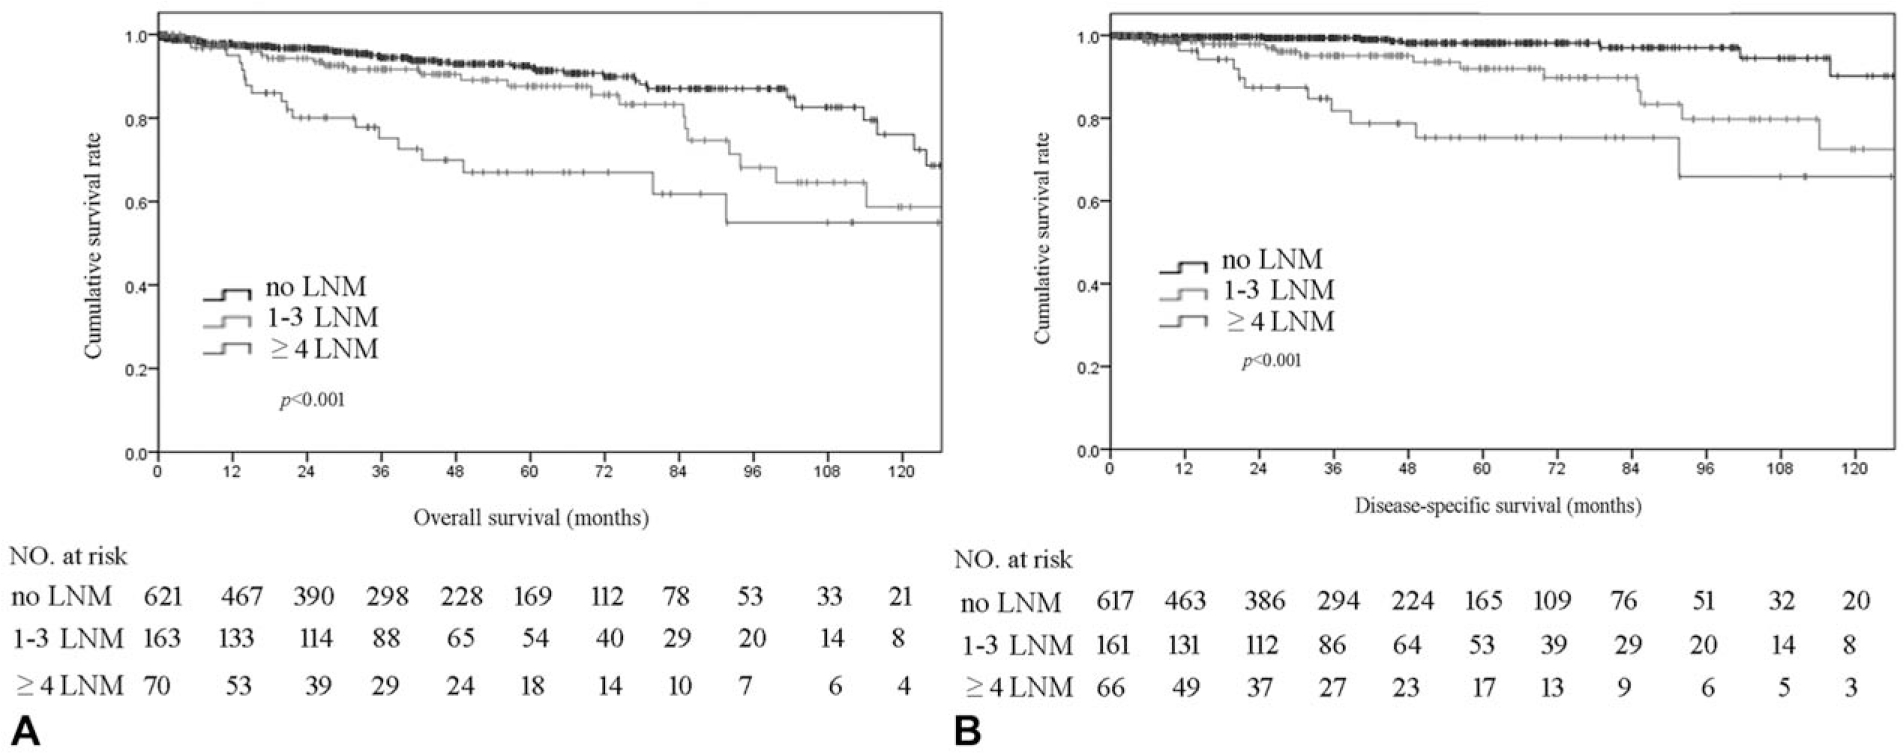
Overall (A) and disease-specific survival (B) of patients who had 0, 1 to 3, and ≥4 lymph node metastasis (LNM).
FIGURE4.
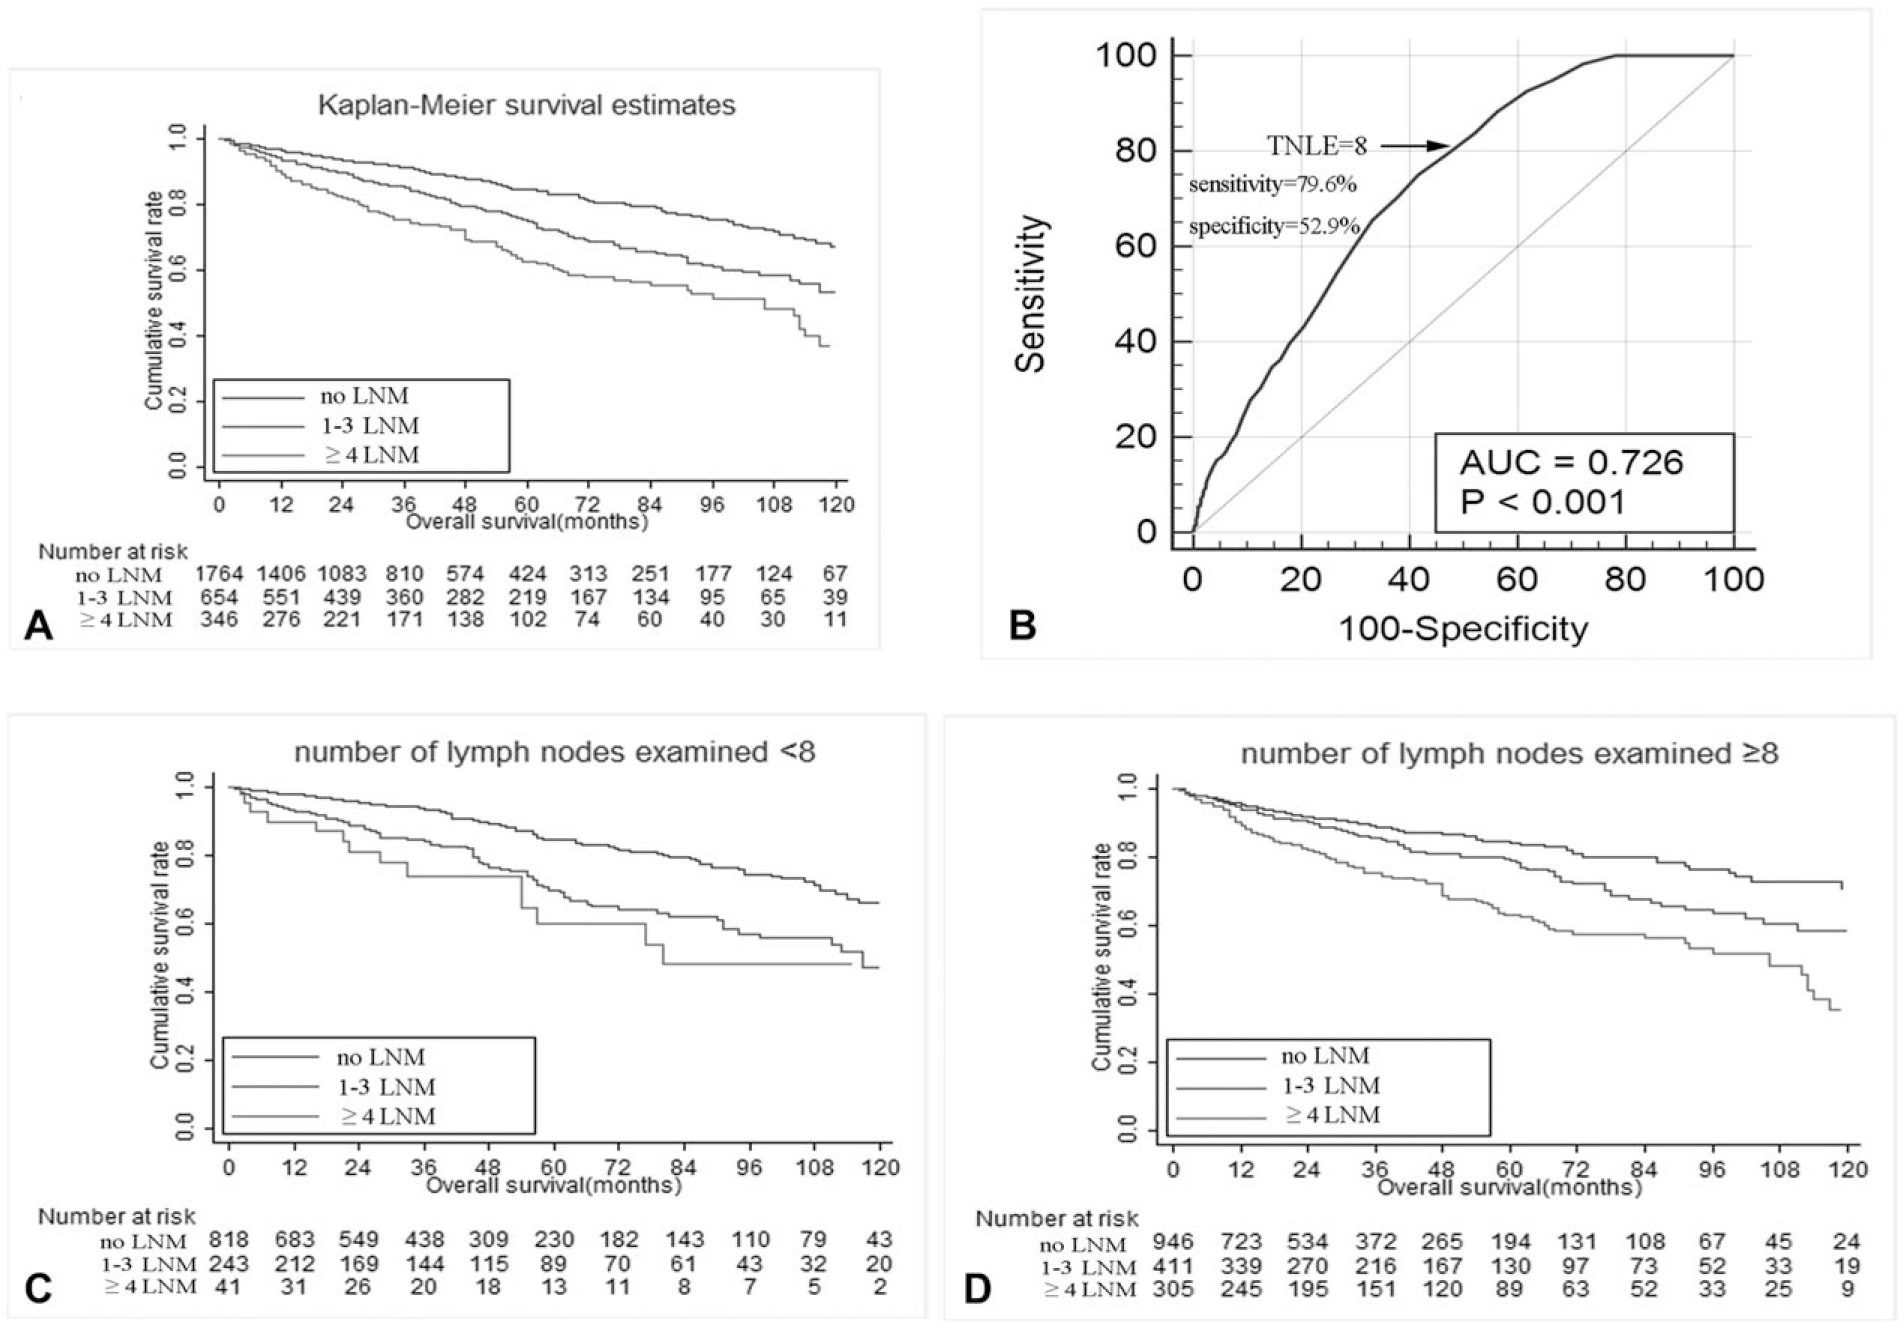
(A) Overall survival of patients in the SEER registry who had 0, 1 to 3, and ≥4 lymph node metastasis (LNM). (B) Receiver-operating characteristic (ROC) analysis illustrating that total number of lymph nodes examined (TNLE) ≥8 had the highest discriminatory power relative to overall survival (OS) among patients who had 1 to 3 LNM and patients who had ≥4 LNM (AUC 0.726, Youden index 0.33, sensitivity 79.6%, specificity 52.9%, P < 0.001). Overall survival of patients in SEER registry who had 0, 1 to 3, and ≥4 lymph node metastasis (LNM) stratified by TNLE <8 (C) or ≥8 (D).
DISCUSSION
The presence of LNM has been reported to be an important prognostic factor to predict recurrence among patients with pNETs undergoing curative-intent resection.4,19,20 The role of LN dissection and the optimal TNLE, and also the number of LNM that optimally categorizes patients with pNETs into prognostic groups, remains poorly defined. The current study was important because it used a large cohort of patients with pNETs from 8 high-volume centers in the United States to define the impact of number of LNM, and also TNLE, and then validated these findings externally using the national SEER database. Of note, LNM was common among patients with pNETs, because over 1 in 4 patients who underwent resection had a least 1 LNM. In turn, the presence of LNM was associated with decreased RFS, OS, and DSS. In particular, patients could be categorized into distinct prognostic groups with progressive worsening of outcomes among patients who had no nodal disease versus 1 to 3 LNM versus ≥4 LNM. Of note, at least 8 nodes needed to be evaluated to optimize the staging of patients with pNETs. As such, we proposed a new nodal pNETs staging that included N0 versus N1 (1–3 LNM) versus N2 (≥4 LNM), because these categories were able to stratify outcomes among patients both in the multi-intuitional cohort, and also the external validation SEER dataset, with good predictive discrimination.
Although patients with pNETs generally have a favorable prognosis after curative-intent resection, long-term outcomes can be poor among a subset of patients.21,22 Hashim et al4 had reported that 10-year RFS and OS was 70.8% and 74.6% among patients with no nodal metastasis compared with only 32.1% and 55.4% among patients with N1 disease, respectively. The adverse impact of nodal involvement on tumor recurrence had been reported in several other previous studies.19,23–25 Data from the current study similarly noted that LNM was associated with worse long-term outcomes, yet we went beyond the simple N0 versus N1 categorization adopted by the 8th edition AJCC/UICC and ENET TNM staging systems.13–17 Rather, we specifically sought to define the impact of number of LNM on long-term outcomes including recurrence and OS. Of note, among the 854 patients in the multi-institutional cohort, RFS, OS, and DSS each became progressively worse as the number of LNM increased. Specifically, while long-term outcomes were comparable among patients with 1, 2, or 3 LNM, patients could be placed into prognostic groups based on no nodal disease, 1 to 3 LNM (N1), and ≥4 LNM (N2), with each category having a distinct worse long-term outcome. The latest edition of the AJCC/UICC staging system already has adopted a graduated nodal staging for pancreatic adenocarcinoma, perihilar, and gallbladder cholangiocarcinoma that classified nodal disease as N0 (no nodal metastasis), N1 (1–3 LNM), and N2 (≥4 LNM).14 In contrast, nodal disease for pNET was still categorized as N0 versus N1 in the 8th edition AJCC/UICC staging manual. Data from the current study would strongly suggest, however, that a similar nodal scheme for pNETs that includes N0, N1, and N2 categories should be adopted in future editions of the AJCC/UICC staging manual.
The number of LNs evaluated likely influences the chance of identifying LNM, and, in turn, the prognostic classification of patients with pNETs. For example, a minimum number of 12 to 15 nodes has been recommended at the time of pancreaticoduodenectomy for pancreatic adenocarcinoma,13 4 or more nodes for perihilar cholangiocarcinoma,18 and more than 12 nodes for colon cancer26 to stage accurately these tumors and predict long-term outcomes. Zaidi et al27 recommended retrieval of at least 8 nodes among patients undergoing resection for small bowel neuroendocrine tumors to discriminate differences in RFS among patients with different nodal status. The minimum number of TNLE remains undetermined among patients undergoing curative resection for pNETs. In 1 study, a minimum of 13 TNLE was recommended for patients undergoing pancreaticoduodenectomy for nonfunctional neuroendocrine tumors; this cut-off value discriminated RFS for N0 patients, but not among patients with LNM.12 However, this study included only a relatively small number of patients and failed to evaluate the discriminatory ability of TNLE among patients with different N status.12 In the current study, using a large multicenter database, we demonstrated that a TNLE of 8 was the optimal cut-off value to identify patients with LNM. Specifically, patients with ≥8 TNLE had a LNM incidence of 33.7% versus 17.2% among patients who had <8 TNLE. In addition, a TNLE of 8 had good predictive discrimination (TNLE ≥8 AUC 0.713, Youden index 0.32) to discriminate differences in RFS, and also OS. A TNLE remained an optimal cut-off value among patients regardless of the number of LNM present (ie, 0 vs 1–3 vs ≥4) in both the multi-institutional and SEER database. Of note, a LNR >25% was also associated with RFS, consistent with previous data that suggested LNR to be a powerful predictor of DSS among patients undergoing resection of pNETs.5 As LNR takes into account the adequacy of lymphadenectomy, the data further highlight that TNLE is an important consideration in the adequate staging of patients with pNETs.18,28,29
Several limitations should be considered when interpreting the data. Although the multi-institutional collaboration increased the sample size and generalizability of the results, possible inconsistency in patient selection, surgical skill, pathologic assessment, and reporting, and also postoperative surveillance likely existed. In addition, lymphadenectomy for pNETwas not standardized. As such, the exact stations of the LNs evaluated were not available. Future studies would need to address the influence of nodal station on outcomes among patients undergoing resection and lymphadenectomy for pNETs. Although impact of the new nodal staging on OS was validated, the SEER database did not contain information on RFS and therefore the impact of the proposed nodal categorized on RFS could not be externally validated.
CONCLUSIONS
In conclusion, given the strong association between the number of LNM and long-term outcome of patients with pNETs, regional lymphadenectomy of at least 8 lymph nodes is necessary to stage patients accurately; the proposed nodal staging of N0, N1 (1–3 LNM), and N2 (≥4 LNM) optimally staged patients relative to RFS, DSS, and OS. These data should help inform future refinements of the AJCC/UICC staging manual, and also help with risk assessment to plan postoperative surveillance among patients after curative-intent resection of pNETs.
Supplementary Material
Acknowledgments
X.-F.Z. was supported by the Clinical Research Award of the First Affiliated Hospital of Xi’an Jiaotong University of China (No. XJTU1AF-CRF-2017-004).
Footnotes
The authors report no conflicts of interest
Supplemental digital content is available for this article. Direct URL citations appear in the printed text and are provided in the HTML and PDF versions of this article on the journal’s Web site (www.annalsofsurgery.com).
REFERENCES
- 1.Milan SA, Yeo CJ. Neuroendocrine tumors of the pancreas. Curr Opin Oncol. 2012;24:46–55. [DOI] [PubMed] [Google Scholar]
- 2.Yao JC, Eisner MP, Leary C, et al. Population-based study of islet cell carcinoma. Ann Surg Oncol. 2007;14:3492–3500. [DOI] [PMC free article] [PubMed] [Google Scholar]
- 3.Yao JC, Hassan M, Phan A, et al. One hundred years after “carcinoid”: epidemiology of and prognostic factors for neuroendocrine tumors in 35,825 cases in the United States. J Clin Oncol. 2008;26:3063–3072. [DOI] [PubMed] [Google Scholar]
- 4.Hashim YM, Trinkaus KM, Linehan DC, et al. Regional lymphadenectomy is indicated in the surgical treatment of pancreatic neuroendocrine tumors (PNETs). Ann Surg. 2014;259:197–203. [DOI] [PMC free article] [PubMed] [Google Scholar]
- 5.Gaitanidis A, Patel D, Nilubol N, et al. A lymph node ratio-based staging model is superior to the current staging system for pancreatic neuroendocrine tumors. J Clin Endocrinol Metab. 2018;103:187–195. [DOI] [PMC free article] [PubMed] [Google Scholar]
- 6.Bilimoria KY, Talamonti MS, Tomlinson JS, et al. Prognostic score predicting survival after resection of pancreatic neuroendocrine tumors: analysis of 3851 patients. Ann Surg. 2008;247:490–500. [DOI] [PubMed] [Google Scholar]
- 7.Zhang XF, Wu Z, Cloyd J, et al. Margin status and long-term prognosis of primary pancreatic neuroendocrine tumor after curative resection: results from the US Neuroendocrine Tumor Study Group. Surgery. 2019;165:548–556. [DOI] [PMC free article] [PubMed] [Google Scholar]
- 8.Zhang XF, Bagante F, Chen Q, et al. Perioperative and long-term outcome of intrahepatic cholangiocarcinoma involving the hepatic hilus after curative-intent resection: comparison with peripheral intrahepatic cholangiocarcinoma and hilar cholangiocarcinoma. Surgery. 2018;163:1114–1120. [DOI] [PubMed] [Google Scholar]
- 9.Tomassetti P, Campana D, Piscitelli L, et al. Endocrine pancreatic tumors: factors correlated with survival. Ann Oncol. 2005;16:1806–1810. [DOI] [PubMed] [Google Scholar]
- 10.Bettini R, Boninsegna L, Mantovani W, et al. Prognostic factors at diagnosis and value of WHO classification in a mono-institutional series of 180 nonfunctioning pancreatic endocrine tumours. Ann Oncol. 2008;19:903–908. [DOI] [PubMed] [Google Scholar]
- 11.Krampitz GW, Norton JA, Poultsides GA, et al. Lymph nodes and survival in pancreatic neuroendocrine tumors. Arch Surg. 2012;147:820–827. [DOI] [PMC free article] [PubMed] [Google Scholar]
- 12.Partelli S, Javed AA, Andreasi V, et al. The number of positive nodes accurately predicts recurrence after pancreaticoduodenectomy for nonfunctioning neuroendocrine neoplasms. Eur J Surg Oncol. 2018;44:778–783. [DOI] [PubMed] [Google Scholar]
- 13.Amin MB. American Joint Committee on Cancer. New York: Springer; 2017. [Google Scholar]
- 14.Brierley JD, Gospodarowicz MK, Wittekind C. TNM Classification of Malignant Tumours. 8th ed, Wiley-Blackwell; 2017. [Google Scholar]
- 15.Rindi G, Falconi M, Klersy C, et al. TNM staging of neoplasms of the endocrine pancreas: results from a large international cohort study. J Natl Cancer Inst. 2012;104:764–777. [DOI] [PubMed] [Google Scholar]
- 16.Rindi G, Kloppel G, Couvelard A, et al. TNM staging of midgut and hindgut (neuro) endocrine tumors: a consensus proposal including a grading system. Virchows Arch. 2007;451:757–762. [DOI] [PubMed] [Google Scholar]
- 17.Rindi G, Kloppel G, Alhman H, et al. TNM staging of foregut (neuro)endocrine tumors: a consensus proposal including a grading system. Virchows Arch. 2006;449:395–401. [DOI] [PMC free article] [PubMed] [Google Scholar]
- 18.Bagante F, Tran T, Spolverato G, et al. Perihilar cholangiocarcinoma: number of nodes examined and optimal lymph node prognostic scheme. J Am Coll Surg. 2016;222:750–759. e2. [DOI] [PMC free article] [PubMed] [Google Scholar]
- 19.Partelli S, Gaujoux S, Boninsegna L, et al. Pattern and clinical predictors of lymph node involvement in nonfunctioning pancreatic neuroendocrine tumors (NF-PanNETs). JAMA Surg. 2013;148:932–939. [DOI] [PubMed] [Google Scholar]
- 20.Tsutsumi K, Ohtsuka T, Fujino M, et al. Analysis of risk factors for recurrence after curative resection of well-differentiated pancreatic neuroendocrine tumors based on the new grading classification. J Hepatobiliary Pancreat Sci. 2014;21:418–425. [DOI] [PubMed] [Google Scholar]
- 21.Genc CG, Falconi M, Partelli S, et al. Recurrence of pancreatic neuroendocrine tumors and survival predicted by Ki67. Ann Surg Oncol. 2018;25:2467–2474. [DOI] [PMC free article] [PubMed] [Google Scholar]
- 22.Marchegiani G, Landoni L, Andrianello S, et al. Patterns of recurrence after resection for pancreatic neuroendocrine tumors: who, when, and where? Neuroendocrinology. 2018;108:161–171. [DOI] [PubMed] [Google Scholar]
- 23.Postlewait LM, Ethun CG, Baptiste GG, et al. Pancreatic neuroendocrine tumors: preoperative factors that predict lymph node metastases to guide operative strategy. J Surg Oncol. 2016;114:440–445. [DOI] [PubMed] [Google Scholar]
- 24.Nakakura EK. Challenges staging neuroendocrine tumors of the pancreas, jejunum and ileum, and appendix. Ann Surg Oncol. 2018;25:591–593. [DOI] [PubMed] [Google Scholar]
- 25.Lopez-Aguiar AG, Zaidi MY, Beal EW, et al. Defining the role of lymphadenectomy for pancreatic neuroendocrine tumors: an eight-institution study of 695 patients from the US Neuroendocrine Tumor Study Group. Ann Surg Oncol. 2019;26:2517–2524. [DOI] [PMC free article] [PubMed] [Google Scholar]
- 26.Dillman RO, Aaron K, Heinemann FS, et al. Identification of 12 or more lymph nodes in resected colon cancer specimens as an indicator of quality performance. Cancer. 2009;115:1840–1848. [DOI] [PubMed] [Google Scholar]
- 27.Zaidi MY, Lopez-Aguiar AG, Dillhoff M, et al. Prognostic role of lymph node positivity and number of lymph nodes needed for accurately staging small bowel neuroendocrine tumors. JAMA Surg. 2018. doi: 10.1001/jamasurg.2018.3865 [Epub ahead of print]. [DOI] [PMC free article] [PubMed] [Google Scholar]
- 28.Pawlik TM, Gleisner AL, Cameron JL, et al. Prognostic relevance of lymph node ratio following pancreaticoduodenectomy for pancreatic cancer. Surgery. 2007;141:610–618. [DOI] [PubMed] [Google Scholar]
- 29.Rosenberg R, Engel J, Bruns C, et al. The prognostic value of lymph node ratioin a population-based collective of colorectal cancer patients. Ann Surg. 2010;251:1070–1078. [DOI] [PubMed] [Google Scholar]
Associated Data
This section collects any data citations, data availability statements, or supplementary materials included in this article.