



Abstract
Background
Coronary microvascular dysfunction (CMD) is a strong determinant of prognosis in patients with chronic coronary syndrome (CCS). The triglyceride-glucose index (TyG index), an alternative method to evaluate insulin resistance, is positively correlated with the incidence and adverse outcomes of cardiovascular diseases. However, the relationship between the TyG index and the presence and prognosis of CMD in CCS patients has not been investigated. Therefore, we aimed to evaluate the association between the TyG index and the presence and clinical outcomes of CMD among CCS patients.
Methods
CCS patients who underwent coronary angiography between June 2015 to June 2019 were included. The TyG index was calculated as Ln[fasting triglycerides (mg/dL) × fasting blood glucose (mg/dL)/2]. Coronary angiography‑derived index of microvascular resistance (caIMR) was used to measure microvascular function, and CMD was defined as caIMR ≥ 25U. Patients with CMD were divided into three groups (T1, T2, and T3 groups) according to TyG tertiles. The primary endpoint was major adverse cardiac event (MACE).
Results
Of 430 CCS patients, 221 patients had CMD. CMD patients had significantly higher TyG index than those without CMD. Sixty-three MACE was recorded during the follow-up duration among CMD patients, and the incidence rate of MACE was higher in the T3 group compared to T1/T2 groups (39.2% vs. 20.5% vs. 25.7%; P = 0.035). Multivariable logistic regression analysis showed that the TyG index was an independent predictor of CMD (OR, 1.436; 95% CI, 1.014–2.034; P = 0.042). Compared to the T1 group, the T3 group strongly correlated with the risk of MACE in CMD patients even after adjusting for additional confounding risk factors (HR, 2.132; 95%CI, 1.066–4.261; P = 0.032).
Conclusion
TyG index is significantly associated with the risk of CMD, and it is an independent predictor of MACE among CMD patients with CCS. This study suggests that the TyG index has important clinical significance for the early prevention and risk stratification of CMD.
Supplementary Information
The online version contains supplementary material available at 10.1186/s12933-023-01846-z.
Keywords: Chronic coronary syndrome, Coronary microvascular dysfunction, Coronary angiography‑derived index of microvascular resistance, Triglyceride-glucose index, Clinical outcomes
Background
Chronic coronary syndrome (CCS) is a clinical manifestation of coronary artery disease (CAD) other than acute coronary thrombosis [1]. Coronary microvascular dysfunction (CMD) is a clinical situation where the structure or function of coronary micro-vessels is affected, which is widely present in CCS patients, and may interact with obstructive atherosclerosis to accelerate the progression of the cardiovascular disease (CVD) [2–4]. Numerous clinical investigations have demonstrated that CMD is linked to poor prognosis in a spectrum of CVD such as acute coronary syndrome (ACS), heart failure with preserved ejection fraction (HFpEF), myocardial infarction with nonobstructive coronary arteries (MINOCA) and CCS [5–9], posing a severe threat to people's health. Therefore, early prevention and risk stratification of CMD is crucial in order to avoid further progression and enhance the quality of life.
Insulin resistance (IR) refers to the decrease in insulin sensitivity that requires an increase in the amount of insulin to achieve its normal function. It has been proven to be one of the major risk factors, which is closely related to the occurrence and development of CMD [10, 11]. However, challenges in implementing existing detection methods for IR in clinical practice and a lack of studies investigating its prognostic value in CMD patients underscore the need for further research. The triglyceride-glucose index (TyG index) based on fasting blood glucose (FBG) and fasting triglycerides (TG) has been proposed as an alternative method to evaluate IR [12, 13]. Several studies have found a positive correlation between the TyG index and the presence and poor clinical outcomes among CVD in diabetic or nondiabetic patients, including carotid atherosclerosis, CCS, arterial stiffness, MINOCA, premature coronary artery disease, ACS and coronary chronic total occlusion [14–17]. Moreover, recent research has shown that the TyG index was independently correlated with the likelihood of coronary slow flow, suggesting that the TyG index may be related to the presence of CMD [18]. However, the association between the TyG index and the presence and prognosis of CMD in patients with CCS has not been studied before.
Hence, this study aimed to explore the association between the TyG index and the risk of CMD in CCS patients and to evaluate the prognostic value of the TyG index among CMD patients with CCS.
Methods
Study population
This was a single-center retrospective observational study that recruited all consecutive patients admitted for CCS who underwent coronary angiography (CAG) at Shanghai Tenth People's Hospital from June 2015 to June 2019.
In the present study, we included patients aged > 18 years with suspected or established CCS, diagnosed according to the 2019 ESC guidelines for the diagnosis and management of CCS [1]. The major exclusion criteria included myocardial infarction (MI) within 7 days, post coronary artery bypass graft surgery (CABG), severe hepatic or renal insufficiency, malignancy, left ventricular ejection fraction (LVEF) < 35%, or other severe medical illnesses. The angiography images with low contrast opacification, obvious vascular overlap/distortion of the interrogated artery, or poor quality were excluded according to the previous study [19].
Clinical data of all patients were collected from medical files by trained physicians who were blinded to the research protocol. Venous blood samples were obtained after an overnight fast on admission to analyze FBG, hemoglobin A1c (HbA1c), total cholesterol (TC), TG, low-density lipoprotein-C (LDL-C), serum creatinine, C-reactive protein (CRP) levels. The data of echocardiography and CAG were obtained from examination report sheets.
Our study protocol was conducted in accordance with the Helsinki Declaration and was approved by the ethical review board of Shanghai Tenth People’s Hospital. Written informed consent was obtained from each patient who was enrolled in the study.
Evaluation of coronary microvascular function
The coronary microvascular function was assessed on all participants with the coronary angiography-derived index of microcirculatory resistance (caIMR) measurement. The caIMR analysis was performed by trained readers who were unaware of outcome data in the Cath lab of the Shanghai Tenth People's Hospital using the FlashAngio system package (FlashAngio, Rainmed Ltd., Suzhou, China). Previous studies have described the detailed theories of caIMR measurement, which was calculated using the following formula [19]:
where (Pd)hyp is the mean pressure (unit: mmHg) at the distal position of the coronary artery at the maximal hyperemia, L is a constant (L = 75), which mimics the length from the inlet of the coronary arterial tree to the distal position, and Vdiastole is the mean blood flow velocity (unit: mm/s) at the distal position of the coronary artery at diastole, and Vhyp = K·Vdiastole (K = 2.1) is the mean blood flow velocity (unit: mm/s) at the distal position of the coronary artery at the maximal hyperemia.
Microvascular functions were measured in 642 coronary arteries among 430 CCS patients. caIMR was measured primarily in stenotic epicardial arteries, and for those patients without significant coronary stenosis, we evaluated caIMR in all measurable epicardial arteries. Percutaneous coronary intervention (PCI) was performed when there was significant evidence of myocardial ischemia and the degree of coronary stenosis was greater than 70%. Patients who underwent PCI had their caIMR measured after PCI. The vessel with the highest value of caIMR among the coronary arteries of the patient was chosen.
Definitions and grouping
DM patients were diagnosed if they met one of the following: (1) HbA1c ≥ 6.5%; (2) Random plasma glucose ≥ 11.1 mmol/L; (3) Fasting plasma glucose ≥ 7.0 mmol/L; and (4) 2‑hour glucose in venous plasma ≥ 11.1 mmol/L according to OGTT[20]. Hypertension was defined as systolic blood pressure (SBP) ≥ 140 mmHg or diastolic blood pressure (DBP) ≥ 90 mmHg at rest or receiving antihypertensive treatments. Body mass index (BMI) was calculated according to the following formula: BMI (kg/m2) = weight (kg) /height2 (m2).
Based on the cut-off value previously established, CMD was defined as caIMR ≥ 25U [19]. The TyG index was computed as Ln[fasting TG (mg/dL) × FBG (mg/dL)/2] [12]. Patients with CMD were divided into three groups (T1, T2, and T3 groups) according to the TyG tertiles.
Follow-up and endpoint of the study
The median follow-up period in our study was 35 months. Follow-up data was performed by trained physicians at Shanghai Tenth People's Hospital via telephone calls, hospital records, and outpatient visits. The primary endpoint of this study was major adverse cardiac events (MACE), which was a composite of cardiovascular death, nonfatal MI, heart failure, nonfatal stroke, and ischemia-driven revascularization. Cardiovascular death was defined as death due to malignant arrhythmia, acute MI, heart failure, or other cardiac diseases. Nonfatal MI was defined as positive cardiac biomarkers with the typical symptoms of myocardial ischemia or dynamic changes in electrocardiograms [21]. Diagnosis of heart failure was based on previous guidelines [22]. Nonfatal stroke referred to acute cerebral infarction diagnosed by typical clinical symptoms or imaging examination [23]. Ischemia-driven revascularization was the revascularization as a result of recurrent angina or a positive test for cardiac ischemia.
Statistical analysis
The data of our study were analyzed using the Statistical Package for Social Sciences (SPSS) v.22., and the figures were drawn by GraphPad softwarev.8.0.1. Continuous variables were presented as the mean ± standard deviation in the case of normal distribution, and medians (interquartile range) in the case of non-normal distribution. The intergroup comparisons of continuous variables were analyzed using a t-test or ANOVA if they had a normal distribution and using Mann–Whitney U-test or Kruskal–Wallis test if they presented a non-normal distribution. Categorical variables were displayed as counts and percentages and were compared using Pearson’s chi-squared (χ2) test or Fisher’s exact test as the case may be. Univariate and multivariate logistic regression analyses were used to analyze the correlation between clinical risk factors and CMD patients. Pearson or Spearman correlation analysis was applied to determine the correlation between the TyG index and caIMR. Kaplan–Meier survival curves were used to evaluate the MACE-free survival rates, and discrepancies in survival rates were compared using the log-rank test. The association between the TyG index and outcomes in CMD patients was determined using univariate and multivariate Cox proportional regression models. In the logistic regression and Cox regression, univariate predictors with P < 0.10 were included for multivariable models. The collinearity diagnosis was used to assess collinearity between the variables included in the multivariable models. When variance inflation factor (VIF) was less than 10, we considered that no evidence of model collinearity was found. We excluded those variables that are highly correlated when performing multivariate regression analysis. We conducted subgroup analysis to test whether the correlation between TyG index and the presence and prognosis of CMD differed across subgroups and p for interaction was calculated. All analysis was conducted two-sided, and statistical significance was set at P-value < 0.05.
Results
Baseline characteristics
A total of 596 patients who underwent CAG and met the diagnostic criteria of CCS were included, in which 64 patients were excluded according to the exclusion criteria, 93 patients were excluded due to the caIMR exclusion criteria, and 9 patients were lost to follow-up. Four hundred and thirty patients were finally included in the present study (Fig. 1).
Fig. 1.

Flow diagram of study participants. CAG coronary angiography, CCS chronic coronary syndrome, caIMR coronary angiography-derived index of microcirculatory resistance, CMD coronary microvascular dysfunction, TyG index triglyceride-glucose index.
Population characteristics of CCS patients were shown in Table 1. Of 430 CCS patients, 221 patients had CMD. CMD patients had a significantly higher TyG index than those without CMD [8.81(8.43,9.22) vs. 8.60(8.31,9.02); P = 0.002] (Table 1; Fig. 2). Moreover, caIMR, caFFR, and BMI were also significantly higher in CMD patients than in non-CMD patients. Laboratory findings also showed that the FBG, TG, and TC were higher in the CMD patients. However, the history of CAD, 3-vessel disease, PCI and clopidogrel use was lower in the CMD group than in the non-CMD group.
Table 1.
Clinical characteristics of the study population stratified by CMD
| Total patients (N = 430) |
CMD (N = 221) |
Non-CMD (N = 209) |
P value | |
|---|---|---|---|---|
| General characteristics | ||||
| Age (years) | 63.54 ± 9.61 | 63.12 ± 9.13 | 63.99 ± 10.09 | 0.352 |
| Male, n (%) | 254 (59.1) | 130 (58.8) | 124 (59.3) | 0.915 |
| BMI (kg/m2) | 24.99 ± 3.16 | 25.56 ± 3.25 | 24.39 ± 2.96 | < 0.001 |
| Heart rate (beats per minute) | 76.46 ± 11.41 | 76.65 ± 11.28 | 76.25 ± 11.57 | 0.715 |
| Comorbidities | ||||
| Atrial fibrillation, n (%) | 22 (5.1) | 9 (4.1) | 13 (6.2) | 0.312 |
| Smoking, n (%) | 86 (20.0) | 44 (19.9) | 42 (20.1) | 0.962 |
| Hypertension, n (%) | 271(63.0) | 135 (61.1) | 136 (65.1) | 0.392 |
| PCI performed, n (%) | 221(51.4) | 101 (45.7) | 120 (57.4) | 0.015 |
| Diabetes, n (%) | 150 (34.9) | 84 (38.0) | 66 (31.6) | 0.162 |
| CKD, n (%) | 31 (7.2) | 20 (9.0) | 11 (5.3) | 0.129 |
| CAD, n (%) | 268 (62.3) | 121 (54.8) | 147 (70.3) | 0.001 |
| 1- vessel disease | 114 (26.5) | 54 (24.4) | 60 (28.7) | 0.316 |
| 2- vessel disease | 94 (21.9) | 44 (19.9) | 50 (23.9) | 0.314 |
| 3- vessel disease | 60 (14.0) | 23 (10.4) | 37 (17.7) | 0.029 |
| Laboratory values | ||||
| TyG index | 8.70 (8.37,9.11) | 8.81 (8.43,9.22) | 8.60 (8.31,9.02) | 0.002 |
| TG (mmol/L) | 1.41 (1.05,2.11) | 1.51 (1.08,2.20) | 1.30 (1.00,1.95) | 0.012 |
| FBG (mmol/L) | 5.20 (4.80,6.10) | 5.40 (4.80,6.45) | 5.20 (4.70,5.80) | 0.034 |
| HbA1c (%) | 6.36 ± 1.19 | 6.40 ± 1.08 | 6.31 ± 1.30 | 0.435 |
| CRP (mg/L) | 3.85 ± 6.77 | 3.95 ± 7.74 | 3.74 ± 5.52 | 0.749 |
| Serum creatinine (umol/L) | 72.40 (61.80,83.70) | 72.00 (61.65,84.25) | 72.70 (62.05,82.90) | 0.927 |
| TC (mmol/L) | 3.58 (3.02,4.45) | 3.72 (3.08,4.58) | 3.50 (2.97,4.27) | 0.032 |
| LDL-C (mmol/L) | 2.01 (1.50,2.68) | 2.12 (1.51,2.81) | 1.91 (1.50,2.39) | 0.095 |
| LVEF (%) | 61.85 ± 6.21 | 61.91 ± 5.95 | 61.79 ± 6.48 | 0.841 |
| Coronary physiological parameters | ||||
| caFFR | 0.94 (0.91,0.96) | 0.95 (0.93,0.97) | 0.92 (0.90,0.95) | < 0.001 |
| caIMR | 25.25 (20.90,35.30) | 35.10 (29.50,42.25) | 20.80 (16.95,23.15) | < 0.001 |
| Cardiovascular medical therapy | ||||
| Aspirin, n (%) | 302 (70.2) | 155 (70.1) | 147 (70.3) | 0.964 |
| Clopidogrel, n (%) | 241 (56.0) | 109 (49.3) | 132 (63.2) | 0.004 |
| Statin, n (%) | 382 (88.8) | 192 (86.9) | 190 (90.9) | 0.185 |
| ACEI/ARB, n (%) | 198 (46.0) | 100 (45.2) | 98 (46.9) | 0.733 |
| Beta blocker, n (%) | 205 (47.7) | 103 (46.6) | 102 (48.8) | 0.648 |
| CCB, n (%) | 166 (38.6) | 88 (39.8) | 78 (37.3) | 0.595 |
CMD coronary microvascular dysfunction, BMI body mass index, PCI percutaneous coronary intervention, CKD chronic kidney disease, CAD coronary artery disease, TyG index triglyceride-glucose index, TG triglyceride, FBG fasting blood glucose, HbA1c hemoglobin A1c, CRP C-reactive protein, TC total cholesterol, LDL-C low-density lipoprotein-cholesterol, LVEF left ventricular ejection fraction, caFFR coronary angiography-derived fractional flow reserve, caIMR coronary angiography-derived index of microcirculatory resistance, ACEI/ARB angiotensin-converting-enzyme inhibitor/angiotensin receptor blocker, CCB calcium channel blocker
Fig. 2.
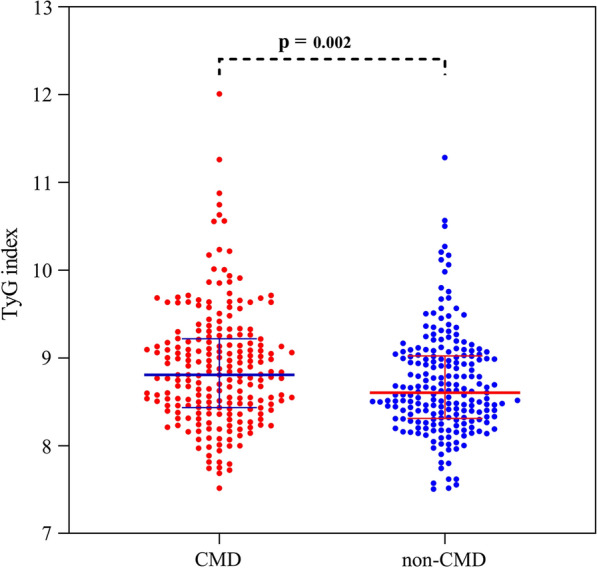
The distribution of TyG index at CMD and non-CMD patients. TyG index triglyceride-glucose index, CMD coronary microvascular dysfunction.
CMD patients were divided into 3 groups (T1, T2, and T3 group) based on the levels of the TyG index (Table 2). The CMD patients with higher TyG index (T3 group) tended to have atrial fibrillation and diabetes, and higher BMI, FBG, TG, TC, LDL-C, and HbA1c.
Table 2.
Clinical characteristics of the study population stratified by TyG index
| TyG index level | P value | |||
|---|---|---|---|---|
| T1(N = 73) | T2(N = 74) | T3(N = 74) | ||
| General characteristics | ||||
| Age (years) | 64.79 ± 9.77 | 61.88 ± 9.44 | 62.72 ± 7.97 | 0.138 |
| Male, n (%) | 43 (58.9) | 40 (54.1) | 47 (63.5) | 0.505 |
| BMI (kg/m2) | 24.32 ± 2.96 | 25.83 ± 3.29 | 26.52 ± 3.14 | < 0.001 |
| Heart rate (beats per minute) | 76.26 ± 11.30 | 76.42 ± 11.69 | 77.27 ± 10.97 | 0.844 |
| Comorbidities | ||||
| Atrial fibrillation, n (%) | 0 | 2 (2.7) | 7 (9.5) | 0.005 |
| Smoking, n (%) | 14 (19.2) | 13 (17.6) | 17 (23.0) | 0.700 |
| Hypertension, n (%) | 42 (57.5) | 41 (55.4) | 52 (70.3) | 0.134 |
| PCI performed, n (%) | 36 (49.3) | 27 (36.5) | 38 (51.4) | 0.145 |
| Diabetes, n (%) | 17 (23.3) | 30 (40.5) | 37(50.0) | 0.003 |
| CKD, n (%) | 6 (8.2) | 7 (9.5) | 7 (9.5) | 0.955 |
| CAD, n (%) | 44 (60.3) | 34 (45.9) | 43 (58.1) | 0.169 |
| 1-vessel disease | 17 (23.3) | 15 (20.3) | 22 (29.7) | 0.392 |
| 2-vessel disease | 18 (24.7) | 11 (14.9) | 15 (20.3) | 0.330 |
| 3-vessel disease | 9 (12.3) | 8 (10.8) | 6 (8.1) | 0.697 |
| Laboratory values | ||||
| TyG index | 8.27 (8.08,8.43) | 8.81 (8.67,8.97) | 9.49 (9.21,9.72) | < 0.001 |
| TG (mmol/L) | 0.98 (0.82,1.14) | 1.52 (1.24,1.86) | 2.58 (2.12,3.34) | < 0.001 |
| FBG (mmol/L) | 5.00 (4.60,5.50) | 5.30 (4.80,6.60) | 6.05 (5.18,7.93) | < 0.001 |
| HbA1c (%) | 6.03 ± 0.68 | 6.28 ± 0.86 | 6.90 ± 1.39 | < 0.001 |
| CRP (mg/L) | 3.46 ± 5.42 | 5.40 ± 12.00 | 3.00 ± 2.27 | 0.223 |
| Serum creatinine (umol/L) | 72.80 (61.30,82.75) | 71.80 (59.00,81.10) | 74.15 (63.23,86.73) | 0.368 |
| TC (mmol/L) | 3.59 ± 0.91 | 3.83 ± 0.97 | 4.23 ± 1.67 | 0.001 |
| LDL-C (mmol/L) | 1.92 ± 0.83 | 2.26 ± 0.85 | 2.41 ± 0.99 | 0.003 |
| LVEF (%) | 62.73 ± 5.61 | 61.58 ± 6.51 | 61.43 ± 5.71 | 0.371 |
| Coronary physiological parameters | ||||
| caFFR | 0.95 (0.93,0.97) | 0.96 (0.94,0.97) | 0.95 (0.94,0.97) | 0.227 |
| caIMR | 33.80 (29.40,38.75) | 38.40 (30.13,46.63) | 35.20 (29.08,43.53) | 0.119 |
| Cardiovascular medical therapy | ||||
| Aspirin, n (%) | 49 (67.1) | 53 (71.6) | 53 (71.6) | 0.790 |
| Clopidogrel, n (%) | 36 (49.3) | 34 (45.9) | 39 (52.7) | 0.713 |
| Statin, n (%) | 67 (91.8) | 61 (82.4) | 64 (86.5) | 0.243 |
| ACEI/ARB, n (%) | 38 (52.1) | 32 (43.2) | 30 (40.5) | 0.342 |
| Beta blocker, n (%) | 34 (46.6) | 35 (47.3) | 34 (45.9) | 0.986 |
| CCB, n (%) | 29 (39.7) | 28 (37.8) | 31 (41.9) | 0.881 |
TyG index triglyceride-glucose index, BMI body mass index, PCI percutaneous coronary intervention, CKD chronic kidney disease, CAD coronary artery disease, TG triglyceride, FBG fasting blood glucose, HbA1c hemoglobin A1c, CRP C-reactive protein, TC total cholesterol, LDL-C low-density lipoprotein-cholesterol, LVEF left ventricular ejection fraction, caFFR coronary angiography-derived fractional flow reserve, caIMR coronary angiography-derived index of microcirculatory resistance, ACEI/ARB angiotensin-converting-enzyme inhibitor/angiotensin receptor blocker, CCB calcium channel blocker
Association between the TyG index and CMD in CCS patients
The association between the TyG index and CMD were shown in Table 3. Univariable logistic regression analysis indicated that TyG index, BMI, FBG, TG, TC, and the history of CAD, 3-vessel disease, PCI, and clopidogrel use were statistically correlated with CMD and that the risk of CMD increased by 62.9% for per unit increase in TyG index (OR, 1.629; 95% CI, 1.187–2.237; P = 0.003). After adjusting for confounding factors (the VIF of these variables were shown in Additional file 1: Table S1), the association between CMD and TyG index, BMI still maintained a significant difference and the risk of CMD increased by 43.6% per unit increase in TyG index (OR, 1.436; 95% CI, 1.014–2.034; P = 0.042). We further evaluated the association between TyG index and CMD in subgroup analysis. The results suggested that there was no interaction between TyG index and subgroups (gender, diabetes, CAD) for presence of CMD (All p for interaction > 0.05). However, the association between TyG index and CMD was stronger among females and non-diabetic population. (Additional file 1: Table S2). Figure 3 showed the correlation between the TyG index and caIMR. The results demonstrated that the TyG index correlated well with caIMR among CCS patients (r = 0.156, p = 0.001). The correlation between TyG index and caIMR existed in both CAD and non-CAD patients, and was also observed in females and non-diabetic patients, but not in males and diabetic patients (Additional file 1: Figure S1).
Table 3.
Association between CMD and clinical risk factors
| Univariate analysis OR (95% CI) |
P value | Multivariate analysis OR (95% CI) |
P value | |
|---|---|---|---|---|
| Age | 0.991 (0.971–1.010) | 0.352 | ||
| Male | 0.979 (0.666–1.439) | 0.915 | ||
| BMI | 1.130 (1.060–1.204) | < 0.001 | 1.126 (1.051–1.206) | 0.001 |
| Heart rate | 1.003 (0.987–1.020) | 0.714 | ||
| Atrial fibrillation | 0.640 (0.268–1.531) | 0.316 | ||
| Smoking | 0.988 (0.616–1.586) | 0.962 | ||
| Hypertension | 0.843 (0.569–1.248) | 0.392 | ||
| PCI performed | 0.624 (0.426–0.914) | 0.015 | 1.209 (0.625–2.338) | 0.573 |
| Diabetes | 1.328 (0.892–1.979) | 0.162 | ||
| CKD | 1.791 (0.836–3.835) | 0.134 | ||
| CAD | 0.510 (0.343–0.760) | 0.001 | 0.557 (0.273–1.137) | 0.108 |
| 1-vessel disease | 0.803 (0.523–1.233) | 0.316 | ||
| 2-vessel disease | 0.791 (0.500–1.250) | 0.315 | ||
| 3-vessel disease | 0.540 (0.309–0.944) | 0.031 | 0.764 (0.416–1.403) | 0.385 |
| TyG index | 1.629 (1.187–2.237) | 0.003 | 1.436 (1.014–2.034) | 0.042 |
| TG | 1.204 (1.015–1.428) | 0.033 | – | |
| FBG | 1.140(1.012–1.284) | 0.031 | – | |
| HbA1c | 1.069 (0.905–1.263) | 0.435 | ||
| CRP | 1.005 (0.976–1.034) | 0.749 | ||
| Serum creatinine | 0.999 (0.990–1.009) | 0.908 | ||
| TC | 1.225 (1.012–1.483) | 0.037 | 1.013 (0.687–1.493) | 0.947 |
| LDL-C | 1.240 (0.997–1.542) | 0.053 | 1.109 (0.714–1.723) | 0.645 |
| LVEF | 1.003 (0.972–1.035) | 0.840 | ||
| Aspirin | 0.991 (0.655–1.498) | 0.964 | ||
| Clopidogrel | 0.568 (0.386–0.835) | 0.004 | 0.702 (0.451–1.093) | 0.117 |
| Statin | 0.662 (0.359–1.221) | 0.187 | ||
| ACEI/ARB | 0.936 (0.641–1.368) | 0.733 | ||
| Beta blocker | 0.916 (0.627–1.337) | 0.648 | ||
| CCB | 1.111 (0.753–1.639) | 0.595 |
CMD coronary microvascular dysfunction, BMI body mass index, PCI percutaneous coronary intervention, CKD chronic kidney disease, CAD coronary artery disease, TyG index triglyceride-glucose index, TG triglyceride, FBG fasting blood glucose, HbA1c hemoglobin A1c, CRP C-reactive protein, TC total cholesterol, LDL-C low-density lipoprotein-cholesterol, LVEF left ventricular ejection fraction, ACEI/ARB angiotensin-converting-enzyme inhibitor/angiotensin receptor blocker, CCB calcium channel blocker, OR odds ratio, CI confidence interval
Fig. 3.

Correlation between TyG index and caIMR. TyG index triglyceride-glucose index, caIMR coronary angiography-derived index of microcirculatory resistance.
Clinical outcome of CMD patients based on the TyG index
The median follow-up duration was 35 months. Sixty-three (28.5%) MACE were recorded during the follow-up duration among the CMD population, including 4 (1.8%) cardiovascular death, 4 (1.8%) nonfatal MI, 18 (8.1%) heart failure, 15 (6.9%) nonfatal stroke, and 22 (10.0%) ischemia-driven revascularizations. Patients with higher TyG index (T3 group) had a higher rate of MACE as compared to lower TyG index patients (T1 and T2 groups) (39.2% vs. 20.5% vs. 25.7%; p = 0.035) (Table 4). Kaplan–Meier curve analysis showed that the risk of MACE in the T3 group was significantly higher than that in the T1 and T2 groups (log-rank P = 0.036) (Fig. 4).
Table 4.
Clinical outcomes of CMD patients according to TyG index level
| TyG index level | P-value | |||
|---|---|---|---|---|
| T1 (n = 73) | T2 (n = 74) | T3 (n = 74) | ||
| MACE | 15 (20.5) | 19 (25.7) | 29 (39.2) | 0.035 |
| Cardiovascular death | 1 (1.4) | 1 (1.4) | 2 (2.7) | 0.790 |
| Nonfatal MI | 1 (1.4) | 0 | 3 (4.1) | 0.114 |
| Heart failure | 3 (4.1) | 8 (10.8) | 7 (9.5) | 0.292 |
| Nonfatal stroke | 5 (6.8) | 2 (2.7) | 8 (10.8) | 0.146 |
| Ischemia-driven revascularization | 5 (6.8) | 8 (10.8) | 9 (12.2) | 0.536 |
CMD coronary microvascular dysfunction, TyG index triglyceride-glucose index, MACE major adverse cardiovascular event, MI myocardial infarction
Fig. 4.
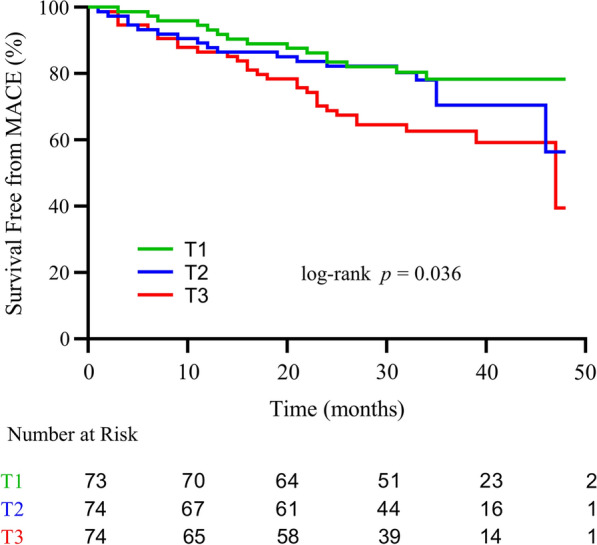
Kaplan–Meier survival curve for MACE in CMD patients with CCS according to TyG index tertiles. MACE major adverse cardiovascular events, CMD coronary microvascular dysfunction, CCS chronic coronary syndrome, TyG index triglyceride-glucose index, T1 TyG index tertile 1, T2 TyG index tertile 2, T3 TyG index tertile 3.
Predictive factors of MACE
The results of the univariate and multivariate Cox regression analysis are displayed in Table 5. Univariable Cox regression analysis indicated that compared with the T1 group, the T3 group had a 2.157-fold risk of MACE (HR, 2.157; 95% CI 1.156–4.025; P = 0.016). After adjusting for potential covariates, including age, atrial fibrillation, diabetes, CKD, serum creatinine, LVEF, clopidogrel use, and ACEI/ARB use (the VIF of these variables were shown in Additional file 1: Table S3), the risk of MACE in the T3 group was still significantly higher when using the T1 group as the reference (HR, 2.132; 95% CI 1.066–4.261; P = 0.032). We then performed the subgroup analysis. Although the interactions of TyG index with CMD subgroups (gender, diabetes and CAD) were not significant, the association was stronger in CAD patients and patients without diabetes. In addition, a subgroup analysis according to LVEF was performed, after excluding the patients with LVEF < 50%, TyG index remained independent predictor of poor prognosis in multivariate models (Additional file 1: Table S4).
Table 5.
Cox regression analysis for MACE of CMD patients
| Univariate analysis HR (95% CI) |
P value | Multivariate analysis HR (95% CI) |
P value | |
|---|---|---|---|---|
| Age | 1.024 (0.996–1.052) | 0.090 | 1.027 (0.996–1.059) | 0.085 |
| Male | 1.221 (0.737–2.025) | 0.438 | ||
| BMI | 0.999 (0.925–1.079) | 0.981 | ||
| Heart rate | 1.003 (0.982–1.025) | 0.768 | ||
| Atrial fibrillation | 2.443 (0.975–6.116) | 0.057 | 1.256 (0.469–3.362) | 0.650 |
| Smoking | 1.128 (0.621–2.049) | 0.693 | ||
| Hypertension | 1.367 (0.809–2.311) | 0.243 | ||
| PCI performed | 1.181 (0.719–1.938) | 0.512 | ||
| Diabetes | 1.828 (1.115–2.999) | 0.017 | 1.287 (0.761–2.176) | 0.346 |
| CKD | 1.926 (0.947–3.916) | 0.070 | 0.873 (0.288–2.645) | 0.810 |
| CAD | 1.369 (0.825–2.270) | 0.224 | ||
| 1- vessel disease | 0.995 (0.557–1.778) | 0.987 | ||
| 2- vessel disease | 1.174 (0.647–2.128) | 0.597 | ||
| 3- vessel disease | 1.654 (0.816–3.353) | 0.163 | ||
| TyG index | 1.506 (1.085–2.090) | 0.014 | - | |
| TyG Tertiles | ||||
| T1 | Reference | Reference | ||
| T2 | 1.357 (0.689–2.674) | 0.377 | 1.595 (0.785–3.241) | 0.197 |
| T3 | 2.157 (1.156–4.025) | 0.016 | 2.132 (1.066–4.261) | 0.032 |
| TG | 1.100 (0.960–1.261) | 0.171 | ||
| FBG | 1.141 (1.047–1.244) | 0.003 | - | |
| HbA1c | 1.161 (0.946–1.425) | 0.153 | ||
| CRP | 0.990 (0.952–1.031) | 0.633 | ||
| Serum creatinine | 1.012 (1.001–1.024) | 0.033 | 1.010 (0.991–1.028) | 0.307 |
| TC | 1.054 (0.837–1.329) | 0.654 | ||
| LDL-C | 1.039 (0.794–1.359) | 0.783 | ||
| LVEF | 0.914 (0.884–0.944) | < 0.001 | 0.925 (0.890–0.961) | < 0.001 |
| caFFR | 0.011 (1 × 10⁻⁶-85.756) | 0.324 | ||
| caIMR | 0.998 (0.975–1.021) | 0.856 | ||
| Aspirin | 0.695 (0.416–1.162) | 0.166 | ||
| Clopidogrel | 1.606 (0.968–2.665) | 0.067 | 1.341 (0.786–2.287) | 0.282 |
| Statin | 1.243 (0.566–2.729) | 0.588 | ||
| ACEI/ARB | 1.521 (0.926–2.497) | 0.097 | 0.997 (0.562–1.771) | 0.993 |
| Beta blocker | 0.804 (0.488–1.325) | 0.392 | ||
| CCB | 1.048 (0.633–1.735) | 0.855 |
MACE major adverse cardiovascular event, BMI body mass index, PCI percutaneous coronary intervention, CKD chronic kidney disease, CAD coronary artery disease, TyG index triglyceride-glucose index, TG triglyceride, FBG fasting blood glucose, HbA1c hemoglobin A1c, CRP C-reactive protein, TC total cholesterol, LDL-C low-density lipoprotein-cholesterol, LVEF left ventricular ejection fraction, caFFR coronary angiography-derived fractional flow reserve, caIMR coronary angiography-derived index of microcirculatory resistance, ACEI/ARB angiotensin-converting-enzyme inhibitor/angiotensin receptor blocker, CCB calcium channel blocker, HR hazard ratio, CI confidence interval
Discussion
The present study is the first to assess the association between the TyG index and the presence and prognosis of CMD in patients with CCS. The novel findings of our study included: (1) CMD patients had a significantly higher TyG index than those without CMD; (2) the TyG index significantly correlated with caIMR, and was an independent risk predictor for CMD in CCS patients; (3) high TyG index was independently associated with the risk of MACE in CMD patients with CCS.
The pathological mechanism of CCS is complex, and macrovascular disease of coronary arteries cannot fully explain the clinical manifestations and poor prognosis of CCS patients [1]. Many CCS patients without obvious coronary artery stenosis or after complete revascularization may still have typical anginal symptoms and poor prognosis [1, 3, 4]. Increasing attention has been paid to the adverse effects of CMD which may provide additional insights into risk modification for CCS patients [3]. CMD refers to the abnormal function and structure of coronary microvessels, which can result in insufficient blood supply to the myocardium [3]. Oxidative stress is considered to be a key mechanism of the development of CMD, which can cause impaired NO-mediated vasodilation, thereby promoting the progression of CMD [24, 25]. Coronary microcirculation impairments could cause myocardial ischemia, leading to clinical symptoms such as angina pectoris [3, 4]. A large number of studies have shown that CMD is common in patients with CCS and portends a poor prognosis, and is often accompanied by an impaired quality of life, mental status, and exercise capacity [2–4, 26]. Previous studies have suggested that coronary slow flow, a sign of CMD, was associated with decreased carotid blood flow velocity [27]. In recent years, more attention has been paid to the hazards of CMD. Rajai et al. reported that CMD was closely related to the development of cancer in patients with non-obstructive coronary artery disease [28]. The cerebral-coronary connection study suggested that CMD patients were more likely to have cognitive impairment [29]. The increasing recognition of the hazards associated with CMD has led to a significant rise in the importance of research on CMD. caIMR is a new method to detect CMD based on coronary angiography without pressure wire and hyperemic agents [19]. In previous studies, caIMR (cut-off 25U) showed a good correlation with invasive IMR which is a specific tool to detect CMD [6, 19]. Recently, several studies have shown that CMD diagnosed by caIMR was associated with poor prognosis. Choi et al. indicated that ST-segment elevation myocardial infarction (STEMI) patients with CMD assessed by caIMR showed an increased risk of cardiac death or heart failure readmission [30]. Abdu et al. reported that CMD assessed by caIMR was closely related to the poor prognosis of MINOCA patients [7]. Neng et al. found that CMD diagnosed by caIMR was a strong predictor for cardiac death and heart failure in CAD patients [6]. We recently found that CMD measured by caIMR was common and was a reliable predictor of clinical outcomes in diabetic patients with CCS [31]. Based on this, CMD is clearly associated with poor prognosis, and the identification of predictive factors associated with CMD may be necessary for prompt risk stratification.
Type 2 diabetes mellitus (T2DM) is characterized by IR, which has been identified as a CVD risk factor and as a contributor to the development of CMD [10, 11, 32]. IR can decrease the production of vasoprotective nitric oxide (NO) by reducing the activity of the endothelial NO synthase leading to CMD [33]. In addition, hyperinsulinemia can also promote oxidative stress and the release of pro-inflammatory cytokines by increasing free fatty acids, reactive oxygen species (ROS) production, and dyslipidemia, thus promoting CMD [11]. Recently, A small study also suggested that CMD is significantly associated with the severity of IR during acute hyperglycemia [10]. Currently, IR detection methods are expensive, time-consuming, difficult to use in clinical practice, and have significant bias [14]. The TyG index, as the product of FBG and fasting TG, is a novel index that has been suggested as a simple and reliable surrogate of IR and is not affected by insulin treatment [12–14]. A high TyG index was associated with a variety of CVD such as symptomatic CAD, arterial stiffness, coronary artery calcification, in-stent restenosis, and multi-vessel CAD [14, 34–37]. Moreover, TyG index was also associated with microvascular diseases including microangiopathies, nephric microvascular damage, microalbuminuria, and slow coronary flow [18, 38–40]; these findings suggest that there may be an association between the TyG index and the risk of CMD. these findings suggested that TyG index might be associated with the risk of CMD. In the present study, we found that CMD patients had significantly higher TyG index than non-CMD patients; we also found that the TyG index was an independent predictor of CMD in CCS patients. The findings of our study are consistent with previous reports suggesting an indirect association between insulin resistance (IR) and CMD. This highlights the need for interventions to prevent the occurrence of CMD in CCS patients by targeting IR. In addition, our study also revealed that the link between TyG index and CMD was stronger in females and non-diabetic patients. Similarly, the association between TyG index and caIMR was more prominent in these subgroups. These findings are in line with previous research, which has suggested that the impact of TyG index may be more pronounced in females and non-diabetic individuals [16, 17, 41, 42]. However, it is important to note that a direct cause-effect role of TyG index with CMD is less certain and further studies are needed to fully elucidate the underlying mechanisms.
A large number of studies have shown that the TyG index can predict adverse outcomes in patients with CVD [14, 16, 17, 43, 44]. Wang et al. reported that the TyG index could predict the risk of MACE in ACS patients with diabetes [45]. In patients with CAD, the TyG index was associated with T2DM and was an independent predictor of future cardiovascular events [46, 47]. Zhao et al. found that the TyG index in combination with microstructural optical coherence tomography (OCT) characteristics of culprit lesions could support risk stratification in STEMI patients [44]. Several studies have shown that the TyG index can also be used in the risk stratification of patients with premature CAD or chronic total occlusion [16, 17]. However, the prognostic value of TyG index in the CMD population is currently unknown, and identifying high-risk patients through risk stratification of CMD is of great clinical significance. Consistent with previous studies, this study showed that TyG index was not only associated with the presence of CMD but also remained strongly correlated with the risk of MACE in CCS patients with CMD. Multivariate cox regression analysis also showed that the highest tertile of the TyG index remained significantly correlated with worse clinical outcomes even after adjustment of other confounding risk factors. This underlines the importance of lipid and glucose metabolism, as revealed by the TyG index, in the pathogenic mechanism of CMD. Subgroup analysis showed that there was no interaction between CAD and TyG index for prognosis of CMD patients and TyG index was still associated with the occurrence of MACE in CMD patients with CAD. After excluding patients with LVEF < 50%, the correlation between TyG index and MACE in CMD patients remained (Additional file 1: Table S4). These results further support the prognostic value of TyG index for CMD patients, rather than the presence of previous cardiovascular diseases that leads to poor prognosis. Our results provided significant clinical evidence for the predictive value of the TyG index in CMD patients for the occurrence of MACE. The TyG index is a simple and easily obtained measure, which is not affected by insulin therapy. Therefore, it has better clinical applicability in the risk stratification of CMD patients. Targeting IR in CCS patients may be beneficial in the prevention and treatment of CMD, which needs further confirmation.
Study limitations
There are some potential limitations in our study. First, this is a single-center retrospective observational study, and the sample size is relatively small, therefore, our study does not confirm a causal relationship between elevated TyG index and the development of CMD. Further large-scale, prospective, and multi-center studies are needed to validate the results of the present study. Second, as a novel surrogate technique, caIMR is operator-dependent to some extent. In our study, participants did not receive invasive IMR assessment for CMD. Third, the patients’ TG and FBG levels were only tested at admission and their fluctuations were not measured during the follow-up; therefore, it was unknown whether the TyG index changed during the follow-up. Finally, our study mainly focused on the TyG index and lacked other glucose-related variables such as diabetic drugs, HOMA-IR, and insulin level. Despite these limitations, our study is important for clinical practice as it is the first to investigate the relationship between the TyG index and the presence and prognosis of CMD in CCS patients.
Conclusion
This study demonstrates for the first time that the increased TyG index is significantly associated with a higher risk of CMD in CCS patients, and it is a strong independent predictor for MACE among CMD patients with CCS. This conclusion suggests that the TyG index has important clinical significance for the early prevention and risk stratification of CMD.
Supplementary Information
Additional file1: Figure S1. Correlation between TyG index and caIMR in various subgroups. TyG index triglyceride-glucose index, caIMR coronary angiography-derived index of microcirculatory resistance, DM diabetes mellitus, CAD coronary artery disease.
Acknowledgements
We are indebted to all members who contributed to this work.
Abbreviations
- CMD
Coronary microvascular dysfunction
- CCS
Chronic coronary syndrome
- TyG index
Triglyceride-glucose index
- caIMR
Coronary angiography‑derived index of microvascular resistance
- MACE
Major adverse cardiac events
- CAD
Coronary artery disease
- CVD
Cardiovascular disease
- ACS
Acute coronary syndrome
- HFpEF
Heart failure with preserved ejection fraction
- MINOCA
Myocardial infarction with nonobstructive coronary arteries
- IR
Insulin resistance
- FBG
Fasting blood glycemia
- TG
Triglycerides
- CAG
Coronary angiography
- MI
Myocardial infarction
- CABG
Post coronary artery bypass graft surgery
- LVEF
Left ventricular ejection fraction
- HbA1c
Hemoglobin A1c
- TC
Total cholesterol
- LDL-C
Low-density lipoprotein-C
- CRP
C-reactive protein
- PCI
Percutaneous coronary intervention
- SBP
Systolic blood pressure
- DBP
Diastolic blood pressure
- BMI
Body mass index
- CKD
Chronic kidney disease
- VIF
Variance inflation factor
- STEMI
ST-segment elevation myocardial infarction
- T2DM
Type 2 diabetes mellitus
- NO
Nitric oxide
- ROS
Reactive oxygen species
- OCT
Optical coherence tomography
Author contributions
WZ, LL, FA, and WC designed the study. BX, SL, HC, JG, and GY collected the data. TS, MW, AM, RM, AM, and XL were involved in data cleaning, follow-up, and verification. FA, YX, and WC drafted the manuscript and revised it critically for important intellectual content. WC and FA approved the final version of the manuscript. All authors contributed to manuscript revision, read, and approved the final version.
Funding
This work was supported by in part by Chinese National Natural Science Foundation (82170521), Shanghai Natural Science Foundation of China (21ZR1449500), Foundation of Shanghai Municipal Health Commission (202140263), Tibet Natural Science Foundation of China (XZ2022ZR-ZY27(Z)), Foundation of Chongming (CKY2021-21, CKY2020-29), Clinical Research Plan of Shanghai Tenth People’s Hospital (YNCR2A001), and Clinical Research Plan of SHDC (SHDC2020CR4065).
Availability of data and materials
The data analyzed in this study can be obtained from the corresponding author with a reasonable request.
Declarations
Ethics approval and consent to participate
Our study was carried out in accordance with the Helsinki Declaration and was approved by the ethical review board of Shanghai Tenth People’s Hospital. Each participating patient in this study recruited written informed consent.
Consent for publication
Not applicable.
Competing interests
The authors declare no conflict of interest.
Footnotes
Publisher's Note
Springer Nature remains neutral with regard to jurisdictional claims in published maps and institutional affiliations.
Wen Zhang and Lu Liu contributed equally to this work.
Contributor Information
Fuad A. Abdu, Email: 1691026@tongji.edu.cn
Wenliang Che, Email: chewenliang@tongji.edu.cn.
References
- 1.Knuuti J, Wijns W, Saraste A, Capodanno D, Barbato E, Funck-Brentano C, et al. 2019 ESC Guidelines for the diagnosis and management of chronic coronary syndromes. Eur Heart J. 2020;41(3):407–477. doi: 10.1093/eurheartj/ehz425. [DOI] [PubMed] [Google Scholar]
- 2.Corcoran D, Young R, Adlam D, McConnachie A, Mangion K, Ripley D, et al. Coronary microvascular dysfunction in patients with stable coronary artery disease: The CE-MARC 2 coronary physiology sub-study. Int J Cardiol. 2018;266:7–14. doi: 10.1016/j.ijcard.2018.04.061. [DOI] [PMC free article] [PubMed] [Google Scholar]
- 3.Del Buono MG, Montone RA, Camilli M, Carbone S, Narula J, Lavie CJ, et al. Coronary Microvascular Dysfunction Across the Spectrum of Cardiovascular Diseases: JACC State-of-the-Art Review. J Am Coll Cardiol. 2021;78(13):1352–1371. doi: 10.1016/j.jacc.2021.07.042. [DOI] [PMC free article] [PubMed] [Google Scholar]
- 4.Padro T, Manfrini O, Bugiardini R, Canty J, Cenko E, De Luca G, et al. ESC Working Group on Coronary Pathophysiology and Microcirculation position paper on 'coronary microvascular dysfunction in cardiovascular disease'. Cardiovasc Res. 2020;116(4):741–755. doi: 10.1093/cvr/cvaa003. [DOI] [PMC free article] [PubMed] [Google Scholar]
- 5.Vancheri F, Longo G, Vancheri S, Henein M. Coronary Microvascular Dysfunction. J Clin Med. 2020;9(9):2880. doi: 10.3390/jcm9092880. [DOI] [PMC free article] [PubMed] [Google Scholar]
- 6.Dai N, Che W, Liu L, Zhang W, Yin G, Xu B, et al. Diagnostic value of angiography-derived IMR for coronary microcirculation and its prognostic implication after PCI. Front Cardiovasc Med. 2021;8:735743. doi: 10.3389/fcvm.2021.735743. [DOI] [PMC free article] [PubMed] [Google Scholar]
- 7.Abdu FA, Liu L, Mohammed AQ, Yin G, Xu B, Zhang W, et al. Prognostic impact of coronary microvascular dysfunction in patients with myocardial infarction with non-obstructive coronary arteries. Eur J Intern Med. 2021;92:79–85. doi: 10.1016/j.ejim.2021.05.027. [DOI] [PubMed] [Google Scholar]
- 8.Taqueti VR, Solomon SD, Shah AM, Desai AS, Groarke JD, Osborne MT, et al. Coronary microvascular dysfunction and future risk of heart failure with preserved ejection fraction. Eur Heart J. 2018;39(10):840–849. doi: 10.1093/eurheartj/ehx721. [DOI] [PMC free article] [PubMed] [Google Scholar]
- 9.Maznyczka AM, Oldroyd KG, Greenwood JP, McCartney PJ, Cotton J, Lindsay M, et al. Comparative significance of invasive measures of microvascular injury in acute myocardial infarction. Circ Cardiovasc Interv. 2020;13(5):e008505. doi: 10.1161/CIRCINTERVENTIONS.119.008505. [DOI] [PMC free article] [PubMed] [Google Scholar]
- 10.Takei Y, Tomiyama H, Tanaka N, Yamashina A, Chikamori T. Association between insulin resistance, oxidative stress, sympathetic activity and coronary microvascular function in patients with early stage impaired glucose metabolism. Circ J. 2022;86(5):866–873. doi: 10.1253/circj.CJ-21-0549. [DOI] [PubMed] [Google Scholar]
- 11.Konst RE, Guzik TJ, Kaski JC, Maas A, Elias-Smale SE. The pathogenic role of coronary microvascular dysfunction in the setting of other cardiac or systemic conditions. Cardiovasc Res. 2020;116(4):817–828. doi: 10.1093/cvr/cvaa009. [DOI] [PMC free article] [PubMed] [Google Scholar]
- 12.Du T, Yuan G, Zhang M, Zhou X, Sun X, Yu X. Clinical usefulness of lipid ratios, visceral adiposity indicators, and the triglycerides and glucose index as risk markers of insulin resistance. Cardiovasc Diabetol. 2014;13:146. doi: 10.1186/s12933-014-0146-3. [DOI] [PMC free article] [PubMed] [Google Scholar]
- 13.Navarro-Gonzalez D, Sanchez-Inigo L, Pastrana-Delgado J, Fernandez-Montero A, Martinez JA. Triglyceride-glucose index (TyG index) in comparison with fasting plasma glucose improved diabetes prediction in patients with normal fasting glucose: the Vascular-Metabolic CUN cohort. Prev Med. 2016;86:99–105. doi: 10.1016/j.ypmed.2016.01.022. [DOI] [PubMed] [Google Scholar]
- 14.Tao LC, Xu JN, Wang TT, Hua F, Li JJ. Triglyceride-glucose index as a marker in cardiovascular diseases: landscape and limitations. Cardiovasc Diabetol. 2022;21(1):68. doi: 10.1186/s12933-022-01511-x. [DOI] [PMC free article] [PubMed] [Google Scholar]
- 15.Neglia D, Aimo A, Lorenzoni V, Caselli C, Gimelli A. Triglyceride-glucose index predicts outcome in patients with chronic coronary syndrome independently of other risk factors and myocardial ischaemia. Eur Heart J Open. 2021;1(1):oeb004. doi: 10.1093/ehjopen/oeab004. [DOI] [PMC free article] [PubMed] [Google Scholar]
- 16.Wu Z, Liu L, Wang W, Cui H, Zhang Y, Xu J, et al. Triglyceride-glucose index in the prediction of adverse cardiovascular events in patients with premature coronary artery disease: a retrospective cohort study. Cardiovasc Diabetol. 2022;21(1):142. doi: 10.1186/s12933-022-01576-8. [DOI] [PMC free article] [PubMed] [Google Scholar]
- 17.Li Y, He S, Wu Z, Li W, Jian W, Cheng Z, et al. The predictive value of the triglyceride-glucose index for cardiovascular events in patients with coronary chronic total occlusion. Cardiovasc Diabetol. 2022;21(1):149. doi: 10.1186/s12933-022-01588-4. [DOI] [PMC free article] [PubMed] [Google Scholar]
- 18.Buber I, Nar R, Kaya D, Senol H, Adali MK, Nar G. Assessment of triglyceride/glucose index with respect to coronary slow flow. Bratisl Lek Listy. 2022;123(8):585–588. doi: 10.4149/BLL_2022_095. [DOI] [PubMed] [Google Scholar]
- 19.Ai H, Feng Y, Gong Y, Zheng B, Jin Q, Zhang HP, et al. Coronary angiography-derived index of microvascular resistance. Front Physiol. 2020;11:605356. doi: 10.3389/fphys.2020.605356. [DOI] [PMC free article] [PubMed] [Google Scholar]
- 20.Petersmann A, Müller-Wieland D, Müller UA, Landgraf R, Nauck M, Freckmann G, et al. Definition, classification and diagnosis of diabetes mellitus. Exp Clin Endocrinol Diabetes. 2019;127:S1–S7. doi: 10.1055/a-1018-9078. [DOI] [PubMed] [Google Scholar]
- 21.Thygesen K, Alpert JS, Jaffe AS, Chaitman BR, Bax JJ, Morrow DA, et al. Fourth universal definition of myocardial infarction (2018) J Am Coll Cardiol. 2018;72(18):2231–2264. doi: 10.1016/j.jacc.2018.08.1038. [DOI] [PubMed] [Google Scholar]
- 22.McDonagh TA, Metra M, Adamo M, Gardner RS, Baumbach A, Böhm M, et al. 2021 ESC Guidelines for the diagnosis and treatment of acute and chronic heart failure. Eur Heart J. 2021;42(36):3599–3726. doi: 10.1093/eurheartj/ehab368. [DOI] [PubMed] [Google Scholar]
- 23.Cutlip DE, Windecker S, Mehran R, Boam A, Cohen DJ, van Es GA, et al. Clinical end points in coronary stent trials: a case for standardized definitions. Circulation. 2007;115(17):2344–2351. doi: 10.1161/CIRCULATIONAHA.106.685313. [DOI] [PubMed] [Google Scholar]
- 24.Masi S, Rizzoni D, Taddei S, Widmer RJ, Montezano AC, Lüscher TF, et al. Assessment and pathophysiology of microvascular disease: recent progress and clinical implications. Eur Heart J. 2021;42(26):2590–2604. doi: 10.1093/eurheartj/ehaa857. [DOI] [PMC free article] [PubMed] [Google Scholar]
- 25.Magenta A, Greco S, Capogrossi MC, Gaetano C, Martelli F. Nitric oxide, oxidative stress, and p66Shc interplay in diabetic endothelial dysfunction. Biomed Res Int. 2014;2014:193095. doi: 10.1155/2014/193095. [DOI] [PMC free article] [PubMed] [Google Scholar]
- 26.Crea F, Camici PG, Bairey Merz CN. Coronary microvascular dysfunction: an update. Eur Heart J. 2014;35(17):1101–1111. doi: 10.1093/eurheartj/eht513. [DOI] [PMC free article] [PubMed] [Google Scholar]
- 27.Lutfu A, Mustafa C, Serdar T, Mehmet HT, Erdal A. Quantitative ultrasound measurements of common carotid artery blood flow velocity patterns in patients with coronary slow flow. J Human Rhythm. 2018;4(2):117–125. [Google Scholar]
- 28.Rajai N, Ahmad A, Toya T, Sara JD, Herrmann J, Lerman LO, et al. Coronary microvascular dysfunction is an independent predictor of developing cancer in patients with non-obstructive coronary artery disease. Eur J Prev Cardiol. 2023;30(3):209–216. doi: 10.1093/eurjpc/zwac184. [DOI] [PMC free article] [PubMed] [Google Scholar]
- 29.Mejia-Renteria H, Travieso A, Matías-Guiu JA, Yus M, Espejo-Paeres C, Finocchiaro F, et al. Coronary microvascular dysfunction is associated with impaired cognitive function: the Cerebral-Coronary Connection study (C3 study) Eur Heart J. 2023;44(2):113–125. doi: 10.1093/eurheartj/ehac521. [DOI] [PMC free article] [PubMed] [Google Scholar]
- 30.Choi KH, Dai N, Li Y, Kim J, Shin D, Lee SH, et al. Functional coronary angiography-derived index of microcirculatory resistance in patients with ST-Segment elevation myocardial infarction. JACC Cardiovasc Interv. 2021;14(15):1670–1684. doi: 10.1016/j.jcin.2021.05.027. [DOI] [PubMed] [Google Scholar]
- 31.Zhang W, Singh S, Liu L, Mohammed AQ, Yin G, Xu S, et al. Prognostic value of coronary microvascular dysfunction assessed by coronary angiography-derived index of microcirculatory resistance in diabetic patients with chronic coronary syndrome. Cardiovasc Diabetol. 2022;21(1):222. doi: 10.1186/s12933-022-01653-y. [DOI] [PMC free article] [PubMed] [Google Scholar]
- 32.Laakso M. Is insulin resistance a feature of or a primary risk factor for cardiovascular disease? Curr Diab Rep. 2015;15(12):105. doi: 10.1007/s11892-015-0684-4. [DOI] [PubMed] [Google Scholar]
- 33.Inoguchi T, Li P, Umeda F, Yu HY, Kakimoto M, Imamura M, et al. High glucose level and free fatty acid stimulate reactive oxygen species production through protein kinase C–dependent activation of NAD(P)H oxidase in cultured vascular cells. Diabetes. 2000;49(11):1939–1945. doi: 10.2337/diabetes.49.11.1939. [DOI] [PubMed] [Google Scholar]
- 34.da Silva A, Caldas APS, Hermsdorff HHM, Bersch-Ferreira AC, Torreglosa CR, Weber B, et al. Triglyceride-glucose index is associated with symptomatic coronary artery disease in patients in secondary care. Cardiovasc Diabetol. 2019;18(1):89. doi: 10.1186/s12933-019-0893-2. [DOI] [PMC free article] [PubMed] [Google Scholar]
- 35.Park K, Ahn CW, Lee SB, Kang S, Nam JS, Lee BK, et al. Elevated TyG index predicts progression of coronary artery calcification. Diabetes Care. 2019;42(8):1569–1573. doi: 10.2337/dc18-1920. [DOI] [PubMed] [Google Scholar]
- 36.Wang X, Xu W, Song Q, Zhao Z, Meng X, Xia C, et al. Association between the triglyceride-glucose index and severity of coronary artery disease. Cardiovasc Diabetol. 2022;21(1):168. doi: 10.1186/s12933-022-01606-5. [DOI] [PMC free article] [PubMed] [Google Scholar]
- 37.Lambrinoudaki I, Kazani MV, Armeni E, Georgiopoulos G, Tampakis K, Rizos D, et al. The TyG Index as a Marker of Subclinical Atherosclerosis and Arterial Stiffness in Lean and Overweight Postmenopausal Women. Heart Lung Circ. 2018;27(6):716–724. doi: 10.1016/j.hlc.2017.05.142. [DOI] [PubMed] [Google Scholar]
- 38.Potier L, Chequer R, Roussel R, Mohammedi K, Sismail S, Hartemann A, et al. Relationship between cardiac microvascular dysfunction measured with 82Rubidium-PET and albuminuria in patients with diabetes mellitus. Cardiovasc Diabetol. 2018;17(1):11. doi: 10.1186/s12933-017-0652-1. [DOI] [PMC free article] [PubMed] [Google Scholar]
- 39.Zhao S, Yu S, Chi C, Fan X, Tang J, Ji H, et al. Association between macro- and microvascular damage and the triglyceride glucose index in community-dwelling elderly individuals: the Northern Shanghai Study. Cardiovasc Diabetol. 2019;18(1):95. doi: 10.1186/s12933-019-0898-x. [DOI] [PMC free article] [PubMed] [Google Scholar]
- 40.Chiu H, Tsai HJ, Huang JC, Wu PY, Hsu WH, Lee MY, et al. Associations between Triglyceride-Glucose Index and Micro- and Macro-angiopathies in Type 2 Diabetes Mellitus. Nutrients. 2020;12(2):328. doi: 10.3390/nu12020328. [DOI] [PMC free article] [PubMed] [Google Scholar]
- 41.Lu YW, Chang CC, Chou RH, Tsai YL, Liu LK, Chen LK, et al. Gender difference in the association between TyG index and subclinical atherosclerosis: results from the I-Lan Longitudinal Aging Study. Cardiovasc Diabetol. 2021;20(1):206. doi: 10.1186/s12933-021-01391-7. [DOI] [PMC free article] [PubMed] [Google Scholar]
- 42.Li S, Guo B, Chen H, Shi Z, Li Y, Tian Q, et al. The role of the triglyceride (triacylglycerol) glucose index in the development of cardiovascular events: a retrospective cohort analysis. Sci Rep. 2019;9(1):7320. doi: 10.1038/s41598-019-43776-5. [DOI] [PMC free article] [PubMed] [Google Scholar]
- 43.Gao S, Ma W, Huang S, Lin X, Yu M. Impact of triglyceride-glucose index on long-term cardiovascular outcomes in patients with myocardial infarction with nonobstructive coronary arteries. Nutr Metab Cardiovasc Dis. 2021;31(11):3184–3192. doi: 10.1016/j.numecd.2021.07.027. [DOI] [PubMed] [Google Scholar]
- 44.Zhao X, Wang Y, Chen R, Li J, Zhou J, Liu C, et al. Triglyceride glucose index combined with plaque characteristics as a novel biomarker for cardiovascular outcomes after percutaneous coronary intervention in ST-elevated myocardial infarction patients: an intravascular optical coherence tomography study. Cardiovasc Diabetol. 2021;20(1):131. doi: 10.1186/s12933-021-01321-7. [DOI] [PMC free article] [PubMed] [Google Scholar]
- 45.Wang L, Cong HL, Zhang JX, Hu YC, Wei A, Zhang YY, et al. Triglyceride-glucose index predicts adverse cardiovascular events in patients with diabetes and acute coronary syndrome. Cardiovasc Diabetol. 2020;19(1):80. doi: 10.1186/s12933-020-01054-z. [DOI] [PMC free article] [PubMed] [Google Scholar]
- 46.Jin JL, Cao YX, Wu LG, You XD, Guo YL, Wu NQ, et al. Triglyceride glucose index for predicting cardiovascular outcomes in patients with coronary artery disease. J Thorac Dis. 2018;10(11):6137–6146. doi: 10.21037/jtd.2018.10.79. [DOI] [PMC free article] [PubMed] [Google Scholar]
- 47.Si Y, Fan W, Shan W, Zhang Y, Liu J, Han C, et al. Association between triglyceride glucose index and coronary artery disease with type 2 diabetes mellitus in middle-aged and elderly people. Medicine. 2021;100(9):e25025. doi: 10.1097/MD.0000000000025025. [DOI] [PMC free article] [PubMed] [Google Scholar]
Associated Data
This section collects any data citations, data availability statements, or supplementary materials included in this article.
Supplementary Materials
Additional file1: Figure S1. Correlation between TyG index and caIMR in various subgroups. TyG index triglyceride-glucose index, caIMR coronary angiography-derived index of microcirculatory resistance, DM diabetes mellitus, CAD coronary artery disease.
Data Availability Statement
The data analyzed in this study can be obtained from the corresponding author with a reasonable request.