

Abstract
Background
Chronic kidney disease (CKD) is a worldwide public health problem. In the National Kidney Foundation Disease Outcomes Quality Initiative guidelines it is stressed that lifestyle issues such as physical activity should be seen as cornerstones of the therapy. The physical fitness in adults with CKD is so reduced that it impinges on ability and capacity to perform activities in everyday life and occupational tasks. An increasing number of studies have been published regarding health effects of various regular exercise programmes in adults with CKD and in renal transplant patients.
Objectives
We aimed to: 1) assess the effects of regular exercise in adults with CKD and kidney transplant patients; and 2) determine how the exercise programme should be designed (e.g. type, duration, intensity, frequency of exercise) to be able to affect physical fitness and functioning, level of physical activity, cardiovascular dimensions, nutrition, lipids, glucose metabolism, systemic inflammation, muscle morphology and morphometrics, dropout rates, compliance, adverse events and mortality.
Search methods
We searched the Cochrane Renal Group's specialised register, CENTRAL, MEDLINE, EMBASE, CINAHL, Web of Science, Biosis, Pedro, Amed, AgeLine, PsycINFO and KoreaMed. We also handsearched reference lists of review articles and included studies, conference proceeding's abstracts. There were no language restrictions.
Date of last search: May 2010.
Selection criteria
We included any randomised controlled trial (RCT) enrolling adults with CKD or kidney transplant recipients undergoing any type of physical exercise intervention undertaken for eight weeks or more. Studies using less than eight weeks exercise, those only recommending an increase in physical activity, and studies in which co‐interventions are not applied or given to both groups were excluded.
Data collection and analysis
Data extraction and assessment of study and data quality were performed independently by the two authors. Continuous outcome data are presented as standardised mean difference (SMD) or mean difference (MD) with 95% confidence intervals (CI).
Main results
Forty‐five studies, randomising 1863 participants were included in this review. Thirty two studies presented data that could be meta‐analysed. Types of exercise training included cardiovascular training, mixed cardiovascular and resistance training, resistance‐only training and yoga. Some studies used supervised exercise interventions and others used unsupervised interventions. Exercise intensity was classed as 'high' or 'low', duration of individual exercise sessions ranged from 20 minutes/session to 110 minutes/session, and study duration was from two to 18 months. Seventeen per cent of studies were classed as having an overall low risk of bias, 33% as moderate, and 49% as having a high risk of bias.
The results shows that regular exercise significantly improved: 1) physical fitness (aerobic capacity, 24 studies, 847 participants: SMD ‐0.56, 95% CI ‐0.70 to ‐0.42; walking capacity, 7 studies, 191 participants: SMD ‐0.36, 95% CI‐0.65 to ‐0.06); 2) cardiovascular dimensions (resting diastolic blood pressure, 11 studies, 419 participants: MD 2.32 mm Hg, 95% CI 0.59 to 4.05; resting systolic blood pressure, 9 studies, 347 participants: MD 6.08 mm Hg, 95% CI 2.15 to 10.12; heart rate, 11 studies, 229 participants: MD 6 bpm, 95% CI 10 to 2); 3) some nutritional parameters (albumin, 3 studies, 111 participants: MD ‐2.28 g/L, 95% CI ‐4.25 to ‐0.32; pre‐albumin, 3 studies, 111 participants: MD ‐ 44.02 mg/L, 95% CI ‐71.52 to ‐16.53; energy intake, 4 studies, 97 participants: SMD ‐0.47, 95% CI ‐0.88 to ‐0.05); and 4) health‐related quality of life. Results also showed how exercise should be designed in order to optimise the effect. Other outcomes had insufficient evidence.
Authors' conclusions
There is evidence for significant beneficial effects of regular exercise on physical fitness, walking capacity, cardiovascular dimensions (e.g. blood pressure and heart rate), health‐related quality of life and some nutritional parameters in adults with CKD. Other outcomes had insufficient evidence due to the lack of data from RCTs. The design of the exercise intervention causes difference in effect size and should be considered when prescribing exercise with the aim of affecting a certain outcome. Future RCTs should focus more on the effects of resistance training interventions or mixed cardiovascular‐ and resistance training as these exercise types have not been studied as much as cardiovascular exercise.
Plain language summary
Exercise training for adults with chronic kidney disease
Exercise regimens are based on the frequency, intensity and duration of exercise training as well as the type of activity and the individual's initial level of physical fitness. All these factors have to be taken into account when aiming to achieve the goal with the regular exercise training and or rehabilitation.
Forty‐five studies, randomising 1863 participants were included in this review. Thirty two studies presented data that could be included in the meta‐analyses.This review showed that regular exercise training significantly improved physical fitness, physical functioning (e.g. walking capacity), and health‐related quality of life in adults with chronic kidney disease (CKD). Beneficial effects were also seen on other outcome measures, such as blood pressure, but where the level of evidence is somewhat lower due to too few research studies and or small study populations. Beneficial effects were present in both adults with CKD but not yet in need of dialysis treatment, patients with dialysis (haemodialysis and peritoneal dialysis) and kidney transplant recipients.
This systematic review and meta‐analysis presents evidence‐based data to clinicians and patients on which type of exercise regimen (type of exercises, intensity, frequency and duration of exercise) that should be used to optimise the effect size. The results should be implemented by clinicians who should encourage and inform adults with CKD that there is scientific evidence for beneficial effects of regular exercise training, and who should use an adequate exercise intervention in order to achieve the patient’s and the clinician's goal with the regular exercise.
Background
Chronic kidney disease (CKD) is a worldwide public health problem. Adverse outcomes of CKD include loss of kidney function and cardiovascular disease. The disease is defined as either: 1) kidney damage that is present for three months or more and with or without decreased glomerular filtration rate (GFR); or 2) GFR less than 60 mL/min/1.73 m² that is present for three months or more with or without kidney damage (KDOQI 2002). There are primary and secondary causes of CKD. Examples of primary CKD are glomerulonephritis, interstitial nephritis and polycystic kidney disease. Secondary causes can be diabetes mellitus, nephrosclerosis, and systemic diseases such as systemic lupus erythematous, rheumatic diseases and systemic vasculitis. There are five stages of CKD (KDOQI 2002).
Stage 1: GFR > 90 mL/min/1.73 m² (kidney damage with normal or increased kidney function)
Stage 2: GFR 60‐89 mL/min/1.73 m² (kidney damage with mild reduction in kidney function)
Stage 3: GFR 30‐59 mL/min/1.73 m² (moderate kidney function)
Stage 4: GFR 15‐29 mL/min/1.73 m² (severely reduced kidney function)
Stage 5: GFR < 15 mL/min/1.73 m² (kidney failure)
Stage 5D: on haemodialysis (HD) or peritoneal dialysis (PD)
The complications to CKD may be problems in themselves, but they may also increase the risk for other adverse events, for instance increase the risk for cardiovascular disease (KDOQI 2002). In the National Kidney Foundation Disease Outcomes Quality Initiative guidelines it is stressed that lifestyle issues such as physical activity habits should be seen as cornerstones of the therapy, especially when aiming at managing cardiovascular risk factors (KDOQI 2002).
The physical fitness and physical functioning (the ability and capacity to perform activities of daily living) is severely reduced in adults with CKD (Bohannon 1994; Clyne 1993; Heiwe 2001; Heiwe 2003; Heiwe 2005; Johansen 2003; Kempeneers 1990b; Kettner 1987; Kouidi 1997b; Kouidi 1998a; Kutner 1992), declining from 70% of the expected norm at early stages of CKD, to 50% of the expected norm when starting dialysis therapy (Brodin 2001; Clyne 1991b; Heiwe 2001; Kettner 1987; Painter 1986b). Kidney transplant patients have a physical fitness of approximately 70% to 80% of the expected norm (Painter 1986b). Thus, the physical fitness in adults with CKD is so reduced that it impinges on their ability and capacity to perform activities in everyday life and occupational tasks (Heiwe 2003; Wilmore 1999).
The main causes for the decline in physical exercise capacity in this group of patients are renal anaemia and skeletal muscle disorder (Clyne 1987; Diesel 1990; Kouidi 1998a; McMahon 1999; Thompson 1996). These factors cause fatigue and inactivity that, in turn, further reduces the physical exercise capacity. Today renal anaemia is successfully corrected by treatment with recombinant human erythropoietin (EPO), which improves, but does not normalise, maximal physical exercise capacity (Barany 1993; CESG 1990; Clyne 1992; Laupacis 1991; Lim 1989; Painter 2002b). There is however no significant changes in muscle metabolism after correction of renal anaemia, which implies that oxygen delivery is not the only limiting factor for aerobic metabolism in adults with CKD (Thompson 1996). The muscle weakness is predominant in the proximal muscle groups and in particular in the lower extremities (Brautbar 1983; Kettner 1987). When analysing muscle biopsies histopathological abnormalities are seen already in the pre‐dialysis stages (Heiwe 2005). The causes of muscular weakness have, however, not been fully elucidated. Muscle atrophy, a neuropathic process, and myopathy are potential causes of the muscular weakness. It is suggested that myopathy is due to abnormal energy metabolism (Thompson 1996), secondary hyperparathyroidism (Ritz 1980), malnutrition (Guarnieri 1983), prolonged physical inactivity (Jones 1990), and to uraemia itself (Sakkas 2003b).
Insulin resistance as well as reduced insulin sensitivity is also present in adults with CKD (Eidemak 1995). There is a positive correlation between maximal exercise capacity and insulin sensitivity of the tissues (Eidemak 1995). Insulin resistance and metabolic acidosis, both common in CKD, causes an increased muscle proteolysis. Studies performed on uraemic rats have shown that regular exercise training reduces muscle protein catabolism, and that the reduction is combined with improved insulin sensitivity (Davis 1983; Davis 1987).
During the last 30 years there have been a significantly increasing number of published studies concerning effects of regular exercise training in adults with CKD. There is however a lack of evidence‐based guidelines for exercise training in adults with CKD. Therefore there is a need for a review in this area to clarify: 1) the effects of regular physical exercise training in adults with CKD and kidney transplant patients; and 2) how the exercise training programme should be designed (e.g. type of exercises, duration, intensity, frequency) to be able to affect clinically important outcomes in this group of patients.
Objectives
To assess the effects of regular physical exercise training in adults with CKD and kidney transplant recipients on the following clinically important health outcomes: physical fitness and functioning; cardiovascular dimensions; nutrition; level of physical activity; depression; health‐related quality of life; blood lipids; muscle morphology and morphometric systemic inflammation; glucose metabolism; dropout rates; adverse events; and mortality.
Methods
Criteria for considering studies for this review
Types of studies
Design
All randomised controlled trials (RCTs) and quasi‐RCTs, assessing the effects of regular physical exercise training in adults with CKD were included. Crossover studies were considered if the starting period of intervention was randomly allocated.
Duration
Studies of eight weeks regular exercise or longer were included since the aim was to evaluate the effects of regular ongoing physical exercise training. An exercise training period of less than eight weeks would be too short to show alteration in nutritional status, inflammation, cardiac function, physical activity, fitness and functioning, and psychological well‐being.
Exclusion criteria
Studies where the intervention involved only the recommendation of increased physical activity were not included as it was not possible to quantify the exercise stimulus. Studies where there was a co‐intervention in the experimental group was not applied to the control group. Studies with an exercise intervention less than two months were excluded as this period has been found too short for achieving changes in many of the outcome measures that this review focuses on (ACSM 2006) and also as this review is focused on effects of long‐term regular exercise training interventions.
Types of participants
All adults (male or female) with any stage CKD or who have received a kidney transplant were included.
Studies investigating the effects of regular physical exercise training in adults with acute kidney injury (AKI) and studies in children were excluded.
Types of interventions
Exercise regimens needed to be planned, structured and repetitive. They needed to include specific recommendations for the type, intensity, frequency and duration of exercise training with a specific objective (i.e. increase fitness or health, Bouchard 1994). Studies were classified as short‐term (three months or less, but not less than two months regular exercise), medium‐term (four to six months regular exercise), long term (six to 12 months or longer regular exercise) based on the presented exercise intervention period.
As the intention of the review was to measure the effect of regular exercise training, only studies where the only difference in interventions between groups was regular exercise training were included. The review includes studies involving the following types of interventions.
Regular physical exercise training versus non‐exercise control.
Regular physical exercise training plus a co‐intervention versus just that co‐intervention, i.e. physical exercise training plus erythropoietin treatment versus erythropoietin treatment.
Types of outcome measures
This review focused on clinically important outcomes, measured using physiological and psychological variables associated with CKD and its complications.
Outcome data at the end of the intervention were used.
Primary outcomes
Physical fitness: aerobic capacity; muscular strength and endurance
Physical functioning and activity: walking capacity; stair climbing capacity; activities of daily living (ADL) capacity
Cardiovascular dimensions: resting blood pressure (diastolic and systolic); maximum heart rate; resting heart rate
Nutritional measures: albumin; pre‐albumin; Subjective Global Assessment (SGA); energy intake; protein intake; transferrin; body mass indices (muscle mass, fat mass, anthropometric measures ‐ waist circumference, mid‐arm circumference, calf circumference; mid‐thigh circumference)
Systemic inflammation: serum interleukin 6; lymphocytes; protein catabolic rate
Physical activity
Depression
Health‐related quality of life (using well established reliable and validated instruments such as SF‐36, Euroquol).
Secondary outcomes
Blood lipids: triglycerides; total cholesterol; high‐density lipoprotein (HDL) cholesterol; low‐density lipoprotein (LDL) cholesterol; very low‐density lipoprotein (VLDL) cholesterol; intermediate‐density lipoproteins (IDL); apolipoprotein (APO) A1; APO B
Muscle morphology and morphometrics: type I, IIa and IIb muscle fibre area; proportion type I, IIa and IIb muscle fibres; thigh muscle cross sectional area, thigh muscle attenuation
Cardiovascular dimensions: heart rate variability (HRV) index; mean RR; mean standard deviation of all the normal RR intervals (SDNN); arrhythmias (Lown class > II); left ventricular internal dimension at end‐diastole, left ventricular internal dimension at end‐systole; intraventricular septal thickness at end‐diastole; left ventricular posterior wall thickness at end‐diastole; left ventricular mass; left ventricular mass index
Glucose metabolism: fasting plasma glucose; fasting plasma insulin; glucose disappearance
Dropout rates
Compliance
Adverse events (exercise induced injuries)
Mortality
Search methods for identification of studies
The search for studies was performed by one of the author using the Cochrane Renal Group search strategy. The searches were performed with the assistance of the Cochrane Renal Group Trials Search Coordinator; librarian Susanne Gustafsson, Karolinska Institutet University Library; and librarian Marie Källberg, Karolinska University Hospital Library.
Electronic searches
The following databases were searched (see Appendix 1).
The Cochrane Renal Group's specialised register and the Cochrane Central Register of Controlled Trials (CENTRAL) in The Cochrane Library (from start to May 2010)
MEDLINE (from 1966 to May 2010)
EMBASE (from 1980 to May 2010)
CINAHL (from 1982 to May 2010)
Science citation index (from 1945 to May 2010)
Social science citation index (from 1956 to May 2010)
BIOSIS (from 1969 to May 2010)
PEDRO (from 1929 to May 2010)
Amed (from 1985 to May 2010)
AgeLine (from 1978 to May 2010)
PsycINFO (from 1806 to May 2010)
KoreaMed (from start (year unknown) to May 2010)
We placed no language restrictions on either the search or the included studies.
Searching other resources
The reference lists of review articles and included studies were handsearched for other potentially eligible studies. Conference proceeding's abstracts from nephrology scientific meetings were obtained from CENTRAL and the Renal Group's specialised register. These contain the handsearched results of conference proceedings from general and speciality meetings. This is an ongoing activity across the Cochrane Collaboration and is both retrospective and prospective. Please refer to The Cochrane Renal Group's Module in The Cochrane Library for the most up‐to‐date list of conference proceedings (Renal Group 2011). Conference proceeding's abstracts were also handsearched (American Society of Nephrology to May 2010, European Dialysis Transplant Association to May 2010, EDTNA‐ERCA to May 2010, International Society of Nephrology to May 2010, World Congress of Nephrology 2001 to May 2010). Authors of included studies who were contacted due to need of clarification of methods or results were also asked if they knew of any other relevant studies.
Data collection and analysis
Selection of studies
Two authors independently reviewed the titles, abstract sections and keywords of every record retrieved from the electronic search. If the information given in the title, abstract and or keywords suggested that the study might fit the inclusion criteria of the systematic review, the full article was retrieved for further assessment. From the full articles, the decision to eliminate a study was based on agreement by both authors. Studies that did not fulfil the selection criteria of the systematic review were eliminated. Once a study was excluded, a record of the article, including the reason for exclusion, was retained. Cohen's kappa statistic was to be used to measure inter‐rater assessment of the studies. This was, however, not necessary as the authors were unanimous in their initial choices of abstracts for further investigation.
Data extraction and management
Data from each study were independently extracted by both authors. Variations in data extraction were to be resolved by consensus, referring back to the original data. Data were extracted using a standard data extraction form, which included the following:
General information: published/unpublished, title, authors, source, contact address, country, setting, language, year of publication, duplicate publication, source of funding.
Study characteristics: design, randomisation (and method if stated), allocation concealment, blinding of outcome assessors.
Participants: if randomised, inclusion criteria, exclusion criteria, total number in intervention/control groups, sex, age, baseline characteristics, diagnostic criteria, similarity of groups at baseline. We also extracted data concerning the number of participants who refused or were excluded from entering the study as well as number of withdrawals/losses to end of intervention follow‐up. Further, we sought information on the reasons for discontinuation of all participants allocated to the intervention.
Intervention and comparator, duration of study.
All outcomes.
Results: for continuous variables, we extracted the number of participants, and the baseline and post‐intervention means with SD (or standard error of the mean (SEM) or 95% confidence interval (95% CI)) for the intervention and control groups. We transformed SEM or 95% CI into SD, if appropriate. For dichotomous variables, we extracted proportions.
Assessment of risk of bias in included studies
Both authors independently assessed each study for the risk of bias. If there was a disagreement in the assessment of a study, a third party was to adjudicate. Since there was no difference in the authors' assessment, a third party was never used and the level of inter‐rater agreement was therefore not calculated.
Bias was then assessed based on criteria specified below and with the component of allocation concealment added to the checklist (Jadad 1996; Moher 1998; Schulz 1995).
-
Minimisation of selection bias
Was the recruitment procedure completely described and adequate?
Was the randomisation procedure adequate?
Was the allocation concealment adequate?
-
Minimisation of detection bias:
Were the outcome assessors blind to the intervention?
Blinding of the individuals who administered the intervention
Were the participants in the study blinded?
-
Minimisation of attrition bias:
Were withdrawals and dropouts completely described?
Was compliance to the intervention described and adequate?
Was the analysis by intention‐to treat?
Each study was classified into one of the following three categories (Higgins 2005)
Low risk of bias: all quality criteria met (A).
Moderate risk of bias: one or more of the quality criteria only partially met (B).
High risk of bias: one or more quality criteria not met (C).
In this review assessments of bias were used to explain differences in results between studies and in sensitivity analyses.
In the present review and meta‐analysis, investigators have been sought for additional information when necessary. When we could not obtain additional information and data, this was reported as 'missing data' and 'not reported'.
Measures of treatment effect
All outcomes were analysed using both a fixed and a random‐effects model. If the fixed and random‐effects meta‐analyses gave similar results, the results from the fixed‐effect model were presented. If the results from the fixed and the random‐effects meta‐analyses differed, the results from the random‐effects model were presented. The choice between using a fixed or a random‐effects model was also affected by the presence of heterogeneity.
Dealing with missing data
Where possible, investigators of studies were contacted to obtain information or data required that could not be found in the published reports. Additional information was sought, when necessary, for all studies that appeared to meet the inclusion criteria. Studies with data only available in graph form were included in the review but excluded from the meta‐analysis rather than estimate the mean and SD from the graph. When post‐intervention measures of dispersion (SD, SEM or 95% CI) were not available (e.g. when post‐intervention information was expressed as percentage change from baseline values) the result was excluded from the meta‐analysis and noted as missing data. When an article contained missing data the primary investigator was contacted for clarification of results. If the investigators' present contact information was not found or the investigators were not able to provide the missing data, the result was excluded from the meta‐analysis and noted as missing data. Fourteen authors were contacted for clarification and/or to request raw data. See Characteristics of included studies.
Assessment of heterogeneity
Heterogeneity between studies was analysed using the Cochran Q test of N‐1 degrees of freedom (P of 0.10 used for statistical significance). The I² parameter was used to quantify any inconsistency (I² = [(Q ‐ df)/Q] x 100%, where Q is the Chi² statistic and df is its degrees of freedom, (Higgins 2002; Higgins 2003). When there was no heterogeneity (I² ≤ 50%, P > 0.10) the results from the fixed‐effect meta‐analyses were presented. If there was evidence of heterogeneity between included studies, a visual inspection of the CIs was used as a help to get an idea of the amount of statistical heterogeneity and to decide whether it would be reasonable to combine the results of these studies.
Assessment of reporting biases
If a sufficient number of studies were identified for the intervention, a funnel plot was used to assess publication bias (Higgins 2005).
Data synthesis
Data were summarised statistically, when it was sufficiently uniform and of sufficient quality. For dichotomous outcomes results were expressed as a risk ratios (RR) with 95% CI. Where continuous scales of measurement were used to assess the effects of the exercise training intervention, mean difference (MD) was used between the post‐intervention values of the intervention and control groups to analyse the size of the intervention effects, or standardised mean difference (SMD) if different scales had been used.
Subgroup analysis and investigation of heterogeneity
Where heterogeneity was found, the following was undertaken.
Data entry was checked.
Heterogeneity was explored by conducting subgroup analyses.
If the heterogeneity could not be explained and there was a small but significant heterogeneity (I² < 50%, P< 0.10), the random‐effects model was used as this model is the most conservative option.
If the studies had collect continuous outcome data using different scales or different units, the effect measure was changed to SMD as extreme heterogeneity may be apparent when using the MD but not when the more appropriate SMD was used.
No meta‐analysis was conducted if a considerable variation (I² > 50%) in results still remained, and if there was inconsistency in the direction of effect.
The different subgroups were type of physical exercise training, duration, frequency and intensity of physical exercise training. We also performed length of intervention subgroup analyses for outcome measures, when there were sufficient data (three months or less, four to six months, six to 12 months or longer). Other subgroup analyses planned (but with insufficient data to pursue) were: sex (male or female); exercise frequency (less than three times/week, more than three times/week); and post‐intervention follow‐up timing (less than six months, six to 12 months, more than 12 months). We did not run subgroup analysis for age, gender and type of patients (CKD stages 1‐5, HD, continuous ambulatory PD (CAPD), kidney transplant), respectively.
Sensitivity analysis
We explored the influence of potential biases, as specified above, on effect size by repeating the analysis. In this review the sensitivity analysis was conducted on studies classified as A or B (low or moderate bias) versus A, B and C (low, moderate or high bias), and which had data in a form that could be included in this analysis.
Results
Description of studies
Results of the search
From the initial search of the databases all abstracts were screened to identify potentially relevant studies. During the initial screening reports were excluded on basis of the information presented in the abstracts, because they were not relevant to the question under study (i.e. it was clear that the study did not have an exercise intervention, that it was not a RCT). In many cases it was not possible to decide whether to include or exclude a study based on the information in the abstract or because there was no abstract presented in the database. In those cases, full papers were retrieved and screened. A total of 2576 reports were screened and 487 potential reports of studies were identified. We excluded 365 reports as they were not relevant to the question under study. From the reports selected for closer examination, 45 studies (61 reports) finally qualified for inclusion in the review.
See Figure 1 for flow diagram showing study selection.
1.
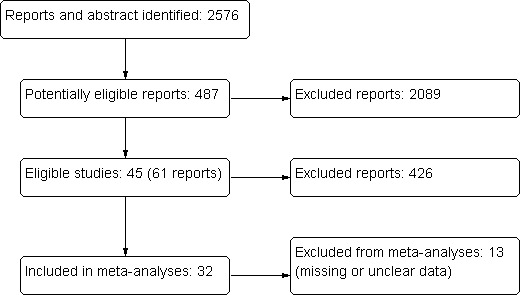
Flow diagram showing study identification and selection
Included studies
Forty‐five studies, randomising 1863 participants, were identified and retained for this review. Details of the characteristics of the included studies are given in the Table: 'Characteristics of included studies' and in Appendix 2. The following gives a brief overview.
Twenty‐three studies were single centre studies, seven were multi‐centre studies, and 15 did not provide this information.
All used a parallel group RCT design.
Inclusion criteria were moderate kidney failure, dialysis treatment or kidney transplantation. The most common was HD treatment.
Exclusion criteria were mainly severe cardiovascular disease and orthopaedic, psychiatric or neurological disorder that would preclude outcome assessment and/or exercise training.
Number of participants randomised in each study varied from 11 (Frey 1999; Parsons 2004) to 167 (Painter 2002a).
Studies were from Australia (Koh 2010a; Koh 2010b; PEAK Study 2005; Toussaint 2008), Canada (DePaul 2002; Parsons 2004), Denmark (Eidemak 1997; Molsted 2004), Germany (Dimeo 2007), Greece (Deligiannis 1999; Deligiannis‐HI 1999; Deligiannis‐LI 1999; Konstantinidou‐D 2002; Konstantinidou‐ND 2002; Konstantinidou‐US 2002; Kouidi 1997a; Kouidi 2002a; Kouidi 2002b; Kouidi 2003a; Kouidi 2004a; Ouzouni 2009), Japan (Akiba 1995; Matsumoto 2007), Korea (Jong 2004; Lee 2001), Netherlands (van Vilsteren 2005), Spain (Segura‐Orti 2009), Turkey (Yurtkuran 2007), UK (Koufaki 2002a; Koufaki 2003), USA (Carmack 1995; Carney 1987; Castaneda 2001; Chen 2010; Chatoth 2005; Fitts 1995; Fitts 1999; Frey 1999; Goldberg 1983; Harter 1985; Leehey 2009; Painter 2002a; Painter 2002b; Painter 2003), and finally a USA and Greece collaboration (Kouidi 2009).
Participants
The number of participants/study ranged from 11 (Frey 1999) to 167 (Painter 2002a).
Mean age of participants varied from 36 ± 3 years (Harter 1985) to 71 ± 13 years (Chen 2010).
There were a higher proportion of male participants in the studies, which reflects the higher male prevalence of CKD.
The level of kidney insufficiency as assessed by CKD stage was moderate or severe (Castaneda 2001; Eidemak 1997; Leehey 2009), but in most studies the participants had CKD Stage 5 and were treated with regular dialysis. Three studies studied the effect of regular exercise training in adults with a kidney transplant (Dimeo 2007; Kouidi 2002a; Painter 2003).
Results from the present review are generalizable to patients with CKD (all stages) and kidney transplant recipients who do not have unstable hypertension, congestive heart failure (NYHA ≥ II), cardiac arrhythmias (III according to Lown), recent myocardial infarction or unstable angina, and who have a physical or mental impairment that precluded undergoing submaximal/maximal exercise tolerance tests and participating in an exercise programme.
Interventions
Types of exercise
The studies in this systematic review included all types of regular exercise training interventions. The most common exercise training intervention was cardiovascular exercise training (Akiba 1995; Carmack 1995; Deligiannis 1999; Deligiannis‐LI 1999; Eidemak 1997; Frey 1999; Goldberg 1983; Jong 2004; Koh 2010a; Koh 2010b; Konstantinidou‐US 2002; Koufaki 2002a; Kouidi 1997a; Leehey 2009; Painter 2002a; Painter 2002b; Painter 2003; Parsons 2004; Toussaint 2008; Tsuyuki 2003; i.e. aerobic exercise training), followed by mixed cardiovascular and resistance training (Deligiannis 1999; Deligiannis‐HI 1999; Deligiannis‐LI 1999; DePaul 2002; Fitts 1995; Konstantinidou‐D 2002; Konstantinidou‐ND 2002; Kopple 2007a; Kouidi 2009; Ouzouni 2009; van Vilsteren 2005), resistance training (Castaneda 2001; Chen 2010; Johansen 2006; Kopple 2007a; PEAK Study 2005; Segura‐Orti 2009), and yoga (Yurtkuran 2007).
Some studies used supervised exercise interventions (Akiba 1995; Castaneda 2001; Chen 2010; Deligiannis 1999; Deligiannis‐HI 1999; DePaul 2002; Eidemak 1997; Frey 1999; Goldberg 1983; Johansen 2006; Koh 2010a; Konstantinidou‐D 2002; Konstantinidou‐ND 2002; Koufaki 2002a; Kouidi 1997a; Kouidi 2009; Leehey 2009; Ouzouni 2009; Painter 2002b; Painter 2003Parsons 2004; PEAK Study 2005; Segura‐Orti 2009; Tsuyuki 2003; van Vilsteren 2005; Yurtkuran 2007) and others used unsupervised exercise training interventions (Carmack 1995; Deligiannis‐LI 1999; Eidemak 1997; Fitts 1995; Jong 2004; Koh 2010b; Konstantinidou‐US 2002; Leehey 2009Painter 2002a; Painter 2003; Toussaint 2008).
Intensity of exercise intervention
Only a few studies did not report the intensity of the exercise training intervention studies and one study used a mixed low and high intensity exercise intervention (Leehey 2009). Most studies used a high intensity exercise intervention (Akiba 1995; Castaneda 2001; Chen 2010; Deligiannis 1999; Deligiannis‐HI 1999; DePaul 2002; Eidemak 1997; Fitts 1995; Frey 1999; Goldberg 1983; Johansen 2006; Jong 2004; Koh 2010a; Koh 2010b; Konstantinidou‐D 2002; Konstantinidou‐ND 2002; Koufaki 2002a; Kouidi 1997a; Kouidi 2009; Ouzouni 2009; Painter 2002a; Painter 2003; PEAK Study 2005; Segura‐Orti 2009; van Vilsteren 2005), and a few studies used a low intensity exercise training intervention (Deligiannis‐LI 1999; Konstantinidou‐US 2002; Parsons 2004; Tsuyuki 2003; van Vilsteren 2005). Percentage of the maximal oxygen uptake, peak oxygen uptake, maximum heart rate or the Borg RPE‐scale were scales used to define the percentage effort required in the interventions.
Frequency
The highest frequency of exercise training was seven times/week (Eidemak 1997) and the lowest frequency was twice/week (Molsted 2004). Most studies did however use three or five times/week as frequency of exercise training intervention. Some studies did not report frequency of the exercise training intervention.
Duration/exercise session (minutes)
The duration of individual exercise sessions varied from 20 minutes/session (Akiba 1995; Matsumoto 2007) to 110 minutes/session (Deligiannis 1999), and was not reported in some studies. Less than 30 minutes duration/exercise session was reported in five studies (Akiba 1995; Carmack 1995; Koufaki 2002a; Matsumoto 2007; van Vilsteren 2005); 30 to 60 min/sessions in 21 studies (Carney 1987; Castaneda 2001; Deligiannis‐LI 1999; DePaul 2002; Eidemak 1997; Fitts 1995; Fitts 1999; Frey 1999; Koh 2010a; Koh 2010b; Konstantinidou‐US 2002; Koufaki 2003; Lee 2001; Leehey 2009; Ouzouni 2009; Toussaint 2008; Painter 2002b; Painter 2003; Parsons 2004; PEAK Study 2005; Tsuyuki 2003; Yurtkuran 2007), and ≥ 60 min/sessions in eight studies (Deligiannis 1999; Deligiannis‐HI 1999; Goldberg 1983; Harter 1985; Konstantinidou‐D 2002; Konstantinidou‐ND 2002; Kouidi 1997a; Kouidi 2009; Molsted 2004). The remaining studies did not report duration of exercise/session.
Duration of exercise intervention (months)
Exercise interventions ranged from two months (Frey 1999) to 18 months duration (Chatoth 2005; Eidemak 1997). Duration of the intervention was three months in 17 studies), four to six months in 14 studies, and seven to 12 months in 14 studies.
Exercise supervision
Supervised exercise was carried out in 26 studies. Fifteen studies used exercise interventions supervised by a physiotherapist or an exercise physiologist (Akiba 1995; Kouidi 1997a; Deligiannis 1999; Deligiannis‐HI 1999; DePaul 2002; Goldberg 1983; Konstantinidou‐D 2002; Konstantinidou‐ND 2002; Koufaki 2002a; Kouidi 2009; Ouzouni 2009, Painter 2002b; Parsons 2004; Segura‐Orti 2009; Tsuyuki 2003; van Vilsteren 2005).
Outcomes
The reporting of outcome measures was variable. Different methods had often been used when measuring the same outcome, e.g. aerobic capacity (measured as VO2 peak, VO2 max, maximal exercise duration, maximal METs) and muscular strength (peak torque, one repetition maximum, five repetition maximum). The most common outcome measure when assessing the effect of regular physical exercise training on physical functioning was aerobic capacity.
Excluded studies
Excluded studies and the reasons for excluding them are given in Characteristics of excluded studies.
Risk of bias in included studies
The risk of bias assessments of the included studies are summarised in Figure 2 and Figure 3. When assessing total risk of bias of the included studies eight were classified as A (DePaul 2002; Johansen 2006; Koh 2010a; Molsted 2004; Painter 2002a; PEAK Study 2005; Segura‐Orti 2009; Yurtkuran 2007), 15 as B (Carmack 1995; Carney 1987; Castaneda 2001; Konstantinidou‐D 2002; Koufaki 2002a; Kouidi 1997a; Kouidi 2009; Leehey 2009; Matsumoto 2007; Ouzouni 2009; Painter 2002b; Painter 2003; Parsons 2004; Toussaint 2008; van Vilsteren 2005); and 22 as C (Akiba 1995; Chen 2010; Chatoth 2005; Deligiannis 1999; Deligiannis‐HI 1999; Dimeo 2007; Eidemak 1997; Fitts 1995; Fitts 1999; Frey 1999; Goldberg 1983; Harter 1985; Jong 2004; Kopple 2007a; Koufaki 2003; Kouidi 2002a; Kouidi 2002b; Kouidi 2003a; Kouidi 2004a; Kouidi 2005; Lee 2001; Tsuyuki 2003).
2.
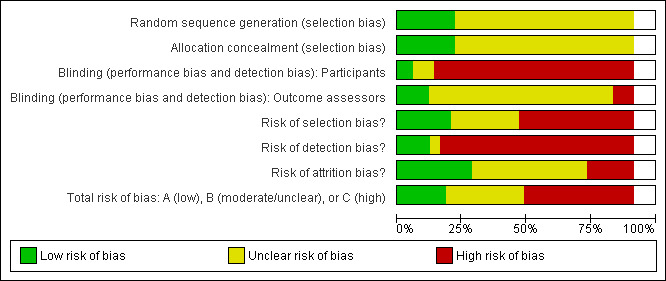
Methodological quality graph: review authors' judgements about each methodological quality item presented as percentages across all included studies.
3.
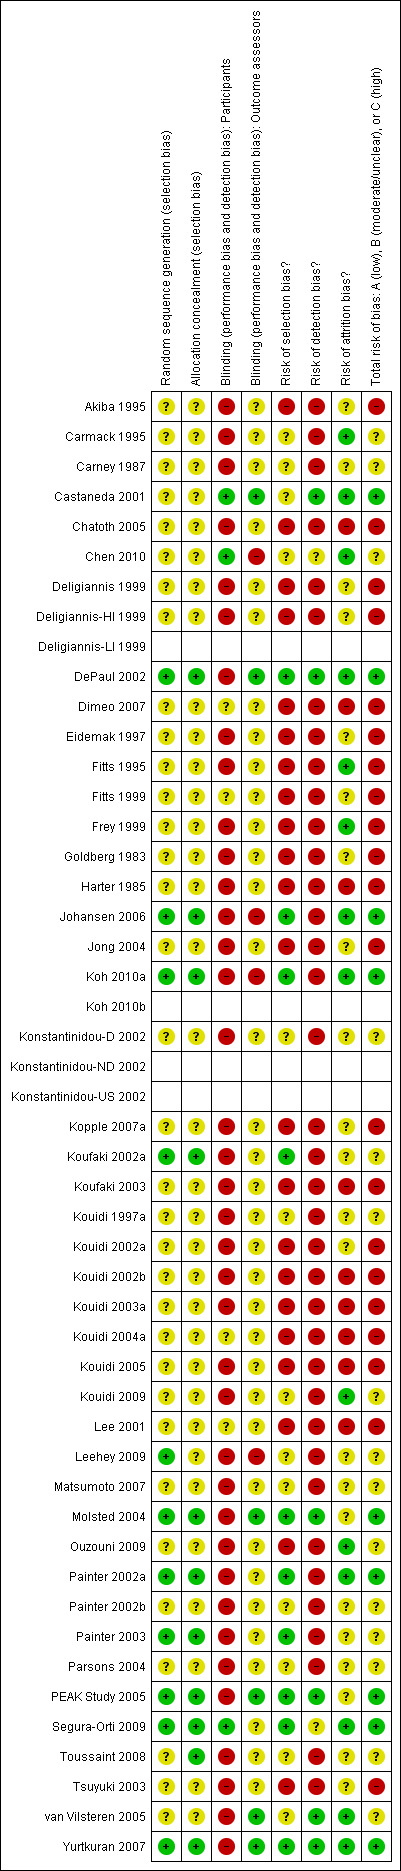
Methodological quality summary: review authors' judgements about each methodological quality item for each included study.
Allocation
Eligible/considered for inclusion
Seventeen of the studies included in the review described number of patients eligible/considered for inclusion (Carmack 1995; Carney 1987; Castaneda 2001; Chen 2010; DePaul 2002; Frey 1999; Johansen 2006; Koh 2010a; Konstantinidou‐D 2002; Kouidi 2009; Leehey 2009; Molsted 2004; Painter 2002a; Segura‐Orti 2009; PEAK Study 2005; van Vilsteren 2005; Yurtkuran 2007). The proportion between 'eligible/considered for inclusion' and 'enrolled/randomised' were: < 10% (Castaneda 2001); 11% to 20% (Chen 2010); 21% to 30% (Johansen 2006; Yurtkuran 2007); 31% to 40% (DePaul 2002; Molsted 2004); 41% to 50% (Konstantinidou‐D 2002; Segura‐Orti 2009); 51% to 60% (none); 61% to 70% (Koh 2010a; Leehey 2009; Painter 2002a; PEAK Study 2005); 71% to 80% (van Vilsteren 2005); 81% to 90% (none); and 91% to 100% (Carmack 1995; Carney 1987; Frey 1999).
Method of recruitment
Twenty one studies described where the recruitment had occurred (Carmack 1995; Carney 1987; Castaneda 2001; Chen 2010; DePaul 2002; Johansen 2006; Koh 2010a; Konstantinidou‐D 2002; Kouidi 1997a; Kouidi 2009; Leehey 2009; Matsumoto 2007; Molsted 2004; Painter 2002a; Painter 2002b; Painter 2003; Parsons 2004; Segura‐Orti 2009; PEAK Study 2005; Toussaint 2008; Yurtkuran 2007), but very few of the included studies described how the recruitment had been performed.
Method of randomisation
All of the included studies were described as randomised, but only 10 studies reported the method of randomisation (DePaul 2002; Johansen 2006; Koh 2010a; Kouidi 2009; Leehey 2009; Koufaki 2002a; Painter 2002a; Painter 2003; Segura‐Orti 2009; Yurtkuran 2007). Randomisation was done using the following methods.
Randomisation table and randomising in blocks (DePaul 2002; Johansen 2006; Leehey 2009; Segura‐Orti 2009).
Flip of a coin (Koufaki 2002a).
Restricted randomisation method (Painter 2002a; Painter 2003).
Computer‐generated randomisation (Koh 2010a; PEAK Study 2005; Yurtkuran 2007).
All but one study (Chatoth 2005) reported number of patients enrolled/randomised.
Allocation concealment
Only 11/45 studies had used adequate allocation concealment (Chen 2010; DePaul 2002; Johansen 2006; Koh 2010a; Koufaki 2002a; Molsted 2004; Painter 2002a; Painter 2003; Segura‐Orti 2009; PEAK Study 2005; Yurtkuran 2007); 34 studies had unclear allocation concealment, and none of the included studies had inadequate allocation concealment.
When assessing total risk of selection bias in the included studies, 10 were classified as A (DePaul 2002; Johansen 2006; Koh 2010a; Koufaki 2002a; Molsted 2004; Painter 2002a; Painter 2003; PEAK Study 2005; Segura‐Orti 2009; Yurtkuran 2007), 13 as B (Carmack 1995; Carney 1987; Castaneda 2001; Chen 2010; Konstantinidou‐D 2002; Kouidi 1997a; Kouidi 2009; Leehey 2009; Matsumoto 2007; Painter 2002b; Parsons 2004; Toussaint 2008; van Vilsteren 2005); and the remaining 22 as C.
Blinding
When assessing total risk of detection bias, five were classified as A (Castaneda 2001; DePaul 2002; Molsted 2004; PEAK Study 2005; van Vilsteren 2005; Yurtkuran 2007), two as B (Chen 2010; Segura‐Orti 2009), and the remaining were classified as C.
Masked outcome assessment
Six out of 45 studies had used masked outcome assessments (Castaneda 2001; DePaul 2002; Molsted 2004; PEAK Study 2005; van Vilsteren 2005; Yurtkuran 2007).
Blinding of participants
Three studies had blinded participants (Castaneda 2001; Chen 2010; Segura‐Orti 2009), in one study it was unclear (Yurtkuran 2007), and the rest of the studies the participants could not or were not blinded.
Blinding of administrators
None of the studies used blinded administrators.
Incomplete outcome data
Most studies accounted for all the randomised participants. Twenty‐four of the 45 studies had followed over 80% of the initially included patients (Carney 1987; Castaneda 2001; Chen 2010; Deligiannis 1999; Deligiannis‐HI 1999; Eidemak 1997; Fitts 1995; Jong 2004; Frey 1999; Johansen 2006; Jong 2004; Kouidi 1997a; Kouidi 2002a; Kouidi 2009; Konstantinidou‐D 2002; Leehey 2009; Ouzouni 2009; Painter 2003; Segura‐Orti 2009; PEAK Study 2005; Toussaint 2008; Tsuyuki 2003; van Vilsteren 2005; Yurtkuran 2007), 12 studies followed between 40% to 80% of the initially included patients (Akiba 1995; Carmack 1995; DePaul 2002; Fitts 1999; Goldberg 1983; Koh 2010a; Kopple 2007a; Koufaki 2002a; Matsumoto 2007; Molsted 2004; Painter 2002a; Painter 2002b; Parsons 2004), and nine studies did not report per cent followed (Dimeo 2007; Chatoth 2005; Harter 1985; Koufaki 2003; Kouidi 2002b; Kouidi 2003a; Kouidi 2004a; Kouidi 2005; Lee 2001).
Fifteen of 45 studies reported compliance to the intervention (Carmack 1995; Castaneda 2001; Chen 2010; DePaul 2002; Fitts 1995; Frey 1999; Koh 2010a; Kouidi 2009; Molsted 2004; Painter 2002a; PEAK Study 2005; Segura‐Orti 2009; Toussaint 2008; van Vilsteren 2005; Yurtkuran 2007).
When assessing total risk of attrition bias 16 studies were classified as A (Carmack 1995; Castaneda 2001; Chen 2010; DePaul 2002; Fitts 1995; Frey 1999; Johansen 2006; Koh 2010a; Kouidi 2009; Molsted 2004; Ouzouni 2009; Painter 2002a; PEAK Study 2005; Segura‐Orti 2009; van Vilsteren 2005; Yurtkuran 2007), 19 as B, and 10 as C.
Studies excluded from the meta‐analyses
After extracted methodological information and research data needed for the meta‐analysis, 12 reports had to be completely excluded from the meta‐analysis (Carney 1987; Chatoth 2005; Fitts 1999; Harter 1985; Koufaki 2003; Kouidi 2002a, Kouidi 2002b; Kouidi 2003a; Kouidi 2004a; Kouidi 2005; Matsumoto 2007; Molsted 2004). Reasons for not being included in the meta analysis were missing or unclear data concerning: 1) number of patients analysed, for each outcome measure, in the control and the exercise group, respectively; 2) mean and SD of the outcome measure/s for the exercise group and or the control group, respectively.
Thirty‐two studies were finally included in the meta‐analysis (Akiba 1995; Carmack 1995; Castaneda 2001; Chen 2010, Deligiannis 1999; Deligiannis‐HI 1999; Deligiannis‐LI 1999; DePaul 2002; Eidemak 1997; Fitts 1995; Frey 1999; Goldberg 1983; Johansen 2006;Jong 2004; Koh 2010a; Koh 2010b; Konstantinidou‐D 2002; Kopple 2007a; Koufaki 2002a; Kouidi 1997a; Kouidi 2009; Lee 2001; Leehey 2009; Ouzouni 2009; Painter 2002a; Painter 2002b; Painter 2003; Parsons 2004; PEAK Study 2005; Segura‐Orti 2009; Toussaint 2008; Tsuyuki 2003; van Vilsteren 2005; Yurtkuran 2007).
Eight studies had missing data for some of their reported outcomes (Dimeo 2007; Eidemak 1997; Goldberg 1983; Jong 2004; Kopple 2007a; Matsumoto 2007; Parsons 2004; Toussaint 2008) and were therefore excluded from those particular meta‐analyses.
Effects of interventions
Primary outcome measures
Physical fitness
Aerobic capacity
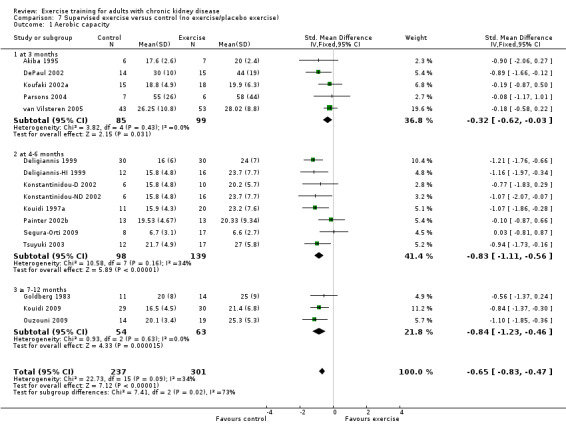
Physical exercise training (regardless of type of exercise, intensity, length of intervention, or with or without supervision) significantly increased aerobic capacity when compared to control (Analysis 1.1 (24 studies, 847 participants): SMD ‐0.56, 95% CI ‐0.70 to ‐0.42, P < 0.00001; I² = 12%, P = 0.19), subgrouped by time of assessment.
1.1. Analysis.
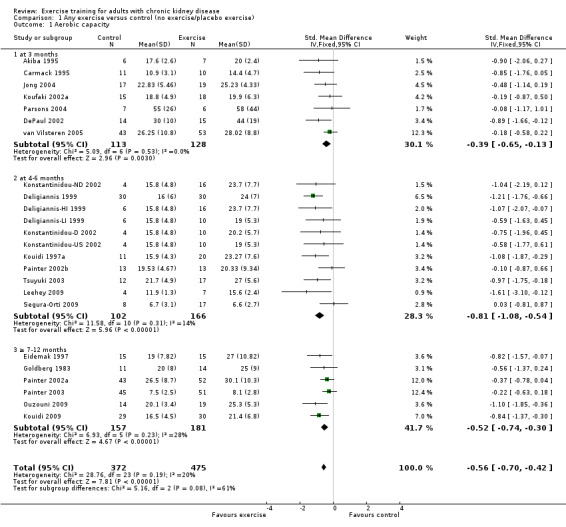
Comparison 1 Any exercise versus control (no exercise/placebo exercise), Outcome 1 Aerobic capacity.
Exercise Intensity
Both high and low intensity exercise training had a positive effect on aerobic capacity. High intensity exercise training improved aerobic capacity (Analysis 2.1 (17 studies, 647 participants): SMD ‐0.61, 95% CI ‐0.77 to ‐0.45, P < 0.00001; I² = 28%, P = 0.14) more than low intensity exercise training interventions (Analysis 3.1 (5 studies, 182 participants): SMD ‐0.39, 95% CI ‐0.69 to ‐0.09, P = 0.01; I² = 0%, P = 0.42). Based on subgroup analysis, the increase in aerobic capacity in high intensity exercise training studies (‐0.59) was more pronounced than the increase for all the studies combined (‐0.56).
2.1. Analysis.
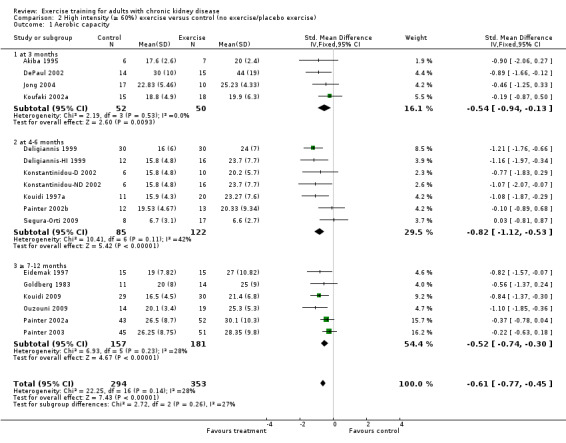
Comparison 2 High intensity (≥ 60%) exercise versus control (no exercise/placebo exercise), Outcome 1 Aerobic capacity.
3.1. Analysis.
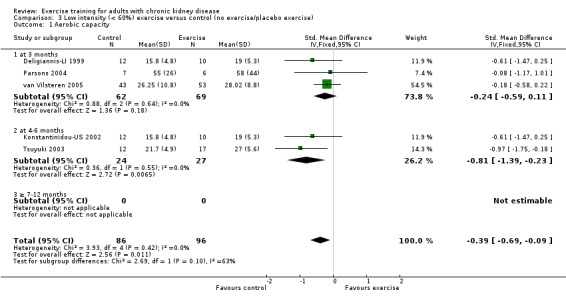
Comparison 3 Low intensity (< 60%) exercise versus control (no exercise/placebo exercise), Outcome 1 Aerobic capacity.
Length of time of the exercise
Aerobic capacity increased significantly following three months (Analysis 1.1.1 (7 studies, 241 participants): SMD ‐0.39, 95% CI ‐0.65 to ‐0.13, P = 0.003; I² = 0%, P = 0.53), four to six months (Analysis 1.1.2 (11 studies, 268 participants): SMD ‐0.81, 95% CI ‐1.08 to ‐0.54, P < 0.00001; I² = 14%, P = 0.31), and seven to 12 months of regular physical exercise training (Analysis 1.1.3 (6 studies, 338 participants): SMD ‐0.52, 95% CI ‐0.74 to ‐0.30, P < 0.00001; I² = 28%, P = 0.23). The results show that three to 7‐12 months regular exercise training has positive effect on aerobic capacity. Based on subgroup analysis, the increase in aerobic capacity in four to six months studies (‐0.81) was more pronounced than the increase for all the studies combined (‐0.56).
Type of exercise
Cardiovascular exercise training (Analysis 4.1 (16 studies, 503 participants): SMD ‐0.53, 95% CI ‐0.71 to ‐0.35, P < 0.00001; I² = 25%, P = 0.17) and mixed cardiovascular and resistance training significantly improved aerobic capacity (Analysis 5.1 (9 studies, 353 participants): SMD ‐0.77, 95% CI ‐1.06 to ‐0.48, P < 0.00001; I² = 33%, P = 0.16). Resistance training alone had no significant effect on aerobic capacity (Analysis 6.1). Based on subgroup analysis, the increase in aerobic capacity in mixed cardiovascular and resistance training studies (‐0.77) was more pronounced than the increase for all the studies combined (‐0.56).
4.1. Analysis.
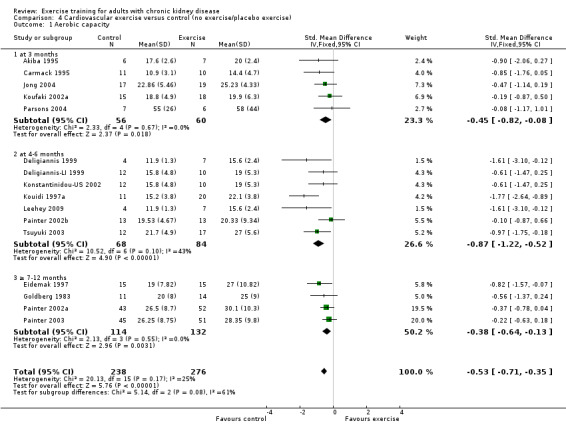
Comparison 4 Cardiovascular exercise versus control (no exercise/placebo exercise), Outcome 1 Aerobic capacity.
5.1. Analysis.
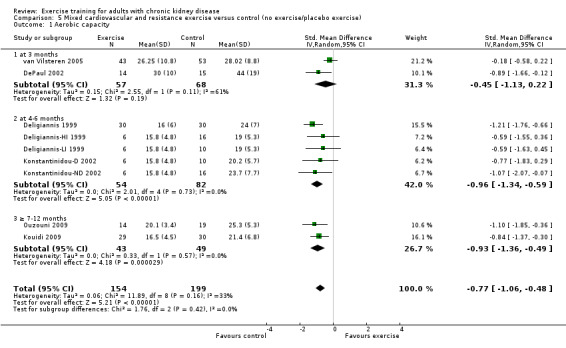
Comparison 5 Mixed cardiovascular and resistance exercise versus control (no exercise/placebo exercise), Outcome 1 Aerobic capacity.
6.1. Analysis.

Comparison 6 Resistance training versus control (no exercise/placebo exercise), Outcome 1 Aerobic capacity.
Exercise supervision
Supervised exercise interventions showed a statistically significant increase in aerobic capacity (Analysis 7.1 (15 studies, 538 participants): SMD ‐0.68, 95% CI ‐0.91 to ‐0.45, P < 0.00001; I² = 34%, P = 0.09). Unsupervised exercise also showed a positive effect on aerobic capacity (Analysis 8.1 (8 studies, 333 participants): SMD ‐0.48, 95% CI ‐0.70 to ‐0.26, P < 0.0001; I² = 0%, P = 0.46). Based on subgroup analysis, the increase in aerobic capacity in supervised exercise intervention studies (‐0.68) was more pronounced than the increase for all the studies combined (‐0.56).
7.1. Analysis.
Comparison 7 Supervised exercise versus control (no exercise/placebo exercise), Outcome 1 Aerobic capacity.
8.1. Analysis.
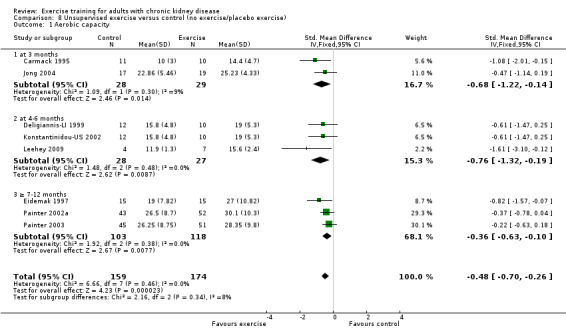
Comparison 8 Unsupervised exercise versus control (no exercise/placebo exercise), Outcome 1 Aerobic capacity.
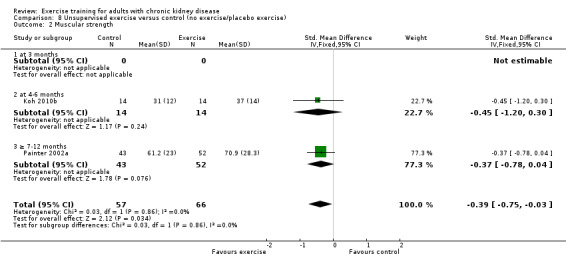
Muscular strength
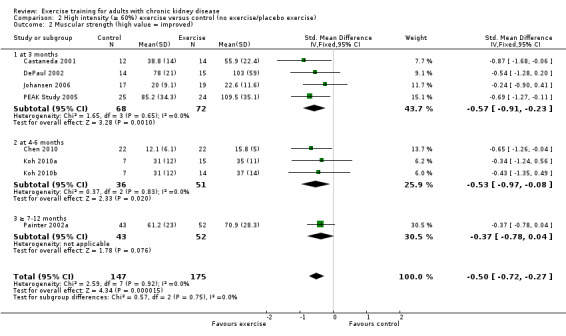
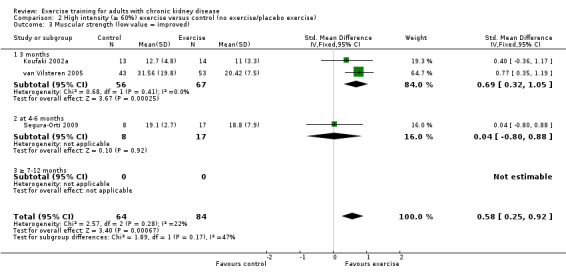
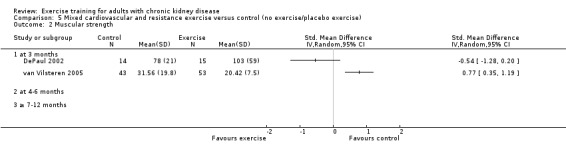
Ten of 11 studies reporting muscular strength used different measurement methods. In two studies the outcome measure showed increased muscular strength when the outcome had a lower value than at baseline (Koufaki 2002a; van Vilsteren 2005), while in the remaining nine studies an increased value indicated increased muscular strength. Data from these nine studies showed increased muscular strength with regular physical exercise training (regardless of type of exercise, intensity, length of intervention, with or without supervision, (Analysis 1.2 (9 studies, 358 participants): SMD ‐0.52, 95% CI ‐0.73 to ‐0.31, P < 0.00001; I² = 0%, P = 0.94). This was also seen in the two studies using methods where a reduced value was equal to improved muscular strength (Analysis 1.3 (2 studies, 148 participants): SMD 0.58, 95% CI 0.25 to 0.92, P = 0.0007; I² = 22%, P = 0.28).
1.2. Analysis.
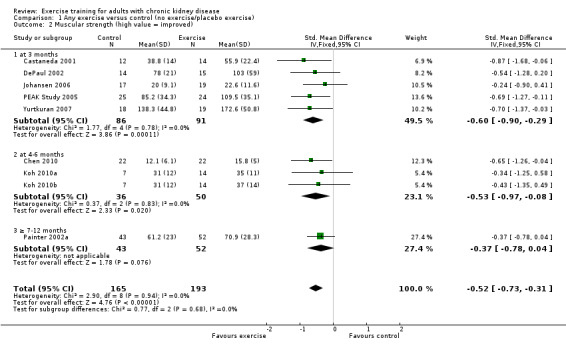
Comparison 1 Any exercise versus control (no exercise/placebo exercise), Outcome 2 Muscular strength (high value = improved).
1.3. Analysis.
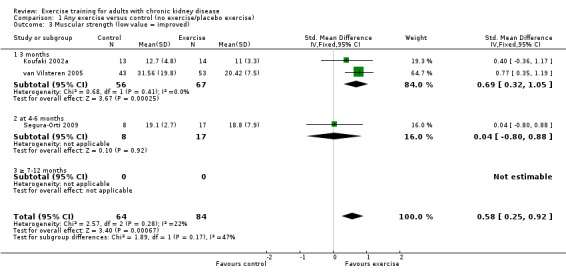
Comparison 1 Any exercise versus control (no exercise/placebo exercise), Outcome 3 Muscular strength (low value = improved).
Exercise intensity
High intensity exercise training showed an increase in muscular strength (Analysis 2.2 (8 studies, 322 participants): SMD ‐0.50, 95% CI ‐0.72 to ‐0.27, P = 0.0001; I² = 0%, P = 0.92); (Analysis 2.3 (3 studies, 148 participants): SMD 0.58, 95% CI 0.25 to 0.92, P = 0.0007; I² = 22%, P = 0.28).
2.2. Analysis.
Comparison 2 High intensity (≥ 60%) exercise versus control (no exercise/placebo exercise), Outcome 2 Muscular strength (high value = improved).
2.3. Analysis.
Comparison 2 High intensity (≥ 60%) exercise versus control (no exercise/placebo exercise), Outcome 3 Muscular strength (low value = improved).
Low intensity exercise training had a positive effect on muscular strength (Analysis 3.2 (1 study, 96 participants): SMD 0.77, 95% CI 0.35 to 1.19, P = 0.0003).
3.2. Analysis.
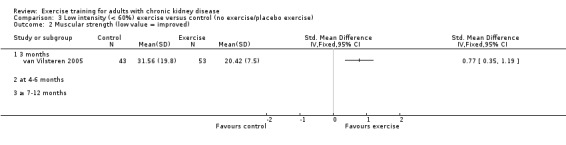
Comparison 3 Low intensity (< 60%) exercise versus control (no exercise/placebo exercise), Outcome 2 Muscular strength (low value = improved).
Length of time of the exercise intervention
Three months of regular exercise training significantly increased muscular strength (Analysis 1.2.1 (5 studies, 177 participants): SMD ‐0.60, 95% CI ‐1.90 to ‐0.29, P = 0.0001; I² = 0%, P = 0.78) and (Analysis 1.3.1 (2 studies, 123 participants): SMD 0.69, 95% CI 0.32 to 1.05, P = 0.0002; I² = 0%, P = 0.41).
Four to six months of regular exercise training significantly increased muscular strength in those studies reporting an increased value for increased muscular strength (Analysis 1.2.2 (3 studies, 86 participants): SMD ‐0.37, 95% CI ‐09.7 to ‐0.08, P = 0.02; I² = 0%, P = 0.83), but not in the study reporting a decreased value for increased muscular strength (Analysis 1.3.2 (1 study, 25 participants): SMD 0.04, 95% CI ‐0.80 to 0.88, P = 0.92).
Seven to 12 months of regular exercise showed no statistically significant difference in muscular strength between exercise and control group (Analysis 1.2 (1 study, 95 participants): SMD ‐0.37, 95% CI ‐0.78 to 0.04, P = 0.08).
Type of exercise
Cardiovascular exercise training (Analysis 4.2 (4 studies, 165 participants): SMD ‐0.23, 95% CI ‐0.57 to 0.12, P = 0.19; I² = 10%, P = 0.34) and mixed cardiovascular and resistance training (Analysis 5.2, DePaul 2002 (29 participants): SMD ‐0.54, 95% CI ‐1.28 to 0.20; van Vilsteren 2005 (96 participants): SMD 0.77, 95% CI 0.35 to 1.19) did not improve muscular strength.
4.2. Analysis.
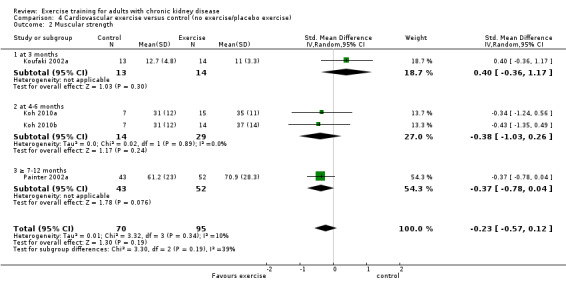
Comparison 4 Cardiovascular exercise versus control (no exercise/placebo exercise), Outcome 2 Muscular strength.
5.2. Analysis.
Comparison 5 Mixed cardiovascular and resistance exercise versus control (no exercise/placebo exercise), Outcome 2 Muscular strength.
Regular resistance training significantly increased muscular strength (Analysis 6.2 (4 studies, 153 participants): SMD ‐0.60, 95% CI ‐0.92 to ‐0.27, P = 0.0003; I² = 0%, P = 0.64).
6.2. Analysis.
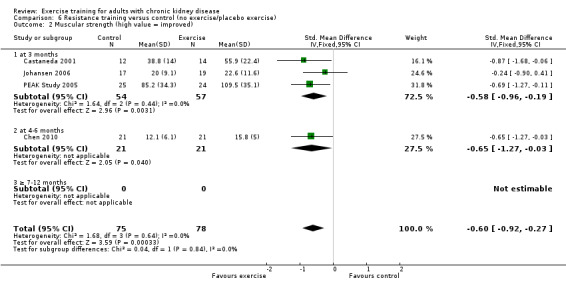
Comparison 6 Resistance training versus control (no exercise/placebo exercise), Outcome 2 Muscular strength (high value = improved).
Yoga significantly increased muscular strength (Analysis 9.1 (1 study 37 participants): SMD ‐0.70, 95% CI ‐1.37 to ‐0.03)
9.1. Analysis.
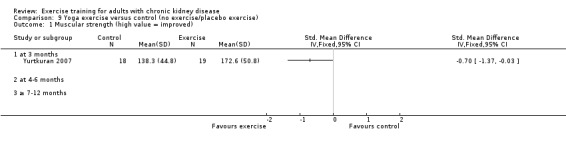
Comparison 9 Yoga exercise versus control (no exercise/placebo exercise), Outcome 1 Muscular strength (high value = improved).
Exercise intensity
Both supervised exercise training (Analysis 7.2 (7 studies, 248 participants): SMD ‐0.57, 95% CI ‐0.83 to ‐0.32, P < 0.0001; I² = 0%, P = 0.90); (Analysis 7.3 (3 studies, 148 participants): SMD 0.58, 95% CI 0.25 to 0.92, P = 0.0007; I² = 22%, P = 0.28) and unsupervised exercise training (Analysis 8.2 (2 studies, 123 participants): SMD ‐0.39, 95% CI ‐0.75 to ‐0.03; P = 0.03, I² = 0%, P = 0.86) showed a significant increase in muscular strength compared to no exercise or control.
7.2. Analysis.
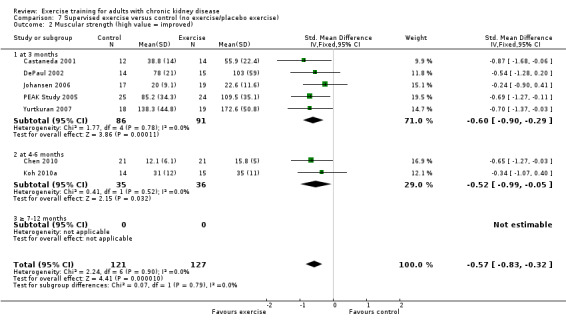
Comparison 7 Supervised exercise versus control (no exercise/placebo exercise), Outcome 2 Muscular strength (high value = improved).
7.3. Analysis.

Comparison 7 Supervised exercise versus control (no exercise/placebo exercise), Outcome 3 Muscular strength (low value = improved).
8.2. Analysis.
Comparison 8 Unsupervised exercise versus control (no exercise/placebo exercise), Outcome 2 Muscular strength.
Muscular endurance ('Sit‐to‐Stand‐to‐Sit‐60' method)
Neither three months of high intensity (≥ 60%), supervised, cardiovascular exercise training (Analysis 1.4.1 (1 study, 27 participants): MD ‐2.80 sec, 95% CI ‐7.89 to 2.29, P = 0.28) nor six months supervised, high intensity, resistance training (Analysis 1.4.2 (1 study, 25 participants): MD ‐5.70 sec, 95% CI ‐7.93 to 2.28, P = 0.16) improved muscular endurance.
1.4. Analysis.
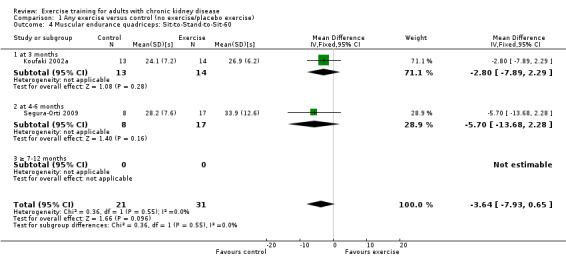
Comparison 1 Any exercise versus control (no exercise/placebo exercise), Outcome 4 Muscular endurance quadriceps: Sit‐to‐Stand‐to‐Sit‐60.
Physical functioning
Walking capacity
Seven studies reported walking capacity, all used different methods of measurement. Walking capacity was significantly increased following regular exercise training (Analysis 1.5 (7 studies, 191 participants): SMD ‐0.48, 95% CI ‐0.79 to ‐0.17; P = 0.003; I² = 2%, P = 0.41).
1.5. Analysis.
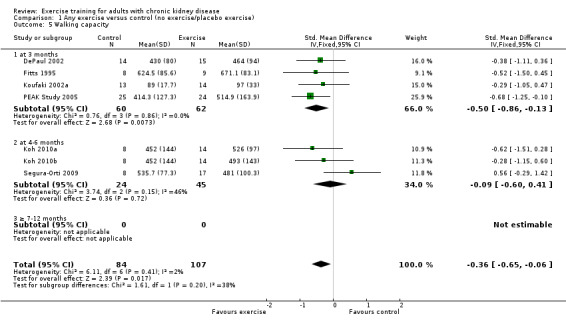
Comparison 1 Any exercise versus control (no exercise/placebo exercise), Outcome 5 Walking capacity.
Type of exercise
Only studies using a high intensity (≥ 60%) exercise training intervention reported walking capacity, and it was therefore not possible to compare high versus low intensity exercise training.
Length of time of the exercise intervention
Three months exercise showed a significant increase in walking capacity (Analysis 1.5.1 (4 studies 122 participants): SMD ‐0.50, 95% CI ‐0.86 to 0.13, P = 0.007; I² = 0%, P = 0.86) however there was no significant increase with four to six months of regular exercise (Analysis 1.5.2 (3 studies, 69 participants): SMD ‐0.09, 95% CI ‐0.60 to 0.41, P = 0.72; I² = 46%, P = 0.15).
Type of exercise
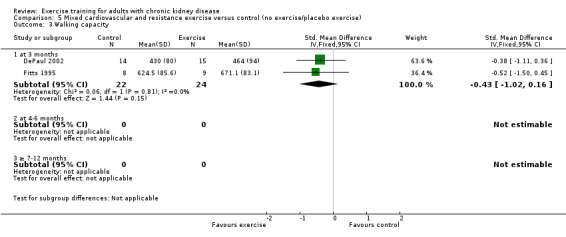
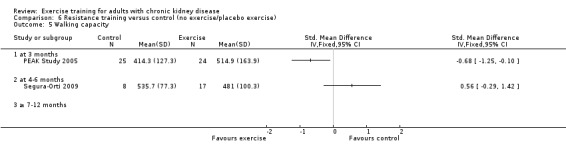
Neither cardiovascular exercise (Analysis 4.4 (3 studies, 71 participants): SMD ‐0.38, 95% CI ‐0.86 to 0.10, P = 0.12; I² = 0%, P = 0.83) nor mixed cardiovascular and resistance training (Analysis 5.3 (2 studies, 46 participants): SMD ‐0.43, 95% CI ‐1.02 to 0.16, P = 0.15; I² = 0%, P = 0.81) improved walking capacity. Three months resistance exercise training used by PEAK Study 2005 improved walking capacity significantly (Analysis 6.5.1 (1 study, 49 participants): SMD ‐0.68, 95% CI ‐1.25 to ‐0.10, P = 0.02), however the four to six months resistance training used by Segura‐Orti 2009 did not improve walking capacity (Analysis 6.5.2 (1 study, 25 participants): SMD 0.56, 95% CI ‐0.29 to 1.42, P = 0.20).
4.4. Analysis.
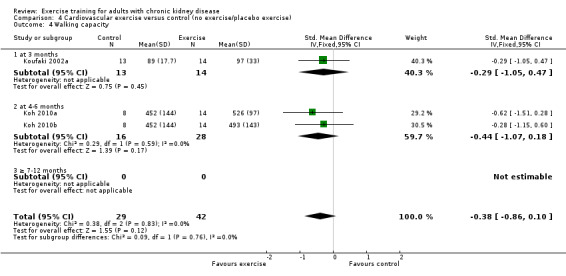
Comparison 4 Cardiovascular exercise versus control (no exercise/placebo exercise), Outcome 4 Walking capacity.
5.3. Analysis.
Comparison 5 Mixed cardiovascular and resistance exercise versus control (no exercise/placebo exercise), Outcome 3 Walking capacity.
6.5. Analysis.
Comparison 6 Resistance training versus control (no exercise/placebo exercise), Outcome 5 Walking capacity.
Exercise supervision
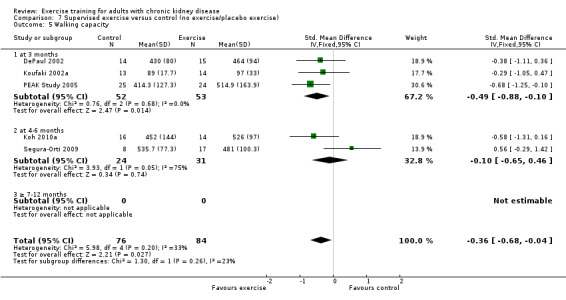
There was a significant improvement in walking capacity with supervised exercise training (Analysis 7.5 (5 studies, 160 participants): SMD ‐0.26, 95% CI ‐0.68 to ‐0.04, P = 0.03; (P = 0.20); I² = 33%, P = 0.20). The heterogeneity was as a result of Segura‐Orti 2009. When it was removed from the analysis the result remains significant, however the I² was zero (SMD ‐0.51, 95% CI ‐0.85 to ‐0.17, P = 0.04; I² = 0%, P = 0.85).
7.5. Analysis.
Comparison 7 Supervised exercise versus control (no exercise/placebo exercise), Outcome 5 Walking capacity.
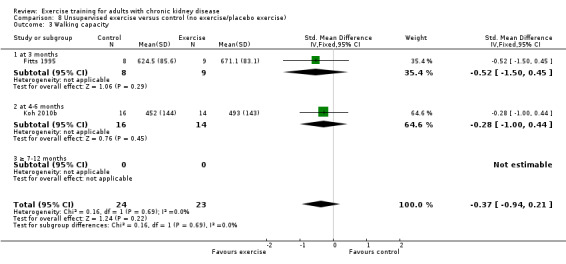
There was no significant difference in walking capacity when unsupervised exercise training was compared to control (Analysis 8.3 (2 studies, 47 participants): SMD ‐0.37, 95% CI ‐0.94 to 0.21, P = 0.22; I² = 0%, P = 0.69).
8.3. Analysis.
Comparison 8 Unsupervised exercise versus control (no exercise/placebo exercise), Outcome 3 Walking capacity.
Stair climbing capacity
One study (Koufaki 2002a), using three months of supervised, high intensity, cardiovascular exercise training showed no change in stair climbing capacity (Analysis 1.6 (1 study, 27 participants): MD ‐1.50 sec, 95% CI ‐5.67 to 2.67, P = 0.48).
1.6. Analysis.
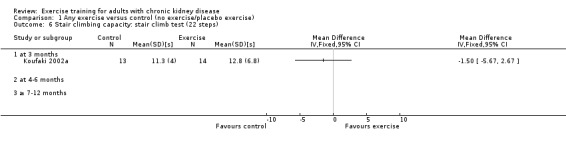
Comparison 1 Any exercise versus control (no exercise/placebo exercise), Outcome 6 Stair climbing capacity: stair climb test (22 steps).
Activities of daily living (ADL) capacity
There was no significant effect of four to six months supervised or unsupervised, high or low intensity, resistance or cardiovascular exercise training on ADL (Analysis 1.7 (3 studies, 87 participants): SMD 0.05, 95% CI ‐0.39 to 0.48, P = 0.83; I² = 0%. P = 0.44).
1.7. Analysis.
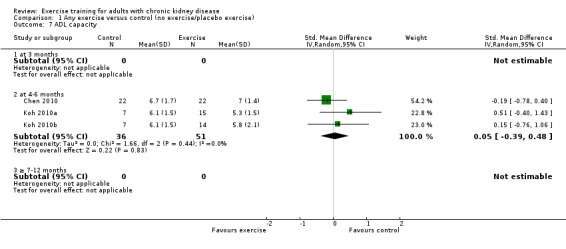
Comparison 1 Any exercise versus control (no exercise/placebo exercise), Outcome 7 ADL capacity.
Cardiovascular dimensions
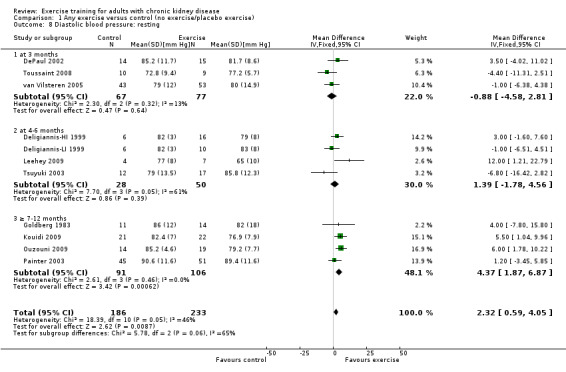
Resting diastolic blood pressure
Physical exercise training (regardless of type, intensity, length of intervention, or supervision) decreased resting diastolic blood pressure when compared to control (Analysis 1.8 (11 studies, 419 participants): MD 2.32 mm Hg, 95% CI 0.59 to 4.05, P = 0.009; I² = 46%, P = 0.05).
1.8. Analysis.
Comparison 1 Any exercise versus control (no exercise/placebo exercise), Outcome 8 Diastolic blood pressure: resting.
Exercise intensity
High intensity exercise training showed a significant decrease in resting diastolic blood pressure (Analysis 2.8 (6 studies, 254 participants): MD 3.98 mm Hg, 95% CI 1.90 to 6.05, P = 0.0002; I² = 0%, P = 0.71). There was no significant change in resting diastolic blood pressure with low intensity exercise training (Analysis 3.4 (3 studies, 147 participants): MD ‐1.77 mm Hg, 95% CI ‐5.26 to 1.73, P = 0.32; I² = 0%, P = 0.55).
2.8. Analysis.
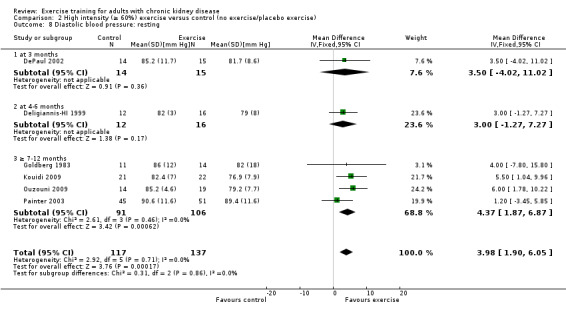
Comparison 2 High intensity (≥ 60%) exercise versus control (no exercise/placebo exercise), Outcome 8 Diastolic blood pressure: resting.
3.4. Analysis.
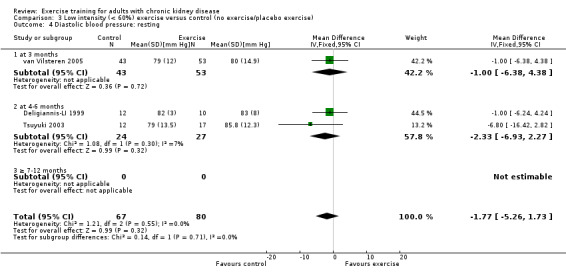
Comparison 3 Low intensity (< 60%) exercise versus control (no exercise/placebo exercise), Outcome 4 Diastolic blood pressure: resting.
Length of time of the exercise intervention
Exercise training intervention for three months did not decrease resting diastolic blood pressure (Analysis 1.8.1 (3 studies, 144 participants): MD ‐0.88 mm Hg, 95% CI ‐4.58 to 2.81, P = 0.64; I² = 13%, P = 0.32).
Four to six months exercise training intervention did not decrease resting diastolic blood pressure (Analysis 1.8.2 (4 studies, 78 participants): MD 1.39 mm Hg, 95% CI ‐1.78 to 4.56, P = 0.39; I² = 61%, P = 0.05). The heterogeneity was as a result of Leehey 2009 which was the only study that showed a significant decrease in resting diastolic blood pressure. When it was removed from the analysis the result was still not significant and the I² decreased to 45% (MD 0.39 mm Hg, 95% CI ‐2.78 to 3.70, P = 0.82; I² = 45%, P = 0.16).
Seven to 12 months of exercise showed a significant decrease in resting diastolic blood pressure (Analysis 1.8.3 (4 studies, 197 participants): MD 4.37 mm Hg, 95% CI 1.87 to 6.87, P = 0.0006; I² = 0%, P = 0.46).
Type of exercise
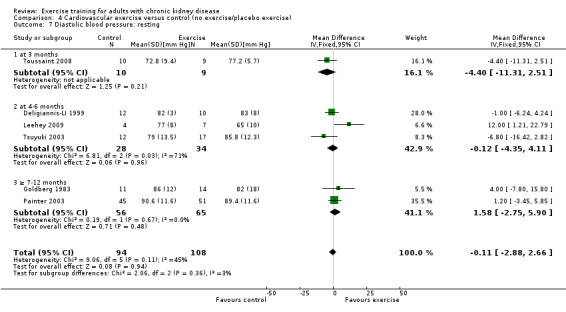
Cardiovascular exercise training did not decrease resting diastolic blood pressure (Analysis 4.7 (6 studies, 202 participants): MD ‐0.11 mm Hg, 95% CI ‐2.88 to 2.66, P = 0.96; I² = 45%, P = 0.11).
4.7. Analysis.
Comparison 4 Cardiovascular exercise versus control (no exercise/placebo exercise), Outcome 7 Diastolic blood pressure: resting.
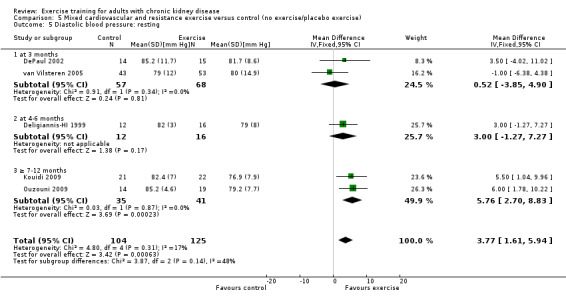
Mixed cardiovascular and resistance training significantly decreased resting diastolic blood pressure (Analysis 5.5 (5 studies, 229 participants): MD 3.77 mm Hg, 95% CI 1.61 to 5.94, P = 0.0006; I² = 17%, P = 0.14).
5.5. Analysis.
Comparison 5 Mixed cardiovascular and resistance exercise versus control (no exercise/placebo exercise), Outcome 5 Diastolic blood pressure: resting.
This outcome was not reported in studies using resistance training.
Exercise supervision
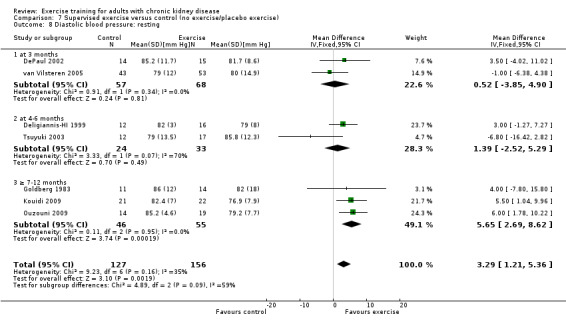
Supervised exercise training significantly decreased resting diastolic blood pressure (Analysis 7.8 (7 studies, 282 participants): MD 2.93 mm Hg, 95% CI 0.20 to 5.66, P = 0.04; I² = 35%, P = 0.16).
7.8. Analysis.
Comparison 7 Supervised exercise versus control (no exercise/placebo exercise), Outcome 8 Diastolic blood pressure: resting.
Unsupervised exercise training intervention showed no effect on resting diastolic blood pressure (Analysis 8.5 (4 studies, 148 participants): MD 0.27 mm Hg, 95% CI ‐2.72 to 3.26, P = 0.86; I² = 55%, P = 0.08).
8.5. Analysis.
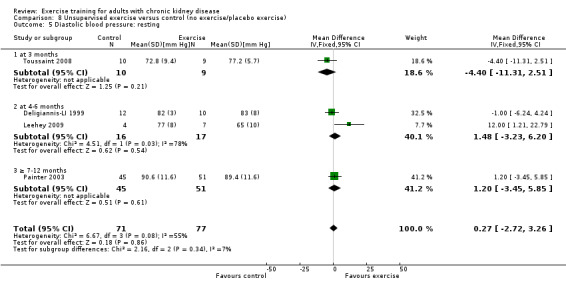
Comparison 8 Unsupervised exercise versus control (no exercise/placebo exercise), Outcome 5 Diastolic blood pressure: resting.
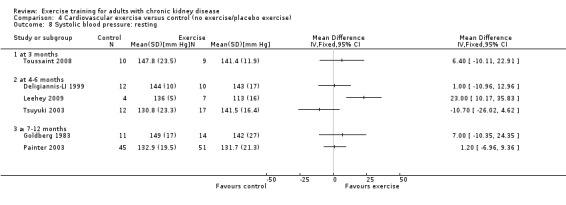
Resting systolic blood pressure
Exercise resulted in a significant decrease in resting systolic blood pressure (Analysis 1.9 (9 studies, 347 participants): MD 6.08 mm Hg, 95% CI 2.15 to 10.12, P = 0.002; I² = 12%, P = 0.33). Two studies were excluded from this analysis because of their inconsistency in the direction of the effect, resulting in significant heterogeneity. Kouidi 2009 showed a significant increase in resting systolic blood pressure while Tsuyuki 2003 showed no effect on resting systolic blood pressure. When they were included, physical exercise did not decrease resting systolic blood pressure (11 studies, 419 participants: MD 3.01 mm Hg, 95% CI ‐3.25 to 9.26; I² = 71%, P = 0.0002).
1.9. Analysis.
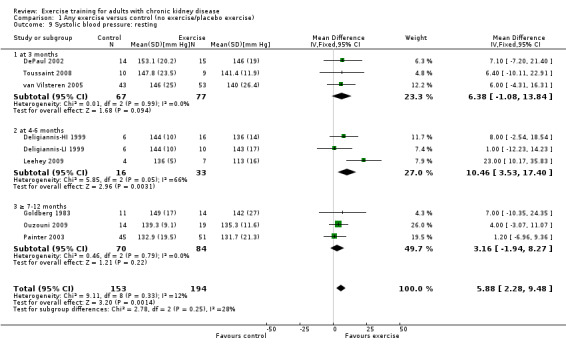
Comparison 1 Any exercise versus control (no exercise/placebo exercise), Outcome 9 Systolic blood pressure: resting.
Exercise intensity
High intensity exercise training significantly decreased resting systolic blood pressure (Analysis 2.9 (5 studies, 211 participants): MD 4.60 mm Hg, 95% CI 0.37 to 8.83, P = 0.03, I² = 0%, P = 0.84). Kouidi 2009 was excluded from the analysis because of its inconsistency in the direction of effect, resulting in significant heterogeneity. When it was included, high intensity exercise did not decrease resting systolic blood pressure (6 studies, 254 participants: MD 0.34 mm Hg, 95% CI ‐3.42 to 4.10, P = 0.86; I² = 75%, P = 0.001).
2.9. Analysis.
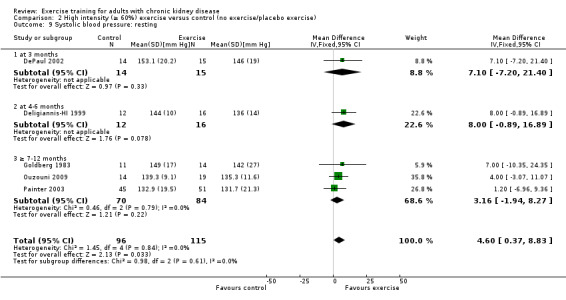
Comparison 2 High intensity (≥ 60%) exercise versus control (no exercise/placebo exercise), Outcome 9 Systolic blood pressure: resting.
Low intensity exercise training showed no significant decrease in resting systolic blood pressure (Analysis 3.5 (3 studies, 147 participants): MD 0.86 mm Hg, 95% CI ‐6.10 to 7.82, P = 0.81; I² = 36%, P = 0.21).
3.5. Analysis.
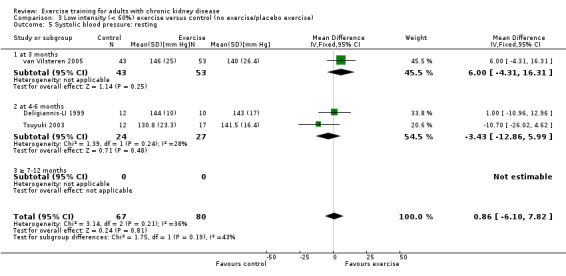
Comparison 3 Low intensity (< 60%) exercise versus control (no exercise/placebo exercise), Outcome 5 Systolic blood pressure: resting.
Length of time of the exercise intervention
Length of time of the exercise did not affect resting systolic blood pressure, not after three months (Analysis 1.9.1 (3 studies, 144 participants): MD 6.38 mm Hg, 95% CI ‐1.08 to 13.84), four to six months (Analysis 1.9.2 (3 studies, 49 participants): MD 10.62 mm Hg, 95% CI ‐1.38 to 22.62), or seven to 12 months (Analysis 1.9.3 (3 studies, 154 participants): MD 3.16 mm Hg, 95% CI ‐1.94 to 8.27).
Type of exercise
Six studies used cardiovascular exercise training, however data were not pooled due to significant heterogeneity. Only Leehey 2009 showed any significant decrease on resting systolic blood pressure (Analysis 4.8).
4.8. Analysis.
Comparison 4 Cardiovascular exercise versus control (no exercise/placebo exercise), Outcome 8 Systolic blood pressure: resting.
None of the included studies using a resistance training intervention reported resting systolic blood pressure.
Mixed cardiovascular and resistance training showed a significant decrease in resting systolic blood pressure (Analysis 5.6 (5 studies, 186 participants): MD 5.80 mm Hg, 95% CI 1.19 to 10.41, P = 0.02, I² = 0%, P = 0.92). Kouidi 2009 showed a significant increase in resting systolic blood pressure, resulting in significant heterogeneity and was excluded from the analysis.
5.6. Analysis.
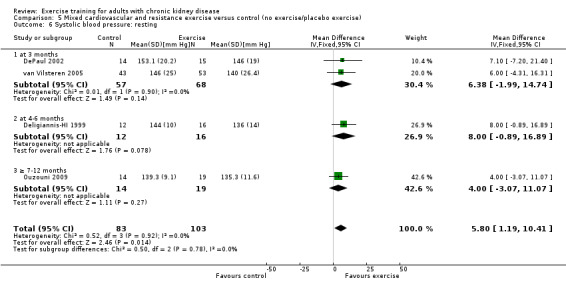
Comparison 5 Mixed cardiovascular and resistance exercise versus control (no exercise/placebo exercise), Outcome 6 Systolic blood pressure: resting.
Exercise supervision
Supervised exercise significantly decreased resting systolic blood pressure (Analysis 7.9 (5 studies, 211 participants): MD 5.88 mm Hg, 95% CI 1.42 to 10.34, P = 0.01, I² =0%, P = 0.97). Two studies were excluded from this analysis because of their inconsistency in the direction of the effect, resulting in significant heterogeneity. Kouidi 2009 showed a significant increase in resting systolic blood pressure while Tsuyuki 2003 showed no effect on resting systolic blood pressure. When they were included, supervised exercise did not decrease resting systolic blood pressure (MD 0.64 mm Hg, 95% CI ‐7.27 to 8.54, P = 0.87; I² = 74%, P = 0.0008).
7.9. Analysis.
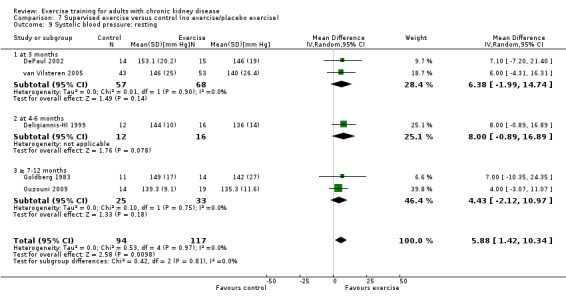
Comparison 7 Supervised exercise versus control (no exercise/placebo exercise), Outcome 9 Systolic blood pressure: resting.
Four studies used unsupervised exercise training, however data were not pooled due to significant heterogeneity. Only Leehey 2009 showed any significant decrease on resting systolic blood pressure (Analysis 8.6).
8.6. Analysis.
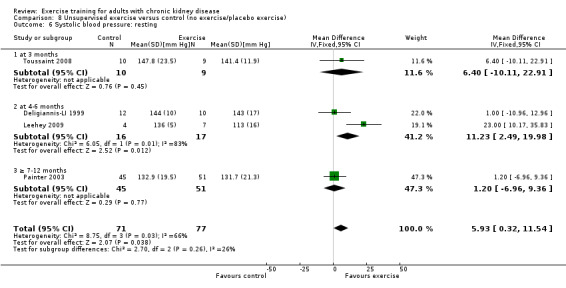
Comparison 8 Unsupervised exercise versus control (no exercise/placebo exercise), Outcome 6 Systolic blood pressure: resting.
Heart rate maximum (bpm)
Compared to control, any physical exercise training (regardless of type, intensity, length of intervention or supervision) significantly increased maximum heart rate (Analysis 1.10 (11 studies, 229 participants): MD 6 bpm, 95% CI 10 to 2, P = 0.002; I² = 0%, P = 0.94).
1.10. Analysis.
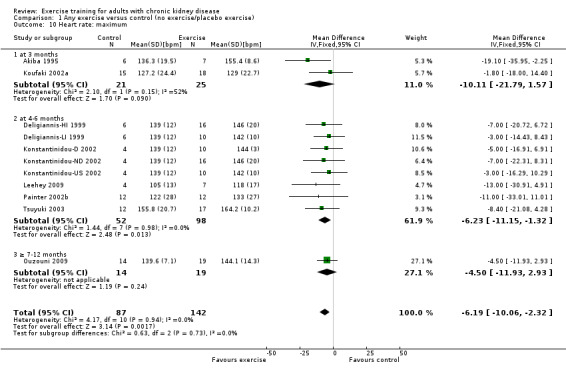
Comparison 1 Any exercise versus control (no exercise/placebo exercise), Outcome 10 Heart rate: maximum.
Exercise intensity
High intensity exercise training increased maximum heart rate (Analysis 2.10 (7 studies, 169 participants): MD 6 bpm, 95% CI 11 to 2, P = 0.006; I² = 0%, P = 0.81).
2.10. Analysis.
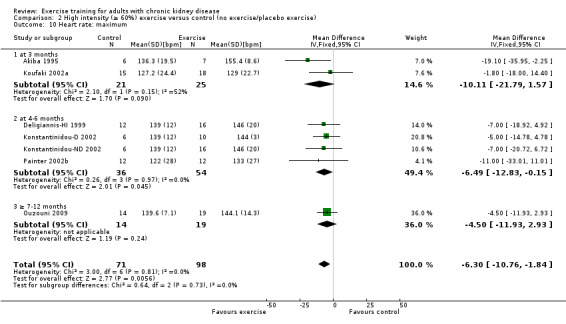
Comparison 2 High intensity (≥ 60%) exercise versus control (no exercise/placebo exercise), Outcome 10 Heart rate: maximum.
Low intensity exercise training showed no effect on maximum heart rate (Analysis 3.6 (3 studies, 73 participants): 4 bpm MD, 95% CI 10 to ‐2, P = 0.16; I² = 0%, P = 0.77).
3.6. Analysis.
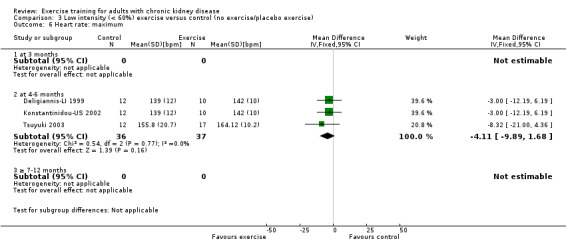
Comparison 3 Low intensity (< 60%) exercise versus control (no exercise/placebo exercise), Outcome 6 Heart rate: maximum.
Length of time of the exercise intervention
Three months of regular exercise training increased maximum heart rate in Akiba 1995 (13 participants: MD 19 bpm, 95% CI 36 to 2) while Koufaki 2002a showed no increase in maximum heart rate (33 participants: MD 2 bpm, 95% CI 18 to ‐14). Combined these studies showed no significant increase in bpm, however there was significant heterogeneity (Analysis 1.10.1 (2 studies, 46 participants): MD 10 bpm, 95% CI 22 to ‐2, P = 0.09; I² = 52%, P = 0.15)
Four to six months of regular exercise training increased maximum heart rate (Analysis 1.10.2 (8 studies, 150 participants): MD 6 bpm, 95% CI 11 to 1, P = 0.01, I² = 0%, P = 0.98).
Seven to12 months of regular exercise (33 participants randomised) and showed no significant change in maximum heart rate (Analysis 1.10.3 (1 study, 33 participants): MD 5 bpm, 95% CI 12 to ‐3).
Type of exercise
Regular cardiovascular exercise significantly increased maximum heart rate (Analysis 4.9 (7 studies, 154 participants): MD 6 bpm, 95% CI 11 to 1, P = 0.01; I² = 0%, P = 0.63)
4.9. Analysis.
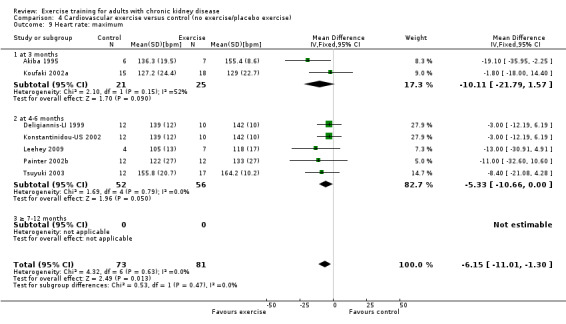
Comparison 4 Cardiovascular exercise versus control (no exercise/placebo exercise), Outcome 9 Heart rate: maximum.
Mixed cardiovascular and resistance training significantly increased maximum heart rate (Analysis 5.7 (4 studies, 99 participants): MD 5 bpm MD, 95% CI 10 to 1, P = 0.03; I² = 0%, P = 0.98)
5.7. Analysis.
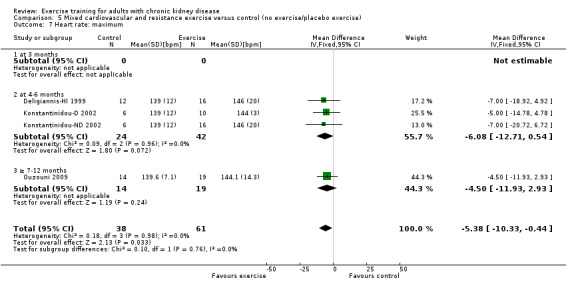
Comparison 5 Mixed cardiovascular and resistance exercise versus control (no exercise/placebo exercise), Outcome 7 Heart rate: maximum.
None of the included studies using a resistance training intervention reported maximum heart rate.
Exercise supervision
Supervised exercise increased maximum heart rate (Analysis 7.10 (8 studies, 194 participants): MD 7 bpm, 95% CI 11 to 2, P = 0.003; I² = 0%, P = 0.88).
7.10. Analysis.
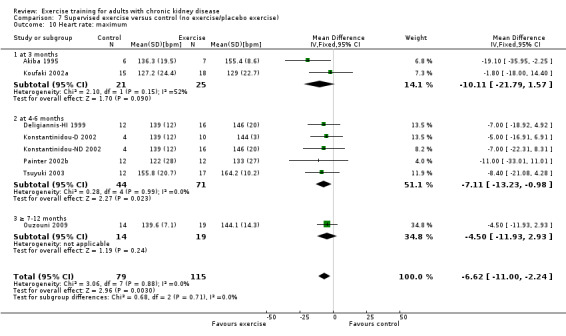
Comparison 7 Supervised exercise versus control (no exercise/placebo exercise), Outcome 10 Heart rate: maximum.
Unsupervised exercise showed no significant change in maximum heart rate (Analysis 8.7 (3 studies, 55 participants): MD 4 bpm, 95% CI 10 to ‐2, P = 0.18; I² = 0%, P = 0.59).
8.7. Analysis.
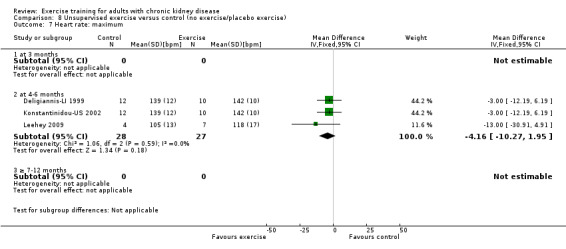
Comparison 8 Unsupervised exercise versus control (no exercise/placebo exercise), Outcome 7 Heart rate: maximum.
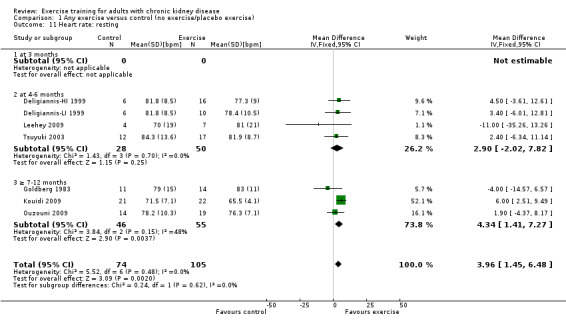
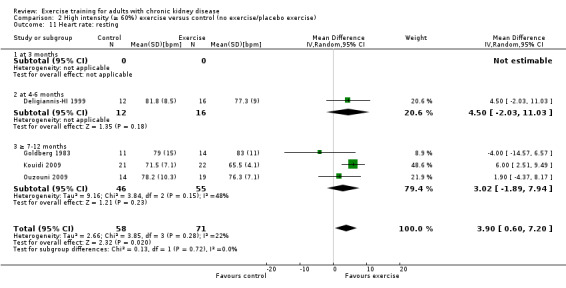
Resting heart rate (bpm)
Physical exercise training (regardless of type, intensity, length of intervention, or supervision) significantly reduced resting heart rate (Analysis 1.11 (7 studies, 179 participants): MD 4 bpm, 95% CI 2 to 7, P = 0.002, I² = 0%, P = 0.48).
1.11. Analysis.
Comparison 1 Any exercise versus control (no exercise/placebo exercise), Outcome 11 Heart rate: resting.
Exercise intensity
High intensity exercise training significantly reduced resting heart rate (Analysis 2.11 (4 studies, 129 participants): MD 4 bpm, 95% CI 1 to 7; P = 0.002; I² = 0%, P = 0.48).
2.11. Analysis.
Comparison 2 High intensity (≥ 60%) exercise versus control (no exercise/placebo exercise), Outcome 11 Heart rate: resting.
Low intensity exercise training showed no significant change in resting heart rate (Analysis 3.7 (2 studies, 51 participants): MD 3 bpm, 95% CI 3 to 9, P = 0.33; I² = 0%; P = 0.87).
3.7. Analysis.
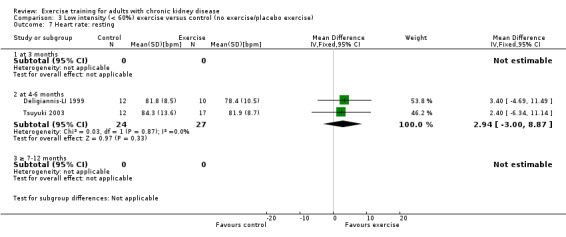
Comparison 3 Low intensity (< 60%) exercise versus control (no exercise/placebo exercise), Outcome 7 Heart rate: resting.
Length of time of the exercise intervention
None of the studies using three months of exercise training reported resting heart rate.
Four to six months of regular exercise training did not significantly change resting heart rate (Analysis 1.11.2 (4 studies, 78 participants): MD 3 bpm, 95% CI ‐2 to 8, P = 0.25; I² = 0%, P = 0.70).
Seven to 12 months of regular exercise training did not significantly change resting heart rate (Analysis 1.11.3 (3 studies,101 participants): MD 3 bpm, 95% CI ‐2 to 8, P = 0.23; I² = 48%, P = 0.15).
Type of exercise
Cardiovascular exercise training did not affect resting heart rate (Analysis 4.10 (4 studies, 87 participants): MD 1 bpm, 95% CI ‐4 to 6, P = 0.77; I² = 0%, P = 0.53).
4.10. Analysis.
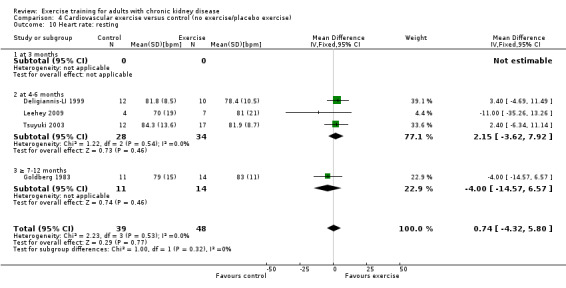
Comparison 4 Cardiovascular exercise versus control (no exercise/placebo exercise), Outcome 10 Heart rate: resting.
Mixed cardiovascular and resistance training significantly reduced resting heart rate (Analysis 5.8 (3 studies, 104 participants): MD 5 bpm, 95% CI 2 to 8, P = 0.0005; I² = 0%, P = 0.53).
5.8. Analysis.
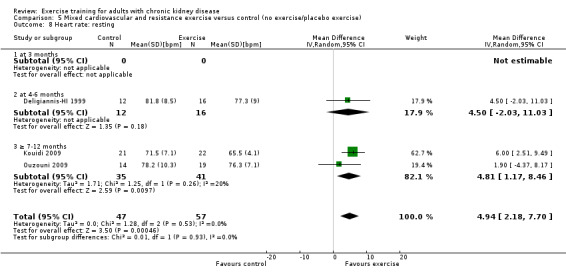
Comparison 5 Mixed cardiovascular and resistance exercise versus control (no exercise/placebo exercise), Outcome 8 Heart rate: resting.
None of the studies using resistance exercise training reported resting heart rate.
Exercise supervision
Supervised exercise training reduced resting heart rate (Analysis 7.11 (5 studies, 158 participants): MD 4 bpm, 95% CI 2 to 7, P = 0.001; I² = 0%, P = 0.42).
7.11. Analysis.
Comparison 7 Supervised exercise versus control (no exercise/placebo exercise), Outcome 11 Heart rate: resting.
Unsupervised exercise did not alter resting heart rate (Analysis 8.8 (2 studies, 33 participants): MD 2 bpm, 95% CI ‐6 to 10, P = 0.62; I² = 18%, P = 0.27).
8.8. Analysis.
Comparison 8 Unsupervised exercise versus control (no exercise/placebo exercise), Outcome 8 Heart rate: resting.
Nutrition
Albumin (g/L)
Three months of physical exercise training (regardless of type, intensity, length of intervention, or supervision) significantly decreased albumin (Analysis 1.12 (3 studies, 111 participants): MD ‐2.28 g/L, 95% CI ‐4.25 to ‐0.32, P = 0.02; I² = 46%, P = 0.16). Koufaki 2002a was excluded from this analysis because of their inconsistency in the direction of the effect, resulting in significant heterogeneity. When it was included physical exercise did not decrease albumin levels (4 studies, 144 participants): MD ‐0.89 g/L, 95% CI ‐4.08 to 2.31, P = 0.59; I² = 81%, P = 0.001)
1.12. Analysis.
Comparison 1 Any exercise versus control (no exercise/placebo exercise), Outcome 12 Albumin.
Exercise intensity
This outcome was not reported in any of the studies using either high or low intensity exercise training.
Length of exercise the intervention
This outcome was not reported in any of the studies using either four to six months or seven to 12 months exercise training.
Type of exercise
Due to heterogeneity, data from the cardiovascular exercise studies could not be pooled for albumin. Cardiovascular exercise training increased albumin in Jong 2004 (Analysis 4.11 (36 participants): MD ‐5.20 g/L, 95% CI ‐8.90 to ‐1.50), whereas the cardiovascular exercise training used in Koufaki 2002a decreased levels of albumin (Analysis 4.11 (33 participants): MD 5.30 g/L, 95% CI 1.47 to 9.13).
4.11. Analysis.
Comparison 4 Cardiovascular exercise versus control (no exercise/placebo exercise), Outcome 11 Albumin.
None of the studies using a mixed cardiovascular and resistance training intervention reported albumin levels.
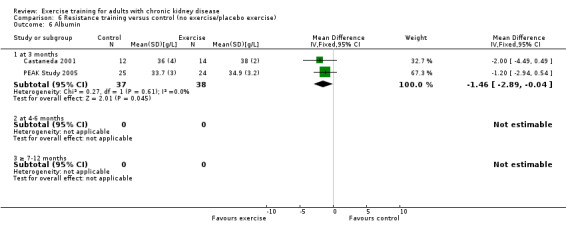
Resistance training significantly decreased albumin levels (Analysis 6.6 (2 studies, 75 participants): MD ‐1.46 g/L, 95% CI ‐2.89 to ‐0.84, P = 0.04; I² = 0%, P = 0.61).
6.6. Analysis.
Comparison 6 Resistance training versus control (no exercise/placebo exercise), Outcome 6 Albumin.
Exercise supervision
Supervised exercise training significantly decreased albumin (Analysis 7.12 (2 studies, 75 participants): MD ‐1.46 g/L, 95% CI ‐2.89 to ‐0.04, P = 0.04; I² = 0%, P = 0.61). Koufaki 2002a was excluded from this analysis because of their inconsistency in the direction of the effect, resulting in significant heterogeneity. When it was included exercise supervision did not decrease albumin levels (3 studies, 108 participants): MD 0.32 g/L, 95% CI ‐3.13 to 3.77, P = 0.86; I² = 81%, P = 0.005).
7.12. Analysis.
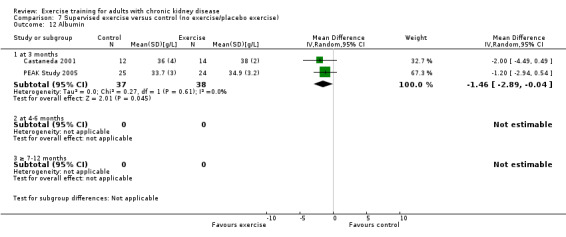
Comparison 7 Supervised exercise versus control (no exercise/placebo exercise), Outcome 12 Albumin.
Unsupervised exercise training increased albumin levels (Analysis 8.9 (1 study, 36 participants): MD ‐5.20 g/L, 95% CI ‐8.90 to ‐1.50).
8.9. Analysis.
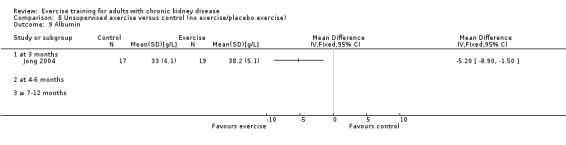
Comparison 8 Unsupervised exercise versus control (no exercise/placebo exercise), Outcome 9 Albumin.
Pre‐albumin (mg/L)
Three months of regular, high intensity exercise training significantly decreased pre‐albumin levels (Analysis 1.13 (3 studies, 111 participants): MD ‐ 44.02 mg/L, 95% CI ‐71.52 to ‐16.53; P = 0.002; I ² = 0%, P = 0.92)
1.13. Analysis.
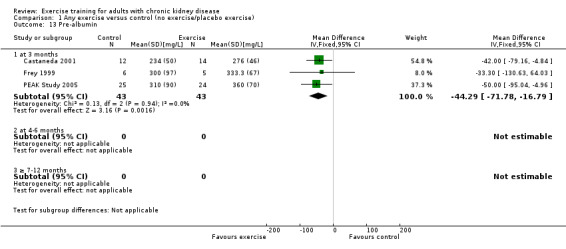
Comparison 1 Any exercise versus control (no exercise/placebo exercise), Outcome 13 Pre‐albumin.
Exercise intensity
This outcome was not reported in any of the studies using low intensity exercise interventions.
Length of the exercise intervention
This outcome was not reported in any of the studies using either four to six months or seven to 12 months exercise training.
Type of exercise
Cardiovascular exercise did not decrease pre‐albumin levels (Analysis 4.12 (1 study, 11 participants): MD ‐33.30 mg/L, 95% CI ‐130.63 to 64.03).
4.12. Analysis.

Comparison 4 Cardiovascular exercise versus control (no exercise/placebo exercise), Outcome 12 Pre‐albumin.
None of the studies using a mixed cardiovascular and resistance training reported pre‐albumin levels.
Resistance training significantly increased pre‐albumin levels (Analysis 6.7 (2 studies, 75 participants): MD ‐45.24 mg/L, 95% CI ‐73.90 to ‐16.57; P = 0.002; I² = 0%, P = 0.79).
6.7. Analysis.
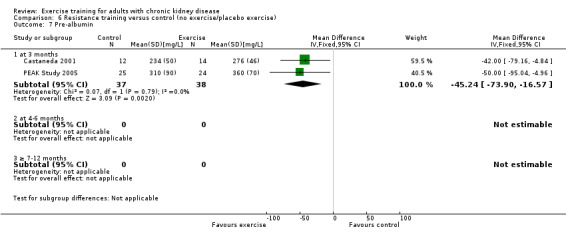
Comparison 6 Resistance training versus control (no exercise/placebo exercise), Outcome 7 Pre‐albumin.
Exercise supervision
This outcome was not reported in any of the studies using unsupervised exercise training.
Subjective Global Assessment (SGA)
Three months of supervised, high intensity (≥ 60%), cardiovascular exercise training did not change the SGA score (Analysis 1.14 (1 study, 33 participants): MD ‐0.10, 95% CI ‐0.75 to 0.55).
1.14. Analysis.
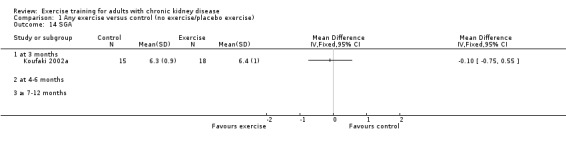
Comparison 1 Any exercise versus control (no exercise/placebo exercise), Outcome 14 SGA.
Energy intake
Regular exercise training (regardless of type, intensity, length of intervention, or supervision) showed a significant increase in energy intake following exercise training (Analysis 1.15 (4 studies, 97 participants): SMD ‐0.47, 95% CI ‐0.88 to ‐0.05; P = 0.03; I² = 12%, P = 0.33).
1.15. Analysis.
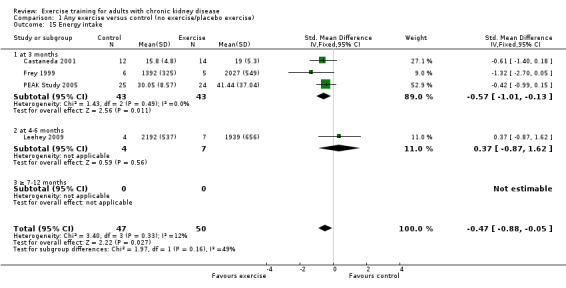
Comparison 1 Any exercise versus control (no exercise/placebo exercise), Outcome 15 Energy intake.
Exercise intensity
High intensity exercise training significantly increased energy intake following exercise training (Analysis 2.15 (3 studies, 86 participants): SMD ‐0.57, 95% CI ‐1.01 to ‐0.13, P = 0.01; I² = 0%, P = 0.49).
2.15. Analysis.
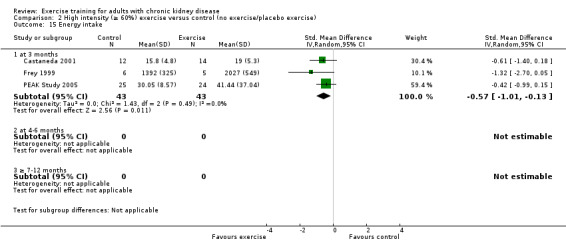
Comparison 2 High intensity (≥ 60%) exercise versus control (no exercise/placebo exercise), Outcome 15 Energy intake.
This outcome was not reported in any of the studies using low intensity exercise training.
Type of exercise
Due to heterogeneity, data from the cardiovascular exercise studies were not pooled. Neither Frey 1999 nor Leehey 2009 reported any significant increase in energy intake following cardiovascular exercise (Analysis 4.14).
4.14. Analysis.
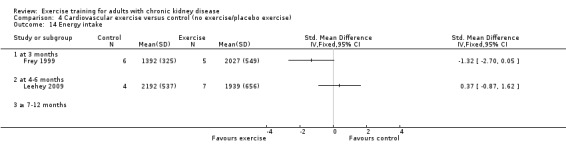
Comparison 4 Cardiovascular exercise versus control (no exercise/placebo exercise), Outcome 14 Energy intake.
This outcome was not reported in any of the studies using mixed cardiovascular and resistance exercise training.
Resistance training did not significantly increase energy intake (Analysis 6.8 (2 studies, 75 participants): MD ‐3.70 kcal/kg/d, 95% CI ‐7.46 to 0.06, P= 0.05; I² = 5%, P=0.31).
6.8. Analysis.
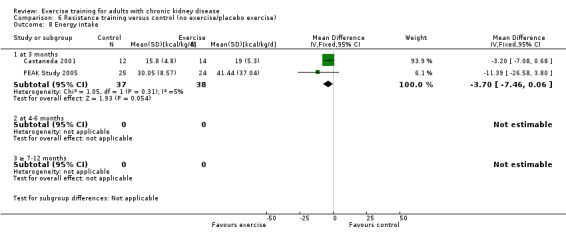
Comparison 6 Resistance training versus control (no exercise/placebo exercise), Outcome 8 Energy intake.
Exercise supervision
This outcome was not reported in any of the studies using unsupervised exercise training.
Protein intake
Three months of supervised, high intensity exercise training did not significantly increase protein intake (Analysis 1.16 (2 studies, 60 participants): SMD ‐0.50, 95% CI ‐1.01 to 0.02, P = 0.06; I² = 0%, P = 0.75).
1.16. Analysis.
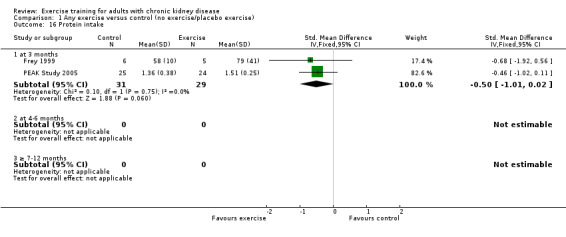
Comparison 1 Any exercise versus control (no exercise/placebo exercise), Outcome 16 Protein intake.
Type of exercise
Cardiovascular exercise training did not increase protein intake (Analysis 4.15 (1 study, 11 participants): MD ‐21.00 g/day, 95% CI ‐57.82 to 15.82).
4.15. Analysis.
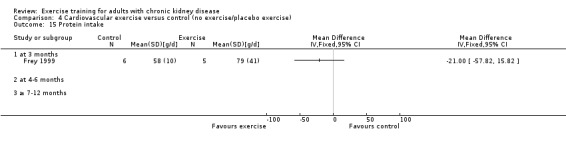
Comparison 4 Cardiovascular exercise versus control (no exercise/placebo exercise), Outcome 15 Protein intake.
None of the studies using a mixed cardiovascular and resistance training reported protein intake.
Resistance exercise training did not increase protein intake (Analysis 6.9 (1 study, 49 participants): MD ‐0.15 g/kg body weight/day, 95% CI ‐0.33 to 0.03).
6.9. Analysis.
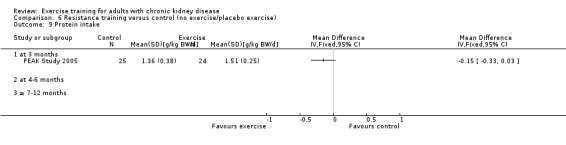
Comparison 6 Resistance training versus control (no exercise/placebo exercise), Outcome 9 Protein intake.
Transferrin (g/L)
Due to heterogeneity (I² = 90%, P = 0.001) data have not been pooled but are presented separately.
Two months of supervised, high intensity cardiovascular exercise training did not significantly increase serum transferrin (Analysis 1.17 (1 study, 11 participants): MD 0.05 g/L, 95% CI ‐0.35 to 0.45).
1.17. Analysis.
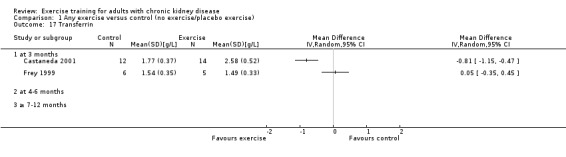
Comparison 1 Any exercise versus control (no exercise/placebo exercise), Outcome 17 Transferrin.
Three months of supervised, high intensity resistance training significantly increased in serum transferrin (Analysis 1.17 (1 study, 26 participants): MD ‐0.81 g/L, 95% CI ‐1.15 to ‐0.47).
Body mass indices (muscle mass, fat mass, anthropometric measures)
Twelve studies reported body mass indices (muscle mass, fat mass, anthropometric measures) as an outcome measure, however none reported muscle mass.
Exercise training in general did not significantly reduce fat mass (Analysis 1.18 (5 studies, 237 participants): SMD 0.08, 95% CI ‐0.19 to 0.34, P = 0.57; I² = 61%, P = 0.04). Heterogeneity was due to Leehey 2009 who used four to six months of unsupervised, mixed intensity walking program and showed a significant decrease in fat mass (Analysis 1.18.2 (1 study, 11 participants): SMD 2.10, CI 0.45 to 3.74).
1.18. Analysis.
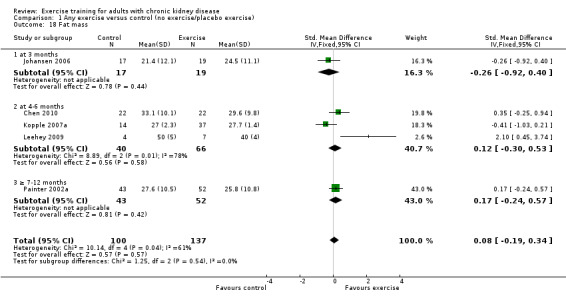
Comparison 1 Any exercise versus control (no exercise/placebo exercise), Outcome 18 Fat mass.
Anthropometric measures were only reported in PEAK Study 2005. Three months of supervised, high intensity resistance training did not reduce waist circumference (Analysis 1.19: MD 3.30 cm, 95% CI ‐6.32 to 12.92; P = 0.50), mid‐arm circumference (Analysis 1.20: MD ‐0.70 cm, 95% CI ‐2.66 to 1.26), mid‐calf circumference (Analysis 1.21: MD 0.50 cm, 95% CI ‐1.44 to 2.44; P = 0.61), or mid‐thigh circumference (Analysis 1.22: MD 0.60 cm, 95% CI ‐2.16 to 3.36).
1.19. Analysis.
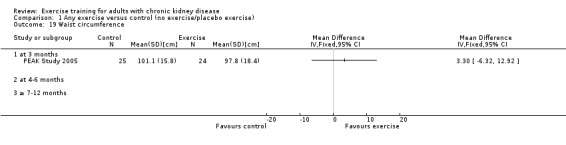
Comparison 1 Any exercise versus control (no exercise/placebo exercise), Outcome 19 Waist circumference.
1.20. Analysis.
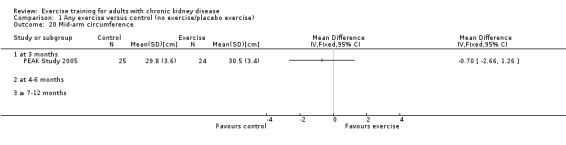
Comparison 1 Any exercise versus control (no exercise/placebo exercise), Outcome 20 Mid‐arm circumference.
1.21. Analysis.
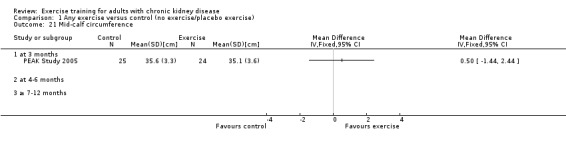
Comparison 1 Any exercise versus control (no exercise/placebo exercise), Outcome 21 Mid‐calf circumference.
1.22. Analysis.
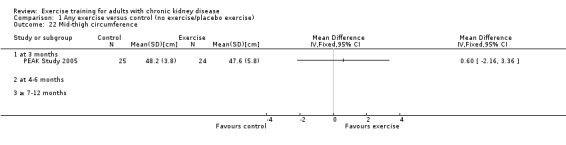
Comparison 1 Any exercise versus control (no exercise/placebo exercise), Outcome 22 Mid‐thigh circumference.
Systemic inflammation
Serum interleukin 6
There was no difference in serum interleukin 6 levels between the exercise and control group when using three months supervised high intensity resistance training (Analysis 1.23 (1 study, 26 participants): MD 3.10 pg/mL, 95 % CI ‐3.41 to 9.61).
1.23. Analysis.
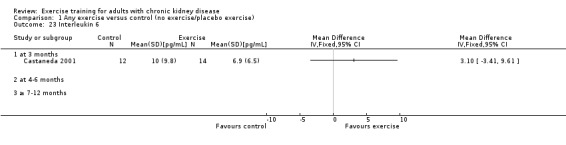
Comparison 1 Any exercise versus control (no exercise/placebo exercise), Outcome 23 Interleukin 6.
Lymphocytes
There was no difference in lymphocytes between the exercise and control group when using three months supervised, high intensity resistance training (Analysis 1.24 (1 study, 49 participants): MD 0.08 x 10⁹ L, 95% CI ‐0.26 to 0.42).
1.24. Analysis.
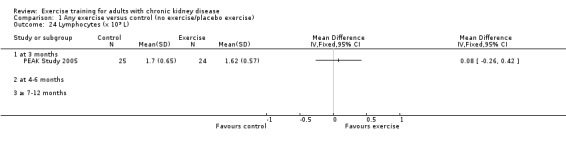
Comparison 1 Any exercise versus control (no exercise/placebo exercise), Outcome 24 Lymphocytes (x 109 L).
Protein catabolic rate
There was no difference in protein catabolic rate between the exercise and control group when using three months supervised, high intensity resistance training(Analysis 1.25 (1 study, 49 participants): MD ‐0.01 g/kg BW/d, 95% CI ‐0.17 to 0.15).
1.25. Analysis.
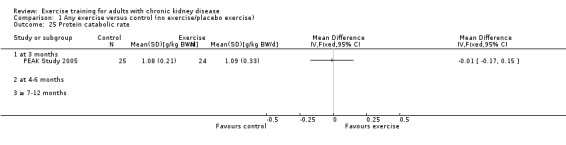
Comparison 1 Any exercise versus control (no exercise/placebo exercise), Outcome 25 Protein catabolic rate.
Physical activity
Regular exercise training (regardless of type, intensity, length of intervention, or supervision) showed a significant increase in the level of physical activity (Analysis 1.26 (4 studies, 121 participants): SMD ‐0.43, 95% CI ‐0.80 to ‐0.05, P = 0.02; I² = 0%, P = 0.85). There was no significant difference in physical activity between the exercise and control group after three months of exercise (Analysis 1.26 (1 study, 33 participants): SMD ‐0.33, 95% CI ‐1.02 to 0.36). The effect occurred in the studies with four to six months of exercise training (Analysis 1.26.2 (3 studies, 88 participants): SMD ‐0.46, 95% CI ‐0.09 to ‐0.02, P = 0.04; I² = 0%, P = 0.71).
1.26. Analysis.
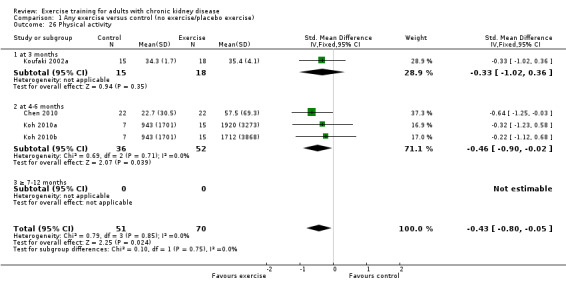
Comparison 1 Any exercise versus control (no exercise/placebo exercise), Outcome 26 Physical activity.
Cardiovascular exercise training did not increase physical activity (Analysis 4.18 (3 studies, 77 participants): SMD ‐0.30, 95% CI ‐0.77 to 0.17, P = 0.21; I² = 0%, P = 0.98).
4.18. Analysis.
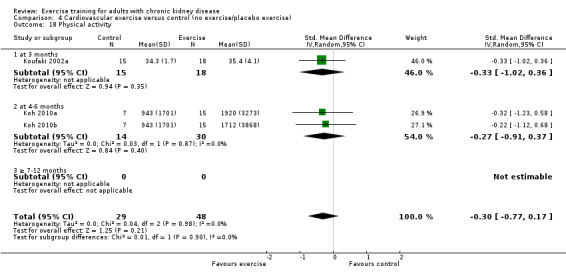
Comparison 4 Cardiovascular exercise versus control (no exercise/placebo exercise), Outcome 18 Physical activity.
None of the studies using a mixed cardiovascular and resistance training reported physical activity.
Resistance exercise training did not increase physical activity (Analysis 6.19 (1 study, 44 participants): MD ‐0.30, 95% CI ‐1.22 to 0.62).
6.19. Analysis.

Comparison 6 Resistance training versus control (no exercise/placebo exercise), Outcome 19 Physical activity.
Depression
Due to significant heterogeneity (I² = 79%, P = 0.002) data were not pooled (Analysis 1.27) but have been presented separately.
1.27. Analysis.
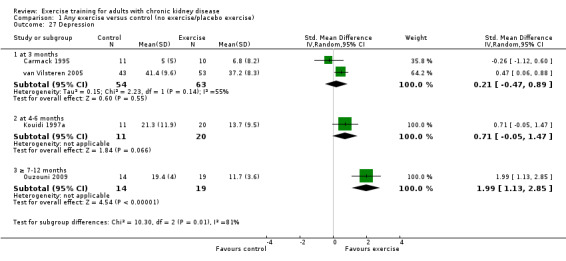
Comparison 1 Any exercise versus control (no exercise/placebo exercise), Outcome 27 Depression.
van Vilsteren 2005 found three months of supervised low intensity mixed cardiovascular and resistance training and found a decreased level of depression (Analysis 1.27.1 (96 participants): SMD 90.47, 95% CI 0.06 to 0.88), while Carmack 1995 found no difference (Analysis 1.27.1 (21 participants): SMD ‐0.26, 95% CI ‐1.12 to 0.60).
There was no change in depression after four to six months of exercise (Analysis 1.27.2 (1 study, 31 participants): SMD 0.31, 95% CI ‐0.05 to 1.47).
Ten months of supervised, high intensity, mixed cardiovascular and resistance training (Ouzouni 2009) decreased the level of depression (Analysis 1.27.3 (1 study, 33 participants): SMD 1.99, 95% CI 1.13 to 2.85).
Health‐related quality of life
Eighteen studies reported the effect of regular exercise training on health‐related quality of life in adults with CKD. Different instruments had been used. Most studies had used a generic instrument and not a disease‐specific instrument. In some cases only a total score had been used. Data from each study has been tabulated and is presented in Appendix 2 ‐ Health‐related quality of life assessment. In summary, 14/18 studies showed improved total scores and/or sub‐scores following regular exercise training and 4/18 studies showed no effect of exercise training on health‐related quality of life in adults with CKD.
Secondary outcome measures
Blood lipids
Triglycerides
Regular exercise (regardless of type, intensity, length of intervention, or supervision) showed no significant change in triglycerides (Analysis 1.28 (4 studies, 100 participants): MD 0.05 mmol/L, 95% CI ‐0.23 to 0.33, P = 0.72; I² = 0%, P = 0.87). Analyses based on length of intervention (Analysis 1.28), intensity of exercise (Analysis 2.28), type of exercise (Analysis 4.20; Analysis 9.3), and with (Analysis 7.28) or without (Analysis 8.14) supervision, showed no effect of exercise on triglycerides.
1.28. Analysis.
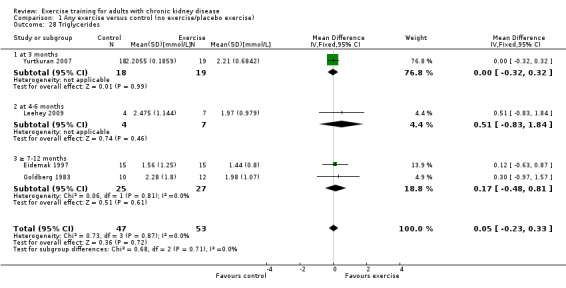
Comparison 1 Any exercise versus control (no exercise/placebo exercise), Outcome 28 Triglycerides.
2.28. Analysis.
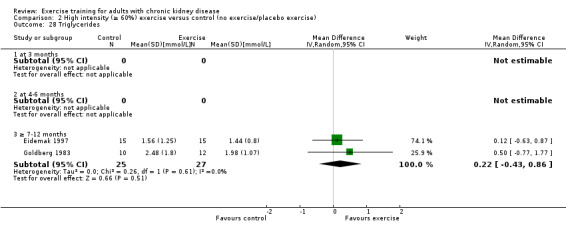
Comparison 2 High intensity (≥ 60%) exercise versus control (no exercise/placebo exercise), Outcome 28 Triglycerides.
4.20. Analysis.
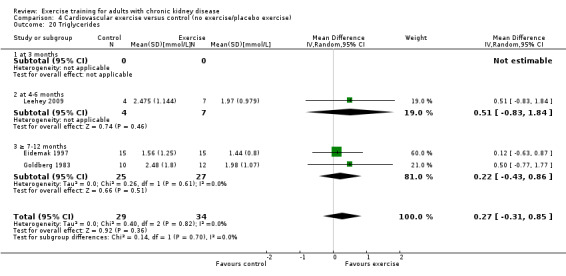
Comparison 4 Cardiovascular exercise versus control (no exercise/placebo exercise), Outcome 20 Triglycerides.
9.3. Analysis.
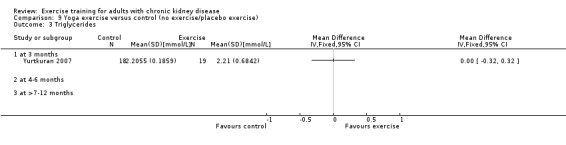
Comparison 9 Yoga exercise versus control (no exercise/placebo exercise), Outcome 3 Triglycerides.
7.28. Analysis.
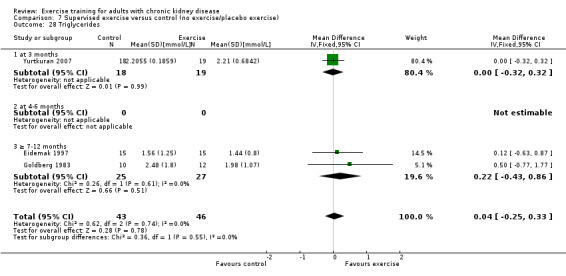
Comparison 7 Supervised exercise versus control (no exercise/placebo exercise), Outcome 28 Triglycerides.
8.14. Analysis.
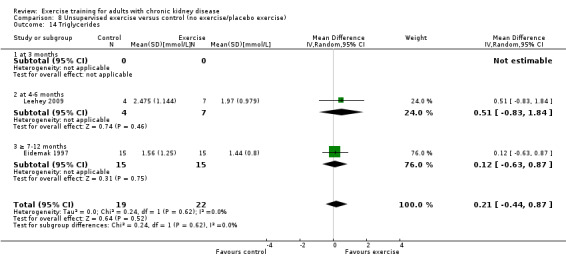
Comparison 8 Unsupervised exercise versus control (no exercise/placebo exercise), Outcome 14 Triglycerides.
Total cholesterol
Regular exercise (regardless of type, intensity, length of intervention, or supervision) showed no significant change in cholesterol (Analysis 1.29 (6 studies, 292 participants): MD 0.17 mmol/L, 95% CI ‐0.12 to 0.46, P = 0.25; I² = 20%, P = 0.28). All six studies used supervised exercise training interventions. Analyses based on length of intervention (Analysis 1.29), intensity of exercise (Analysis 2.29; Analysis 3.9) or type of exercise (Analysis 4.21; Analysis 5.11; Analysis 9.4) showed no effect on total cholesterol.
1.29. Analysis.
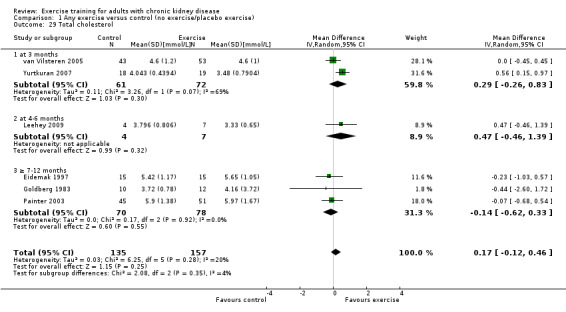
Comparison 1 Any exercise versus control (no exercise/placebo exercise), Outcome 29 Total cholesterol.
2.29. Analysis.
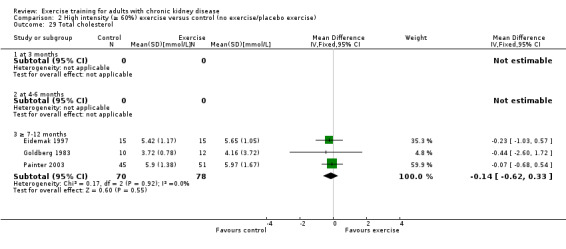
Comparison 2 High intensity (≥ 60%) exercise versus control (no exercise/placebo exercise), Outcome 29 Total cholesterol.
3.9. Analysis.
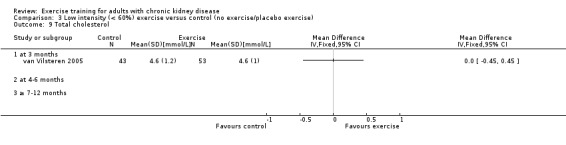
Comparison 3 Low intensity (< 60%) exercise versus control (no exercise/placebo exercise), Outcome 9 Total cholesterol.
4.21. Analysis.
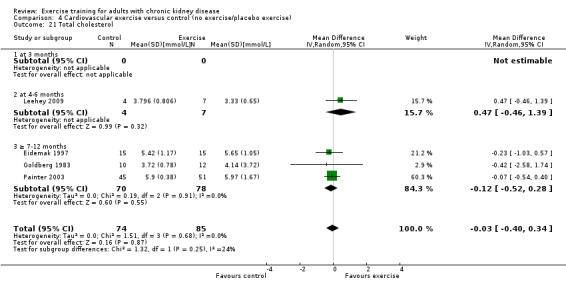
Comparison 4 Cardiovascular exercise versus control (no exercise/placebo exercise), Outcome 21 Total cholesterol.
5.11. Analysis.
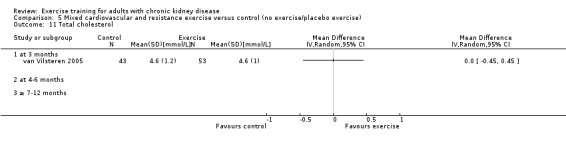
Comparison 5 Mixed cardiovascular and resistance exercise versus control (no exercise/placebo exercise), Outcome 11 Total cholesterol.
9.4. Analysis.
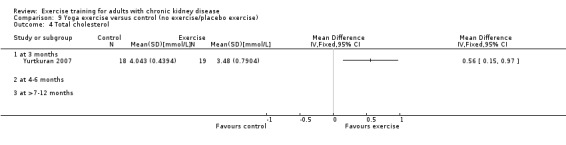
Comparison 9 Yoga exercise versus control (no exercise/placebo exercise), Outcome 4 Total cholesterol.
HDL cholesterol
Regular exercise (regardless of type, intensity, length of intervention, or supervision) showed a statistically significant decrease in HDL cholesterol (Analysis 1.30 (4 studies, 166 participants): MD ‐0.14 mmol/L MD, 95% CI ‐0.23 to ‐0.04, P = 0.005; I² = 0%, P = 0.67).
1.30. Analysis.
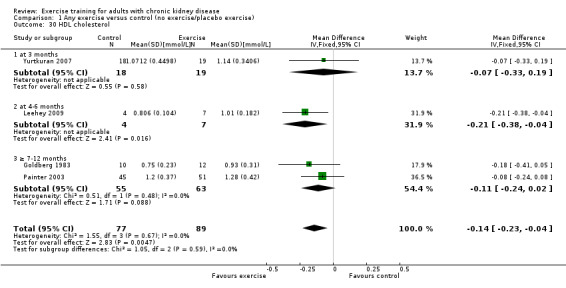
Comparison 1 Any exercise versus control (no exercise/placebo exercise), Outcome 30 HDL cholesterol.
LDL and VLDL cholesterol
Three studies measured LDL cholesterol (Eidemak 1997; Goldberg 1983; Leehey 2009) and two studies measured VLDL cholesterol (Eidemak 1997; Goldberg 1983). Unfortunately data were missing from Goldberg 1983 and Eidemak 1997 and they could therefore not be meta‐analysed.
Four to six months of a supervised, mixed intensity walking program showed no significant effect on LDL cholesterol (Analysis 1.31 (1 study, 11 participants): MD 0.39 mmol/L, 95% CI ‐0.21 to 0.99).
1.31. Analysis.
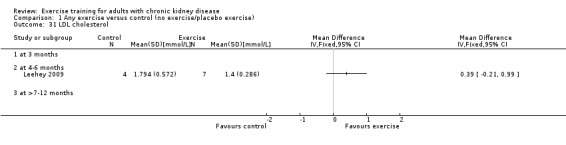
Comparison 1 Any exercise versus control (no exercise/placebo exercise), Outcome 31 LDL cholesterol.
Intermediate‐density lipoprotein (IDL), apolipoprotein (APO) A1 and APO‐B
These outcomes were not reported in any of the included studies.
Muscle morphology and morphometrics
Type I, IIa and IIb muscle fibre area
Three months of regular, supervised, high intensity, resistance training showed no statistically significant difference in type I muscle fibre area between the exercise and control group (Analysis 1.32 (1 study, 26 participants): MD ‐861.00 µm², 95% CI ‐1791.12 to 69.12).
1.32. Analysis.
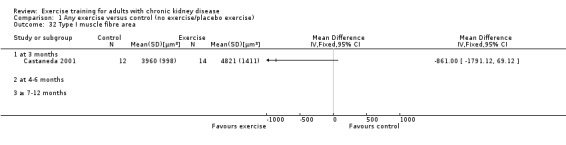
Comparison 1 Any exercise versus control (no exercise/placebo exercise), Outcome 32 Type I muscle fibre area.
Type IIa and type IIb muscle fibre areas had not been analysed separately.
Proportion type I, IIa and IIb muscle fibres (%)
These outcomes were not reported in any of the included studies.
Mid‐thigh muscle area (cm²)
Overall, regular exercise (regardless of type, intensity, length of intervention, or supervision) showed a significant increase in mid‐thigh muscle area (Analysis 1.33 (4 studies, 162 participants): MD 7.51 cm², 95% CI 11.37 to 3.65, P < 0.0001; I² = 5%, P = 0.37). After three months there was no significant increase in mid‐thigh muscle area using a supervised, high intensity, resistance training program (Analysis 1.33.1 (3 studies, 111 participants): MD 3.22 cm², 95% CI 9.67 to ‐3.24, P = 0.33; I² = 0%, P = 0.77). However after four to six months of cardiovascular exercise training there was a significant increase in mid‐thigh muscle area (Analysis 4.24 (1 study, 24 participants): MD 13.10 cm², 95% CI ‐21.13 to 5.07).
1.33. Analysis.
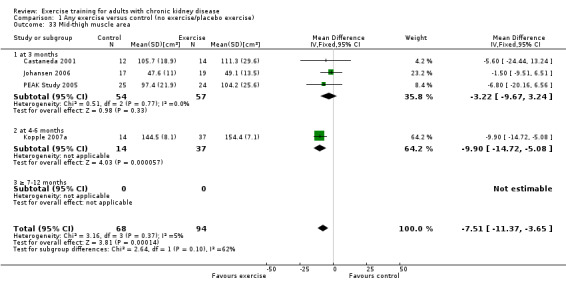
Comparison 1 Any exercise versus control (no exercise/placebo exercise), Outcome 33 Mid‐thigh muscle area.
4.24. Analysis.
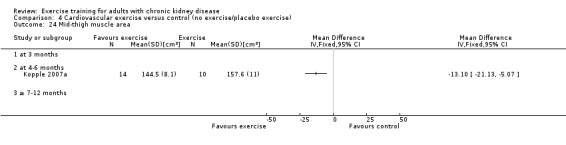
Comparison 4 Cardiovascular exercise versus control (no exercise/placebo exercise), Outcome 24 Mid‐thigh muscle area.
Thigh muscle attenuation
After three months of supervised, high intensity resistance training significantly increased thigh muscle attenuation was significantly increased (Analysis 1.34 (1 study, 49 participants): MD 1.50 Hounsfield units, 95% CI 0.21 to 2.79).
1.34. Analysis.
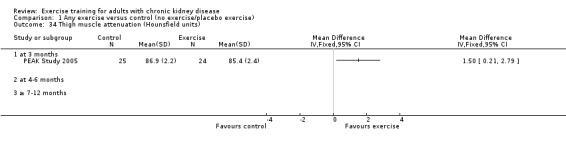
Comparison 1 Any exercise versus control (no exercise/placebo exercise), Outcome 34 Thigh muscle attenuation (Hounsfield units).
Cardiovascular dimensions
HRV index, SDNN, arrhythmias
HRV index was significantly improved after six months of supervised, high intensity mixed cardiovascular and resistance training (Analysis 1.35 (1 study, 60 participants): MD ‐6.00, 95% CI ‐10.08 to ‐1.92).
1.35. Analysis.
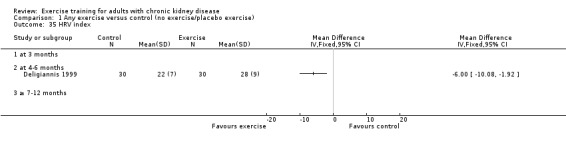
Comparison 1 Any exercise versus control (no exercise/placebo exercise), Outcome 35 HRV index.
Six and 10 months of mixed cardiovascular and resistance training significantly improved mean cardiac R‐R interval (Analysis 1.36 (2 studies, 119 participants): MD ‐0.06 sec, 95% CI ‐0.09 to ‐0.02, P = 0.001; I² = 0%, P = 0.58) and SDNN (Analysis 1.37 (2 studies, 119 participants): MD ‐0.02, 95% CI ‐0.03 to ‐0.01, P < 0.00001; I² = 0%, P = 1.00).
1.36. Analysis.
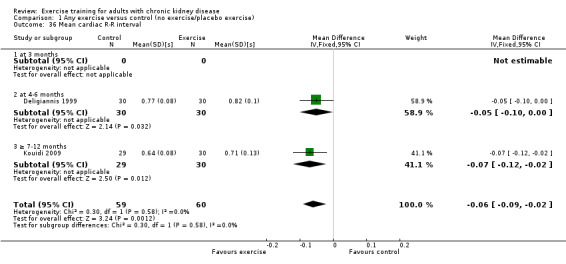
Comparison 1 Any exercise versus control (no exercise/placebo exercise), Outcome 36 Mean cardiac R‐R interval.
1.37. Analysis.
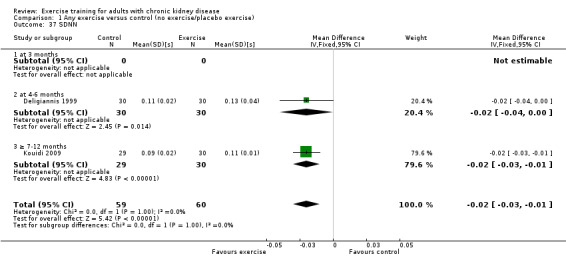
Comparison 1 Any exercise versus control (no exercise/placebo exercise), Outcome 37 SDNN.
Six months of supervised, high intensity mixed cardiovascular and resistance training did not significantly decrease arrhythmias (Analysis 1.38 (1 study, 60 participants): RR 0.62, 95% CI 0.30 to 1.27).
1.38. Analysis.
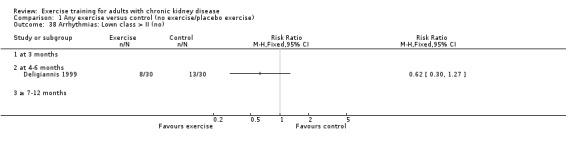
Comparison 1 Any exercise versus control (no exercise/placebo exercise), Outcome 38 Arrhythmias: Lown class > II (no).
Left ventricular internal dimension at end‐diastole, Left ventricular internal dimension at end‐systole, Intraventricular septal thickness at end‐diastole, Left ventricular posterior wall thickness at end‐diastole, Left ventricular mass, Left ventricular mass index
Six months of supervised, cardiovascular exercise training did not change left ventricular internal dimension at end‐diastole (Analysis 1.39 (2 studies, 38 participants): MD ‐1.44 mm, 95% CI ‐4.94 to 2.06), left ventricular internal dimension at end‐systole (Analysis 1.40 (2 studies, 38 participants): MD 0.06 mm, 95% CI ‐3.16 to 3.27), intraventricular septal thickness at end‐diastole (Analysis 1.41 (2 studies, 38 participants): MD 0.04 mm, 95% CI ‐1.28 to 1.36), left ventricular posterior wall thickness at end‐diastole (Analysis 1.42 (2 studies, 38 participants): MD 0.20 mm, 95% CI ‐0.93 to 1.33), or left ventricular mass (Analysis 1.43 (2 studies, 38 participants): MD ‐5.66 g, 95% CI ‐50.23 to 38.91).
1.39. Analysis.
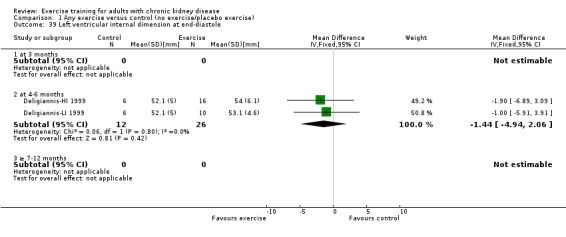
Comparison 1 Any exercise versus control (no exercise/placebo exercise), Outcome 39 Left ventricular internal dimension at end‐diastole.
1.40. Analysis.

Comparison 1 Any exercise versus control (no exercise/placebo exercise), Outcome 40 Left ventricular internal dimension at end‐systole.
1.41. Analysis.
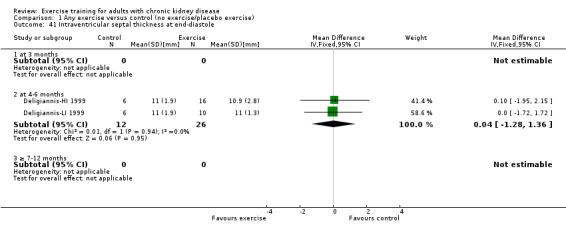
Comparison 1 Any exercise versus control (no exercise/placebo exercise), Outcome 41 Intraventricular septal thickness at end‐diastole.
1.42. Analysis.
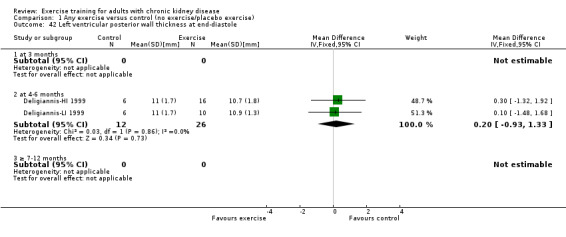
Comparison 1 Any exercise versus control (no exercise/placebo exercise), Outcome 42 Left ventricular posterior wall thickness at end‐diastole.
1.43. Analysis.
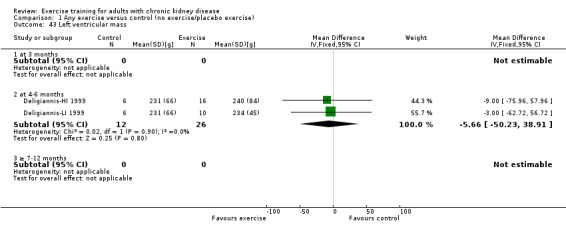
Comparison 1 Any exercise versus control (no exercise/placebo exercise), Outcome 43 Left ventricular mass.
Left ventricular mass index was not significantly changed after six or 10 months of exercise (Analysis 1.44 (3 studies, 97 participants): MD ‐1.77 g/m², 95% CI ‐7.26 to 3.73, P = 0.53; I² = 0%, P = 0.77).
1.44. Analysis.
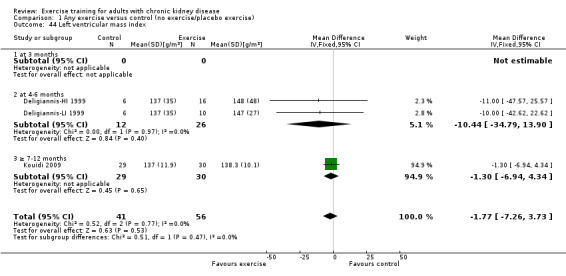
Comparison 1 Any exercise versus control (no exercise/placebo exercise), Outcome 44 Left ventricular mass index.
Glucose metabolism
Fasting plasma glucose (mmol/L), fasting plasma insulin (mmol/L), glucose disappearance (%/min)
Twelve months of supervised, high intensity cardiovascular exercise did not significantly change fasting plasma glucose (Analysis 1.45 (1 study, 13 participants): MD 0.39 mmol/L, 95% CI ‐0.30 to 1.08), fasting plasma insulin (Analysis 1.46 (1 study, 13 participants): MD 8.00 mmol/L, 95% CI ‐7.58 to 23.58), or glucose disappearance (Analysis 1.47 (1 study, 13 participants): MD ‐1.00 %/min, 95% CI ‐2.62 to 0.62).
1.45. Analysis.

Comparison 1 Any exercise versus control (no exercise/placebo exercise), Outcome 45 Fasting plasma glucose.
1.46. Analysis.
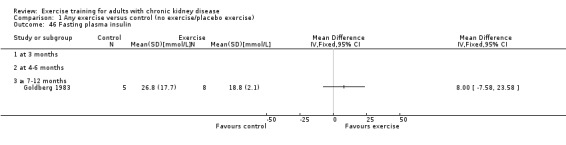
Comparison 1 Any exercise versus control (no exercise/placebo exercise), Outcome 46 Fasting plasma insulin.
1.47. Analysis.
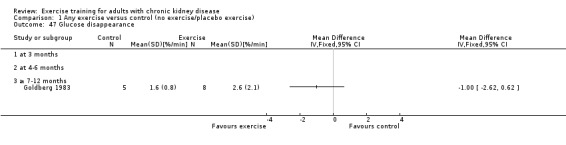
Comparison 1 Any exercise versus control (no exercise/placebo exercise), Outcome 47 Glucose disappearance.
Dropout rates (%)
The dropout rates are presented in the Characteristics of included studies. Some studies did not report dropout rates and in some cases dropout rates were unclear. Thirty four of 45 studies reported dropout rates. Twenty‐seven had a dropout rate between zero and 30% (Carney 1987; Castaneda 2001; Chen 2010, Deligiannis 1999; Deligiannis‐HI 1999; Deligiannis‐LI 1999; DePaul 2002; Eidemak 1997; Fitts 1995; Frey 1999; Johansen 2006, Koh 2010a, Jong 2004; Konstantinidou‐D 2002; Konstantinidou‐ND 2002; Konstantinidou‐US 2002; Kouidi 1997a; Kouidi 2009, Leehey 2009, Matsumoto 2007, Ouzouni 2009, Painter 2002b; Painter 2003; Parsons 2004; PEAK Study 2005; Segura‐Orti 2009, Toussaint 2008, Tsuyuki 2003; van Vilsteren 2005, Yurtkuran 2007), six studies had a dropout rate of between 30% and 50% (Akiba 1995; Fitts 1999; Kopple 2007a, Koufaki 2002a; Molsted 2004; Painter 2002a), one study had a dropout rate of between 50% and 70% (Carmack 1995), and no study had a dropout rate greater than 70%.
Compliance
Compliance was reported in 14 studies. Eleven studies had high compliance (> 70%) (Carmack 1995; Castaneda 2001; Chen 2010, Fitts 1995; Koh 2010a, Kouidi 2009, Molsted 2004; PEAK Study 2005; Segura‐Orti 2009; Toussaint 2008; Yurtkuran 2007); one study had moderate compliance (> 50% to 70%) (Painter 2002a); and no study had low compliance (< 50%). van Vilsteren 2005 reported high compliance to the aerobic exercise and moderate compliance to the resistance training. DePaul 2002 did not report compliance, but the authors reported that the results of a per‐protocol analysis including only patients who completed 75% of training sessions were no different from results of the intention‐to‐treat (ITT) analysis.
Adverse events (exercise‐induced injuries)
Only one study had included exercise‐induced injuries as an outcome (PEAK Study 2005). They defined adverse events as 'any injury or exacerbation of underlying disease potentially attributed to the progressive resistance training (PRT) regimen'. They compared common dialysis‐related complaints (such as headaches, hypotension, cramping, and fistula cannulation difficulties), fistula infections, angina, incidence of falls, acute illness, and number of health care professional visits, and found no difference between the exercise and control group. They did however identify one adverse event in one of the participants who after six weeks of exercise training suffered partial tearing of musculus supraspinatus.
Molsted 2004 did not have adverse events as an outcome measure, but reported that there were no drop‐outs caused by adverse events.
Mortality
This outcome was not reported by any of the included studies.
Heterogeneity
Of the outcomes tested, there was substantial heterogeneity in the results of studies for the outcomes of heart rate maximum (three months); walking capacity (four to six months); resting diastolic blood pressure (four to six months); resting systolic blood pressure (cardiovascular exercise, four to six months); albumin; transferrin and depression.
Two studies reported maximum heart rate (Analysis 1.10.1) (Akiba 1995; Koufaki 2002a) and the results showed heterogeneity although these were not statistically significant. Akiba 1995 showed no beneficial effect on maximum heart rate, whereas Koufaki 2002a did show beneficial effects. The results from Akiba 1995 are based on 13 randomised participants, while Koufaki 2002a randomised 23 participants.
Five studies reported walking capacity (Analysis 1.5) (Koh 2010a; Koh 2010b; Koufaki 2002a; PEAK Study 2005; Segura‐Orti 2009), and there was heterogeneity although not significant. The observed heterogeneity was caused by data from Segura‐Orti 2009, whose results caused inconsistency in the direction of effect. Segura‐Orti 2009 enrolled only eight participant to the exercise group and showed no beneficial effects on walking capacity following six months of supervised, high intensity, intra‐dialytic resistance training (frequency: three times/week; 15 reps and 1 set/exercise).
Resting diastolic blood pressure was reported in ten studies (Analysis 1.8) (Deligiannis‐HI 1999; Deligiannis‐LI 1999; DePaul 2002; Goldberg 1983; Leehey 2009; Ouzouni 2009; Painter 2003; Toussaint 2008; Tsuyuki 2003; van Vilsteren 2005). There was no heterogeneity for either the three months or more than seven to 12 months data, however four to six months data showed significant heterogeneity. This was caused by Leehey 2009 who, contrary to all other four to six months data, showed significant improvement in walking capacity following six weeks of a supervised, mixed intensity walking program followed by 18 weeks unsupervised, mixed intensity walking program with the goal to increase step count by 10% each week. This finding is in concordance with the positive effects found for more than seven to 12 months exercise training (Analysis 1.8).
Resting systolic blood pressure was reported in nine studies and showed heterogeneity (Analysis 1.9) (Deligiannis‐HI 1999; Deligiannis‐LI 1999; DePaul 2002; Goldberg 1983; Leehey 2009; Ouzouni 2009; Painter 2003; Toussaint 2008; van Vilsteren 2005). Kouidi 2009 and Tsuyuki 2003 data showed inconsistency in direction of effect. Tsuyuki 2003 reported five months of low intensity cardiovascular exercise training two to three times/week increased resting systolic blood pressure. Kouidi 2009 reported 10 months of intra‐dialytic mixed cardiovascular and resistance training also increased resting systolic blood pressure. We were unable to determine the reason for this inconsistency in direction of effect.
Four studies had reported serum albumin as measure for nutrition (Koufaki 2002a; Castaneda 2001; Jong 2004; PEAK Study 2005). Data showed an inconsistency in the direction of effect when Koufaki 2002a was included in the meta‐analysis. In the study by Koufaki 2002a albumin levels decreased following three months of supervised, high intensity cardiovascular exercise whereas albumin levels increased in the three other studies. When we investigated possible explanations for this inconsistency, looking at high (Castaneda 2001; Koufaki 2002a; PEAK Study 2005) versus low intensity (Jong 2004); cardiovascular (Jong 2004; Koufaki 2002a) versus resistance training (Castaneda 2001; PEAK Study 2005); supervised (Castaneda 2001; Koufaki 2002a; PEAK Study 2005) versus unsupervised training (Jong 2004); and pre‐dialysis (Castaneda 2001; PEAK Study 2005) versus dialysis patients (Jong 2004; Koufaki 2002a), however the reasons remained unclear.
Transferrin had been used as an outcome measure in only two studies (Frey 1999; Castaneda 2001) and pooled data showed substantial heterogeneity. Castaneda 2001 showed statistically significant benefits on transferrin, whereas Frey 1999 found no change in transferrin levels following regular exercise training. Both studies used supervised, high intensity exercise, however Frey 1999 used regular cardiovascular exercise whereas Castaneda 2001 used regular resistance training. It is also possible that the difference in the duration of the exercise training (two months in Frey 1999 versus three months in Castaneda 2001) may explain the inconsistency in results.
Depression was reported in four studies (Analysis 1.27) (Carmack 1995; Kouidi 1997a; Ouzouni 2009; van Vilsteren 2005). Due to significant heterogeneity data could not be pooled across the different time periods. Ten weeks of cardiovascular exercise training of unknown intensity (Carmack 1995), 12 weeks of low intensity mixed cardiovascular and resistance training (van Vilsteren 2005) and six months of supervised high intensity cardiovascular training (Kouidi 1997a) had no significant effect on the level of depression. However 10 months of supervised, high intensity, mixed cardiovascular and resistance training (Ouzouni 2009) did show a significant improvement in the level of depression.
Sensitivity analyses
Sensitivity analyses were run on the primary outcomes of this systematic review and meta‐analysis. Data from at least 50 randomised participants had to be available when running the sensitivity analyses.
The sensitivity analysis was conducted based on study quality assessment (please see Characteristics of included studies). Nine studies were classified as having the highest risk of bias, CCC (Chatoth 2005; Dimeo 2007; Harter 1985; Koufaki 2003; Kouidi 2002b; Kouidi 2003a; Kouidi 2004a; Kouidi 2005; Lee 2001) and had been excluded from the initial meta‐analysis due to missing and or unclear data. When we also excluded those classified as ACC (Fitts 1995; Frey 1999) or BCC (Akiba 1995; Deligiannis 1999; Deligiannis‐HI 1999; Deligiannis‐LI 1999; Eidemak 1997; Fitts 1999; Goldberg 1983; Jong 2004, Kopple 2007a, Tsuyuki 2003), sensitivity analyses showed that findings reported above were unchanged in this analysis.
Assessment of publication bias
An assessment of publication bias was conducted for the main outcomes that contained enough study data and where a fixed‐effect model had been used. Funnel plots were visually assessed as reasonably symmetrical, indicating little publication or small study bias (see Figure 4; Figure 5; Figure 6).
4.
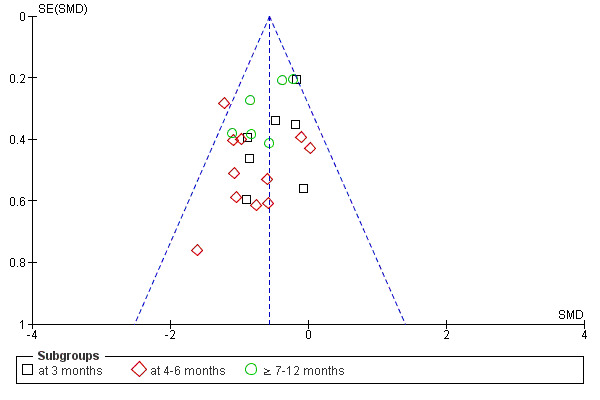
Funnel plot of comparison: 1 Any exercise versus control (no exercise/placebo exercise), outcome: 1.1 Aerobic capacity.
5.
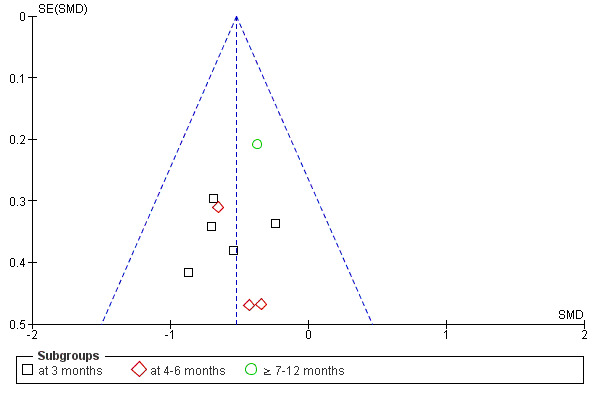
Funnel plot of comparison: 1 Any exercise versus control (no exercise/placebo exercise), outcome: 1.2 Muscular strength (high value = improved).
6.
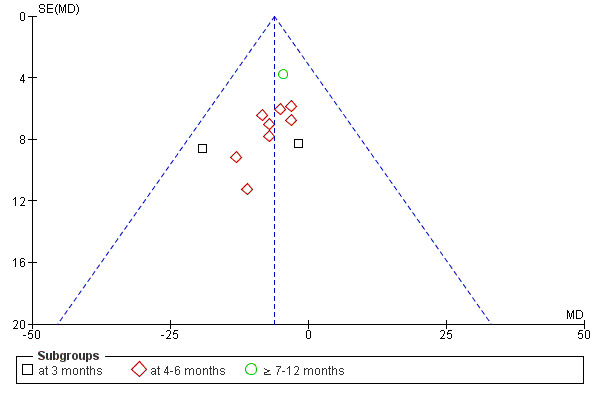
Funnel plot of comparison: 1 Any exercise versus control (no exercise/placebo exercise), outcome: 1.10 Heart rate: maximum [bpm].
Follow‐up
Three studies provided follow‐up data on the randomised groups (Carmack 1995; Carney 1987; DePaul 2002).
Carmack 1995 provided follow‐up aerobic capacity data four weeks after the end of the 10 week exercise training. During the 10 week observation period, aerobic capacity increased significantly in the exercise group whereas the control group's aerobic capacity had not changed. Four weeks after the end of the exercise training there was no significant difference in aerobic capacity between control and exercise group, showing that the exercisers' did not maintain their increased aerobic capacity at one month follow‐up.
Carney 1987 provided follow‐up depression data on the randomised groups 18 months after the end of the six month exercise training. The exercise and comparison groups' follow‐up data could not be compared since three participants in the control group started exercising during the follow‐up period. Follow‐up data for the exercise group showed continued low levels of depressed mood and significantly more performance of pleasant activities. All but one exerciser was continuing to exercise at 18 months, but less often than during the structured exercise program.
DePaul 2002 provided follow‐up data on aerobic capacity, muscular strength, walking capacity, and health‐related quality of life data on the randomised groups, five months after the end of the three month exercise training. There were no significant differences between the exercise and control groups, showing that the significant effects of the three month exercise training did not remain five months after the end of treatment. At the five month follow‐up, 41% of the control group and only 35% of the exercise training group were still doing home exercises.
Results from included studies completely or partly excluded from the meta‐analyses
Ten of the review's included studies were completely excluded from the meta‐analyses (Carney 1987; Chatoth 2005; Fitts 1999; Goldberg 1983; Harter 1985; Koufaki 2003; Kouidi 2002b; Kouidi 2003a; Kouidi 2004a; Kouidi 2005; Molsted 2004). Their individual data and reasons for exclusion are presented below and in Characteristics of included studies.
Carney 1987 was excluded due to missing outcome data (mean and SD for all outcomes). The study showed that six to 18 months regular high intensity cardiovascular exercise training significantly increased aerobic capacity and decreased depressed mood, and after 18 months of regular exercise training the participants performed significantly more pleasant activities than prior to the study. No changes were observed in the control group.
Dimeo 2007 was excluded because the number of patients in the exercise and control group were not reported.
Chatoth 2005 was excluded because all result data were missing. The study used 18 months of regular high intensity resistance training and its results have not been found.
Fitts 1999 SD data were missing for walking capacity and resting heart rate. The study used 12 months of regular low intensity cardiovascular exercise training and showed that exercise training increased walking capacity and health‐related quality of life, but did not affect resting heart rate enough to make it a statistically significant difference. No changes were observed in the control group.
Goldberg 1983 and Harter 1985 report findings concerning the same outcomes from the same study. They had studied effects of 12 months of regular high intensity cardiovascular exercise training on the following outcomes: aerobic capacity, resting blood pressure, lipids, glucose metabolism and psychosocial functioning. Similarity between exercise and control group at baseline was unclear concerning outcome measures. Due to missing data (mean and or SD for the different outcome measures, groups, and the number of participants analysed for each outcome measure) and to inconsistency between results presented in the text and those presented in tables or figures, it was decided that the results from Harter 1985 and Goldberg 1983 would be presented separately and not be included in the meta analysis. Their data showed that 12 months of high intensity cardiovascular exercise training significantly increased aerobic capacity, reduced depression, decreased dosages of antihypertensive medications, decreased plasma triglycerides, increased HDL cholesterol levels, and improved insulin sensitivity (increase in glucose disappearance rates in spite of decrease in fasting insulin levels). No changes were observed in the control group.
Kopple 2007a did not present the mean and SD for physical capacity at baseline and end of intervention for the cardiovascular exercise group, resistance training group, mixed cardiovascular and resistance training group and the control group. As there is no information regarding intensity or supervision, the data have not been included in these subgroup analysis.
Koufaki 2003 was excluded due to missing data for the control group and concerning number of participants in each group. The study used three months of regular high intensity cardiovascular exercise training + EPO versus control + EPO, and showed that the exercise training intervention increased aerobic capacity, peripheral muscle oxygen utilisation and activity of daily living‐related functional capacity. No changes were observed in the control group. The researchers underscore the importance of exercise training if the benefits of anaemia treatment are to be maximised.
Kouidi 2002b,Kouidi 2003a and Kouidi 2005 were all excluded due to missing data in the control group, and Kouidi 2004a was excluded as the mean and SD data for all outcomes and groups were missing. All four were abstracts that had been presented at the ERA‐EDTA Congress. The data from the completed studies were not to be found and the researcher did not have the missing data. Kouidi 2002b showed that 12 months regular cardiovascular exercise training (of unknown intensity) significantly increased the aerobic capacity, improved the heart rate variability and reduced the level of depression. Data for the control group were reported to have remained 'almost unchanged'. Kouidi 2003a used the same exercise intervention and showed increased aerobic capacity and improved cardiac vagal activity. Kouidi 2004a used six months of cardiovascular exercise training (of unknown intensity) and showed that the exercise intervention increased aerobic capacity by 19% and muscular strength by 20%. There was, however, no significant difference in any parameter of cardiac function between the intervention and control group. No changes in either outcome were observed in the control group. Kouidi 2005 used 10 months cardiovascular exercise training (of unknown intensity and frequency) and showed significant increase in aerobic capacity, health‐related quality of life and a reduced level of depression. The most severely depressed patients had the greatest beneficial outcomes from the exercise intervention. No changes were observed in the control group.
Matsumoto 2007 the mean and SD for serum albumin and health‐related quality of life at end of intervention is missing. Data were only presented in a figure.
Molsted 2004 data were presented as median (range) and it was therefore not possible to include the data. The study used five months of high intensity, mixed cardiovascular and resistance training twice a week (Characteristics of included studies) and showed that aerobic capacity, muscular strength and physical functioning increased significantly in the exercise group, with no significant change in the control group. Health‐related quality of life was assessed by SF‐36 and post‐intervention data from the exercise group showed improvement in three sub‐scales (physical function, bodily pain, physical component scale), but no difference between the control and exercise group concerning all other sub‐scales. The study also showed that the exercise intervention that had been used did not affect resting blood pressure or lipids. No changes were observed in the control group.
Some studies were included in the meta‐analysis but had missing data concerning some of their outcomes (i.e. no data for the control group or missing SD for an outcome measure). This information is presented in Characteristics of included studies and each study's results concerning these outcomes are presented below.
Eidemak 1997 mean and/or SD data were missing for some outcome measures. The study showed that 18 months of regular high intensity, cardiovascular exercise training did not significantly change either resting blood pressure or lipids. No changes were observed in the control group.
Goldberg 1983 mean, SD data and/or numbers analysed were missing for some outcome measures. The study showed that 12 months of progressive high intensity cardiovascular exercise training reduced fasting plasma triglyceride levels by 33%, VLDL lipoprotein triglyceride levels by 38% and VLDL lipoprotein cholesterol by 55%. HDL cholesterol levels increased by 16% and there was no change in either total cholesterol levels or in mean body mass. Exercise training also significantly improved scores on the Beck Depression Inventory. No changes were observed in the control group.
Jong 2004 mean and SD data were missing for some outcome measures. The study showed that three months of regular cardiovascular exercise training (of unknown intensity) had no effect on triglycerides, cholesterol, HDL cholesterol, or LDL cholesterol levels. No changes were observed in the control group.
Parsons 2004 mean and SD were missing for resting systolic and diastolic blood pressure. The study used two months of low intensity cardiovascular exercise training during haemodialysis and showed that this exercise intervention did not affect resting blood pressure or health‐related quality of life. The researchers did however observe that pulse pressure tended to increase in the control group but decrease in the exercise group, which might indicate that exercise training has beneficial effects on the cardiovascular system in adults with CKD. Seeing no effect of the exercise intervention on health‐related quality of life is argued by the researchers to be most likely caused by the short duration of the exercise intervention (two months) and the high‐functioning level that the study's study population had at baseline. No changes were observed in the control group.
Discussion
Results from this study show that all regular exercise training (regardless of type of exercise, intensity, length of intervention, or supervision) improves aerobic capacity, but it also showed that when aiming to increase aerobic capacity as effectively as possible in adults with CKD the following exercise regimen is recommended: four to six months supervised, regular (three sessions/week) high intensity mixed cardiovascular and resistance training lasting 30 to 90 minutes. To maintain this peak effect the patient has to continue with the regular exercise training intervention. This finding is in concordance with the recommended quantity and quality of exercise training for developing cardiorespiratory fitness in healthy adults (ACSM 1998). Modes of activities that were shown to improve aerobic capacity in adults with CKD were activities that use large muscle groups and that can be maintained continuously, such as cycling, walking, and jogging.
Muscular strength progressively reduces in adults with CKD. Adults with CKD were shown to improve their muscular strength by using any regular high intensity exercise training. Positive effects could be observed after only three months of regular exercise training. Whether the beneficial effect can be achieved by using a low intensity exercise intervention remains unclear as only one of included studies had used a low intensity exercise intervention. All types of exercise training showed positive effects of exercise training on muscular strength. Resistance training had a significant beneficial effect on muscular strength. There was however too few included studies using cardiovascular exercise or mixed cardiovascular and resistance training, to be able to draw conclusions concerning the type of exercise required for an optimal enhancement of muscular strength. Only two studies used unsupervised exercise (Koh 2010a; Painter 2002a). Painter 2002a used a resistance training program whereas Koh 2010a used a cardiovascular exercise training program. Pooled data showed significant beneficial effects on muscular strength. Severely reduced muscle endurance is a common problem among adults with CKD. Only two of the included studies had used muscular endurance as an outcome measure (Koufaki 2002a; Segura‐Orti 2009). More research focusing on the if and how exercise training can affect the muscular endurance are needed before conclusions can be drawn in this area.
Changing one's lifestyle is an important factor for the prevention, treatment and control of hypertension. Previous research have shown that exercise training is a cornerstone therapy and that the most blood pressure lowering effect of exercise training is observed when using regular (three sessions/week) low intensity (40% to 60%) dynamic cardiovascular exercise training (> 30 minutes/session) (ACSM 2004). Meta‐analyses have shown no effects of exercise frequency, type, intensity and duration of training on the positive blood pressure response in adults with hypertension and without CKD (Kelley 1997; Kelley 1999; Kelley 2001; Whelton 2002). In concordance with previous research, the present study shows that regular exercise training had a significant effect on resting blood pressure in adults with CKD. To achieve this effect the analysis showed that it is not possible to use any exercise (regardless of type of exercise, intensity, length of intervention, supervision or not). Subgroup analysis based on intensity, length of intervention and type of exercise training did however show that when using four to six months of high intensity, mixed cardiovascular and resistance training programme there was a significant decrease in resting systolic and diastolic blood pressure in adults with CKD. This decrease was approximately 4 to 7 mm Hg following regular exercise training. This is of importance as even a small reduction (2 mm Hg) in an average population's systolic blood pressure can reduce coronary heart disease, stroke and all‐cause mortality (ACSM 2004; Stamler 1989; Whelton 2002). To be able to detect smaller decreases in blood pressure, large enough sample sizes have to be used.
Even modest reductions in body mass indices can improve an individual's health (Goldstein 1992). In combination with reduced energy intake, regular exercise training is used as a strategy to affect body mass indices in adults with overweight or obesity. The optimal exercise regimen for these individuals has been shown to be a progressive increase of physical exercise training from 150 to 200 to 300 minutes of exercise training/week. Adopting more than 280 minutes of exercise training/week (e.g. >2000 kcal/week) has been shown to be important for maintaining weight loss in the long‐term (Evans 2007; Jakicic 1999; Jakicic 2001). However little is known about the difference in effects between different exercise regimens. Regular exercise training was not shown to significantly affect body mass indices in adults with CKD, except for one study with only 11 participants, and this result remained unchanged when we investigated type, intensity, intervention period and supervision of exercise. The result is however based on a relatively small sample size and further research is needed before drawing scientific conclusions concerning the effect that regular exercise training programmes can have on body mass indices. Also, it is well known that exercise training alone does not reduce weight and has to be combined with a reduced energy intake. In the present study body mass indices were used as an outcome measure, but the reader should be aware of that none of the included studies have used an intervention that was primarily designed for weight loss (e.g. there was no combined energy intake and exercise intervention).
Today, the main cause for CKD is diabetes mellitus. Mild to moderate intensity endurance and resistance exercise training (40% to 70% VO2 max ESKD) has been shown to have favourable effects on glucose control and insulin sensitivity in adults with type 2 diabetes (Albright 2000). These favourable effects are however a reflection of the last individual exercise bout rather than exercise training per se, and to sustain the favourable effects it is therefore important that the exercise training is regular (5 sessions/week)(Albright 2000). In the present study there was not enough data to draw scientific conclusions about the effect of regular exercise training on glucose metabolism in adults with CKD. The single RCT that had investigated this did not see any significant effect of 12 months regular, supervised, high intensity cardiovascular exercise training on glucose metabolism (Goldberg 1983). The study sample was however only on 13 randomised participants and the exercise regimen used differed from that recommended for adults with type 2 diabetes in order to affect glucose metabolism (Goldberg 1983). They used high intensity exercise training, whereas the exercise regimen that has been shown to be effective in adults with type 2 diabetes consists of low to moderate intensity exercise training at least three times/week and with a minimum cumulative energy expenditure of 1000 kcal/week (Albright 2000; Blair 1992; Gordon 1995). Also, the type of exercise training used by Goldberg 1983 was strictly cardiovascular, whereas today's exercise guidelines for adult with type 2 diabetes recommend that resistance training should be included as part of the exercise program (Albright 2000). Several studies (Fennicchia 2004; Fluckey 1994), have found that resistance training results in improved glucose tolerance and insulin sensitivity in normal and glucose‐intolerant adults. It has also been shown that a mixed cardiovascular and resistance training programme have significant beneficial effects on glucose metabolism in adults with type 2 diabetes (Maiorana 2002; Tokmatidis 2004). It is possible that a mixed cardiovascular and resistance training program would have affected the glucose metabolism in Goldberg 1983. Further research is necessary to investigate whether regular exercise training has the capacity to affect glucose metabolism in adults with CKD, and if so to investigate the exercise regimen required for the optimal enhancement.
Depression can be present when having CKD. Results from the present study indicate that 3 to 10 months supervised high or low intensity, mixed cardiovascular and resistance training interventions should be used when aiming to decrease level of depression. More research data are needed in order to draw conclusions concerning the effect of regular exercise training on level of depression in adults with CKD, and also to be able to compare the effects depending on the type, intensity, duration, and supervision of the exercise intervention.
Results from the present study show that there is insufficient research data from RCTs concerning several outcome measures that might be affected by regular exercise training. Future research should focus on designing RCTs evaluating the effects of various exercise regimens on the following outcome measures in adults with CKD: muscular endurance, muscle morphology and morphometrics, physical functioning (e.g. stair climbing), cardiovascular dimensions (e.g. arrhythmias), nutrition, systemic inflammation, level of physical activity in daily living, depression, lipids, glucose metabolism, drop‐out rates, compliance, adverse events and mortality. Future RCTs should also focus more on the effects of resistance training interventions and or mixed cardiovascular and resistance training as these exercise types has not been studied as much as cardiovascular exercise training. It would also be of interesting to study the effect of a regular exercise regimen versus a pharmacological treatment or as a complement to a pharmacological treatment, i.e. statin versus regular exercise regimen design to affect lipids, or the effect of a combination between statin and a regular exercise regimen designed to positively affect lipids.
This review has some potential limitations. First, in some studies the outcome measures were not blindly assessed and ITT analysis was not used in all studies. This could have inflated the apparent results (Hollis 1999; Jadad 1996). During the process of writing this review it also became evident that researchers and editors within this field need to improve the report of methodological and result information (i.e. method of randomisation, drop‐out rate, compliance to the intervention and control) that is important for the reader when assessing the quality of the study. The reader should be aware that in this review a study that may have been classified as having lower quality than it actually had as data and/or information was missing from the reports. During the review process a large number of exercise studies were excluded as participants had not been randomised. Future exercise studies in adults with CKD should therefore strive for randomisation of participants, which would increase knowledge of effects of various exercise regimens. Another problem was outcome measurement. For example muscular fitness (strength and endurance) was measured in several different ways (i.e. one repetition maximum or peak torque). This complicates comparisons between studies and also the meta‐analysis of studies results. Being able to achieve a consensus concerning which methods to be used when measuring muscular fitness and health‐related quality of life in adults with CKD would make it easier to compare results from different studies with one another and increase the quality of meta‐analysis and future research within this field.
Duration of exercise varied from three months (17 studies), four to six months (14 studies), and seven to 12 months (14 studies). Studies with longer duration of exercise intervention (12 to 24 months) are needed to be able to evaluate long‐term benefits (e.g. morbidity and mortality) of regular exercise training in adults with CKD. When evaluating the effects of regular exercise training the reader and researcher also have to bear in mind that there is also important intrinsic limitation to regular exercise training, including the reluctance of individuals to regularly adhere to a prescribed exercise training intervention. Some individuals have a low compliance to exercise training, whereas others have a high compliance. Most exercisers do however have a relatively good compliance in the beginning but gradually decreases the compliance to regular exercise training in a long‐term perspective. Clinical experience also shows that a high compliance to exercise training is usually achieved as long as the participant's exercise is supervised, but when the individual should continue to exercise on its own the compliance decreases. This was also seen in the studies in this review, where a follow‐up period was used. Future studies should focus on long‐term benefits of regular exercise training; on developing beneficial exercise and behavioural modification interventions with high compliance (also following the treatment); and include long‐term follow‐up of the treatment.
Authors' conclusions
Implications for practice.
Clinicians should inform adults with CKD that there is scientific evidence showing that by exercising regularly for > 30 minutes/session and three times/week they would improve their physical fitness, walking capacity, cardiovascular dimensions (e.g. blood pressure and heart rate), some nutritional parameters and health‐related quality of life. Beneficial effects are present in both adults with CKD stages 1 to 5, patients with dialysis (haemodialysis and peritoneal dialysis) and kidney transplant recipients. Clinicians should encourage adults with CKD to participate in regular exercise regimens. Exercise regimens should be based on the frequency, intensity and duration of exercise training as well as the type of activity and the individual's initial level of physical fitness. All these factors have to be taken into account when aiming to achieve the goal with the regular exercise training and or rehabilitation.
Implications for research.
Outcomes that need more research are muscular endurance, muscle morphology and morphometrics, physical functioning (e.g. stair climbing), cardiovascular dimensions (e.g. arrhythmias), nutrition (e.g. muscle mass), systemic inflammation, level of physical activity in daily living, depression, lipids, glucose metabolism, drop‐out rates, compliance, adverse events and mortality. Future RCTs should focus more on the effects of resistance training interventions and/or mixed cardiovascular and resistance training as these exercise types has not been studied as much as cardiovascular exercise training.
Acknowledgements
We acknowledge collaboration of researchers for providing data relating to their studies that were not reported on or were unclear in the publications. We especially thank chief librarian Marie Kallberg, librarian Barbro Winstrom, librarian Anelli Mondemo, it‐consultant Mikael Blad and library assistant RoseMarie Iggstrom (Karolinska University Hospital, Medical Library) and librarian Susanne Gustafsson (Karolinska Institutet Library) for assistance with the development of search strategies, sharing of expert knowledge and for continuous support. We would also like to thank the referees for their comments and feedback during the preparation fo this review. Finally, special thanks go to Narelle Willis, Ruth Mitchell and Giovanni Strippoli at the Cochrane Renal Group for responding to queries when being in need of statistical and methodological assistance. I (SH) especially thank Narelle Willis for excellent and encouraging support throughout the process of this review.
Appendices
Appendix 1. Electronic search strategies
| Database | Search terms |
| CENTRAL |
|
| MEDLINE |
|
| EMBASE |
|
| CINAHL |
|
| Webscience (Science citation index and Social science citation index) |
|
| BIOSIS |
|
| PEDRO |
|
| AMED |
|
| PsycINFO |
|
| Ageline |
|
| KoreaMed |
|
Appendix 2. Health‐related quality of life assessment
Health‐related quality of life assessment of adults with CKD enrolled in RCTs of regular exercise training versus control
| Study ID | Scale or tool | Validated¹ | Time of assessment | Result |
| High intensity cardiovascular exercise training | ||||
| Dimeo 2007 | The Medical Outcomes Short Form (SF‐36) questionnaire | Yes | Baseline and end of treatment (2 months) | Significant increase in total score in the exercise group, whereas no change in neither total score in the control group. |
| Kouidi 1997a | The Quality of Life Index (QLI) – Spitzer Index² | Yes | Baseline and end of treatment (6 months) | Significant increase in total score and in all sub‐scores in the exercise group, whereas no change in neither total score nor sub‐scores in the control group. |
| Matsumoto 2007 | The Medical Outcomes Short Form (SF‐36) questionnaire | Yes | Baseline and end of treatment (12 months) | Significant increase in total score and in the sub‐scores RF, RP, VT and MH in the exercise group, whereas no change in neither total score nor sub‐scores in the control group. |
| Painter 2002a | The Medical Outcomes Short Form (SF‐36) questionnaire³ | Yes | Baseline, 6 months and end of treatment (in total 12 months) | No significant difference in any score between the exercise‐ and control group |
| Painter 2002b | The Medical Outcomes Short Form (SF‐36) questionnaire³ | Yes | Baseline and end of treatment (5 months) | Significant increase of physical function score in the exercise group; no significant changes in other scores of the scale for neither the exercise‐ nor the control group. |
| Low intensity cardiovascular exercise training | ||||
| Koh 2010a | The Medical Outcomes Short Form (SF‐36) questionnaire | Yes | Baseline and end of treatment (6 months) | Significant increase in the sub‐score PF but no other sub‐score in the intra‐dialytic exercise group; and no change in any sub‐scores in the control group. |
| Koh 2010b | The Medical Outcomes Short Form (SF‐36) questionnaire | Yes | Baseline and end of treatment (6 months) | No significant increase in any of the sub‐scores in the home‐based exercise group, and no change in any sub‐scores in the control group. |
| Parsons 2004 | The Medical Outcomes Short Form (SF‐36) questionnaire³ | Yes | Baseline and end of treatment (2 months) | No significant difference in any score between the exercise‐ and control group or within a given group on any of the subscales. |
| Unknown intensity cardiovascular exercise training | ||||
| Jong 2004 | The Medical Outcomes Short Form (SF‐36) questionnaire³ | Yes | Baseline and end of treatment (3 months) | Significant increase of physical function score in the exercise group; the remaining subscales were not used. |
| Kouidi 2005 | The Quality of Life Index (QLI)² | Yes | Baseline and end of treatment (10 months) | Significant increase in total score QLI and LSI in the exercise group, whereas no change in the control group. No change in mental sub‐scores but a significant increase of physical function score (SF‐36) in the exercise group; and no changes in the control group. |
| Life Satisfactory Index, (LSI) | Unclear | |||
| The Medical Outcomes Short Form (SF‐36) questionnaire³ | Yes | |||
| High intensity resistance training | ||||
| Chen 2010 | The Medical Outcomes Short Form (SF‐36) questionnaire | Baseline and end of treatment (6 months) | Significant increase of physical function scores in the exercise group. No significant change in the mental component. The remaining subscales were not used. No significant changes in the control group. | |
| Johansen 2006 | The Medical Outcomes Short Form (SF‐36) questionnaire | Yes | Baseline and end of treatment (3 months) | Significant increase in self‐reported physical functioning on the PF‐scale following 3 months regular exercise (p=0.03). |
| Segura‐Orti 2009 | The Medical Outcomes Short Form (SF‐36) questionnaire | Yes | Baseline and end of treatment (6 months) | No significant change in any of the subscales neither in the exercise group nor the control group. |
| PEAK Study 2005 | The Medical Outcomes Short Form (SF‐36) questionnaire | Yes | Baseline and end of treatment (3 months) | Significant increase of physical function‐ and vitality scores in the exercise group. The remaining subscales were not used. No significant changes in the control group. |
| High intensity mixed cardiovascular and resistance training | ||||
| DePaul 2002 | The Medical Outcomes Short Form (SF‐36) questionnaire | Yes | Baseline, end of treatment (3 months) and for an additional 5 months without intervention | No significant difference in any score between the exercise‐ and control group |
| Fitts 1999 | Sickness Impact Profile (SIP) | Baseline, end of treatment (6 months) and for an additional 6 months without intervention | Significant increase of total score and physical score in pre‐uraemic exercise group versus control group. No significant changes in psychosocial score. No change in total score or sub‐scores in dialysis exercise‐ and control group. | |
| Molsted 2004 | The Medical Outcomes Short Form (SF‐36) questionnaire | Yes | Baseline and end of treatment (5 months) | Significant improvement in physical function, bodily pain and physical component scale; no significant changes in the other scores of the scale in the exercise group. No changes in the control group. |
| Ouzouni 2009 | The Medical Outcomes Short Form (SF‐36) questionnaire | Yes | Baseline and end of treatment (10 months) | Significant improvement in physical component scale and mental component scale; no significant changes in the other scores of the scales in the exercise group. No changes in the control group. |
| Low intensity mixed cardiovascular and resistance training | ||||
| van Vilsteren 2005 | The Dutch Version of the MOS Short‐Form General Health Survey (RAND‐36) | Yes | Baseline and end of treatment (3 months) | Significant improvement in the sub‐scores vitality, general health perception, and health change in the exercise group. No significant changes in the other scores of the scale. No changes in the control group. |
(¹) A codified scale for standard assessment of health‐related quality of life and whose validity has been tested in adults with CKD
(²) A disease specific scale
(³) A generic scale
Data and analyses
Comparison 1. Any exercise versus control (no exercise/placebo exercise).
| Outcome or subgroup title | No. of studies | No. of participants | Statistical method | Effect size |
|---|---|---|---|---|
| 1 Aerobic capacity | 24 | 847 | Std. Mean Difference (IV, Fixed, 95% CI) | ‐0.56 [‐0.70, ‐0.42] |
| 1.1 at 3 months | 7 | 241 | Std. Mean Difference (IV, Fixed, 95% CI) | ‐0.39 [‐0.65, ‐0.13] |
| 1.2 at 4‐6 months | 11 | 268 | Std. Mean Difference (IV, Fixed, 95% CI) | ‐0.81 [‐1.08, ‐0.54] |
| 1.3 ≥ 7‐12 months | 6 | 338 | Std. Mean Difference (IV, Fixed, 95% CI) | ‐0.52 [‐0.74, ‐0.30] |
| 2 Muscular strength (high value = improved) | 9 | 358 | Std. Mean Difference (IV, Fixed, 95% CI) | ‐0.52 [‐0.73, ‐0.31] |
| 2.1 at 3 months | 5 | 177 | Std. Mean Difference (IV, Fixed, 95% CI) | ‐0.60 [‐0.90, ‐0.29] |
| 2.2 at 4‐6 months | 3 | 86 | Std. Mean Difference (IV, Fixed, 95% CI) | ‐0.53 [‐0.97, ‐0.08] |
| 2.3 ≥ 7‐12 months | 1 | 95 | Std. Mean Difference (IV, Fixed, 95% CI) | ‐0.37 [‐0.78, 0.04] |
| 3 Muscular strength (low value = improved) | 3 | 148 | Std. Mean Difference (IV, Fixed, 95% CI) | 0.58 [0.25, 0.92] |
| 3.1 3 months | 2 | 123 | Std. Mean Difference (IV, Fixed, 95% CI) | 0.69 [0.32, 1.05] |
| 3.2 at 4‐6 months | 1 | 25 | Std. Mean Difference (IV, Fixed, 95% CI) | 0.04 [‐0.80, 0.88] |
| 3.3 ≥ 7‐12 months | 0 | 0 | Std. Mean Difference (IV, Fixed, 95% CI) | 0.0 [0.0, 0.0] |
| 4 Muscular endurance quadriceps: Sit‐to‐Stand‐to‐Sit‐60 | 2 | 52 | Mean Difference (IV, Fixed, 95% CI) | ‐3.64 [‐7.93, 0.65] |
| 4.1 at 3 months | 1 | 27 | Mean Difference (IV, Fixed, 95% CI) | ‐2.80 [‐7.89, 2.29] |
| 4.2 at 4‐6 months | 1 | 25 | Mean Difference (IV, Fixed, 95% CI) | ‐5.70 [‐13.68, 2.28] |
| 4.3 ≥ 7‐12 months | 0 | 0 | Mean Difference (IV, Fixed, 95% CI) | 0.0 [0.0, 0.0] |
| 5 Walking capacity | 7 | 191 | Std. Mean Difference (IV, Fixed, 95% CI) | ‐0.36 [‐0.65, ‐0.06] |
| 5.1 at 3 months | 4 | 122 | Std. Mean Difference (IV, Fixed, 95% CI) | ‐0.50 [‐0.86, ‐0.13] |
| 5.2 at 4‐6 months | 3 | 69 | Std. Mean Difference (IV, Fixed, 95% CI) | ‐0.09 [‐0.60, 0.41] |
| 5.3 ≥ 7‐12 months | 0 | 0 | Std. Mean Difference (IV, Fixed, 95% CI) | 0.0 [0.0, 0.0] |
| 6 Stair climbing capacity: stair climb test (22 steps) | 1 | Mean Difference (IV, Fixed, 95% CI) | Totals not selected | |
| 6.1 at 3 months | 1 | Mean Difference (IV, Fixed, 95% CI) | 0.0 [0.0, 0.0] | |
| 6.2 at 4‐6 months | 0 | Mean Difference (IV, Fixed, 95% CI) | 0.0 [0.0, 0.0] | |
| 6.3 ≥ 7‐12 months | 0 | Mean Difference (IV, Fixed, 95% CI) | 0.0 [0.0, 0.0] | |
| 7 ADL capacity | 3 | Std. Mean Difference (IV, Random, 95% CI) | Subtotals only | |
| 7.1 at 3 months | 0 | 0 | Std. Mean Difference (IV, Random, 95% CI) | 0.0 [0.0, 0.0] |
| 7.2 at 4‐6 months | 3 | 87 | Std. Mean Difference (IV, Random, 95% CI) | 0.05 [‐0.39, 0.48] |
| 7.3 ≥ 7‐12 months | 0 | 0 | Std. Mean Difference (IV, Random, 95% CI) | 0.0 [0.0, 0.0] |
| 8 Diastolic blood pressure: resting | 11 | 419 | Mean Difference (IV, Fixed, 95% CI) | 2.32 [0.59, 4.05] |
| 8.1 at 3 months | 3 | 144 | Mean Difference (IV, Fixed, 95% CI) | ‐0.88 [‐4.58, 2.81] |
| 8.2 at 4‐6 months | 4 | 78 | Mean Difference (IV, Fixed, 95% CI) | 1.39 [‐1.78, 4.56] |
| 8.3 ≥ 7‐12 months | 4 | 197 | Mean Difference (IV, Fixed, 95% CI) | 4.37 [1.87, 6.87] |
| 9 Systolic blood pressure: resting | 9 | 347 | Mean Difference (IV, Fixed, 95% CI) | 5.88 [2.28, 9.48] |
| 9.1 at 3 months | 3 | 144 | Mean Difference (IV, Fixed, 95% CI) | 6.38 [‐1.08, 13.84] |
| 9.2 at 4‐6 months | 3 | 49 | Mean Difference (IV, Fixed, 95% CI) | 10.46 [3.53, 17.40] |
| 9.3 ≥ 7‐12 months | 3 | 154 | Mean Difference (IV, Fixed, 95% CI) | 3.16 [‐1.94, 8.27] |
| 10 Heart rate: maximum | 11 | 229 | Mean Difference (IV, Fixed, 95% CI) | ‐6.19 [‐10.06, ‐2.32] |
| 10.1 at 3 months | 2 | 46 | Mean Difference (IV, Fixed, 95% CI) | ‐10.11 [‐21.79, 1.57] |
| 10.2 at 4‐6 months | 8 | 150 | Mean Difference (IV, Fixed, 95% CI) | ‐6.23 [‐11.15, ‐1.32] |
| 10.3 ≥ 7‐12 months | 1 | 33 | Mean Difference (IV, Fixed, 95% CI) | ‐4.5 [‐11.93, 2.93] |
| 11 Heart rate: resting | 7 | 179 | Mean Difference (IV, Fixed, 95% CI) | 3.96 [1.45, 6.48] |
| 11.1 at 3 months | 0 | 0 | Mean Difference (IV, Fixed, 95% CI) | 0.0 [0.0, 0.0] |
| 11.2 at 4‐6 months | 4 | 78 | Mean Difference (IV, Fixed, 95% CI) | 2.90 [‐2.02, 7.82] |
| 11.3 ≥ 7‐12 months | 3 | 101 | Mean Difference (IV, Fixed, 95% CI) | 4.34 [1.41, 7.27] |
| 12 Albumin | 3 | Mean Difference (IV, Fixed, 95% CI) | Subtotals only | |
| 12.1 at 3 months | 3 | 111 | Mean Difference (IV, Fixed, 95% CI) | ‐1.95 [‐3.28, ‐0.62] |
| 12.2 at 4‐6 months | 0 | 0 | Mean Difference (IV, Fixed, 95% CI) | 0.0 [0.0, 0.0] |
| 12.3 ≥ 7‐12 months | 0 | 0 | Mean Difference (IV, Fixed, 95% CI) | 0.0 [0.0, 0.0] |
| 13 Pre‐albumin | 3 | Mean Difference (IV, Fixed, 95% CI) | Subtotals only | |
| 13.1 at 3 months | 3 | 86 | Mean Difference (IV, Fixed, 95% CI) | ‐44.29 [‐71.78, ‐16.79] |
| 13.2 at 4‐6 months | 0 | 0 | Mean Difference (IV, Fixed, 95% CI) | 0.0 [0.0, 0.0] |
| 13.3 ≥ 7‐12 months | 0 | 0 | Mean Difference (IV, Fixed, 95% CI) | 0.0 [0.0, 0.0] |
| 14 SGA | 1 | Mean Difference (IV, Fixed, 95% CI) | Totals not selected | |
| 14.1 at 3 months | 1 | Mean Difference (IV, Fixed, 95% CI) | 0.0 [0.0, 0.0] | |
| 14.2 at 4‐6 months | 0 | Mean Difference (IV, Fixed, 95% CI) | 0.0 [0.0, 0.0] | |
| 14.3 ≥ 7‐12 months | 0 | Mean Difference (IV, Fixed, 95% CI) | 0.0 [0.0, 0.0] | |
| 15 Energy intake | 4 | 97 | Std. Mean Difference (IV, Fixed, 95% CI) | ‐0.47 [‐0.88, ‐0.05] |
| 15.1 at 3 months | 3 | 86 | Std. Mean Difference (IV, Fixed, 95% CI) | ‐0.57 [‐1.01, ‐0.13] |
| 15.2 at 4‐6 months | 1 | 11 | Std. Mean Difference (IV, Fixed, 95% CI) | 0.37 [‐0.87, 1.62] |
| 15.3 ≥ 7‐12 months | 0 | 0 | Std. Mean Difference (IV, Fixed, 95% CI) | 0.0 [0.0, 0.0] |
| 16 Protein intake | 2 | Std. Mean Difference (IV, Fixed, 95% CI) | Subtotals only | |
| 16.1 at 3 months | 2 | 60 | Std. Mean Difference (IV, Fixed, 95% CI) | ‐0.50 [‐1.01, 0.02] |
| 16.2 at 4‐6 months | 0 | 0 | Std. Mean Difference (IV, Fixed, 95% CI) | 0.0 [0.0, 0.0] |
| 16.3 ≥ 7‐12 months | 0 | 0 | Std. Mean Difference (IV, Fixed, 95% CI) | 0.0 [0.0, 0.0] |
| 17 Transferrin | 2 | Mean Difference (IV, Random, 95% CI) | Totals not selected | |
| 17.1 at 3 months | 2 | Mean Difference (IV, Random, 95% CI) | 0.0 [0.0, 0.0] | |
| 17.2 at 4‐6 months | 0 | Mean Difference (IV, Random, 95% CI) | 0.0 [0.0, 0.0] | |
| 17.3 ≥ 7‐12 months | 0 | Mean Difference (IV, Random, 95% CI) | 0.0 [0.0, 0.0] | |
| 18 Fat mass | 5 | 237 | Std. Mean Difference (IV, Fixed, 95% CI) | 0.08 [‐0.19, 0.34] |
| 18.1 at 3 months | 1 | 36 | Std. Mean Difference (IV, Fixed, 95% CI) | ‐0.26 [‐0.92, 0.40] |
| 18.2 at 4‐6 months | 3 | 106 | Std. Mean Difference (IV, Fixed, 95% CI) | 0.12 [‐0.30, 0.53] |
| 18.3 ≥ 7‐12 months | 1 | 95 | Std. Mean Difference (IV, Fixed, 95% CI) | 0.17 [‐0.24, 0.57] |
| 19 Waist circumference | 1 | Mean Difference (IV, Fixed, 95% CI) | Totals not selected | |
| 19.1 at 3 months | 1 | Mean Difference (IV, Fixed, 95% CI) | 0.0 [0.0, 0.0] | |
| 19.2 at 4‐6 months | 0 | Mean Difference (IV, Fixed, 95% CI) | 0.0 [0.0, 0.0] | |
| 19.3 ≥ 7‐12 months | 0 | Mean Difference (IV, Fixed, 95% CI) | 0.0 [0.0, 0.0] | |
| 20 Mid‐arm circumference | 1 | Mean Difference (IV, Fixed, 95% CI) | Totals not selected | |
| 20.1 at 3 months | 1 | Mean Difference (IV, Fixed, 95% CI) | 0.0 [0.0, 0.0] | |
| 20.2 at 4‐6 months | 0 | Mean Difference (IV, Fixed, 95% CI) | 0.0 [0.0, 0.0] | |
| 20.3 ≥ 7‐12 months | 0 | Mean Difference (IV, Fixed, 95% CI) | 0.0 [0.0, 0.0] | |
| 21 Mid‐calf circumference | 1 | Mean Difference (IV, Fixed, 95% CI) | Totals not selected | |
| 21.1 at 3 months | 1 | Mean Difference (IV, Fixed, 95% CI) | 0.0 [0.0, 0.0] | |
| 21.2 at 4‐6 months | 0 | Mean Difference (IV, Fixed, 95% CI) | 0.0 [0.0, 0.0] | |
| 21.3 ≥ 7‐12 months | 0 | Mean Difference (IV, Fixed, 95% CI) | 0.0 [0.0, 0.0] | |
| 22 Mid‐thigh circumference | 1 | Mean Difference (IV, Fixed, 95% CI) | Totals not selected | |
| 22.1 at 3 months | 1 | Mean Difference (IV, Fixed, 95% CI) | 0.0 [0.0, 0.0] | |
| 22.2 at 4‐6 months | 0 | Mean Difference (IV, Fixed, 95% CI) | 0.0 [0.0, 0.0] | |
| 22.3 ≥ 7‐12 months | 0 | Mean Difference (IV, Fixed, 95% CI) | 0.0 [0.0, 0.0] | |
| 23 Interleukin 6 | 1 | Mean Difference (IV, Fixed, 95% CI) | Totals not selected | |
| 23.1 at 3 months | 1 | Mean Difference (IV, Fixed, 95% CI) | 0.0 [0.0, 0.0] | |
| 23.2 at 4‐6 months | 0 | Mean Difference (IV, Fixed, 95% CI) | 0.0 [0.0, 0.0] | |
| 23.3 ≥ 7‐12 months | 0 | Mean Difference (IV, Fixed, 95% CI) | 0.0 [0.0, 0.0] | |
| 24 Lymphocytes (x 109 L) | 1 | Mean Difference (IV, Fixed, 95% CI) | Totals not selected | |
| 24.1 at 3 months | 1 | Mean Difference (IV, Fixed, 95% CI) | 0.0 [0.0, 0.0] | |
| 24.2 at 4‐6 months | 0 | Mean Difference (IV, Fixed, 95% CI) | 0.0 [0.0, 0.0] | |
| 24.3 ≥ 7‐12 months | 0 | Mean Difference (IV, Fixed, 95% CI) | 0.0 [0.0, 0.0] | |
| 25 Protein catabolic rate | 1 | Mean Difference (IV, Fixed, 95% CI) | Totals not selected | |
| 25.1 at 3 months | 1 | Mean Difference (IV, Fixed, 95% CI) | 0.0 [0.0, 0.0] | |
| 25.2 at 4‐6 months | 0 | Mean Difference (IV, Fixed, 95% CI) | 0.0 [0.0, 0.0] | |
| 25.3 ≥ 7‐12 months | 0 | Mean Difference (IV, Fixed, 95% CI) | 0.0 [0.0, 0.0] | |
| 26 Physical activity | 4 | 121 | Std. Mean Difference (IV, Fixed, 95% CI) | ‐0.43 [‐0.80, ‐0.05] |
| 26.1 at 3 months | 1 | 33 | Std. Mean Difference (IV, Fixed, 95% CI) | ‐0.33 [‐1.02, 0.36] |
| 26.2 at 4‐6 months | 3 | 88 | Std. Mean Difference (IV, Fixed, 95% CI) | ‐0.46 [‐0.90, ‐0.02] |
| 26.3 ≥ 7‐12 months | 0 | 0 | Std. Mean Difference (IV, Fixed, 95% CI) | 0.0 [0.0, 0.0] |
| 27 Depression | 4 | Std. Mean Difference (IV, Random, 95% CI) | Subtotals only | |
| 27.1 at 3 months | 2 | 117 | Std. Mean Difference (IV, Random, 95% CI) | 0.21 [‐0.47, 0.89] |
| 27.2 at 4‐6 months | 1 | 31 | Std. Mean Difference (IV, Random, 95% CI) | 0.71 [‐0.05, 1.47] |
| 27.3 ≥ 7‐12 months | 1 | 33 | Std. Mean Difference (IV, Random, 95% CI) | 1.99 [1.13, 2.85] |
| 28 Triglycerides | 4 | 100 | Mean Difference (IV, Fixed, 95% CI) | 0.05 [‐0.23, 0.33] |
| 28.1 at 3 months | 1 | 37 | Mean Difference (IV, Fixed, 95% CI) | ‐0.00 [‐0.32, 0.32] |
| 28.2 at 4‐6 months | 1 | 11 | Mean Difference (IV, Fixed, 95% CI) | 0.51 [‐0.83, 1.84] |
| 28.3 ≥ 7‐12 months | 2 | 52 | Mean Difference (IV, Fixed, 95% CI) | 0.17 [‐0.48, 0.81] |
| 29 Total cholesterol | 6 | 292 | Mean Difference (IV, Random, 95% CI) | 0.17 [‐0.12, 0.46] |
| 29.1 at 3 months | 2 | 133 | Mean Difference (IV, Random, 95% CI) | 0.29 [‐0.26, 0.83] |
| 29.2 at 4‐6 months | 1 | 11 | Mean Difference (IV, Random, 95% CI) | 0.47 [‐0.46, 1.39] |
| 29.3 ≥ 7‐12 months | 3 | 148 | Mean Difference (IV, Random, 95% CI) | ‐0.14 [‐0.62, 0.33] |
| 30 HDL cholesterol | 4 | 166 | Mean Difference (IV, Fixed, 95% CI) | ‐0.14 [‐0.23, ‐0.04] |
| 30.1 at 3 months | 1 | 37 | Mean Difference (IV, Fixed, 95% CI) | ‐0.07 [‐0.33, 0.19] |
| 30.2 at 4‐6 months | 1 | 11 | Mean Difference (IV, Fixed, 95% CI) | ‐0.21 [‐0.38, ‐0.04] |
| 30.3 ≥ 7‐12 months | 2 | 118 | Mean Difference (IV, Fixed, 95% CI) | ‐0.11 [‐0.24, 0.02] |
| 31 LDL cholesterol | 1 | Mean Difference (IV, Fixed, 95% CI) | Totals not selected | |
| 31.1 at 3 months | 0 | Mean Difference (IV, Fixed, 95% CI) | 0.0 [0.0, 0.0] | |
| 31.2 at 4‐6 months | 1 | Mean Difference (IV, Fixed, 95% CI) | 0.0 [0.0, 0.0] | |
| 31.3 at >7‐12 months | 0 | Mean Difference (IV, Fixed, 95% CI) | 0.0 [0.0, 0.0] | |
| 32 Type I muscle fibre area | 1 | Mean Difference (IV, Fixed, 95% CI) | Totals not selected | |
| 32.1 at 3 months | 1 | Mean Difference (IV, Fixed, 95% CI) | 0.0 [0.0, 0.0] | |
| 32.2 at 4‐6 months | 0 | Mean Difference (IV, Fixed, 95% CI) | 0.0 [0.0, 0.0] | |
| 32.3 ≥ 7‐12 months | 0 | Mean Difference (IV, Fixed, 95% CI) | 0.0 [0.0, 0.0] | |
| 33 Mid‐thigh muscle area | 4 | 162 | Mean Difference (IV, Fixed, 95% CI) | ‐7.51 [‐11.37, ‐3.65] |
| 33.1 at 3 months | 3 | 111 | Mean Difference (IV, Fixed, 95% CI) | ‐3.22 [‐9.67, 3.24] |
| 33.2 at 4‐6 months | 1 | 51 | Mean Difference (IV, Fixed, 95% CI) | ‐9.90 [‐14.72, ‐5.08] |
| 33.3 ≥ 7‐12 months | 0 | 0 | Mean Difference (IV, Fixed, 95% CI) | 0.0 [0.0, 0.0] |
| 34 Thigh muscle attenuation (Hounsfield units) | 1 | Mean Difference (IV, Fixed, 95% CI) | Totals not selected | |
| 34.1 at 3 months | 1 | Mean Difference (IV, Fixed, 95% CI) | 0.0 [0.0, 0.0] | |
| 34.2 at 4‐6 months | 0 | Mean Difference (IV, Fixed, 95% CI) | 0.0 [0.0, 0.0] | |
| 34.3 ≥ 7‐12 months | 0 | Mean Difference (IV, Fixed, 95% CI) | 0.0 [0.0, 0.0] | |
| 35 HRV index | 1 | Mean Difference (IV, Fixed, 95% CI) | Totals not selected | |
| 35.1 at 3 months | 0 | Mean Difference (IV, Fixed, 95% CI) | 0.0 [0.0, 0.0] | |
| 35.2 at 4‐6 months | 1 | Mean Difference (IV, Fixed, 95% CI) | 0.0 [0.0, 0.0] | |
| 35.3 ≥ 7‐12 months | 0 | Mean Difference (IV, Fixed, 95% CI) | 0.0 [0.0, 0.0] | |
| 36 Mean cardiac R‐R interval | 2 | 119 | Mean Difference (IV, Fixed, 95% CI) | ‐0.06 [‐0.09, ‐0.02] |
| 36.1 at 3 months | 0 | 0 | Mean Difference (IV, Fixed, 95% CI) | 0.0 [0.0, 0.0] |
| 36.2 at 4‐6 months | 1 | 60 | Mean Difference (IV, Fixed, 95% CI) | ‐0.05 [‐0.10, ‐0.00] |
| 36.3 ≥ 7‐12 months | 1 | 59 | Mean Difference (IV, Fixed, 95% CI) | ‐0.07 [‐0.12, ‐0.02] |
| 37 SDNN | 2 | 119 | Mean Difference (IV, Fixed, 95% CI) | ‐0.02 [‐0.03, ‐0.01] |
| 37.1 at 3 months | 0 | 0 | Mean Difference (IV, Fixed, 95% CI) | 0.0 [0.0, 0.0] |
| 37.2 at 4‐6 months | 1 | 60 | Mean Difference (IV, Fixed, 95% CI) | ‐0.02 [‐0.04, ‐0.00] |
| 37.3 ≥ 7‐12 months | 1 | 59 | Mean Difference (IV, Fixed, 95% CI) | ‐0.02 [‐0.03, ‐0.01] |
| 38 Arrhythmias: Lown class > II (no) | 1 | Risk Ratio (M‐H, Fixed, 95% CI) | Totals not selected | |
| 38.1 at 3 months | 0 | Risk Ratio (M‐H, Fixed, 95% CI) | 0.0 [0.0, 0.0] | |
| 38.2 at 4‐6 months | 1 | Risk Ratio (M‐H, Fixed, 95% CI) | 0.0 [0.0, 0.0] | |
| 38.3 ≥ 7‐12 months | 0 | Risk Ratio (M‐H, Fixed, 95% CI) | 0.0 [0.0, 0.0] | |
| 39 Left ventricular internal dimension at end‐diastole | 2 | Mean Difference (IV, Fixed, 95% CI) | Subtotals only | |
| 39.1 at 3 months | 0 | 0 | Mean Difference (IV, Fixed, 95% CI) | 0.0 [0.0, 0.0] |
| 39.2 at 4‐6 months | 2 | 38 | Mean Difference (IV, Fixed, 95% CI) | ‐1.44 [‐4.94, 2.06] |
| 39.3 ≥ 7‐12 months | 0 | 0 | Mean Difference (IV, Fixed, 95% CI) | 0.0 [0.0, 0.0] |
| 40 Left ventricular internal dimension at end‐systole | 2 | Mean Difference (IV, Fixed, 95% CI) | Subtotals only | |
| 40.1 at 3 months | 0 | 0 | Mean Difference (IV, Fixed, 95% CI) | 0.0 [0.0, 0.0] |
| 40.2 at 4‐6 months | 2 | 38 | Mean Difference (IV, Fixed, 95% CI) | 0.06 [‐3.16, 3.27] |
| 40.3 ≥ 7‐12 months | 0 | 0 | Mean Difference (IV, Fixed, 95% CI) | 0.0 [0.0, 0.0] |
| 41 Intraventricular septal thickness at end‐diastole | 2 | Mean Difference (IV, Fixed, 95% CI) | Subtotals only | |
| 41.1 at 3 months | 0 | 0 | Mean Difference (IV, Fixed, 95% CI) | 0.0 [0.0, 0.0] |
| 41.2 at 4‐6 months | 2 | 38 | Mean Difference (IV, Fixed, 95% CI) | 0.04 [‐1.28, 1.36] |
| 41.3 ≥ 7‐12 months | 0 | 0 | Mean Difference (IV, Fixed, 95% CI) | 0.0 [0.0, 0.0] |
| 42 Left ventricular posterior wall thickness at end‐diastole | 2 | Mean Difference (IV, Fixed, 95% CI) | Subtotals only | |
| 42.1 at 3 months | 0 | 0 | Mean Difference (IV, Fixed, 95% CI) | 0.0 [0.0, 0.0] |
| 42.2 at 4‐6 months | 2 | 38 | Mean Difference (IV, Fixed, 95% CI) | 0.20 [‐0.93, 1.33] |
| 42.3 ≥ 7‐12 months | 0 | 0 | Mean Difference (IV, Fixed, 95% CI) | 0.0 [0.0, 0.0] |
| 43 Left ventricular mass | 2 | Mean Difference (IV, Fixed, 95% CI) | Subtotals only | |
| 43.1 at 3 months | 0 | 0 | Mean Difference (IV, Fixed, 95% CI) | 0.0 [0.0, 0.0] |
| 43.2 at 4‐6 months | 2 | 38 | Mean Difference (IV, Fixed, 95% CI) | ‐5.66 [‐50.23, 38.91] |
| 43.3 ≥ 7‐12 months | 0 | 0 | Mean Difference (IV, Fixed, 95% CI) | 0.0 [0.0, 0.0] |
| 44 Left ventricular mass index | 3 | 97 | Mean Difference (IV, Fixed, 95% CI) | ‐1.77 [‐7.26, 3.73] |
| 44.1 at 3 months | 0 | 0 | Mean Difference (IV, Fixed, 95% CI) | 0.0 [0.0, 0.0] |
| 44.2 at 4‐6 months | 2 | 38 | Mean Difference (IV, Fixed, 95% CI) | ‐10.44 [‐34.79, 13.90] |
| 44.3 ≥ 7‐12 months | 1 | 59 | Mean Difference (IV, Fixed, 95% CI) | ‐1.30 [‐6.94, 4.34] |
| 45 Fasting plasma glucose | 1 | Mean Difference (IV, Fixed, 95% CI) | Totals not selected | |
| 45.1 at 3 months | 0 | Mean Difference (IV, Fixed, 95% CI) | 0.0 [0.0, 0.0] | |
| 45.2 at 4‐6 months | 0 | Mean Difference (IV, Fixed, 95% CI) | 0.0 [0.0, 0.0] | |
| 45.3 ≥ 7‐12 months | 1 | Mean Difference (IV, Fixed, 95% CI) | 0.0 [0.0, 0.0] | |
| 46 Fasting plasma insulin | 1 | Mean Difference (IV, Fixed, 95% CI) | Totals not selected | |
| 46.1 at 3 months | 0 | Mean Difference (IV, Fixed, 95% CI) | 0.0 [0.0, 0.0] | |
| 46.2 at 4‐6 months | 0 | Mean Difference (IV, Fixed, 95% CI) | 0.0 [0.0, 0.0] | |
| 46.3 ≥ 7‐12 months | 1 | Mean Difference (IV, Fixed, 95% CI) | 0.0 [0.0, 0.0] | |
| 47 Glucose disappearance | 1 | Mean Difference (IV, Fixed, 95% CI) | Totals not selected | |
| 47.1 at 3 months | 0 | Mean Difference (IV, Fixed, 95% CI) | 0.0 [0.0, 0.0] | |
| 47.2 at 4‐6 months | 0 | Mean Difference (IV, Fixed, 95% CI) | 0.0 [0.0, 0.0] | |
| 47.3 ≥ 7‐12 months | 1 | Mean Difference (IV, Fixed, 95% CI) | 0.0 [0.0, 0.0] |
Comparison 2. High intensity (≥ 60%) exercise versus control (no exercise/placebo exercise).
| Outcome or subgroup title | No. of studies | No. of participants | Statistical method | Effect size |
|---|---|---|---|---|
| 1 Aerobic capacity | 17 | 647 | Std. Mean Difference (IV, Fixed, 95% CI) | ‐0.61 [‐0.77, ‐0.45] |
| 1.1 at 3 months | 4 | 102 | Std. Mean Difference (IV, Fixed, 95% CI) | ‐0.54 [‐0.94, ‐0.13] |
| 1.2 at 4‐6 months | 7 | 207 | Std. Mean Difference (IV, Fixed, 95% CI) | ‐0.82 [‐1.12, ‐0.53] |
| 1.3 ≥ 7‐12 months | 6 | 338 | Std. Mean Difference (IV, Fixed, 95% CI) | ‐0.52 [‐0.74, ‐0.30] |
| 2 Muscular strength (high value = improved) | 8 | 322 | Std. Mean Difference (IV, Fixed, 95% CI) | ‐0.50 [‐0.72, ‐0.27] |
| 2.1 at 3 months | 4 | 140 | Std. Mean Difference (IV, Fixed, 95% CI) | ‐0.57 [‐0.91, ‐0.23] |
| 2.2 at 4‐6 months | 3 | 87 | Std. Mean Difference (IV, Fixed, 95% CI) | ‐0.53 [‐0.97, ‐0.08] |
| 2.3 ≥ 7‐12 months | 1 | 95 | Std. Mean Difference (IV, Fixed, 95% CI) | ‐0.37 [‐0.78, 0.04] |
| 3 Muscular strength (low value = improved) | 3 | 148 | Std. Mean Difference (IV, Fixed, 95% CI) | 0.58 [0.25, 0.92] |
| 3.1 3 months | 2 | 123 | Std. Mean Difference (IV, Fixed, 95% CI) | 0.69 [0.32, 1.05] |
| 3.2 at 4‐6 months | 1 | 25 | Std. Mean Difference (IV, Fixed, 95% CI) | 0.04 [‐0.80, 0.88] |
| 3.3 ≥ 7‐12 months | 0 | 0 | Std. Mean Difference (IV, Fixed, 95% CI) | 0.0 [0.0, 0.0] |
| 4 Muscular endurance quadriceps: Sit‐to‐Stand‐to‐Sit‐60 | 2 | 52 | Mean Difference (IV, Fixed, 95% CI) | ‐3.64 [‐7.93, 0.65] |
| 4.1 at 3 months | 1 | 27 | Mean Difference (IV, Fixed, 95% CI) | ‐2.80 [‐7.89, 2.29] |
| 4.2 at 4‐6 months | 1 | 25 | Mean Difference (IV, Fixed, 95% CI) | ‐5.70 [‐13.68, 2.28] |
| 4.3 ≥ 7‐12 months | 0 | 0 | Mean Difference (IV, Fixed, 95% CI) | 0.0 [0.0, 0.0] |
| 5 Walking capacity | 7 | 191 | Std. Mean Difference (IV, Random, 95% CI) | ‐0.36 [‐0.65, ‐0.06] |
| 5.1 at 3 months | 4 | 122 | Std. Mean Difference (IV, Random, 95% CI) | ‐0.50 [‐0.86, ‐0.13] |
| 5.2 at 4‐6 months | 3 | 69 | Std. Mean Difference (IV, Random, 95% CI) | ‐0.10 [‐0.79, 0.59] |
| 5.3 ≥ 7‐12 months | 0 | 0 | Std. Mean Difference (IV, Random, 95% CI) | 0.0 [0.0, 0.0] |
| 6 Stair climbing capacity: stair climb test (22 steps) | 1 | Mean Difference (IV, Random, 95% CI) | Totals not selected | |
| 6.1 at 3 months | 1 | Mean Difference (IV, Random, 95% CI) | 0.0 [0.0, 0.0] | |
| 6.2 at 4‐6 months | 0 | Mean Difference (IV, Random, 95% CI) | 0.0 [0.0, 0.0] | |
| 6.3 ≥ 7‐12 months | 0 | Mean Difference (IV, Random, 95% CI) | 0.0 [0.0, 0.0] | |
| 7 ADL capacity | 3 | Std. Mean Difference (IV, Fixed, 95% CI) | Subtotals only | |
| 7.1 at 3 months | 0 | 0 | Std. Mean Difference (IV, Fixed, 95% CI) | 0.0 [0.0, 0.0] |
| 7.2 at 4‐6 months | 3 | 88 | Std. Mean Difference (IV, Fixed, 95% CI) | 0.05 [‐0.39, 0.48] |
| 7.3 ≥ 7‐12 months | 0 | 0 | Std. Mean Difference (IV, Fixed, 95% CI) | 0.0 [0.0, 0.0] |
| 8 Diastolic blood pressure: resting | 6 | 254 | Mean Difference (IV, Fixed, 95% CI) | 3.98 [1.90, 6.05] |
| 8.1 at 3 months | 1 | 29 | Mean Difference (IV, Fixed, 95% CI) | 3.5 [‐4.02, 11.02] |
| 8.2 at 4‐6 months | 1 | 28 | Mean Difference (IV, Fixed, 95% CI) | 3.0 [‐1.27, 7.27] |
| 8.3 ≥ 7‐12 months | 4 | 197 | Mean Difference (IV, Fixed, 95% CI) | 4.37 [1.87, 6.87] |
| 9 Systolic blood pressure: resting | 5 | 211 | Mean Difference (IV, Fixed, 95% CI) | 4.60 [0.37, 8.83] |
| 9.1 at 3 months | 1 | 29 | Mean Difference (IV, Fixed, 95% CI) | 7.10 [‐7.20, 21.40] |
| 9.2 at 4‐6 months | 1 | 28 | Mean Difference (IV, Fixed, 95% CI) | 8.0 [‐0.89, 16.89] |
| 9.3 ≥ 7‐12 months | 3 | 154 | Mean Difference (IV, Fixed, 95% CI) | 3.16 [‐1.94, 8.27] |
| 10 Heart rate: maximum | 7 | 169 | Mean Difference (IV, Fixed, 95% CI) | ‐6.30 [‐10.76, ‐1.84] |
| 10.1 at 3 months | 2 | 46 | Mean Difference (IV, Fixed, 95% CI) | ‐10.11 [‐21.79, 1.57] |
| 10.2 at 4‐6 months | 4 | 90 | Mean Difference (IV, Fixed, 95% CI) | ‐6.49 [‐12.83, ‐0.15] |
| 10.3 ≥ 7‐12 months | 1 | 33 | Mean Difference (IV, Fixed, 95% CI) | ‐4.5 [‐11.93, 2.93] |
| 11 Heart rate: resting | 4 | 129 | Mean Difference (IV, Random, 95% CI) | 3.90 [0.60, 7.20] |
| 11.1 at 3 months | 0 | 0 | Mean Difference (IV, Random, 95% CI) | 0.0 [0.0, 0.0] |
| 11.2 at 4‐6 months | 1 | 28 | Mean Difference (IV, Random, 95% CI) | 4.5 [‐2.03, 11.03] |
| 11.3 ≥ 7‐12 months | 3 | 101 | Mean Difference (IV, Random, 95% CI) | 3.02 [‐1.89, 7.94] |
| 12 Albumin | 2 | Mean Difference (IV, Random, 95% CI) | Subtotals only | |
| 12.1 at 3 months | 2 | 75 | Mean Difference (IV, Random, 95% CI) | ‐1.46 [‐2.89, ‐0.04] |
| 12.2 at 4‐6 months | 0 | 0 | Mean Difference (IV, Random, 95% CI) | 0.0 [0.0, 0.0] |
| 12.3 ≥ 7‐12 months | 0 | 0 | Mean Difference (IV, Random, 95% CI) | 0.0 [0.0, 0.0] |
| 13 Pre‐albumin | 3 | Mean Difference (IV, Fixed, 95% CI) | Subtotals only | |
| 13.1 at 3 months | 3 | 86 | Mean Difference (IV, Fixed, 95% CI) | ‐44.02 [‐71.52, ‐16.53] |
| 13.2 at 4‐6 months | 0 | 0 | Mean Difference (IV, Fixed, 95% CI) | 0.0 [0.0, 0.0] |
| 13.3 ≥ 7‐12 months | 0 | 0 | Mean Difference (IV, Fixed, 95% CI) | 0.0 [0.0, 0.0] |
| 14 SGA | 1 | Mean Difference (IV, Random, 95% CI) | Totals not selected | |
| 14.1 at 3 months | 1 | Mean Difference (IV, Random, 95% CI) | 0.0 [0.0, 0.0] | |
| 14.2 at 4‐6 months | 0 | Mean Difference (IV, Random, 95% CI) | 0.0 [0.0, 0.0] | |
| 14.3 ≥ 7‐12 months | 0 | Mean Difference (IV, Random, 95% CI) | 0.0 [0.0, 0.0] | |
| 15 Energy intake | 3 | Std. Mean Difference (IV, Random, 95% CI) | Subtotals only | |
| 15.1 at 3 months | 3 | 86 | Std. Mean Difference (IV, Random, 95% CI) | ‐0.57 [‐1.01, ‐0.13] |
| 15.2 at 4‐6 months | 0 | 0 | Std. Mean Difference (IV, Random, 95% CI) | 0.0 [0.0, 0.0] |
| 15.3 ≥ 7‐12 months | 0 | 0 | Std. Mean Difference (IV, Random, 95% CI) | 0.0 [0.0, 0.0] |
| 16 Protein intake | 3 | Std. Mean Difference (IV, Fixed, 95% CI) | Subtotals only | |
| 16.1 at 3 months | 3 | 86 | Std. Mean Difference (IV, Fixed, 95% CI) | ‐0.34 [‐0.77, 0.09] |
| 16.2 at 4‐6 months | 0 | 0 | Std. Mean Difference (IV, Fixed, 95% CI) | 0.0 [0.0, 0.0] |
| 16.3 ≥ 7‐12 months | 0 | 0 | Std. Mean Difference (IV, Fixed, 95% CI) | 0.0 [0.0, 0.0] |
| 17 Transferrin | 1 | Mean Difference (IV, Random, 95% CI) | Totals not selected | |
| 17.1 at 3 months | 1 | Mean Difference (IV, Random, 95% CI) | 0.0 [0.0, 0.0] | |
| 17.2 at 4‐6 months | 0 | Mean Difference (IV, Random, 95% CI) | 0.0 [0.0, 0.0] | |
| 17.3 ≥ 7‐12 months | 0 | Mean Difference (IV, Random, 95% CI) | 0.0 [0.0, 0.0] | |
| 18 Fat mass | 3 | 175 | Std. Mean Difference (IV, Random, 95% CI) | 0.12 [‐0.17, 0.42] |
| 18.1 at 3 months | 1 | 36 | Std. Mean Difference (IV, Random, 95% CI) | ‐0.26 [‐0.92, 0.40] |
| 18.2 at 4‐6 months | 1 | 44 | Std. Mean Difference (IV, Random, 95% CI) | 0.35 [‐0.25, 0.94] |
| 18.3 ≥ 7‐12 months | 1 | 95 | Std. Mean Difference (IV, Random, 95% CI) | 0.17 [‐0.24, 0.57] |
| 19 Waist circumference | 1 | Mean Difference (IV, Random, 95% CI) | Totals not selected | |
| 19.1 at 3 months | 1 | Mean Difference (IV, Random, 95% CI) | 0.0 [0.0, 0.0] | |
| 19.2 at 4‐6 months | 0 | Mean Difference (IV, Random, 95% CI) | 0.0 [0.0, 0.0] | |
| 19.3 ≥ 7‐12 months | 0 | Mean Difference (IV, Random, 95% CI) | 0.0 [0.0, 0.0] | |
| 20 Mid‐arm circumference | 1 | Mean Difference (IV, Random, 95% CI) | Totals not selected | |
| 20.1 at 3 months | 1 | Mean Difference (IV, Random, 95% CI) | 0.0 [0.0, 0.0] | |
| 20.2 at 4‐6 months | 0 | Mean Difference (IV, Random, 95% CI) | 0.0 [0.0, 0.0] | |
| 20.3 ≥ 7‐12 months | 0 | Mean Difference (IV, Random, 95% CI) | 0.0 [0.0, 0.0] | |
| 21 Mid‐calf circumference | 1 | Mean Difference (IV, Random, 95% CI) | Totals not selected | |
| 21.1 at 3 months | 1 | Mean Difference (IV, Random, 95% CI) | 0.0 [0.0, 0.0] | |
| 21.2 at 4‐6 months | 0 | Mean Difference (IV, Random, 95% CI) | 0.0 [0.0, 0.0] | |
| 21.3 ≥ 7‐12 months | 0 | Mean Difference (IV, Random, 95% CI) | 0.0 [0.0, 0.0] | |
| 22 Mid‐thigh circumference | 1 | Mean Difference (IV, Fixed, 95% CI) | Totals not selected | |
| 22.1 at 3 months | 1 | Mean Difference (IV, Fixed, 95% CI) | 0.0 [0.0, 0.0] | |
| 22.2 at 4‐6 months | 0 | Mean Difference (IV, Fixed, 95% CI) | 0.0 [0.0, 0.0] | |
| 22.3 ≥ 7‐12 months | 0 | Mean Difference (IV, Fixed, 95% CI) | 0.0 [0.0, 0.0] | |
| 23 Interleukin 6 | 1 | Mean Difference (IV, Random, 95% CI) | Totals not selected | |
| 23.1 at 3 months | 1 | Mean Difference (IV, Random, 95% CI) | 0.0 [0.0, 0.0] | |
| 23.2 at 4‐6 months | 0 | Mean Difference (IV, Random, 95% CI) | 0.0 [0.0, 0.0] | |
| 23.3 ≥ 7‐12 months | 0 | Mean Difference (IV, Random, 95% CI) | 0.0 [0.0, 0.0] | |
| 24 Lymphocytes (x 109 L) | 1 | Mean Difference (IV, Random, 95% CI) | Totals not selected | |
| 24.1 at 3 months | 1 | Mean Difference (IV, Random, 95% CI) | 0.0 [0.0, 0.0] | |
| 24.2 at 4‐6 months | 0 | Mean Difference (IV, Random, 95% CI) | 0.0 [0.0, 0.0] | |
| 24.3 ≥ 7‐12 months | 0 | Mean Difference (IV, Random, 95% CI) | 0.0 [0.0, 0.0] | |
| 25 Protein catabolic rate | 1 | Mean Difference (IV, Fixed, 95% CI) | Totals not selected | |
| 25.1 at 3 months | 1 | Mean Difference (IV, Fixed, 95% CI) | 0.0 [0.0, 0.0] | |
| 25.2 at 4‐6 months | 0 | Mean Difference (IV, Fixed, 95% CI) | 0.0 [0.0, 0.0] | |
| 25.3 ≥ 7‐12 months | 0 | Mean Difference (IV, Fixed, 95% CI) | 0.0 [0.0, 0.0] | |
| 26 Physical activity | 4 | 121 | Std. Mean Difference (IV, Random, 95% CI) | ‐0.43 [‐0.80, ‐0.05] |
| 26.1 at 3 months | 1 | 33 | Std. Mean Difference (IV, Random, 95% CI) | ‐0.33 [‐1.02, 0.36] |
| 26.2 at 4‐6 months | 3 | 88 | Std. Mean Difference (IV, Random, 95% CI) | ‐0.46 [‐0.90, ‐0.02] |
| 26.3 ≥ 7‐12 months | 0 | 0 | Std. Mean Difference (IV, Random, 95% CI) | 0.0 [0.0, 0.0] |
| 27 Depression | 2 | Std. Mean Difference (IV, Random, 95% CI) | Totals not selected | |
| 27.1 at 3 months | 0 | Std. Mean Difference (IV, Random, 95% CI) | 0.0 [0.0, 0.0] | |
| 27.2 at 4‐6 months | 1 | Std. Mean Difference (IV, Random, 95% CI) | 0.0 [0.0, 0.0] | |
| 27.3 ≥ 7‐12 months | 1 | Std. Mean Difference (IV, Random, 95% CI) | 0.0 [0.0, 0.0] | |
| 28 Triglycerides | 2 | Mean Difference (IV, Random, 95% CI) | Subtotals only | |
| 28.1 at 3 months | 0 | 0 | Mean Difference (IV, Random, 95% CI) | 0.0 [0.0, 0.0] |
| 28.2 at 4‐6 months | 0 | 0 | Mean Difference (IV, Random, 95% CI) | 0.0 [0.0, 0.0] |
| 28.3 ≥ 7‐12 months | 2 | 52 | Mean Difference (IV, Random, 95% CI) | 0.22 [‐0.43, 0.86] |
| 29 Total cholesterol | 3 | Mean Difference (IV, Fixed, 95% CI) | Subtotals only | |
| 29.1 at 3 months | 0 | 0 | Mean Difference (IV, Fixed, 95% CI) | 0.0 [0.0, 0.0] |
| 29.2 at 4‐6 months | 0 | 0 | Mean Difference (IV, Fixed, 95% CI) | 0.0 [0.0, 0.0] |
| 29.3 ≥ 7‐12 months | 3 | 148 | Mean Difference (IV, Fixed, 95% CI) | ‐0.14 [‐0.62, 0.33] |
| 30 HDL cholesterol | 2 | Mean Difference (IV, Random, 95% CI) | Subtotals only | |
| 30.1 at 3 months | 0 | 0 | Mean Difference (IV, Random, 95% CI) | 0.0 [0.0, 0.0] |
| 30.2 at 4‐6 months | 0 | 0 | Mean Difference (IV, Random, 95% CI) | 0.0 [0.0, 0.0] |
| 30.3 ≥ 7‐12 months | 2 | 118 | Mean Difference (IV, Random, 95% CI) | ‐0.11 [‐0.24, 0.02] |
| 31 Type I muscle fibre area | 1 | Mean Difference (IV, Random, 95% CI) | Totals not selected | |
| 31.1 at 3 months | 1 | Mean Difference (IV, Random, 95% CI) | 0.0 [0.0, 0.0] | |
| 31.2 at 4‐6 months | 0 | Mean Difference (IV, Random, 95% CI) | 0.0 [0.0, 0.0] | |
| 31.3 ≥ 7‐12 months | 0 | Mean Difference (IV, Random, 95% CI) | 0.0 [0.0, 0.0] | |
| 32 Mid‐thigh muscle area | 3 | Mean Difference (IV, Random, 95% CI) | Subtotals only | |
| 32.1 at 3 months | 3 | 111 | Mean Difference (IV, Random, 95% CI) | ‐3.22 [‐9.67, 3.24] |
| 32.2 at 4‐6 months | 0 | 0 | Mean Difference (IV, Random, 95% CI) | 0.0 [0.0, 0.0] |
| 32.3 ≥ 7‐12 months | 0 | 0 | Mean Difference (IV, Random, 95% CI) | 0.0 [0.0, 0.0] |
| 33 Thigh muscle attenuation (Hounsfield units) | 1 | Mean Difference (IV, Random, 95% CI) | Totals not selected | |
| 33.1 at 3 months | 1 | Mean Difference (IV, Random, 95% CI) | 0.0 [0.0, 0.0] | |
| 33.2 at 4‐6 months | 0 | Mean Difference (IV, Random, 95% CI) | 0.0 [0.0, 0.0] | |
| 33.3 ≥ 7‐12 months | 0 | Mean Difference (IV, Random, 95% CI) | 0.0 [0.0, 0.0] | |
| 34 HRV index | 1 | Mean Difference (IV, Random, 95% CI) | Totals not selected | |
| 34.1 at 3 months | 0 | Mean Difference (IV, Random, 95% CI) | 0.0 [0.0, 0.0] | |
| 34.2 at 4‐6 months | 1 | Mean Difference (IV, Random, 95% CI) | 0.0 [0.0, 0.0] | |
| 34.3 ≥ 7‐12 months | 0 | Mean Difference (IV, Random, 95% CI) | 0.0 [0.0, 0.0] | |
| 35 Mean cardiac R‐R interval | 2 | Mean Difference (IV, Random, 95% CI) | Totals not selected | |
| 35.1 at 3 months | 0 | Mean Difference (IV, Random, 95% CI) | 0.0 [0.0, 0.0] | |
| 35.2 at 4‐6 months | 1 | Mean Difference (IV, Random, 95% CI) | 0.0 [0.0, 0.0] | |
| 35.3 ≥ 7‐12 months | 1 | Mean Difference (IV, Random, 95% CI) | 0.0 [0.0, 0.0] | |
| 36 SDNN | 2 | Mean Difference (IV, Random, 95% CI) | Totals not selected | |
| 36.1 at 3 months | 0 | Mean Difference (IV, Random, 95% CI) | 0.0 [0.0, 0.0] | |
| 36.2 at 4‐6 months | 1 | Mean Difference (IV, Random, 95% CI) | 0.0 [0.0, 0.0] | |
| 36.3 ≥ 7‐12 months | 1 | Mean Difference (IV, Random, 95% CI) | 0.0 [0.0, 0.0] | |
| 37 Arrhythmias: Lown class > II (no) | 1 | Risk Ratio (M‐H, Random, 95% CI) | Totals not selected | |
| 37.1 at 3 months | 0 | Risk Ratio (M‐H, Random, 95% CI) | 0.0 [0.0, 0.0] | |
| 37.2 at 4‐6 months | 1 | Risk Ratio (M‐H, Random, 95% CI) | 0.0 [0.0, 0.0] | |
| 37.3 ≥ 7‐12 months | 0 | Risk Ratio (M‐H, Random, 95% CI) | 0.0 [0.0, 0.0] | |
| 38 Left ventricular internal dimension at end‐diastole | 1 | Mean Difference (IV, Random, 95% CI) | Totals not selected | |
| 38.1 at 3 months | 0 | Mean Difference (IV, Random, 95% CI) | 0.0 [0.0, 0.0] | |
| 38.2 at 4‐6 months | 1 | Mean Difference (IV, Random, 95% CI) | 0.0 [0.0, 0.0] | |
| 38.3 ≥ 7‐12 months | 0 | Mean Difference (IV, Random, 95% CI) | 0.0 [0.0, 0.0] | |
| 39 Left ventricular internal dimension at end‐systole | 1 | Mean Difference (IV, Random, 95% CI) | Totals not selected | |
| 39.1 at 3 months | 0 | Mean Difference (IV, Random, 95% CI) | 0.0 [0.0, 0.0] | |
| 39.2 at 4‐6 months | 1 | Mean Difference (IV, Random, 95% CI) | 0.0 [0.0, 0.0] | |
| 39.3 ≥ 7‐12 months | 0 | Mean Difference (IV, Random, 95% CI) | 0.0 [0.0, 0.0] | |
| 40 Intraventricular septal thickness at end‐diastole | 1 | Mean Difference (IV, Random, 95% CI) | Totals not selected | |
| 40.1 at 3 months | 0 | Mean Difference (IV, Random, 95% CI) | 0.0 [0.0, 0.0] | |
| 40.2 at 4‐6 months | 1 | Mean Difference (IV, Random, 95% CI) | 0.0 [0.0, 0.0] | |
| 40.3 ≥ 7‐12 months | 0 | Mean Difference (IV, Random, 95% CI) | 0.0 [0.0, 0.0] | |
| 41 Left ventricular posterior wall thickness at end‐diastole | 1 | Mean Difference (IV, Random, 95% CI) | Totals not selected | |
| 41.1 at 3 months | 0 | Mean Difference (IV, Random, 95% CI) | 0.0 [0.0, 0.0] | |
| 41.2 at 4‐6 months | 1 | Mean Difference (IV, Random, 95% CI) | 0.0 [0.0, 0.0] | |
| 41.3 ≥ 7‐12 months | 0 | Mean Difference (IV, Random, 95% CI) | 0.0 [0.0, 0.0] | |
| 42 Left ventricular mass | 1 | Mean Difference (IV, Random, 95% CI) | Totals not selected | |
| 42.1 at 3 months | 0 | Mean Difference (IV, Random, 95% CI) | 0.0 [0.0, 0.0] | |
| 42.2 at 4‐6 months | 1 | Mean Difference (IV, Random, 95% CI) | 0.0 [0.0, 0.0] | |
| 42.3 ≥ 7‐12 months | 0 | Mean Difference (IV, Random, 95% CI) | 0.0 [0.0, 0.0] | |
| 43 Left ventricular mass index | 2 | Mean Difference (IV, Random, 95% CI) | Totals not selected | |
| 43.1 at 3 months | 0 | Mean Difference (IV, Random, 95% CI) | 0.0 [0.0, 0.0] | |
| 43.2 at 4‐6 months | 1 | Mean Difference (IV, Random, 95% CI) | 0.0 [0.0, 0.0] | |
| 43.3 ≥ 7‐12 months | 1 | Mean Difference (IV, Random, 95% CI) | 0.0 [0.0, 0.0] | |
| 44 Fasting plasma glucose | 2 | 57 | Mean Difference (IV, Random, 95% CI) | 0.73 [‐1.35, 2.81] |
| 44.1 at 3 months | 2 | 44 | Mean Difference (IV, Random, 95% CI) | 2.93 [‐3.84, 9.70] |
| 44.2 at 4‐6 months | 0 | 0 | Mean Difference (IV, Random, 95% CI) | 0.0 [0.0, 0.0] |
| 44.3 ≥ 7‐12 months | 1 | 13 | Mean Difference (IV, Random, 95% CI) | 0.39 [‐0.30, 1.08] |
| 45 Fasting plasma insulin | 1 | Mean Difference (IV, Fixed, 95% CI) | Totals not selected | |
| 45.1 at 3 months | 1 | Mean Difference (IV, Fixed, 95% CI) | 0.0 [0.0, 0.0] | |
| 45.2 at 4‐6 months | 0 | Mean Difference (IV, Fixed, 95% CI) | 0.0 [0.0, 0.0] | |
| 45.3 ≥ 7‐12 months | 0 | Mean Difference (IV, Fixed, 95% CI) | 0.0 [0.0, 0.0] | |
| 46 Glucose disappearance | 1 | 38 | Mean Difference (IV, Fixed, 95% CI) | ‐1.0 [‐1.96, ‐0.04] |
| 46.1 at 3 months | 1 | 25 | Mean Difference (IV, Fixed, 95% CI) | ‐1.0 [‐2.20, 0.20] |
| 46.2 at 4‐6 months | 0 | 0 | Mean Difference (IV, Fixed, 95% CI) | 0.0 [0.0, 0.0] |
| 46.3 ≥ 7‐12 months | 1 | 13 | Mean Difference (IV, Fixed, 95% CI) | ‐1.0 [‐2.62, 0.62] |
2.4. Analysis.
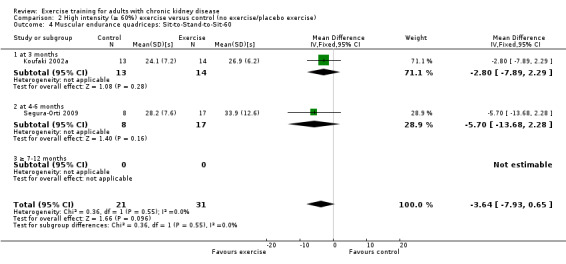
Comparison 2 High intensity (≥ 60%) exercise versus control (no exercise/placebo exercise), Outcome 4 Muscular endurance quadriceps: Sit‐to‐Stand‐to‐Sit‐60.
2.5. Analysis.
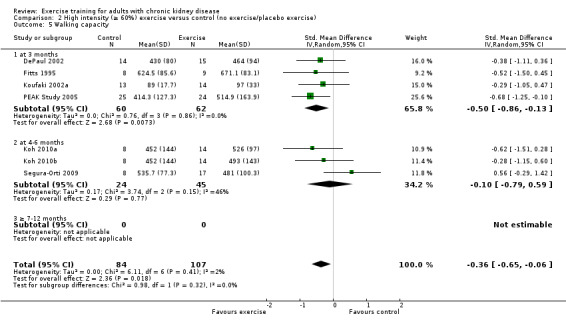
Comparison 2 High intensity (≥ 60%) exercise versus control (no exercise/placebo exercise), Outcome 5 Walking capacity.
2.6. Analysis.
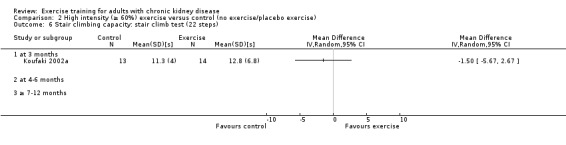
Comparison 2 High intensity (≥ 60%) exercise versus control (no exercise/placebo exercise), Outcome 6 Stair climbing capacity: stair climb test (22 steps).
2.7. Analysis.
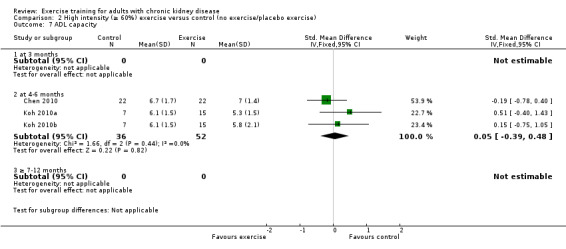
Comparison 2 High intensity (≥ 60%) exercise versus control (no exercise/placebo exercise), Outcome 7 ADL capacity.
2.12. Analysis.
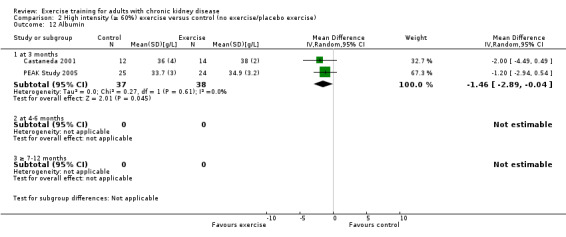
Comparison 2 High intensity (≥ 60%) exercise versus control (no exercise/placebo exercise), Outcome 12 Albumin.
2.13. Analysis.
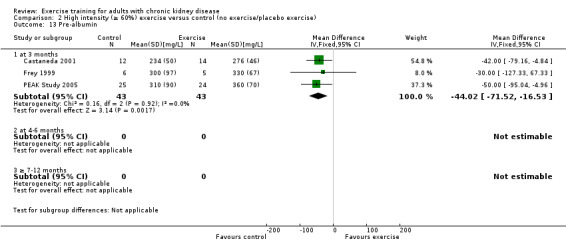
Comparison 2 High intensity (≥ 60%) exercise versus control (no exercise/placebo exercise), Outcome 13 Pre‐albumin.
2.14. Analysis.
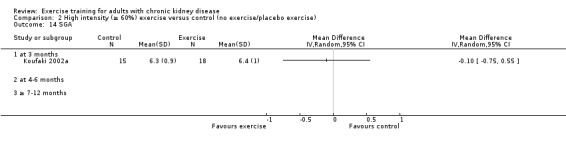
Comparison 2 High intensity (≥ 60%) exercise versus control (no exercise/placebo exercise), Outcome 14 SGA.
2.16. Analysis.
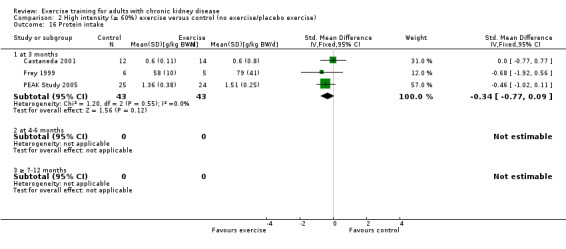
Comparison 2 High intensity (≥ 60%) exercise versus control (no exercise/placebo exercise), Outcome 16 Protein intake.
2.17. Analysis.
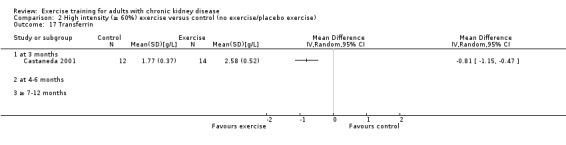
Comparison 2 High intensity (≥ 60%) exercise versus control (no exercise/placebo exercise), Outcome 17 Transferrin.
2.18. Analysis.
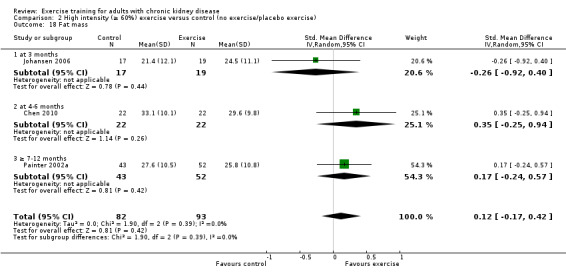
Comparison 2 High intensity (≥ 60%) exercise versus control (no exercise/placebo exercise), Outcome 18 Fat mass.
2.19. Analysis.

Comparison 2 High intensity (≥ 60%) exercise versus control (no exercise/placebo exercise), Outcome 19 Waist circumference.
2.20. Analysis.

Comparison 2 High intensity (≥ 60%) exercise versus control (no exercise/placebo exercise), Outcome 20 Mid‐arm circumference.
2.21. Analysis.

Comparison 2 High intensity (≥ 60%) exercise versus control (no exercise/placebo exercise), Outcome 21 Mid‐calf circumference.
2.22. Analysis.

Comparison 2 High intensity (≥ 60%) exercise versus control (no exercise/placebo exercise), Outcome 22 Mid‐thigh circumference.
2.23. Analysis.
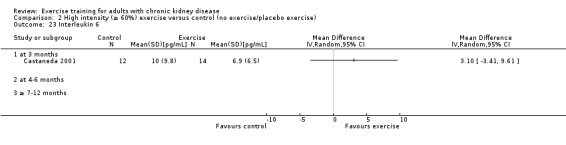
Comparison 2 High intensity (≥ 60%) exercise versus control (no exercise/placebo exercise), Outcome 23 Interleukin 6.
2.24. Analysis.
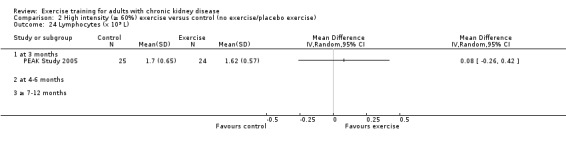
Comparison 2 High intensity (≥ 60%) exercise versus control (no exercise/placebo exercise), Outcome 24 Lymphocytes (x 109 L).
2.25. Analysis.
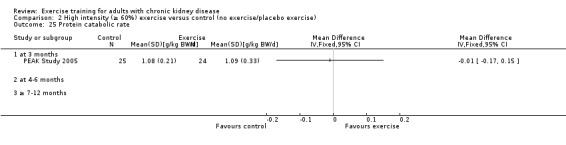
Comparison 2 High intensity (≥ 60%) exercise versus control (no exercise/placebo exercise), Outcome 25 Protein catabolic rate.
2.26. Analysis.
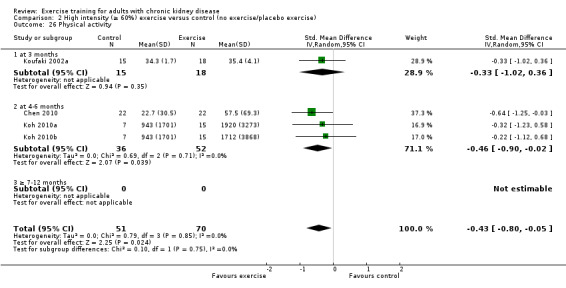
Comparison 2 High intensity (≥ 60%) exercise versus control (no exercise/placebo exercise), Outcome 26 Physical activity.
2.27. Analysis.
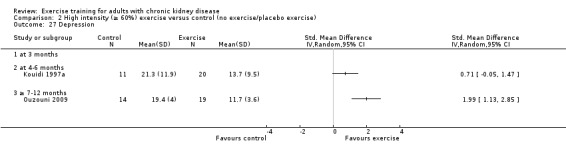
Comparison 2 High intensity (≥ 60%) exercise versus control (no exercise/placebo exercise), Outcome 27 Depression.
2.30. Analysis.
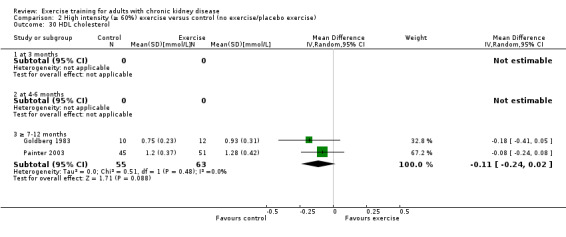
Comparison 2 High intensity (≥ 60%) exercise versus control (no exercise/placebo exercise), Outcome 30 HDL cholesterol.
2.31. Analysis.
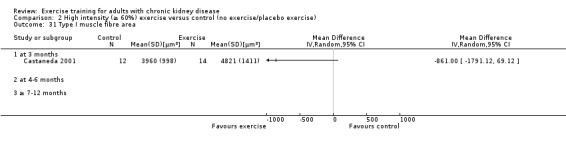
Comparison 2 High intensity (≥ 60%) exercise versus control (no exercise/placebo exercise), Outcome 31 Type I muscle fibre area.
2.32. Analysis.
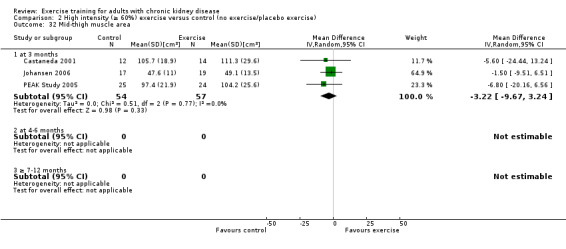
Comparison 2 High intensity (≥ 60%) exercise versus control (no exercise/placebo exercise), Outcome 32 Mid‐thigh muscle area.
2.33. Analysis.
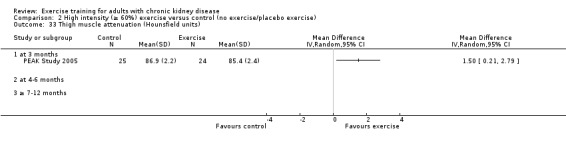
Comparison 2 High intensity (≥ 60%) exercise versus control (no exercise/placebo exercise), Outcome 33 Thigh muscle attenuation (Hounsfield units).
2.34. Analysis.
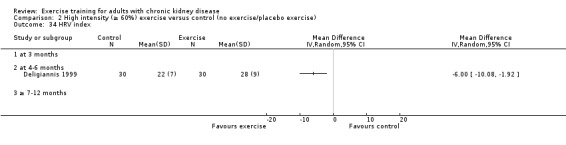
Comparison 2 High intensity (≥ 60%) exercise versus control (no exercise/placebo exercise), Outcome 34 HRV index.
2.35. Analysis.
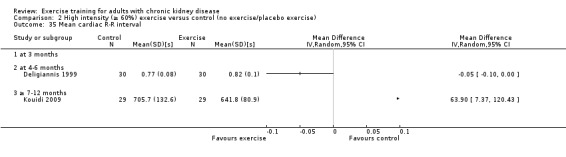
Comparison 2 High intensity (≥ 60%) exercise versus control (no exercise/placebo exercise), Outcome 35 Mean cardiac R‐R interval.
2.36. Analysis.
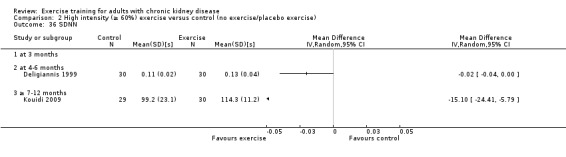
Comparison 2 High intensity (≥ 60%) exercise versus control (no exercise/placebo exercise), Outcome 36 SDNN.
2.37. Analysis.
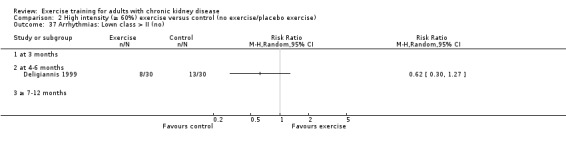
Comparison 2 High intensity (≥ 60%) exercise versus control (no exercise/placebo exercise), Outcome 37 Arrhythmias: Lown class > II (no).
2.38. Analysis.
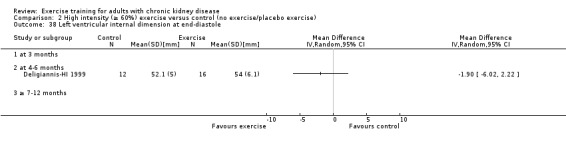
Comparison 2 High intensity (≥ 60%) exercise versus control (no exercise/placebo exercise), Outcome 38 Left ventricular internal dimension at end‐diastole.
2.39. Analysis.
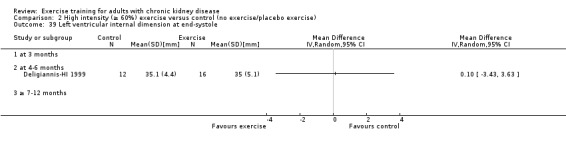
Comparison 2 High intensity (≥ 60%) exercise versus control (no exercise/placebo exercise), Outcome 39 Left ventricular internal dimension at end‐systole.
2.40. Analysis.
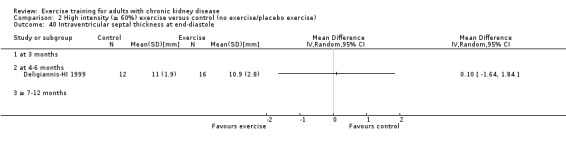
Comparison 2 High intensity (≥ 60%) exercise versus control (no exercise/placebo exercise), Outcome 40 Intraventricular septal thickness at end‐diastole.
2.41. Analysis.
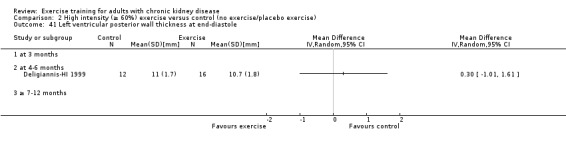
Comparison 2 High intensity (≥ 60%) exercise versus control (no exercise/placebo exercise), Outcome 41 Left ventricular posterior wall thickness at end‐diastole.
2.42. Analysis.
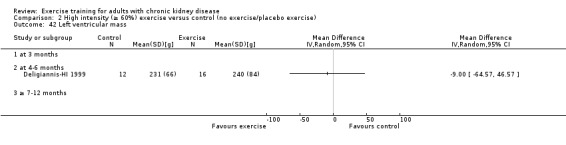
Comparison 2 High intensity (≥ 60%) exercise versus control (no exercise/placebo exercise), Outcome 42 Left ventricular mass.
2.43. Analysis.
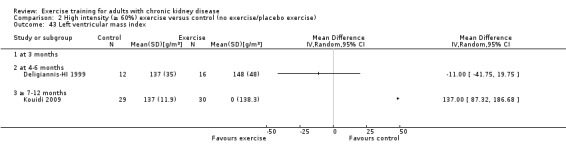
Comparison 2 High intensity (≥ 60%) exercise versus control (no exercise/placebo exercise), Outcome 43 Left ventricular mass index.
2.44. Analysis.
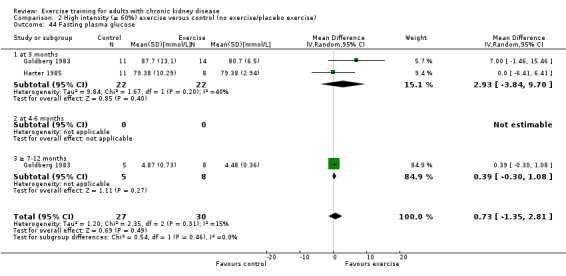
Comparison 2 High intensity (≥ 60%) exercise versus control (no exercise/placebo exercise), Outcome 44 Fasting plasma glucose.
2.45. Analysis.
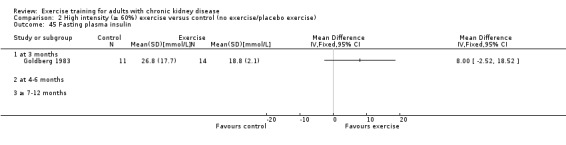
Comparison 2 High intensity (≥ 60%) exercise versus control (no exercise/placebo exercise), Outcome 45 Fasting plasma insulin.
2.46. Analysis.
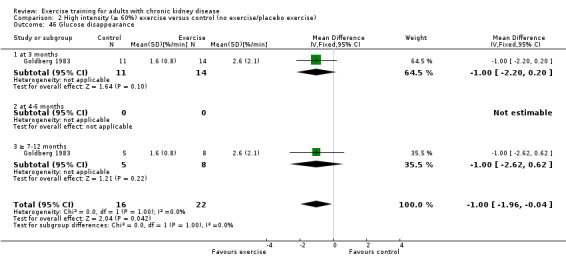
Comparison 2 High intensity (≥ 60%) exercise versus control (no exercise/placebo exercise), Outcome 46 Glucose disappearance.
Comparison 3. Low intensity (< 60%) exercise versus control (no exercise/placebo exercise).
| Outcome or subgroup title | No. of studies | No. of participants | Statistical method | Effect size |
|---|---|---|---|---|
| 1 Aerobic capacity | 5 | 182 | Std. Mean Difference (IV, Fixed, 95% CI) | ‐0.39 [‐0.69, ‐0.09] |
| 1.1 at 3 months | 3 | 131 | Std. Mean Difference (IV, Fixed, 95% CI) | ‐0.24 [‐0.59, 0.11] |
| 1.2 at 4‐6 months | 2 | 51 | Std. Mean Difference (IV, Fixed, 95% CI) | ‐0.81 [‐1.39, ‐0.23] |
| 1.3 ≥ 7‐12 months | 0 | 0 | Std. Mean Difference (IV, Fixed, 95% CI) | 0.0 [0.0, 0.0] |
| 2 Muscular strength (low value = improved) | 1 | Std. Mean Difference (IV, Fixed, 95% CI) | Totals not selected | |
| 2.1 3 months | 1 | Std. Mean Difference (IV, Fixed, 95% CI) | 0.0 [0.0, 0.0] | |
| 2.2 at 4‐6 months | 0 | Std. Mean Difference (IV, Fixed, 95% CI) | 0.0 [0.0, 0.0] | |
| 2.3 ≥ 7‐12 months | 0 | Std. Mean Difference (IV, Fixed, 95% CI) | 0.0 [0.0, 0.0] | |
| 3 ADL capacity | 0 | 0 | Mean Difference (IV, Random, 95% CI) | 0.0 [0.0, 0.0] |
| 3.1 at 3 months | 0 | 0 | Mean Difference (IV, Random, 95% CI) | 0.0 [0.0, 0.0] |
| 3.2 at 4‐6 months | 0 | 0 | Mean Difference (IV, Random, 95% CI) | 0.0 [0.0, 0.0] |
| 3.3 ≥ 7‐12 months | 0 | 0 | Mean Difference (IV, Random, 95% CI) | 0.0 [0.0, 0.0] |
| 4 Diastolic blood pressure: resting | 3 | 147 | Mean Difference (IV, Fixed, 95% CI) | ‐1.77 [‐5.26, 1.73] |
| 4.1 at 3 months | 1 | 96 | Mean Difference (IV, Fixed, 95% CI) | ‐1.0 [‐6.38, 4.38] |
| 4.2 at 4‐6 months | 2 | 51 | Mean Difference (IV, Fixed, 95% CI) | ‐2.33 [‐6.93, 2.27] |
| 4.3 ≥ 7‐12 months | 0 | 0 | Mean Difference (IV, Fixed, 95% CI) | 0.0 [0.0, 0.0] |
| 5 Systolic blood pressure: resting | 3 | 147 | Mean Difference (IV, Fixed, 95% CI) | 0.86 [‐6.10, 7.82] |
| 5.1 at 3 months | 1 | 96 | Mean Difference (IV, Fixed, 95% CI) | 6.0 [‐4.31, 16.31] |
| 5.2 at 4‐6 months | 2 | 51 | Mean Difference (IV, Fixed, 95% CI) | ‐3.43 [‐12.86, 5.99] |
| 5.3 ≥ 7‐12 months | 0 | 0 | Mean Difference (IV, Fixed, 95% CI) | 0.0 [0.0, 0.0] |
| 6 Heart rate: maximum | 3 | Mean Difference (IV, Fixed, 95% CI) | Subtotals only | |
| 6.1 at 3 months | 0 | 0 | Mean Difference (IV, Fixed, 95% CI) | 0.0 [0.0, 0.0] |
| 6.2 at 4‐6 months | 3 | 73 | Mean Difference (IV, Fixed, 95% CI) | ‐4.11 [‐9.89, 1.68] |
| 6.3 ≥ 7‐12 months | 0 | 0 | Mean Difference (IV, Fixed, 95% CI) | 0.0 [0.0, 0.0] |
| 7 Heart rate: resting | 2 | Mean Difference (IV, Fixed, 95% CI) | Subtotals only | |
| 7.1 at 3 months | 0 | 0 | Mean Difference (IV, Fixed, 95% CI) | 0.0 [0.0, 0.0] |
| 7.2 at 4‐6 months | 2 | 51 | Mean Difference (IV, Fixed, 95% CI) | 2.94 [‐1.00, 8.87] |
| 7.3 ≥ 7‐12 months | 0 | 0 | Mean Difference (IV, Fixed, 95% CI) | 0.0 [0.0, 0.0] |
| 8 Depression | 1 | Std. Mean Difference (IV, Random, 95% CI) | Totals not selected | |
| 8.1 at 3 months | 1 | Std. Mean Difference (IV, Random, 95% CI) | 0.0 [0.0, 0.0] | |
| 8.2 at 4‐6 months | 0 | Std. Mean Difference (IV, Random, 95% CI) | 0.0 [0.0, 0.0] | |
| 8.3 ≥ 7‐12 months | 0 | Std. Mean Difference (IV, Random, 95% CI) | 0.0 [0.0, 0.0] | |
| 9 Total cholesterol | 1 | Mean Difference (IV, Fixed, 95% CI) | Totals not selected | |
| 9.1 at 3 months | 1 | Mean Difference (IV, Fixed, 95% CI) | 0.0 [0.0, 0.0] | |
| 9.2 at 4‐6 months | 0 | Mean Difference (IV, Fixed, 95% CI) | 0.0 [0.0, 0.0] | |
| 9.3 ≥ 7‐12 months | 0 | Mean Difference (IV, Fixed, 95% CI) | 0.0 [0.0, 0.0] | |
| 10 Left ventricular internal dimension at end‐diastole | 1 | Mean Difference (IV, Random, 95% CI) | Totals not selected | |
| 10.1 at 3 months | 0 | Mean Difference (IV, Random, 95% CI) | 0.0 [0.0, 0.0] | |
| 10.2 at 4‐6 months | 1 | Mean Difference (IV, Random, 95% CI) | 0.0 [0.0, 0.0] | |
| 10.3 ≥ 7‐12 months | 0 | Mean Difference (IV, Random, 95% CI) | 0.0 [0.0, 0.0] | |
| 11 Left ventricular internal dimension at end‐systole | 1 | Mean Difference (IV, Random, 95% CI) | Totals not selected | |
| 11.1 at 3 months | 0 | Mean Difference (IV, Random, 95% CI) | 0.0 [0.0, 0.0] | |
| 11.2 at 4‐6 months | 1 | Mean Difference (IV, Random, 95% CI) | 0.0 [0.0, 0.0] | |
| 11.3 ≥ 7‐12 months | 0 | Mean Difference (IV, Random, 95% CI) | 0.0 [0.0, 0.0] | |
| 12 Intraventricular septal thickness at end‐diastole | 1 | Mean Difference (IV, Random, 95% CI) | Totals not selected | |
| 12.1 at 3 months | 0 | Mean Difference (IV, Random, 95% CI) | 0.0 [0.0, 0.0] | |
| 12.2 at 4‐6 months | 1 | Mean Difference (IV, Random, 95% CI) | 0.0 [0.0, 0.0] | |
| 12.3 ≥ 7‐12 months | 0 | Mean Difference (IV, Random, 95% CI) | 0.0 [0.0, 0.0] | |
| 13 Left ventricular posterior wall thickness at end‐diastole | 1 | Mean Difference (IV, Random, 95% CI) | Totals not selected | |
| 13.1 at 3 months | 0 | Mean Difference (IV, Random, 95% CI) | 0.0 [0.0, 0.0] | |
| 13.2 at 4‐6 months | 1 | Mean Difference (IV, Random, 95% CI) | 0.0 [0.0, 0.0] | |
| 13.3 ≥ 7‐12 months | 0 | Mean Difference (IV, Random, 95% CI) | 0.0 [0.0, 0.0] | |
| 14 Left ventricular mass | 1 | Mean Difference (IV, Random, 95% CI) | Totals not selected | |
| 14.1 at 3 months | 0 | Mean Difference (IV, Random, 95% CI) | 0.0 [0.0, 0.0] | |
| 14.2 at 4‐6 months | 1 | Mean Difference (IV, Random, 95% CI) | 0.0 [0.0, 0.0] | |
| 14.3 ≥ 7‐12 months | 0 | Mean Difference (IV, Random, 95% CI) | 0.0 [0.0, 0.0] | |
| 15 Left ventricular mass index | 1 | Mean Difference (IV, Random, 95% CI) | Totals not selected | |
| 15.1 at 3 months | 0 | Mean Difference (IV, Random, 95% CI) | 0.0 [0.0, 0.0] | |
| 15.2 at 4‐6 months | 1 | Mean Difference (IV, Random, 95% CI) | 0.0 [0.0, 0.0] | |
| 15.3 ≥ 7‐12 months | 0 | Mean Difference (IV, Random, 95% CI) | 0.0 [0.0, 0.0] |
3.8. Analysis.
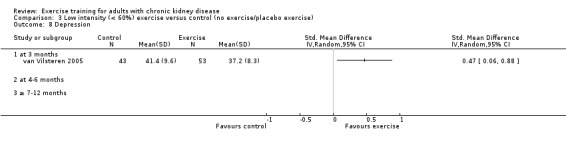
Comparison 3 Low intensity (< 60%) exercise versus control (no exercise/placebo exercise), Outcome 8 Depression.
3.10. Analysis.

Comparison 3 Low intensity (< 60%) exercise versus control (no exercise/placebo exercise), Outcome 10 Left ventricular internal dimension at end‐diastole.
3.11. Analysis.
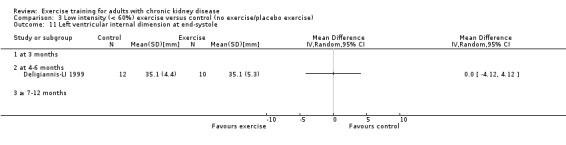
Comparison 3 Low intensity (< 60%) exercise versus control (no exercise/placebo exercise), Outcome 11 Left ventricular internal dimension at end‐systole.
3.12. Analysis.
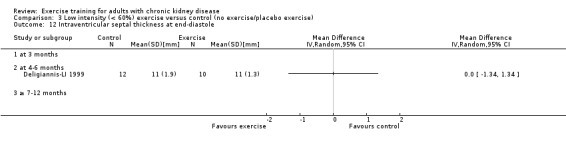
Comparison 3 Low intensity (< 60%) exercise versus control (no exercise/placebo exercise), Outcome 12 Intraventricular septal thickness at end‐diastole.
3.13. Analysis.

Comparison 3 Low intensity (< 60%) exercise versus control (no exercise/placebo exercise), Outcome 13 Left ventricular posterior wall thickness at end‐diastole.
3.14. Analysis.
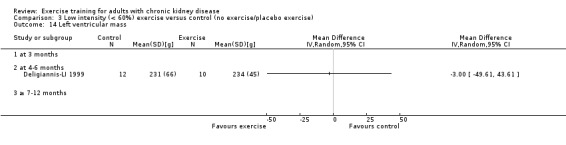
Comparison 3 Low intensity (< 60%) exercise versus control (no exercise/placebo exercise), Outcome 14 Left ventricular mass.
3.15. Analysis.
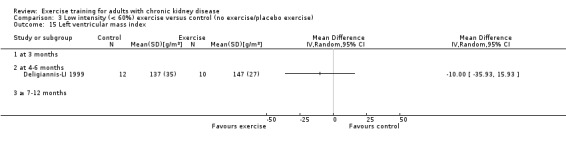
Comparison 3 Low intensity (< 60%) exercise versus control (no exercise/placebo exercise), Outcome 15 Left ventricular mass index.
Comparison 4. Cardiovascular exercise versus control (no exercise/placebo exercise).
| Outcome or subgroup title | No. of studies | No. of participants | Statistical method | Effect size |
|---|---|---|---|---|
| 1 Aerobic capacity | 16 | 514 | Std. Mean Difference (IV, Fixed, 95% CI) | ‐0.53 [‐0.71, ‐0.35] |
| 1.1 at 3 months | 5 | 116 | Std. Mean Difference (IV, Fixed, 95% CI) | ‐0.45 [‐0.82, ‐0.08] |
| 1.2 at 4‐6 months | 7 | 152 | Std. Mean Difference (IV, Fixed, 95% CI) | ‐0.87 [‐1.22, ‐0.52] |
| 1.3 ≥ 7‐12 months | 4 | 246 | Std. Mean Difference (IV, Fixed, 95% CI) | ‐0.38 [‐0.64, ‐0.13] |
| 2 Muscular strength | 4 | 165 | Std. Mean Difference (IV, Random, 95% CI) | ‐0.23 [‐0.57, 0.12] |
| 2.1 at 3 months | 1 | 27 | Std. Mean Difference (IV, Random, 95% CI) | 0.40 [‐0.36, 1.17] |
| 2.2 at 4‐6 months | 2 | 43 | Std. Mean Difference (IV, Random, 95% CI) | ‐0.38 [‐1.03, 0.26] |
| 2.3 ≥ 7‐12 months | 1 | 95 | Std. Mean Difference (IV, Random, 95% CI) | ‐0.37 [‐0.78, 0.04] |
| 3 Muscular endurance quadriceps: Sit‐to‐Stand‐to‐Sit‐60 | 1 | Mean Difference (IV, Fixed, 95% CI) | Totals not selected | |
| 3.1 at 3 months | 1 | Mean Difference (IV, Fixed, 95% CI) | 0.0 [0.0, 0.0] | |
| 3.2 at 4‐6 months | 0 | Mean Difference (IV, Fixed, 95% CI) | 0.0 [0.0, 0.0] | |
| 3.3 ≥ 7‐12 months | 0 | Mean Difference (IV, Fixed, 95% CI) | 0.0 [0.0, 0.0] | |
| 4 Walking capacity | 3 | 71 | Std. Mean Difference (IV, Fixed, 95% CI) | ‐0.38 [‐0.86, 0.10] |
| 4.1 at 3 months | 1 | 27 | Std. Mean Difference (IV, Fixed, 95% CI) | ‐0.29 [‐1.05, 0.47] |
| 4.2 at 4‐6 months | 2 | 44 | Std. Mean Difference (IV, Fixed, 95% CI) | ‐0.44 [‐1.07, 0.18] |
| 4.3 ≥ 7‐12 months | 0 | 0 | Std. Mean Difference (IV, Fixed, 95% CI) | 0.0 [0.0, 0.0] |
| 5 Stair climbing capacity: stair climb test (22 steps) | 1 | Mean Difference (IV, Random, 95% CI) | Totals not selected | |
| 5.1 at 3 months | 1 | Mean Difference (IV, Random, 95% CI) | 0.0 [0.0, 0.0] | |
| 5.2 at 4‐6 months | 0 | Mean Difference (IV, Random, 95% CI) | 0.0 [0.0, 0.0] | |
| 5.3 ≥ 7‐12 months | 0 | Mean Difference (IV, Random, 95% CI) | 0.0 [0.0, 0.0] | |
| 6 ADL capacity | 2 | Mean Difference (IV, Fixed, 95% CI) | Subtotals only | |
| 6.1 at 3 months | 0 | 0 | Mean Difference (IV, Fixed, 95% CI) | 0.0 [0.0, 0.0] |
| 6.2 at 4‐6 months | 2 | 44 | Mean Difference (IV, Fixed, 95% CI) | 0.58 [‐0.43, 1.60] |
| 6.3 ≥ 7‐12 months | 0 | 0 | Mean Difference (IV, Fixed, 95% CI) | 0.0 [0.0, 0.0] |
| 7 Diastolic blood pressure: resting | 6 | 202 | Mean Difference (IV, Fixed, 95% CI) | ‐0.11 [‐2.88, 2.66] |
| 7.1 at 3 months | 1 | 19 | Mean Difference (IV, Fixed, 95% CI) | ‐4.40 [‐11.31, 2.51] |
| 7.2 at 4‐6 months | 3 | 62 | Mean Difference (IV, Fixed, 95% CI) | ‐0.12 [‐4.35, 4.11] |
| 7.3 ≥ 7‐12 months | 2 | 121 | Mean Difference (IV, Fixed, 95% CI) | 1.58 [‐2.75, 5.90] |
| 8 Systolic blood pressure: resting | 6 | Mean Difference (IV, Fixed, 95% CI) | Totals not selected | |
| 8.1 at 3 months | 1 | Mean Difference (IV, Fixed, 95% CI) | 0.0 [0.0, 0.0] | |
| 8.2 at 4‐6 months | 3 | Mean Difference (IV, Fixed, 95% CI) | 0.0 [0.0, 0.0] | |
| 8.3 ≥ 7‐12 months | 2 | Mean Difference (IV, Fixed, 95% CI) | 0.0 [0.0, 0.0] | |
| 9 Heart rate: maximum | 7 | 154 | Mean Difference (IV, Fixed, 95% CI) | ‐6.15 [‐11.01, ‐1.30] |
| 9.1 at 3 months | 2 | 46 | Mean Difference (IV, Fixed, 95% CI) | ‐10.11 [‐21.79, 1.57] |
| 9.2 at 4‐6 months | 5 | 108 | Mean Difference (IV, Fixed, 95% CI) | ‐5.33 [‐10.66, 0.00] |
| 9.3 ≥ 7‐12 months | 0 | 0 | Mean Difference (IV, Fixed, 95% CI) | 0.0 [0.0, 0.0] |
| 10 Heart rate: resting | 4 | 87 | Mean Difference (IV, Fixed, 95% CI) | 0.74 [‐4.32, 5.80] |
| 10.1 at 3 months | 0 | 0 | Mean Difference (IV, Fixed, 95% CI) | 0.0 [0.0, 0.0] |
| 10.2 at 4‐6 months | 3 | 62 | Mean Difference (IV, Fixed, 95% CI) | 2.15 [‐3.62, 7.92] |
| 10.3 ≥ 7‐12 months | 1 | 25 | Mean Difference (IV, Fixed, 95% CI) | ‐4.0 [‐14.57, 6.57] |
| 11 Albumin | 2 | Mean Difference (IV, Fixed, 95% CI) | Totals not selected | |
| 11.1 at 3 months | 2 | Mean Difference (IV, Fixed, 95% CI) | 0.0 [0.0, 0.0] | |
| 11.2 at 4‐6 months | 0 | Mean Difference (IV, Fixed, 95% CI) | 0.0 [0.0, 0.0] | |
| 11.3 ≥ 7‐12 months | 0 | Mean Difference (IV, Fixed, 95% CI) | 0.0 [0.0, 0.0] | |
| 12 Pre‐albumin | 1 | Mean Difference (IV, Fixed, 95% CI) | Totals not selected | |
| 12.1 at 3 months | 1 | Mean Difference (IV, Fixed, 95% CI) | 0.0 [0.0, 0.0] | |
| 12.2 at 4‐6 months | 0 | Mean Difference (IV, Fixed, 95% CI) | 0.0 [0.0, 0.0] | |
| 12.3 ≥ 7‐12 months | 0 | Mean Difference (IV, Fixed, 95% CI) | 0.0 [0.0, 0.0] | |
| 13 SGA | 1 | Mean Difference (IV, Fixed, 95% CI) | Totals not selected | |
| 13.1 at 3 months | 1 | Mean Difference (IV, Fixed, 95% CI) | 0.0 [0.0, 0.0] | |
| 13.2 at 4‐6 months | 0 | Mean Difference (IV, Fixed, 95% CI) | 0.0 [0.0, 0.0] | |
| 13.3 ≥ 7‐12 months | 0 | Mean Difference (IV, Fixed, 95% CI) | 0.0 [0.0, 0.0] | |
| 14 Energy intake | 2 | Std. Mean Difference (IV, Fixed, 95% CI) | Totals not selected | |
| 14.1 at 3 months | 1 | Std. Mean Difference (IV, Fixed, 95% CI) | 0.0 [0.0, 0.0] | |
| 14.2 at 4‐6 months | 1 | Std. Mean Difference (IV, Fixed, 95% CI) | 0.0 [0.0, 0.0] | |
| 14.3 ≥ 7‐12 months | 0 | Std. Mean Difference (IV, Fixed, 95% CI) | 0.0 [0.0, 0.0] | |
| 15 Protein intake | 1 | Mean Difference (IV, Fixed, 95% CI) | Totals not selected | |
| 15.1 at 3 months | 1 | Mean Difference (IV, Fixed, 95% CI) | 0.0 [0.0, 0.0] | |
| 15.2 at 4‐6 months | 0 | Mean Difference (IV, Fixed, 95% CI) | 0.0 [0.0, 0.0] | |
| 15.3 ≥ 7‐12 months | 0 | Mean Difference (IV, Fixed, 95% CI) | 0.0 [0.0, 0.0] | |
| 16 Transferrin | 1 | Mean Difference (IV, Fixed, 95% CI) | Totals not selected | |
| 16.1 at 3 months | 1 | Mean Difference (IV, Fixed, 95% CI) | 0.0 [0.0, 0.0] | |
| 16.2 at 4‐6 months | 0 | Mean Difference (IV, Fixed, 95% CI) | 0.0 [0.0, 0.0] | |
| 16.3 ≥ 7‐12 months | 0 | Mean Difference (IV, Fixed, 95% CI) | 0.0 [0.0, 0.0] | |
| 17 Fat mass | 3 | 130 | Std. Mean Difference (IV, Fixed, 95% CI) | 0.06 [‐0.29, 0.42] |
| 17.1 at 3 months | 0 | 0 | Std. Mean Difference (IV, Fixed, 95% CI) | 0.0 [0.0, 0.0] |
| 17.2 at 4‐6 months | 2 | 35 | Std. Mean Difference (IV, Fixed, 95% CI) | ‐0.31 [‐1.08, 0.46] |
| 17.3 ≥ 7‐12 months | 1 | 95 | Std. Mean Difference (IV, Fixed, 95% CI) | 0.17 [‐0.24, 0.57] |
| 18 Physical activity | 3 | 77 | Std. Mean Difference (IV, Random, 95% CI) | ‐0.30 [‐0.77, 0.17] |
| 18.1 at 3 months | 1 | 33 | Std. Mean Difference (IV, Random, 95% CI) | ‐0.33 [‐1.02, 0.36] |
| 18.2 at 4‐6 months | 2 | 44 | Std. Mean Difference (IV, Random, 95% CI) | ‐0.27 [‐0.91, 0.37] |
| 18.3 ≥ 7‐12 months | 0 | 0 | Std. Mean Difference (IV, Random, 95% CI) | 0.0 [0.0, 0.0] |
| 19 Depression | 2 | Std. Mean Difference (IV, Random, 95% CI) | Totals not selected | |
| 19.1 at 3 months | 1 | Std. Mean Difference (IV, Random, 95% CI) | 0.0 [0.0, 0.0] | |
| 19.2 at 4‐6 months | 1 | Std. Mean Difference (IV, Random, 95% CI) | 0.0 [0.0, 0.0] | |
| 19.3 ≥ 7‐12 months | 0 | Std. Mean Difference (IV, Random, 95% CI) | 0.0 [0.0, 0.0] | |
| 20 Triglycerides | 3 | 63 | Mean Difference (IV, Random, 95% CI) | 0.27 [‐0.31, 0.85] |
| 20.1 at 3 months | 0 | 0 | Mean Difference (IV, Random, 95% CI) | 0.0 [0.0, 0.0] |
| 20.2 at 4‐6 months | 1 | 11 | Mean Difference (IV, Random, 95% CI) | 0.51 [‐0.83, 1.84] |
| 20.3 ≥ 7‐12 months | 2 | 52 | Mean Difference (IV, Random, 95% CI) | 0.22 [‐0.43, 0.86] |
| 21 Total cholesterol | 4 | 159 | Mean Difference (IV, Random, 95% CI) | ‐0.03 [‐0.40, 0.34] |
| 21.1 at 3 months | 0 | 0 | Mean Difference (IV, Random, 95% CI) | 0.0 [0.0, 0.0] |
| 21.2 at 4‐6 months | 1 | 11 | Mean Difference (IV, Random, 95% CI) | 0.47 [‐0.46, 1.39] |
| 21.3 ≥ 7‐12 months | 3 | 148 | Mean Difference (IV, Random, 95% CI) | ‐0.12 [‐0.52, 0.28] |
| 22 HDL cholesterol | 3 | 129 | Mean Difference (IV, Fixed, 95% CI) | ‐0.15 [‐0.25, ‐0.05] |
| 22.1 at 3 months | 0 | 0 | Mean Difference (IV, Fixed, 95% CI) | 0.0 [0.0, 0.0] |
| 22.2 at 4‐6 months | 1 | 11 | Mean Difference (IV, Fixed, 95% CI) | ‐0.21 [‐0.38, ‐0.04] |
| 22.3 ≥ 7‐12 months | 2 | 118 | Mean Difference (IV, Fixed, 95% CI) | ‐0.11 [‐0.24, 0.02] |
| 23 LDL cholesterol | 1 | Mean Difference (IV, Fixed, 95% CI) | Totals not selected | |
| 23.1 at 3 months | 0 | Mean Difference (IV, Fixed, 95% CI) | 0.0 [0.0, 0.0] | |
| 23.2 at 4‐6 months | 1 | Mean Difference (IV, Fixed, 95% CI) | 0.0 [0.0, 0.0] | |
| 23.3 at >7‐12 months | 0 | Mean Difference (IV, Fixed, 95% CI) | 0.0 [0.0, 0.0] | |
| 24 Mid‐thigh muscle area | 1 | Mean Difference (IV, Fixed, 95% CI) | Totals not selected | |
| 24.1 at 3 months | 0 | Mean Difference (IV, Fixed, 95% CI) | 0.0 [0.0, 0.0] | |
| 24.2 at 4‐6 months | 1 | Mean Difference (IV, Fixed, 95% CI) | 0.0 [0.0, 0.0] | |
| 24.3 ≥ 7‐12 months | 0 | Mean Difference (IV, Fixed, 95% CI) | 0.0 [0.0, 0.0] | |
| 25 HRV index | 1 | Mean Difference (IV, Fixed, 95% CI) | Totals not selected | |
| 25.1 at 3 months | 0 | Mean Difference (IV, Fixed, 95% CI) | 0.0 [0.0, 0.0] | |
| 25.2 at 4‐6 months | 1 | Mean Difference (IV, Fixed, 95% CI) | 0.0 [0.0, 0.0] | |
| 25.3 ≥ 7‐12 months | 0 | Mean Difference (IV, Fixed, 95% CI) | 0.0 [0.0, 0.0] | |
| 26 Mean cardiac R‐R interval | 1 | Mean Difference (IV, Fixed, 95% CI) | Totals not selected | |
| 26.1 at 3 months | 0 | Mean Difference (IV, Fixed, 95% CI) | 0.0 [0.0, 0.0] | |
| 26.2 at 4‐6 months | 1 | Mean Difference (IV, Fixed, 95% CI) | 0.0 [0.0, 0.0] | |
| 26.3 ≥ 7‐12 months | 0 | Mean Difference (IV, Fixed, 95% CI) | 0.0 [0.0, 0.0] | |
| 27 SDNN | 1 | Mean Difference (IV, Fixed, 95% CI) | Totals not selected | |
| 27.1 at 3 months | 0 | Mean Difference (IV, Fixed, 95% CI) | 0.0 [0.0, 0.0] | |
| 27.2 at 4‐6 months | 1 | Mean Difference (IV, Fixed, 95% CI) | 0.0 [0.0, 0.0] | |
| 27.3 ≥ 7‐12 months | 0 | Mean Difference (IV, Fixed, 95% CI) | 0.0 [0.0, 0.0] | |
| 28 Arrhythmias: Lown class > II (no) | 1 | Risk Ratio (M‐H, Fixed, 95% CI) | Totals not selected | |
| 28.1 at 3 months | 0 | Risk Ratio (M‐H, Fixed, 95% CI) | 0.0 [0.0, 0.0] | |
| 28.2 at 4‐6 months | 1 | Risk Ratio (M‐H, Fixed, 95% CI) | 0.0 [0.0, 0.0] | |
| 28.3 ≥ 7‐12 months | 0 | Risk Ratio (M‐H, Fixed, 95% CI) | 0.0 [0.0, 0.0] | |
| 29 Left ventricular internal dimension at end‐diastole | 1 | Mean Difference (IV, Fixed, 95% CI) | Totals not selected | |
| 29.1 at 3 months | 0 | Mean Difference (IV, Fixed, 95% CI) | 0.0 [0.0, 0.0] | |
| 29.2 at 4‐6 months | 1 | Mean Difference (IV, Fixed, 95% CI) | 0.0 [0.0, 0.0] | |
| 29.3 ≥ 7‐12 months | 0 | Mean Difference (IV, Fixed, 95% CI) | 0.0 [0.0, 0.0] | |
| 30 Left ventricular internal dimension at end‐systole | 1 | Mean Difference (IV, Fixed, 95% CI) | Totals not selected | |
| 30.1 at 3 months | 0 | Mean Difference (IV, Fixed, 95% CI) | 0.0 [0.0, 0.0] | |
| 30.2 at 4‐6 months | 1 | Mean Difference (IV, Fixed, 95% CI) | 0.0 [0.0, 0.0] | |
| 30.3 ≥ 7‐12 months | 0 | Mean Difference (IV, Fixed, 95% CI) | 0.0 [0.0, 0.0] | |
| 31 Intraventricular septal thickness at end‐diastole | 1 | Mean Difference (IV, Fixed, 95% CI) | Totals not selected | |
| 31.1 at 3 months | 0 | Mean Difference (IV, Fixed, 95% CI) | 0.0 [0.0, 0.0] | |
| 31.2 at 4‐6 months | 1 | Mean Difference (IV, Fixed, 95% CI) | 0.0 [0.0, 0.0] | |
| 31.3 ≥ 7‐12 months | 0 | Mean Difference (IV, Fixed, 95% CI) | 0.0 [0.0, 0.0] | |
| 32 Left ventricular posterior wall thickness at end‐diastole | 1 | Mean Difference (IV, Fixed, 95% CI) | Totals not selected | |
| 32.1 at 3 months | 0 | Mean Difference (IV, Fixed, 95% CI) | 0.0 [0.0, 0.0] | |
| 32.2 at 4‐6 months | 1 | Mean Difference (IV, Fixed, 95% CI) | 0.0 [0.0, 0.0] | |
| 32.3 ≥ 7‐12 months | 0 | Mean Difference (IV, Fixed, 95% CI) | 0.0 [0.0, 0.0] | |
| 33 Left ventricular mass | 1 | Mean Difference (IV, Fixed, 95% CI) | Totals not selected | |
| 33.1 at 3 months | 0 | Mean Difference (IV, Fixed, 95% CI) | 0.0 [0.0, 0.0] | |
| 33.2 at 4‐6 months | 1 | Mean Difference (IV, Fixed, 95% CI) | 0.0 [0.0, 0.0] | |
| 33.3 ≥ 7‐12 months | 0 | Mean Difference (IV, Fixed, 95% CI) | 0.0 [0.0, 0.0] | |
| 34 Left ventricular mass index | 1 | Mean Difference (IV, Fixed, 95% CI) | Totals not selected | |
| 34.1 at 3 months | 0 | Mean Difference (IV, Fixed, 95% CI) | 0.0 [0.0, 0.0] | |
| 34.2 at 4‐6 months | 1 | Mean Difference (IV, Fixed, 95% CI) | 0.0 [0.0, 0.0] | |
| 34.3 ≥ 7‐12 months | 0 | Mean Difference (IV, Fixed, 95% CI) | 0.0 [0.0, 0.0] | |
| 35 Fasting plasma glucose | 1 | Mean Difference (IV, Fixed, 95% CI) | Totals not selected | |
| 35.1 at 3 months | 0 | Mean Difference (IV, Fixed, 95% CI) | 0.0 [0.0, 0.0] | |
| 35.2 at 4‐6 months | 0 | Mean Difference (IV, Fixed, 95% CI) | 0.0 [0.0, 0.0] | |
| 35.3 ≥ 7‐12 months | 1 | Mean Difference (IV, Fixed, 95% CI) | 0.0 [0.0, 0.0] | |
| 36 Fasting plasma insulin | 1 | Mean Difference (IV, Fixed, 95% CI) | Totals not selected | |
| 36.1 at 3 months | 0 | Mean Difference (IV, Fixed, 95% CI) | 0.0 [0.0, 0.0] | |
| 36.2 at 5 to 6 months | 0 | Mean Difference (IV, Fixed, 95% CI) | 0.0 [0.0, 0.0] | |
| 36.3 ≥ 7‐12 months | 1 | Mean Difference (IV, Fixed, 95% CI) | 0.0 [0.0, 0.0] | |
| 37 Glucose disappearance | 1 | Mean Difference (IV, Fixed, 95% CI) | Totals not selected | |
| 37.1 at 3 months | 0 | Mean Difference (IV, Fixed, 95% CI) | 0.0 [0.0, 0.0] | |
| 37.2 at 4‐6 months | 0 | Mean Difference (IV, Fixed, 95% CI) | 0.0 [0.0, 0.0] | |
| 37.3 ≥ 7‐12 months | 1 | Mean Difference (IV, Fixed, 95% CI) | 0.0 [0.0, 0.0] |
4.3. Analysis.
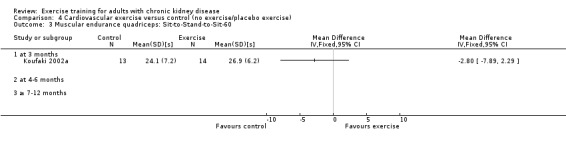
Comparison 4 Cardiovascular exercise versus control (no exercise/placebo exercise), Outcome 3 Muscular endurance quadriceps: Sit‐to‐Stand‐to‐Sit‐60.
4.5. Analysis.
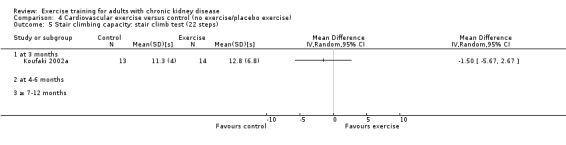
Comparison 4 Cardiovascular exercise versus control (no exercise/placebo exercise), Outcome 5 Stair climbing capacity: stair climb test (22 steps).
4.6. Analysis.
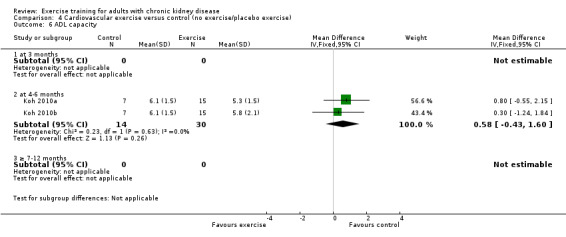
Comparison 4 Cardiovascular exercise versus control (no exercise/placebo exercise), Outcome 6 ADL capacity.
4.13. Analysis.

Comparison 4 Cardiovascular exercise versus control (no exercise/placebo exercise), Outcome 13 SGA.
4.16. Analysis.
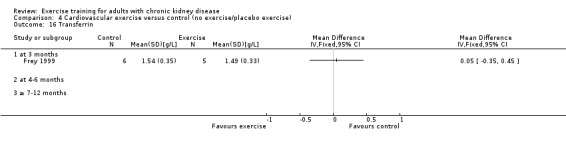
Comparison 4 Cardiovascular exercise versus control (no exercise/placebo exercise), Outcome 16 Transferrin.
4.17. Analysis.
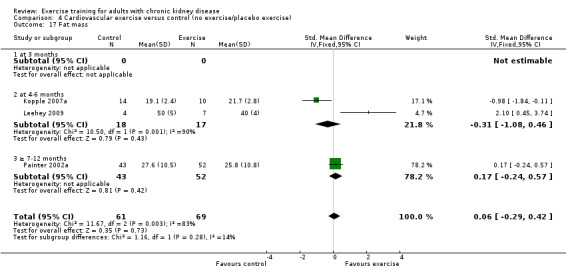
Comparison 4 Cardiovascular exercise versus control (no exercise/placebo exercise), Outcome 17 Fat mass.
4.19. Analysis.
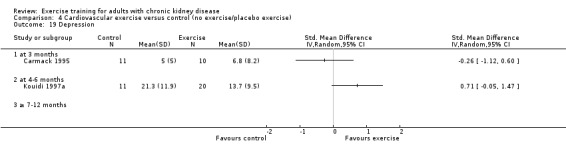
Comparison 4 Cardiovascular exercise versus control (no exercise/placebo exercise), Outcome 19 Depression.
4.22. Analysis.
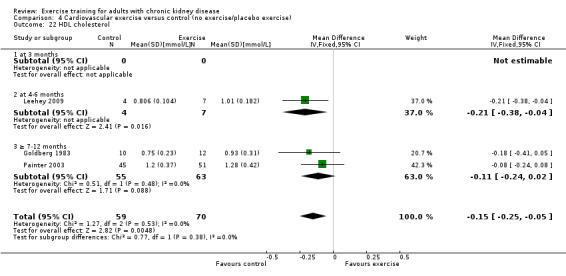
Comparison 4 Cardiovascular exercise versus control (no exercise/placebo exercise), Outcome 22 HDL cholesterol.
4.23. Analysis.
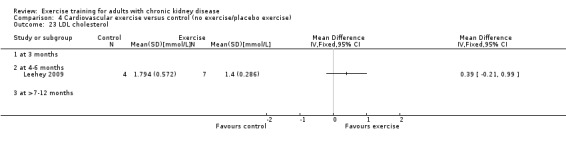
Comparison 4 Cardiovascular exercise versus control (no exercise/placebo exercise), Outcome 23 LDL cholesterol.
4.25. Analysis.
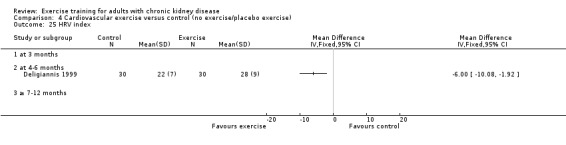
Comparison 4 Cardiovascular exercise versus control (no exercise/placebo exercise), Outcome 25 HRV index.
4.26. Analysis.
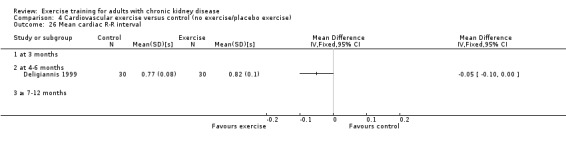
Comparison 4 Cardiovascular exercise versus control (no exercise/placebo exercise), Outcome 26 Mean cardiac R‐R interval.
4.27. Analysis.
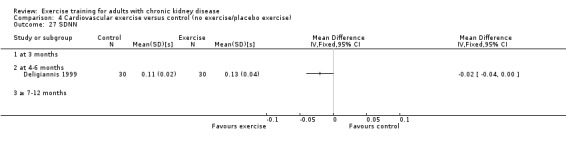
Comparison 4 Cardiovascular exercise versus control (no exercise/placebo exercise), Outcome 27 SDNN.
4.28. Analysis.
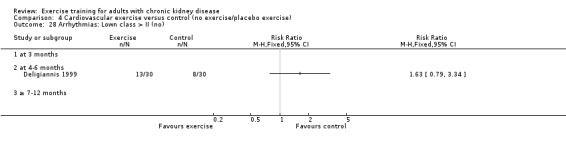
Comparison 4 Cardiovascular exercise versus control (no exercise/placebo exercise), Outcome 28 Arrhythmias: Lown class > II (no).
4.29. Analysis.
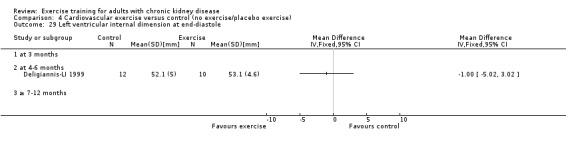
Comparison 4 Cardiovascular exercise versus control (no exercise/placebo exercise), Outcome 29 Left ventricular internal dimension at end‐diastole.
4.30. Analysis.
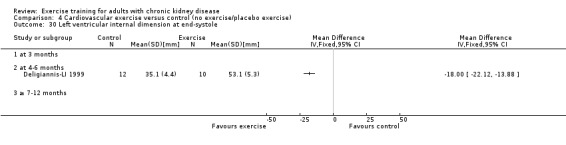
Comparison 4 Cardiovascular exercise versus control (no exercise/placebo exercise), Outcome 30 Left ventricular internal dimension at end‐systole.
4.31. Analysis.
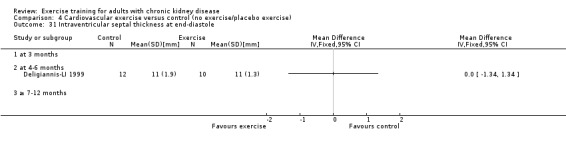
Comparison 4 Cardiovascular exercise versus control (no exercise/placebo exercise), Outcome 31 Intraventricular septal thickness at end‐diastole.
4.32. Analysis.
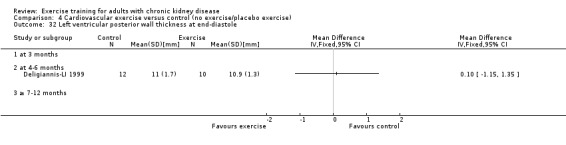
Comparison 4 Cardiovascular exercise versus control (no exercise/placebo exercise), Outcome 32 Left ventricular posterior wall thickness at end‐diastole.
4.33. Analysis.

Comparison 4 Cardiovascular exercise versus control (no exercise/placebo exercise), Outcome 33 Left ventricular mass.
4.34. Analysis.
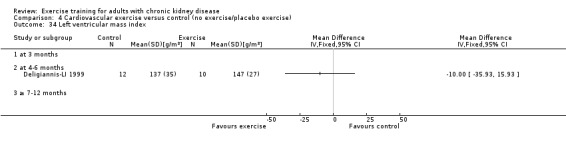
Comparison 4 Cardiovascular exercise versus control (no exercise/placebo exercise), Outcome 34 Left ventricular mass index.
4.35. Analysis.
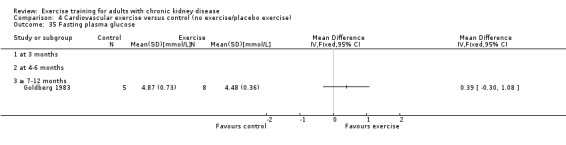
Comparison 4 Cardiovascular exercise versus control (no exercise/placebo exercise), Outcome 35 Fasting plasma glucose.
4.36. Analysis.

Comparison 4 Cardiovascular exercise versus control (no exercise/placebo exercise), Outcome 36 Fasting plasma insulin.
4.37. Analysis.
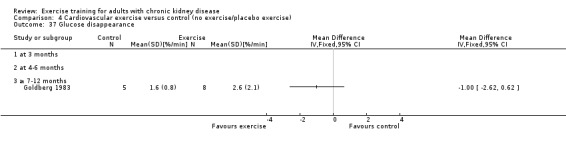
Comparison 4 Cardiovascular exercise versus control (no exercise/placebo exercise), Outcome 37 Glucose disappearance.
Comparison 5. Mixed cardiovascular and resistance exercise versus control (no exercise/placebo exercise).
| Outcome or subgroup title | No. of studies | No. of participants | Statistical method | Effect size |
|---|---|---|---|---|
| 1 Aerobic capacity | 9 | 353 | Std. Mean Difference (IV, Random, 95% CI) | ‐0.77 [‐1.06, ‐0.48] |
| 1.1 at 3 months | 2 | 125 | Std. Mean Difference (IV, Random, 95% CI) | ‐0.45 [‐1.13, 0.22] |
| 1.2 at 4‐6 months | 5 | 136 | Std. Mean Difference (IV, Random, 95% CI) | ‐0.96 [‐1.34, ‐0.59] |
| 1.3 ≥ 7‐12 months | 2 | 92 | Std. Mean Difference (IV, Random, 95% CI) | ‐0.93 [‐1.36, ‐0.49] |
| 2 Muscular strength | 2 | Std. Mean Difference (IV, Random, 95% CI) | Totals not selected | |
| 2.1 at 3 months | 2 | Std. Mean Difference (IV, Random, 95% CI) | 0.0 [0.0, 0.0] | |
| 2.2 at 4‐6 months | 0 | Std. Mean Difference (IV, Random, 95% CI) | 0.0 [0.0, 0.0] | |
| 2.3 ≥ 7‐12 months | 0 | Std. Mean Difference (IV, Random, 95% CI) | 0.0 [0.0, 0.0] | |
| 3 Walking capacity | 2 | Std. Mean Difference (IV, Fixed, 95% CI) | Subtotals only | |
| 3.1 at 3 months | 2 | 46 | Std. Mean Difference (IV, Fixed, 95% CI) | ‐0.43 [‐1.02, 0.16] |
| 3.2 at 4‐6 months | 0 | 0 | Std. Mean Difference (IV, Fixed, 95% CI) | 0.0 [0.0, 0.0] |
| 3.3 ≥ 7‐12 months | 0 | 0 | Std. Mean Difference (IV, Fixed, 95% CI) | 0.0 [0.0, 0.0] |
| 4 ADL capacity | 0 | Mean Difference (IV, Fixed, 95% CI) | Totals not selected | |
| 4.1 at 3 months | 0 | Mean Difference (IV, Fixed, 95% CI) | 0.0 [0.0, 0.0] | |
| 4.2 at 4‐6 months | 0 | Mean Difference (IV, Fixed, 95% CI) | 0.0 [0.0, 0.0] | |
| 4.3 ≥ 7‐12 months | 0 | Mean Difference (IV, Fixed, 95% CI) | 0.0 [0.0, 0.0] | |
| 5 Diastolic blood pressure: resting | 5 | 229 | Mean Difference (IV, Fixed, 95% CI) | 3.77 [1.61, 5.94] |
| 5.1 at 3 months | 2 | 125 | Mean Difference (IV, Fixed, 95% CI) | 0.52 [‐3.85, 4.90] |
| 5.2 at 4‐6 months | 1 | 28 | Mean Difference (IV, Fixed, 95% CI) | 3.0 [‐1.27, 7.27] |
| 5.3 ≥ 7‐12 months | 2 | 76 | Mean Difference (IV, Fixed, 95% CI) | 5.76 [2.70, 8.83] |
| 6 Systolic blood pressure: resting | 4 | 186 | Mean Difference (IV, Fixed, 95% CI) | 5.80 [1.19, 10.41] |
| 6.1 at 3 months | 2 | 125 | Mean Difference (IV, Fixed, 95% CI) | 6.38 [‐1.99, 14.74] |
| 6.2 at 4‐6 months | 1 | 28 | Mean Difference (IV, Fixed, 95% CI) | 8.0 [‐0.89, 16.89] |
| 6.3 ≥ 7‐12 months | 1 | 33 | Mean Difference (IV, Fixed, 95% CI) | 4.0 [‐3.07, 11.07] |
| 7 Heart rate: maximum | 4 | 99 | Mean Difference (IV, Fixed, 95% CI) | ‐5.38 [‐10.33, ‐0.44] |
| 7.1 at 3 months | 0 | 0 | Mean Difference (IV, Fixed, 95% CI) | 0.0 [0.0, 0.0] |
| 7.2 at 4‐6 months | 3 | 66 | Mean Difference (IV, Fixed, 95% CI) | ‐6.08 [‐12.71, 0.54] |
| 7.3 ≥ 7‐12 months | 1 | 33 | Mean Difference (IV, Fixed, 95% CI) | ‐4.5 [‐11.93, 2.93] |
| 8 Heart rate: resting | 3 | 104 | Mean Difference (IV, Random, 95% CI) | 4.94 [2.18, 7.70] |
| 8.1 at 3 months | 0 | 0 | Mean Difference (IV, Random, 95% CI) | 0.0 [0.0, 0.0] |
| 8.2 at 4‐6 months | 1 | 28 | Mean Difference (IV, Random, 95% CI) | 4.5 [‐2.03, 11.03] |
| 8.3 ≥ 7‐12 months | 2 | 76 | Mean Difference (IV, Random, 95% CI) | 4.81 [1.17, 8.46] |
| 9 Fat mass | 1 | Mean Difference (IV, Fixed, 95% CI) | Totals not selected | |
| 9.1 at 3 months | 0 | Mean Difference (IV, Fixed, 95% CI) | 0.0 [0.0, 0.0] | |
| 9.2 at 4‐6 months | 1 | Mean Difference (IV, Fixed, 95% CI) | 0.0 [0.0, 0.0] | |
| 9.3 ≥ 7‐12 months | 0 | Mean Difference (IV, Fixed, 95% CI) | 0.0 [0.0, 0.0] | |
| 10 Depression | 2 | Std. Mean Difference (IV, Fixed, 95% CI) | Totals not selected | |
| 10.1 at 3 months | 1 | Std. Mean Difference (IV, Fixed, 95% CI) | 0.0 [0.0, 0.0] | |
| 10.2 at 4‐6 months | 0 | Std. Mean Difference (IV, Fixed, 95% CI) | 0.0 [0.0, 0.0] | |
| 10.3 ≥ 7‐12 months | 1 | Std. Mean Difference (IV, Fixed, 95% CI) | 0.0 [0.0, 0.0] | |
| 11 Total cholesterol | 1 | Mean Difference (IV, Random, 95% CI) | Totals not selected | |
| 11.1 at 3 months | 1 | Mean Difference (IV, Random, 95% CI) | 0.0 [0.0, 0.0] | |
| 11.2 at 4‐6 months | 0 | Mean Difference (IV, Random, 95% CI) | 0.0 [0.0, 0.0] | |
| 11.3 ≥ 7‐12 months | 0 | Mean Difference (IV, Random, 95% CI) | 0.0 [0.0, 0.0] | |
| 12 Mid‐thigh muscle area | 1 | Mean Difference (IV, Fixed, 95% CI) | Totals not selected | |
| 12.1 at 3 months | 0 | Mean Difference (IV, Fixed, 95% CI) | 0.0 [0.0, 0.0] | |
| 12.2 at 4‐6 months | 1 | Mean Difference (IV, Fixed, 95% CI) | 0.0 [0.0, 0.0] | |
| 12.3 ≥ 7‐12 months | 0 | Mean Difference (IV, Fixed, 95% CI) | 0.0 [0.0, 0.0] | |
| 13 HRV index | 1 | Mean Difference (IV, Fixed, 95% CI) | Totals not selected | |
| 13.1 at 3 months | 0 | Mean Difference (IV, Fixed, 95% CI) | 0.0 [0.0, 0.0] | |
| 13.2 at 4‐6 months | 1 | Mean Difference (IV, Fixed, 95% CI) | 0.0 [0.0, 0.0] | |
| 13.3 ≥ 7‐12 months | 0 | Mean Difference (IV, Fixed, 95% CI) | 0.0 [0.0, 0.0] | |
| 14 Mean cardiac R‐R interval | 2 | Mean Difference (IV, Fixed, 95% CI) | Totals not selected | |
| 14.1 at 3 months | 0 | Mean Difference (IV, Fixed, 95% CI) | 0.0 [0.0, 0.0] | |
| 14.2 at 4‐6 months | 1 | Mean Difference (IV, Fixed, 95% CI) | 0.0 [0.0, 0.0] | |
| 14.3 ≥ 7‐12 months | 1 | Mean Difference (IV, Fixed, 95% CI) | 0.0 [0.0, 0.0] | |
| 15 SDNN | 2 | Mean Difference (IV, Fixed, 95% CI) | Totals not selected | |
| 15.1 at 3 months | 0 | Mean Difference (IV, Fixed, 95% CI) | 0.0 [0.0, 0.0] | |
| 15.2 at 4‐6 months | 1 | Mean Difference (IV, Fixed, 95% CI) | 0.0 [0.0, 0.0] | |
| 15.3 ≥ 7‐12 months | 1 | Mean Difference (IV, Fixed, 95% CI) | 0.0 [0.0, 0.0] | |
| 16 Arrhythmias: Lown class > II (no) | 1 | Risk Ratio (M‐H, Fixed, 95% CI) | Totals not selected | |
| 16.1 at 3 months | 0 | Risk Ratio (M‐H, Fixed, 95% CI) | 0.0 [0.0, 0.0] | |
| 16.2 at 4‐6 months | 1 | Risk Ratio (M‐H, Fixed, 95% CI) | 0.0 [0.0, 0.0] | |
| 16.3 ≥ 7‐12 months | 0 | Risk Ratio (M‐H, Fixed, 95% CI) | 0.0 [0.0, 0.0] | |
| 17 Left ventricular internal dimension at end‐diastole | 1 | Mean Difference (IV, Fixed, 95% CI) | Totals not selected | |
| 17.1 at 3 months | 0 | Mean Difference (IV, Fixed, 95% CI) | 0.0 [0.0, 0.0] | |
| 17.2 at 4‐6 months | 1 | Mean Difference (IV, Fixed, 95% CI) | 0.0 [0.0, 0.0] | |
| 17.3 ≥ 7‐12 months | 0 | Mean Difference (IV, Fixed, 95% CI) | 0.0 [0.0, 0.0] | |
| 18 Left ventricular internal dimension at end‐systole | 1 | Mean Difference (IV, Fixed, 95% CI) | Totals not selected | |
| 18.1 at 3 months | 0 | Mean Difference (IV, Fixed, 95% CI) | 0.0 [0.0, 0.0] | |
| 18.2 at 4‐6 months | 1 | Mean Difference (IV, Fixed, 95% CI) | 0.0 [0.0, 0.0] | |
| 18.3 ≥ 7‐12 months | 0 | Mean Difference (IV, Fixed, 95% CI) | 0.0 [0.0, 0.0] | |
| 19 Intraventricular septal thickness at end‐diastole | 1 | Mean Difference (IV, Fixed, 95% CI) | Totals not selected | |
| 19.1 at 3 months | 0 | Mean Difference (IV, Fixed, 95% CI) | 0.0 [0.0, 0.0] | |
| 19.2 at 4‐6 months | 1 | Mean Difference (IV, Fixed, 95% CI) | 0.0 [0.0, 0.0] | |
| 19.3 ≥ 7‐12 months | 0 | Mean Difference (IV, Fixed, 95% CI) | 0.0 [0.0, 0.0] | |
| 20 Left ventricular posterior wall thickness at end‐diastole | 1 | Mean Difference (IV, Fixed, 95% CI) | Totals not selected | |
| 20.1 at 3 months | 0 | Mean Difference (IV, Fixed, 95% CI) | 0.0 [0.0, 0.0] | |
| 20.2 at 4‐6 months | 1 | Mean Difference (IV, Fixed, 95% CI) | 0.0 [0.0, 0.0] | |
| 20.3 ≥ 7‐12 months | 0 | Mean Difference (IV, Fixed, 95% CI) | 0.0 [0.0, 0.0] | |
| 21 Left ventricular mass | 1 | Mean Difference (IV, Fixed, 95% CI) | Totals not selected | |
| 21.1 at 3 months | 0 | Mean Difference (IV, Fixed, 95% CI) | 0.0 [0.0, 0.0] | |
| 21.2 at 4‐6 months | 1 | Mean Difference (IV, Fixed, 95% CI) | 0.0 [0.0, 0.0] | |
| 21.3 ≥ 7‐12 months | 0 | Mean Difference (IV, Fixed, 95% CI) | 0.0 [0.0, 0.0] | |
| 22 Left ventricular mass index | 2 | Mean Difference (IV, Fixed, 95% CI) | Totals not selected | |
| 22.1 at 3 months | 0 | Mean Difference (IV, Fixed, 95% CI) | 0.0 [0.0, 0.0] | |
| 22.2 at 4‐6 months | 1 | Mean Difference (IV, Fixed, 95% CI) | 0.0 [0.0, 0.0] | |
| 22.3 ≥ 7‐12 months | 1 | Mean Difference (IV, Fixed, 95% CI) | 0.0 [0.0, 0.0] |
5.9. Analysis.

Comparison 5 Mixed cardiovascular and resistance exercise versus control (no exercise/placebo exercise), Outcome 9 Fat mass.
5.10. Analysis.
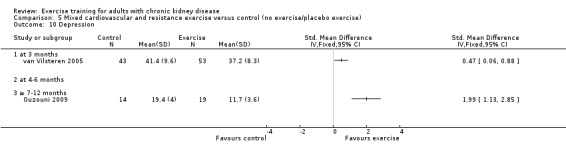
Comparison 5 Mixed cardiovascular and resistance exercise versus control (no exercise/placebo exercise), Outcome 10 Depression.
5.12. Analysis.
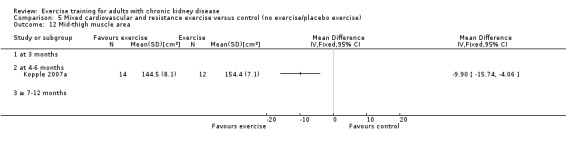
Comparison 5 Mixed cardiovascular and resistance exercise versus control (no exercise/placebo exercise), Outcome 12 Mid‐thigh muscle area.
5.13. Analysis.
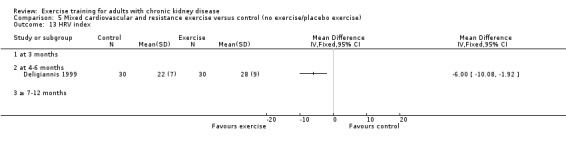
Comparison 5 Mixed cardiovascular and resistance exercise versus control (no exercise/placebo exercise), Outcome 13 HRV index.
5.14. Analysis.

Comparison 5 Mixed cardiovascular and resistance exercise versus control (no exercise/placebo exercise), Outcome 14 Mean cardiac R‐R interval.
5.15. Analysis.
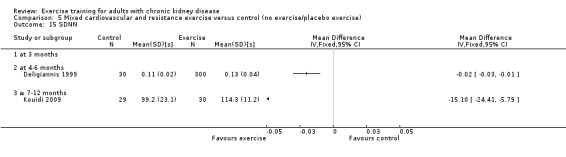
Comparison 5 Mixed cardiovascular and resistance exercise versus control (no exercise/placebo exercise), Outcome 15 SDNN.
5.16. Analysis.
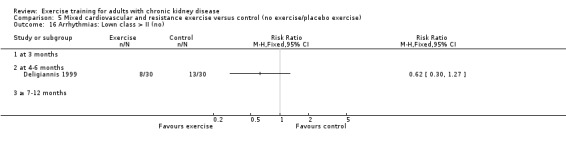
Comparison 5 Mixed cardiovascular and resistance exercise versus control (no exercise/placebo exercise), Outcome 16 Arrhythmias: Lown class > II (no).
5.17. Analysis.
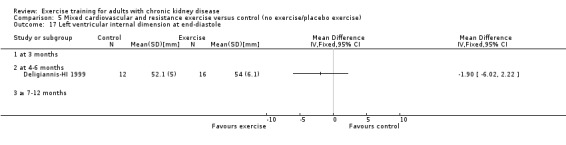
Comparison 5 Mixed cardiovascular and resistance exercise versus control (no exercise/placebo exercise), Outcome 17 Left ventricular internal dimension at end‐diastole.
5.18. Analysis.
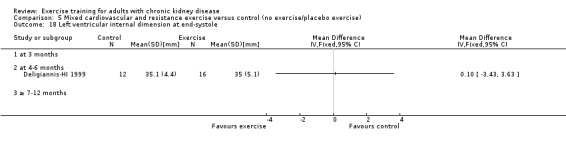
Comparison 5 Mixed cardiovascular and resistance exercise versus control (no exercise/placebo exercise), Outcome 18 Left ventricular internal dimension at end‐systole.
5.19. Analysis.
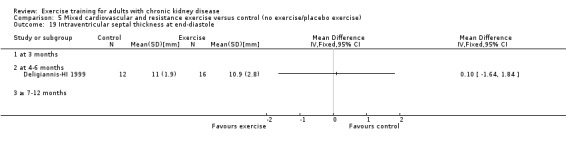
Comparison 5 Mixed cardiovascular and resistance exercise versus control (no exercise/placebo exercise), Outcome 19 Intraventricular septal thickness at end‐diastole.
5.20. Analysis.
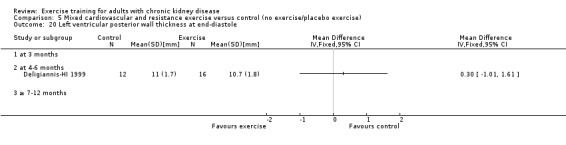
Comparison 5 Mixed cardiovascular and resistance exercise versus control (no exercise/placebo exercise), Outcome 20 Left ventricular posterior wall thickness at end‐diastole.
5.21. Analysis.
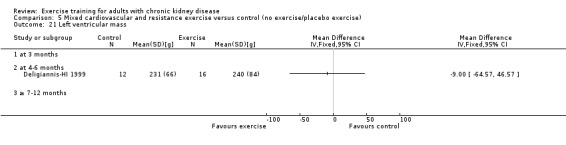
Comparison 5 Mixed cardiovascular and resistance exercise versus control (no exercise/placebo exercise), Outcome 21 Left ventricular mass.
5.22. Analysis.
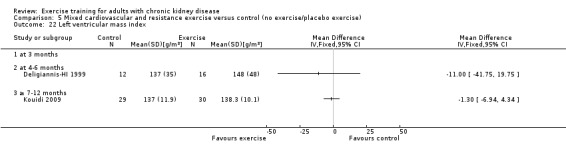
Comparison 5 Mixed cardiovascular and resistance exercise versus control (no exercise/placebo exercise), Outcome 22 Left ventricular mass index.
Comparison 6. Resistance training versus control (no exercise/placebo exercise).
| Outcome or subgroup title | No. of studies | No. of participants | Statistical method | Effect size |
|---|---|---|---|---|
| 1 Aerobic capacity | 1 | Std. Mean Difference (IV, Fixed, 95% CI) | Totals not selected | |
| 1.1 at 3 months | 0 | Std. Mean Difference (IV, Fixed, 95% CI) | 0.0 [0.0, 0.0] | |
| 1.2 at 4‐6 months | 1 | Std. Mean Difference (IV, Fixed, 95% CI) | 0.0 [0.0, 0.0] | |
| 1.3 ≥ 7‐12 months | 0 | Std. Mean Difference (IV, Fixed, 95% CI) | 0.0 [0.0, 0.0] | |
| 2 Muscular strength (high value = improved) | 4 | 153 | Std. Mean Difference (IV, Fixed, 95% CI) | ‐0.60 [‐0.92, ‐0.27] |
| 2.1 at 3 months | 3 | 111 | Std. Mean Difference (IV, Fixed, 95% CI) | ‐0.58 [‐0.96, ‐0.19] |
| 2.2 at 4‐6 months | 1 | 42 | Std. Mean Difference (IV, Fixed, 95% CI) | ‐0.65 [‐1.27, ‐0.03] |
| 2.3 ≥ 7‐12 months | 0 | 0 | Std. Mean Difference (IV, Fixed, 95% CI) | 0.0 [0.0, 0.0] |
| 3 Muscular strength (low value = improved) | 1 | Std. Mean Difference (IV, Fixed, 95% CI) | Totals not selected | |
| 3.1 3 months | 0 | Std. Mean Difference (IV, Fixed, 95% CI) | 0.0 [0.0, 0.0] | |
| 3.2 at 4‐6 months | 1 | Std. Mean Difference (IV, Fixed, 95% CI) | 0.0 [0.0, 0.0] | |
| 3.3 ≥ 7‐12 months | 0 | Std. Mean Difference (IV, Fixed, 95% CI) | 0.0 [0.0, 0.0] | |
| 4 Muscular endurance quadriceps: Sit‐to‐Stand‐to‐Sit‐60 | 1 | Mean Difference (IV, Fixed, 95% CI) | Totals not selected | |
| 4.1 at 3 months | 0 | Mean Difference (IV, Fixed, 95% CI) | 0.0 [0.0, 0.0] | |
| 4.2 at 4‐6 months | 1 | Mean Difference (IV, Fixed, 95% CI) | 0.0 [0.0, 0.0] | |
| 4.3 ≥ 7‐12 months | 0 | Mean Difference (IV, Fixed, 95% CI) | 0.0 [0.0, 0.0] | |
| 5 Walking capacity | 2 | Std. Mean Difference (IV, Fixed, 95% CI) | Totals not selected | |
| 5.1 at 3 months | 1 | Std. Mean Difference (IV, Fixed, 95% CI) | 0.0 [0.0, 0.0] | |
| 5.2 at 4‐6 months | 1 | Std. Mean Difference (IV, Fixed, 95% CI) | 0.0 [0.0, 0.0] | |
| 5.3 ≥ 7‐12 months | 0 | Std. Mean Difference (IV, Fixed, 95% CI) | 0.0 [0.0, 0.0] | |
| 6 Albumin | 2 | Mean Difference (IV, Fixed, 95% CI) | Subtotals only | |
| 6.1 at 3 months | 2 | 75 | Mean Difference (IV, Fixed, 95% CI) | ‐1.46 [‐2.89, ‐0.04] |
| 6.2 at 4‐6 months | 0 | 0 | Mean Difference (IV, Fixed, 95% CI) | 0.0 [0.0, 0.0] |
| 6.3 ≥ 7‐12 months | 0 | 0 | Mean Difference (IV, Fixed, 95% CI) | 0.0 [0.0, 0.0] |
| 7 Pre‐albumin | 2 | Mean Difference (IV, Fixed, 95% CI) | Subtotals only | |
| 7.1 at 3 months | 2 | 75 | Mean Difference (IV, Fixed, 95% CI) | ‐45.24 [‐73.90, ‐16.57] |
| 7.2 at 4‐6 months | 0 | 0 | Mean Difference (IV, Fixed, 95% CI) | 0.0 [0.0, 0.0] |
| 7.3 ≥ 7‐12 months | 0 | 0 | Mean Difference (IV, Fixed, 95% CI) | 0.0 [0.0, 0.0] |
| 8 Energy intake | 2 | Mean Difference (IV, Fixed, 95% CI) | Subtotals only | |
| 8.1 at 3 months | 2 | 75 | Mean Difference (IV, Fixed, 95% CI) | ‐3.70 [‐7.46, 0.06] |
| 8.2 at 4‐6 months | 0 | 0 | Mean Difference (IV, Fixed, 95% CI) | 0.0 [0.0, 0.0] |
| 8.3 ≥ 7‐12 months | 0 | 0 | Mean Difference (IV, Fixed, 95% CI) | 0.0 [0.0, 0.0] |
| 9 Protein intake | 1 | Mean Difference (IV, Fixed, 95% CI) | Totals not selected | |
| 9.1 at 3 months | 1 | Mean Difference (IV, Fixed, 95% CI) | 0.0 [0.0, 0.0] | |
| 9.2 at 4‐6 months | 0 | Mean Difference (IV, Fixed, 95% CI) | 0.0 [0.0, 0.0] | |
| 9.3 ≥ 7‐12 months | 0 | Mean Difference (IV, Fixed, 95% CI) | 0.0 [0.0, 0.0] | |
| 10 Transferrin | 1 | Mean Difference (IV, Fixed, 95% CI) | Totals not selected | |
| 10.1 at 3 months | 1 | Mean Difference (IV, Fixed, 95% CI) | 0.0 [0.0, 0.0] | |
| 10.2 at 4‐6 months | 0 | Mean Difference (IV, Fixed, 95% CI) | 0.0 [0.0, 0.0] | |
| 10.3 ≥ 7‐12 months | 0 | Mean Difference (IV, Fixed, 95% CI) | 0.0 [0.0, 0.0] | |
| 11 Fat mass | 2 | Std. Mean Difference (IV, Fixed, 95% CI) | Totals not selected | |
| 11.1 at 3 months | 1 | Std. Mean Difference (IV, Fixed, 95% CI) | 0.0 [0.0, 0.0] | |
| 11.2 at 4‐6 months | 1 | Std. Mean Difference (IV, Fixed, 95% CI) | 0.0 [0.0, 0.0] | |
| 11.3 ≥ 7‐12 months | 0 | Std. Mean Difference (IV, Fixed, 95% CI) | 0.0 [0.0, 0.0] | |
| 12 Waist circumference | 1 | Mean Difference (IV, Random, 95% CI) | Totals not selected | |
| 12.1 at 3 months | 1 | Mean Difference (IV, Random, 95% CI) | 0.0 [0.0, 0.0] | |
| 12.2 at 4‐6 months | 0 | Mean Difference (IV, Random, 95% CI) | 0.0 [0.0, 0.0] | |
| 12.3 ≥ 7‐12 months | 0 | Mean Difference (IV, Random, 95% CI) | 0.0 [0.0, 0.0] | |
| 13 Mid‐arm circumference | 1 | Mean Difference (IV, Fixed, 95% CI) | Totals not selected | |
| 13.1 at 3 months | 1 | Mean Difference (IV, Fixed, 95% CI) | 0.0 [0.0, 0.0] | |
| 13.2 at 4‐6 months | 0 | Mean Difference (IV, Fixed, 95% CI) | 0.0 [0.0, 0.0] | |
| 13.3 ≥ 9‐12 months | 0 | Mean Difference (IV, Fixed, 95% CI) | 0.0 [0.0, 0.0] | |
| 14 Mid‐calf circumference | 1 | Mean Difference (IV, Fixed, 95% CI) | Totals not selected | |
| 14.1 at 3 months | 1 | Mean Difference (IV, Fixed, 95% CI) | 0.0 [0.0, 0.0] | |
| 14.2 at 4‐6 months | 0 | Mean Difference (IV, Fixed, 95% CI) | 0.0 [0.0, 0.0] | |
| 14.3 ≥ 7‐12 months | 0 | Mean Difference (IV, Fixed, 95% CI) | 0.0 [0.0, 0.0] | |
| 15 Mid‐thigh circumference | 1 | Mean Difference (IV, Fixed, 95% CI) | Totals not selected | |
| 15.1 at 3 months | 1 | Mean Difference (IV, Fixed, 95% CI) | 0.0 [0.0, 0.0] | |
| 15.2 at 4‐6 months | 0 | Mean Difference (IV, Fixed, 95% CI) | 0.0 [0.0, 0.0] | |
| 15.3 ≥ 7‐12 months | 0 | Mean Difference (IV, Fixed, 95% CI) | 0.0 [0.0, 0.0] | |
| 16 Interleukin 6 | 1 | Mean Difference (IV, Random, 95% CI) | Totals not selected | |
| 16.1 at 3 months | 1 | Mean Difference (IV, Random, 95% CI) | 0.0 [0.0, 0.0] | |
| 16.2 at 4‐6 months | 0 | Mean Difference (IV, Random, 95% CI) | 0.0 [0.0, 0.0] | |
| 16.3 ≥ 7‐12 months | 0 | Mean Difference (IV, Random, 95% CI) | 0.0 [0.0, 0.0] | |
| 17 Lymphocytes (x 109 L) | 1 | Mean Difference (IV, Fixed, 95% CI) | Totals not selected | |
| 17.1 at 3 months | 1 | Mean Difference (IV, Fixed, 95% CI) | 0.0 [0.0, 0.0] | |
| 17.2 at 4‐6 months | 0 | Mean Difference (IV, Fixed, 95% CI) | 0.0 [0.0, 0.0] | |
| 17.3 ≥ 7‐12 months | 0 | Mean Difference (IV, Fixed, 95% CI) | 0.0 [0.0, 0.0] | |
| 18 Protein catabolic rate | 1 | Mean Difference (IV, Fixed, 95% CI) | Totals not selected | |
| 18.1 at 3 months | 1 | Mean Difference (IV, Fixed, 95% CI) | 0.0 [0.0, 0.0] | |
| 18.2 at 4‐6 months | 0 | Mean Difference (IV, Fixed, 95% CI) | 0.0 [0.0, 0.0] | |
| 18.3 ≥ 7‐12 months | 0 | Mean Difference (IV, Fixed, 95% CI) | 0.0 [0.0, 0.0] | |
| 19 Physical activity | 1 | Std. Mean Difference (IV, Fixed, 95% CI) | Totals not selected | |
| 19.1 at 3 months | 0 | Std. Mean Difference (IV, Fixed, 95% CI) | 0.0 [0.0, 0.0] | |
| 19.2 at 4‐6 months | 1 | Std. Mean Difference (IV, Fixed, 95% CI) | 0.0 [0.0, 0.0] | |
| 19.3 ≥ 7‐12 months | 0 | Std. Mean Difference (IV, Fixed, 95% CI) | 0.0 [0.0, 0.0] | |
| 20 Type I muscle fibre area | 1 | Mean Difference (IV, Fixed, 95% CI) | Totals not selected | |
| 20.1 at 3 months | 1 | Mean Difference (IV, Fixed, 95% CI) | 0.0 [0.0, 0.0] | |
| 20.2 at 4‐6 months | 0 | Mean Difference (IV, Fixed, 95% CI) | 0.0 [0.0, 0.0] | |
| 20.3 ≥ 7‐12 months | 0 | Mean Difference (IV, Fixed, 95% CI) | 0.0 [0.0, 0.0] | |
| 21 Mid‐thigh muscle area | 4 | 135 | Mean Difference (IV, Fixed, 95% CI) | ‐6.74 [‐11.18, ‐2.30] |
| 21.1 at 3 months | 3 | 111 | Mean Difference (IV, Fixed, 95% CI) | ‐3.22 [‐9.67, 3.24] |
| 21.2 at 4‐6 months | 1 | 24 | Mean Difference (IV, Fixed, 95% CI) | ‐9.90 [‐16.01, ‐3.79] |
| 21.3 ≥ 7‐12 months | 0 | 0 | Mean Difference (IV, Fixed, 95% CI) | 0.0 [0.0, 0.0] |
| 22 Thigh muscle attenuation (Hounsfield units) | 1 | Mean Difference (IV, Fixed, 95% CI) | Totals not selected | |
| 22.1 at 3 months | 1 | Mean Difference (IV, Fixed, 95% CI) | 0.0 [0.0, 0.0] | |
| 22.2 at 4‐6 months | 0 | Mean Difference (IV, Fixed, 95% CI) | 0.0 [0.0, 0.0] | |
| 22.3 ≥ 7‐12 months | 0 | Mean Difference (IV, Fixed, 95% CI) | 0.0 [0.0, 0.0] |
6.3. Analysis.
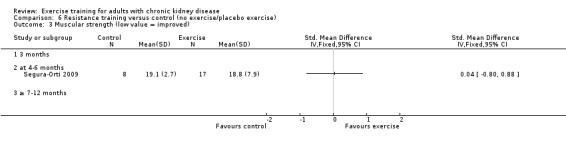
Comparison 6 Resistance training versus control (no exercise/placebo exercise), Outcome 3 Muscular strength (low value = improved).
6.4. Analysis.
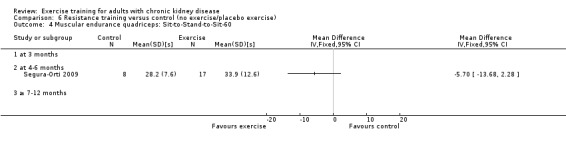
Comparison 6 Resistance training versus control (no exercise/placebo exercise), Outcome 4 Muscular endurance quadriceps: Sit‐to‐Stand‐to‐Sit‐60.
6.10. Analysis.
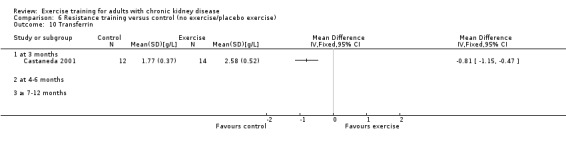
Comparison 6 Resistance training versus control (no exercise/placebo exercise), Outcome 10 Transferrin.
6.11. Analysis.
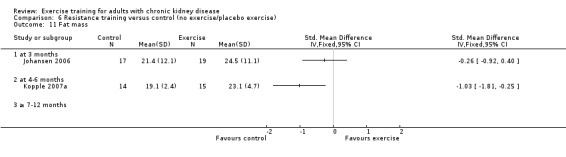
Comparison 6 Resistance training versus control (no exercise/placebo exercise), Outcome 11 Fat mass.
6.12. Analysis.

Comparison 6 Resistance training versus control (no exercise/placebo exercise), Outcome 12 Waist circumference.
6.13. Analysis.

Comparison 6 Resistance training versus control (no exercise/placebo exercise), Outcome 13 Mid‐arm circumference.
6.14. Analysis.
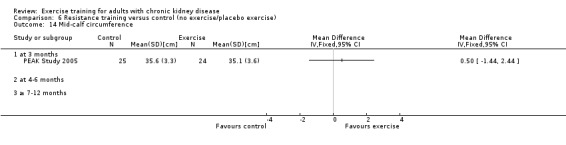
Comparison 6 Resistance training versus control (no exercise/placebo exercise), Outcome 14 Mid‐calf circumference.
6.15. Analysis.
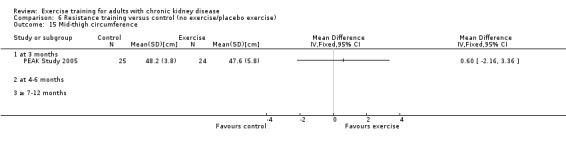
Comparison 6 Resistance training versus control (no exercise/placebo exercise), Outcome 15 Mid‐thigh circumference.
6.16. Analysis.
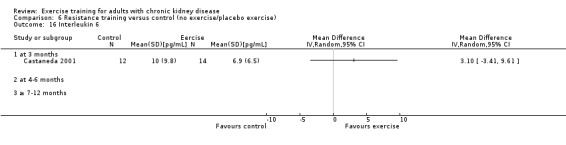
Comparison 6 Resistance training versus control (no exercise/placebo exercise), Outcome 16 Interleukin 6.
6.17. Analysis.

Comparison 6 Resistance training versus control (no exercise/placebo exercise), Outcome 17 Lymphocytes (x 109 L).
6.18. Analysis.
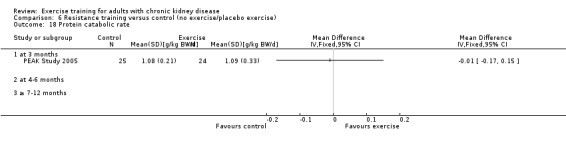
Comparison 6 Resistance training versus control (no exercise/placebo exercise), Outcome 18 Protein catabolic rate.
6.20. Analysis.
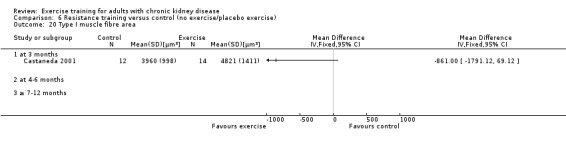
Comparison 6 Resistance training versus control (no exercise/placebo exercise), Outcome 20 Type I muscle fibre area.
6.21. Analysis.
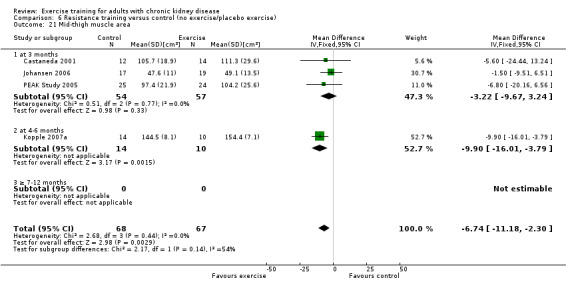
Comparison 6 Resistance training versus control (no exercise/placebo exercise), Outcome 21 Mid‐thigh muscle area.
6.22. Analysis.
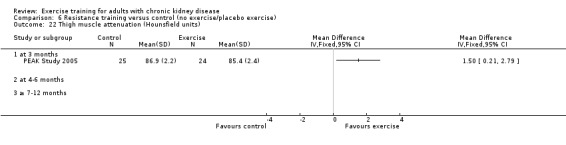
Comparison 6 Resistance training versus control (no exercise/placebo exercise), Outcome 22 Thigh muscle attenuation (Hounsfield units).
Comparison 7. Supervised exercise versus control (no exercise/placebo exercise).
| Outcome or subgroup title | No. of studies | No. of participants | Statistical method | Effect size |
|---|---|---|---|---|
| 1 Aerobic capacity | 16 | 538 | Std. Mean Difference (IV, Fixed, 95% CI) | ‐0.65 [‐0.83, ‐0.47] |
| 1.1 at 3 months | 5 | 184 | Std. Mean Difference (IV, Fixed, 95% CI) | ‐0.32 [‐0.62, ‐0.03] |
| 1.2 at 4‐6 months | 8 | 237 | Std. Mean Difference (IV, Fixed, 95% CI) | ‐0.83 [‐1.11, ‐0.56] |
| 1.3 ≥ 7‐12 months | 3 | 117 | Std. Mean Difference (IV, Fixed, 95% CI) | ‐0.84 [‐1.23, ‐0.46] |
| 2 Muscular strength (high value = improved) | 7 | 248 | Std. Mean Difference (IV, Fixed, 95% CI) | ‐0.57 [‐0.83, ‐0.32] |
| 2.1 at 3 months | 5 | 177 | Std. Mean Difference (IV, Fixed, 95% CI) | ‐0.60 [‐0.90, ‐0.29] |
| 2.2 at 4‐6 months | 2 | 71 | Std. Mean Difference (IV, Fixed, 95% CI) | ‐0.52 [‐0.99, ‐0.05] |
| 2.3 ≥ 7‐12 months | 0 | 0 | Std. Mean Difference (IV, Fixed, 95% CI) | 0.0 [0.0, 0.0] |
| 3 Muscular strength (low value = improved) | 3 | 148 | Std. Mean Difference (IV, Fixed, 95% CI) | 0.58 [0.25, 0.92] |
| 3.1 at 3 months | 2 | 123 | Std. Mean Difference (IV, Fixed, 95% CI) | 0.69 [0.32, 1.05] |
| 3.2 at 4‐6 months | 1 | 25 | Std. Mean Difference (IV, Fixed, 95% CI) | 0.04 [‐0.80, 0.88] |
| 3.3 ≥ 7‐12 months | 0 | 0 | Std. Mean Difference (IV, Fixed, 95% CI) | 0.0 [0.0, 0.0] |
| 4 Muscular endurance quadriceps: Sit‐to‐Stand‐to‐Sit‐60 | 2 | 52 | Mean Difference (IV, Fixed, 95% CI) | ‐3.64 [‐7.93, 0.65] |
| 4.1 at 3 months | 1 | 27 | Mean Difference (IV, Fixed, 95% CI) | ‐2.80 [‐7.89, 2.29] |
| 4.2 at 4‐6 months | 1 | 25 | Mean Difference (IV, Fixed, 95% CI) | ‐5.70 [‐13.68, 2.28] |
| 4.3 ≥ 7‐12 months | 0 | 0 | Mean Difference (IV, Fixed, 95% CI) | 0.0 [0.0, 0.0] |
| 5 Walking capacity | 5 | 160 | Std. Mean Difference (IV, Fixed, 95% CI) | ‐0.36 [‐0.68, ‐0.04] |
| 5.1 at 3 months | 3 | 105 | Std. Mean Difference (IV, Fixed, 95% CI) | ‐0.49 [‐0.88, ‐0.10] |
| 5.2 at 4‐6 months | 2 | 55 | Std. Mean Difference (IV, Fixed, 95% CI) | ‐0.10 [‐0.65, 0.46] |
| 5.3 ≥ 7‐12 months | 0 | 0 | Std. Mean Difference (IV, Fixed, 95% CI) | 0.0 [0.0, 0.0] |
| 6 Stair climbing capacity: stair climb test (22 steps) | 1 | Mean Difference (IV, Fixed, 95% CI) | Totals not selected | |
| 6.1 at 3 months | 1 | Mean Difference (IV, Fixed, 95% CI) | 0.0 [0.0, 0.0] | |
| 6.2 at 4‐6 months | 0 | Mean Difference (IV, Fixed, 95% CI) | 0.0 [0.0, 0.0] | |
| 6.3 ≥ 7‐12 months | 0 | Mean Difference (IV, Fixed, 95% CI) | 0.0 [0.0, 0.0] | |
| 7 ADL capacity | 2 | Std. Mean Difference (IV, Random, 95% CI) | Totals not selected | |
| 7.1 at 3 months | 0 | Std. Mean Difference (IV, Random, 95% CI) | 0.0 [0.0, 0.0] | |
| 7.2 at 4‐6 months | 2 | Std. Mean Difference (IV, Random, 95% CI) | 0.0 [0.0, 0.0] | |
| 7.3 ≥ 7‐12 months | 0 | Std. Mean Difference (IV, Random, 95% CI) | 0.0 [0.0, 0.0] | |
| 8 Diastolic blood pressure: resting | 7 | 283 | Mean Difference (IV, Fixed, 95% CI) | 3.29 [1.21, 5.36] |
| 8.1 at 3 months | 2 | 125 | Mean Difference (IV, Fixed, 95% CI) | 0.52 [‐3.85, 4.90] |
| 8.2 at 4‐6 months | 2 | 57 | Mean Difference (IV, Fixed, 95% CI) | 1.39 [‐2.52, 5.29] |
| 8.3 ≥ 7‐12 months | 3 | 101 | Mean Difference (IV, Fixed, 95% CI) | 5.65 [2.69, 8.62] |
| 9 Systolic blood pressure: resting | 5 | 211 | Mean Difference (IV, Random, 95% CI) | 5.88 [1.42, 10.34] |
| 9.1 at 3 months | 2 | 125 | Mean Difference (IV, Random, 95% CI) | 6.38 [‐1.99, 14.74] |
| 9.2 at 4‐6 months | 1 | 28 | Mean Difference (IV, Random, 95% CI) | 8.0 [‐0.89, 16.89] |
| 9.3 ≥ 7‐12 months | 2 | 58 | Mean Difference (IV, Random, 95% CI) | 4.43 [‐2.12, 10.97] |
| 10 Heart rate: maximum | 8 | 194 | Mean Difference (IV, Fixed, 95% CI) | ‐6.62 [‐11.00, ‐2.24] |
| 10.1 at 3 months | 2 | 46 | Mean Difference (IV, Fixed, 95% CI) | ‐10.11 [‐21.79, 1.57] |
| 10.2 at 4‐6 months | 5 | 115 | Mean Difference (IV, Fixed, 95% CI) | ‐7.11 [‐13.23, ‐0.98] |
| 10.3 ≥ 7‐12 months | 1 | 33 | Mean Difference (IV, Fixed, 95% CI) | ‐4.5 [‐11.93, 2.93] |
| 11 Heart rate: resting | 5 | 158 | Mean Difference (IV, Fixed, 95% CI) | 4.14 [1.59, 6.70] |
| 11.1 at 3 months | 0 | 0 | Mean Difference (IV, Fixed, 95% CI) | 0.0 [0.0, 0.0] |
| 11.2 at 4‐6 months | 2 | 57 | Mean Difference (IV, Fixed, 95% CI) | 3.75 [‐1.48, 8.98] |
| 11.3 ≥ 7‐12 months | 3 | 101 | Mean Difference (IV, Fixed, 95% CI) | 4.27 [1.34, 7.20] |
| 12 Albumin | 2 | Mean Difference (IV, Random, 95% CI) | Subtotals only | |
| 12.1 at 3 months | 2 | 75 | Mean Difference (IV, Random, 95% CI) | ‐1.46 [‐2.89, ‐0.04] |
| 12.2 at 4‐6 months | 0 | 0 | Mean Difference (IV, Random, 95% CI) | 0.0 [0.0, 0.0] |
| 12.3 ≥ 7‐12 months | 0 | 0 | Mean Difference (IV, Random, 95% CI) | 0.0 [0.0, 0.0] |
| 13 Pre‐albumin | 3 | Mean Difference (IV, Fixed, 95% CI) | Subtotals only | |
| 13.1 at 3 months | 3 | 86 | Mean Difference (IV, Fixed, 95% CI) | ‐44.02 [‐71.52, ‐16.53] |
| 13.2 at 4‐6 months | 0 | 0 | Mean Difference (IV, Fixed, 95% CI) | 0.0 [0.0, 0.0] |
| 13.3 ≥ 7‐12 months | 0 | 0 | Mean Difference (IV, Fixed, 95% CI) | 0.0 [0.0, 0.0] |
| 14 SGA | 1 | Mean Difference (IV, Fixed, 95% CI) | Totals not selected | |
| 14.1 at 3 months | 1 | Mean Difference (IV, Fixed, 95% CI) | 0.0 [0.0, 0.0] | |
| 14.2 at 4‐6 months | 0 | Mean Difference (IV, Fixed, 95% CI) | 0.0 [0.0, 0.0] | |
| 14.3 ≥ 7‐12 months | 0 | Mean Difference (IV, Fixed, 95% CI) | 0.0 [0.0, 0.0] | |
| 15 Energy intake | 4 | 97 | Std. Mean Difference (IV, Fixed, 95% CI) | ‐0.41 [‐0.82, ‐0.01] |
| 15.1 at 3 months | 3 | 86 | Std. Mean Difference (IV, Fixed, 95% CI) | ‐0.51 [‐0.94, ‐0.08] |
| 15.2 at 4‐6 months | 1 | 11 | Std. Mean Difference (IV, Fixed, 95% CI) | 0.37 [‐0.87, 1.62] |
| 15.3 ≥ 7‐12 months | 0 | 0 | Std. Mean Difference (IV, Fixed, 95% CI) | 0.0 [0.0, 0.0] |
| 16 Protein intake | 2 | Std. Mean Difference (IV, Fixed, 95% CI) | Subtotals only | |
| 16.1 at 3 months | 2 | 60 | Std. Mean Difference (IV, Fixed, 95% CI) | ‐0.50 [‐1.01, 0.02] |
| 16.2 at 4‐6 months | 0 | 0 | Std. Mean Difference (IV, Fixed, 95% CI) | 0.0 [0.0, 0.0] |
| 16.3 ≥ 7‐12 months | 0 | 0 | Std. Mean Difference (IV, Fixed, 95% CI) | 0.0 [0.0, 0.0] |
| 17 Transferrin | 2 | Mean Difference (IV, Random, 95% CI) | Totals not selected | |
| 17.1 at 3 months | 2 | Mean Difference (IV, Random, 95% CI) | 0.0 [0.0, 0.0] | |
| 17.2 at 4‐6 months | 0 | Mean Difference (IV, Random, 95% CI) | 0.0 [0.0, 0.0] | |
| 17.3 ≥ 7‐12 months | 0 | Mean Difference (IV, Random, 95% CI) | 0.0 [0.0, 0.0] | |
| 18 Fat mass | 3 | 91 | Std. Mean Difference (IV, Fixed, 95% CI) | 0.21 [‐0.22, 0.63] |
| 18.1 at 3 months | 1 | 36 | Std. Mean Difference (IV, Fixed, 95% CI) | ‐0.26 [‐0.92, 0.40] |
| 18.2 at 4‐6 months | 2 | 55 | Std. Mean Difference (IV, Fixed, 95% CI) | 0.55 [‐0.01, 1.11] |
| 18.3 ≥ 7‐12 months | 0 | 0 | Std. Mean Difference (IV, Fixed, 95% CI) | 0.0 [0.0, 0.0] |
| 19 Waist circumference | 1 | Mean Difference (IV, Fixed, 95% CI) | Totals not selected | |
| 19.1 at 3 months | 1 | Mean Difference (IV, Fixed, 95% CI) | 0.0 [0.0, 0.0] | |
| 19.2 at 4‐6 months | 0 | Mean Difference (IV, Fixed, 95% CI) | 0.0 [0.0, 0.0] | |
| 19.3 ≥ 7‐12 months | 0 | Mean Difference (IV, Fixed, 95% CI) | 0.0 [0.0, 0.0] | |
| 20 Mid‐arm circumference | 1 | Mean Difference (IV, Fixed, 95% CI) | Totals not selected | |
| 20.1 at 3 months | 1 | Mean Difference (IV, Fixed, 95% CI) | 0.0 [0.0, 0.0] | |
| 20.2 at 4‐6 months | 0 | Mean Difference (IV, Fixed, 95% CI) | 0.0 [0.0, 0.0] | |
| 20.3 ≥ 7‐12 months | 0 | Mean Difference (IV, Fixed, 95% CI) | 0.0 [0.0, 0.0] | |
| 21 Mid‐calf circumference | 1 | Mean Difference (IV, Fixed, 95% CI) | Totals not selected | |
| 21.1 at 3 months | 1 | Mean Difference (IV, Fixed, 95% CI) | 0.0 [0.0, 0.0] | |
| 21.2 at 4‐6 months | 0 | Mean Difference (IV, Fixed, 95% CI) | 0.0 [0.0, 0.0] | |
| 21.3 ≥ 7‐12 months | 0 | Mean Difference (IV, Fixed, 95% CI) | 0.0 [0.0, 0.0] | |
| 22 Mid‐thigh circumference | 1 | Mean Difference (IV, Fixed, 95% CI) | Totals not selected | |
| 22.1 at 3 months | 1 | Mean Difference (IV, Fixed, 95% CI) | 0.0 [0.0, 0.0] | |
| 22.2 at 4‐6 months | 0 | Mean Difference (IV, Fixed, 95% CI) | 0.0 [0.0, 0.0] | |
| 22.3 ≥ 7‐12 months | 0 | Mean Difference (IV, Fixed, 95% CI) | 0.0 [0.0, 0.0] | |
| 23 Interleukin 6 | 1 | Mean Difference (IV, Fixed, 95% CI) | Totals not selected | |
| 23.1 at 3 months | 1 | Mean Difference (IV, Fixed, 95% CI) | 0.0 [0.0, 0.0] | |
| 23.2 at 4‐6 months | 0 | Mean Difference (IV, Fixed, 95% CI) | 0.0 [0.0, 0.0] | |
| 23.3 ≥ 7‐12 months | 0 | Mean Difference (IV, Fixed, 95% CI) | 0.0 [0.0, 0.0] | |
| 24 Lymphocytes (x 109 L) | 1 | Mean Difference (IV, Fixed, 95% CI) | Totals not selected | |
| 24.1 at 3 months | 1 | Mean Difference (IV, Fixed, 95% CI) | 0.0 [0.0, 0.0] | |
| 24.2 at 4‐6 months | 0 | Mean Difference (IV, Fixed, 95% CI) | 0.0 [0.0, 0.0] | |
| 24.3 ≥ 7‐12 months | 0 | Mean Difference (IV, Fixed, 95% CI) | 0.0 [0.0, 0.0] | |
| 25 Protein catabolic rate | 1 | Mean Difference (IV, Fixed, 95% CI) | Totals not selected | |
| 25.1 at 3 months | 1 | Mean Difference (IV, Fixed, 95% CI) | 0.0 [0.0, 0.0] | |
| 25.2 at 4‐6 months | 0 | Mean Difference (IV, Fixed, 95% CI) | 0.0 [0.0, 0.0] | |
| 25.3 ≥ 7‐12 months | 0 | Mean Difference (IV, Fixed, 95% CI) | 0.0 [0.0, 0.0] | |
| 26 Physical activity | 2 | 63 | Std. Mean Difference (IV, Fixed, 95% CI) | ‐0.35 [‐0.85, 0.15] |
| 26.1 at 3 months | 1 | 33 | Std. Mean Difference (IV, Fixed, 95% CI) | ‐0.33 [‐1.02, 0.36] |
| 26.2 at 4‐6 months | 1 | 30 | Std. Mean Difference (IV, Fixed, 95% CI) | ‐0.36 [‐1.09, 0.36] |
| 26.3 ≥ 7‐12 months | 0 | 0 | Std. Mean Difference (IV, Fixed, 95% CI) | 0.0 [0.0, 0.0] |
| 27 Depression | 3 | Std. Mean Difference (IV, Random, 95% CI) | Totals not selected | |
| 27.1 at 3 months | 1 | Std. Mean Difference (IV, Random, 95% CI) | 0.0 [0.0, 0.0] | |
| 27.2 at 4‐6 months | 1 | Std. Mean Difference (IV, Random, 95% CI) | 0.0 [0.0, 0.0] | |
| 27.3 ≥ 7‐12 months | 1 | Std. Mean Difference (IV, Random, 95% CI) | 0.0 [0.0, 0.0] | |
| 28 Triglycerides | 3 | 89 | Mean Difference (IV, Fixed, 95% CI) | 0.04 [‐0.25, 0.33] |
| 28.1 at 3 months | 1 | 37 | Mean Difference (IV, Fixed, 95% CI) | ‐0.00 [‐0.32, 0.32] |
| 28.2 at 4‐6 months | 0 | 0 | Mean Difference (IV, Fixed, 95% CI) | 0.0 [0.0, 0.0] |
| 28.3 ≥ 7‐12 months | 2 | 52 | Mean Difference (IV, Fixed, 95% CI) | 0.22 [‐0.43, 0.86] |
| 29 Total cholesterol | 2 | Mean Difference (IV, Random, 95% CI) | Subtotals only | |
| 29.1 at 3 months | 2 | 133 | Mean Difference (IV, Random, 95% CI) | 0.29 [‐0.26, 0.83] |
| 29.2 at 4‐6 months | 0 | 0 | Mean Difference (IV, Random, 95% CI) | 0.0 [0.0, 0.0] |
| 29.3 ≥ 7‐12 months | 0 | 0 | Mean Difference (IV, Random, 95% CI) | 0.0 [0.0, 0.0] |
| 30 HDL cholesterol | 3 | 155 | Mean Difference (IV, Fixed, 95% CI) | ‐0.10 [‐0.22, 0.01] |
| 30.1 at 3 months | 1 | 37 | Mean Difference (IV, Fixed, 95% CI) | ‐0.07 [‐0.33, 0.19] |
| 30.2 at 4‐6 months | 0 | 0 | Mean Difference (IV, Fixed, 95% CI) | 0.0 [0.0, 0.0] |
| 30.3 ≥ 7‐12 months | 2 | 118 | Mean Difference (IV, Fixed, 95% CI) | ‐0.11 [‐0.24, 0.02] |
| 31 Type I muscle fibre area | 1 | Mean Difference (IV, Fixed, 95% CI) | Totals not selected | |
| 31.1 at 3 months | 1 | Mean Difference (IV, Fixed, 95% CI) | 0.0 [0.0, 0.0] | |
| 31.2 at 4‐6 months | 0 | Mean Difference (IV, Fixed, 95% CI) | 0.0 [0.0, 0.0] | |
| 31.3 ≥ 7‐12 months | 0 | Mean Difference (IV, Fixed, 95% CI) | 0.0 [0.0, 0.0] | |
| 32 Mid‐thigh muscle area | 3 | Mean Difference (IV, Fixed, 95% CI) | Subtotals only | |
| 32.1 at 3 months | 3 | 111 | Mean Difference (IV, Fixed, 95% CI) | ‐3.22 [‐9.67, 3.24] |
| 32.2 at 4‐6 months | 0 | 0 | Mean Difference (IV, Fixed, 95% CI) | 0.0 [0.0, 0.0] |
| 32.3 ≥ 7‐12 months | 0 | 0 | Mean Difference (IV, Fixed, 95% CI) | 0.0 [0.0, 0.0] |
| 33 Thigh muscle attenuation (Hounsfield units) | 1 | Mean Difference (IV, Fixed, 95% CI) | Totals not selected | |
| 33.1 at 3 months | 1 | Mean Difference (IV, Fixed, 95% CI) | 0.0 [0.0, 0.0] | |
| 33.2 at 4‐6 months | 0 | Mean Difference (IV, Fixed, 95% CI) | 0.0 [0.0, 0.0] | |
| 33.3 ≥ 7‐12 months | 0 | Mean Difference (IV, Fixed, 95% CI) | 0.0 [0.0, 0.0] | |
| 34 HRV index | 1 | Mean Difference (IV, Fixed, 95% CI) | Totals not selected | |
| 34.1 at 3 months | 0 | Mean Difference (IV, Fixed, 95% CI) | 0.0 [0.0, 0.0] | |
| 34.2 at 4‐6 months | 1 | Mean Difference (IV, Fixed, 95% CI) | 0.0 [0.0, 0.0] | |
| 34.3 ≥ 7‐12 months | 0 | Mean Difference (IV, Fixed, 95% CI) | 0.0 [0.0, 0.0] | |
| 35 Mean cardiac R‐R interval | 2 | 119 | Mean Difference (IV, Fixed, 95% CI) | ‐0.06 [‐0.09, ‐0.02] |
| 35.1 at 3 months | 0 | 0 | Mean Difference (IV, Fixed, 95% CI) | 0.0 [0.0, 0.0] |
| 35.2 at 4‐6 months | 1 | 60 | Mean Difference (IV, Fixed, 95% CI) | ‐0.05 [‐0.10, ‐0.00] |
| 35.3 ≥ 7‐12 months | 1 | 59 | Mean Difference (IV, Fixed, 95% CI) | ‐0.07 [‐0.12, ‐0.02] |
| 36 SDNN | 2 | 119 | Mean Difference (IV, Fixed, 95% CI) | ‐0.02 [‐0.03, ‐0.01] |
| 36.1 at 3 months | 0 | 0 | Mean Difference (IV, Fixed, 95% CI) | 0.0 [0.0, 0.0] |
| 36.2 at 4‐6 months | 1 | 60 | Mean Difference (IV, Fixed, 95% CI) | ‐0.02 [‐0.04, ‐0.00] |
| 36.3 ≥ 7‐12 months | 1 | 59 | Mean Difference (IV, Fixed, 95% CI) | ‐0.02 [‐0.03, ‐0.01] |
| 37 Arrhythmias: Lown class > II (no) | 1 | Risk Ratio (M‐H, Fixed, 95% CI) | Totals not selected | |
| 37.1 at 3 months | 0 | Risk Ratio (M‐H, Fixed, 95% CI) | 0.0 [0.0, 0.0] | |
| 37.2 at 4‐6 months | 1 | Risk Ratio (M‐H, Fixed, 95% CI) | 0.0 [0.0, 0.0] | |
| 37.3 ≥ 7‐12 months | 0 | Risk Ratio (M‐H, Fixed, 95% CI) | 0.0 [0.0, 0.0] | |
| 38 Left ventricular internal dimension at end‐diastole | 1 | Mean Difference (IV, Fixed, 95% CI) | Totals not selected | |
| 38.1 at 3 months | 0 | Mean Difference (IV, Fixed, 95% CI) | 0.0 [0.0, 0.0] | |
| 38.2 at 4‐6 months | 1 | Mean Difference (IV, Fixed, 95% CI) | 0.0 [0.0, 0.0] | |
| 38.3 ≥ 7‐12 months | 0 | Mean Difference (IV, Fixed, 95% CI) | 0.0 [0.0, 0.0] | |
| 39 Left ventricular internal dimension at end‐systole | 1 | Mean Difference (IV, Fixed, 95% CI) | Totals not selected | |
| 39.1 at 3 months | 0 | Mean Difference (IV, Fixed, 95% CI) | 0.0 [0.0, 0.0] | |
| 39.2 at 4‐6 months | 1 | Mean Difference (IV, Fixed, 95% CI) | 0.0 [0.0, 0.0] | |
| 39.3 ≥ 7‐12 months | 0 | Mean Difference (IV, Fixed, 95% CI) | 0.0 [0.0, 0.0] | |
| 40 Intraventricular septal thickness at end‐diastole | 1 | Mean Difference (IV, Fixed, 95% CI) | Totals not selected | |
| 40.1 at 3 months | 0 | Mean Difference (IV, Fixed, 95% CI) | 0.0 [0.0, 0.0] | |
| 40.2 at 4‐6 months | 1 | Mean Difference (IV, Fixed, 95% CI) | 0.0 [0.0, 0.0] | |
| 40.3 ≥ 7‐12 months | 0 | Mean Difference (IV, Fixed, 95% CI) | 0.0 [0.0, 0.0] | |
| 41 Left ventricular posterior wall thickness at end‐diastole | 1 | Mean Difference (IV, Fixed, 95% CI) | Totals not selected | |
| 41.1 at 3 months | 0 | Mean Difference (IV, Fixed, 95% CI) | 0.0 [0.0, 0.0] | |
| 41.2 at 4‐6 months | 1 | Mean Difference (IV, Fixed, 95% CI) | 0.0 [0.0, 0.0] | |
| 41.3 ≥ 7‐12 months | 0 | Mean Difference (IV, Fixed, 95% CI) | 0.0 [0.0, 0.0] | |
| 42 Left ventricular mass | 1 | Mean Difference (IV, Fixed, 95% CI) | Totals not selected | |
| 42.1 at 3 months | 0 | Mean Difference (IV, Fixed, 95% CI) | 0.0 [0.0, 0.0] | |
| 42.2 at 4‐6 months | 1 | Mean Difference (IV, Fixed, 95% CI) | 0.0 [0.0, 0.0] | |
| 42.3 ≥ 7‐12 months | 0 | Mean Difference (IV, Fixed, 95% CI) | 0.0 [0.0, 0.0] | |
| 43 Left ventricular mass index | 2 | 87 | Mean Difference (IV, Fixed, 95% CI) | ‐1.62 [‐7.16, 3.93] |
| 43.1 at 3 months | 0 | 0 | Mean Difference (IV, Fixed, 95% CI) | 0.0 [0.0, 0.0] |
| 43.2 at 4‐6 months | 1 | 28 | Mean Difference (IV, Fixed, 95% CI) | ‐11.0 [‐41.75, 19.75] |
| 43.3 ≥ 7‐12 months | 1 | 59 | Mean Difference (IV, Fixed, 95% CI) | ‐1.30 [‐6.94, 4.34] |
| 44 Fasting plasma glucose | 1 | Mean Difference (IV, Fixed, 95% CI) | Totals not selected | |
| 44.1 at 3 months | 0 | Mean Difference (IV, Fixed, 95% CI) | 0.0 [0.0, 0.0] | |
| 44.2 at 4‐6 months | 0 | Mean Difference (IV, Fixed, 95% CI) | 0.0 [0.0, 0.0] | |
| 44.3 ≥ 7‐12 months | 1 | Mean Difference (IV, Fixed, 95% CI) | 0.0 [0.0, 0.0] | |
| 45 Fasting plasma insulin | 1 | Mean Difference (IV, Fixed, 95% CI) | Totals not selected | |
| 45.1 at 3 months | 0 | Mean Difference (IV, Fixed, 95% CI) | 0.0 [0.0, 0.0] | |
| 45.2 at 4‐6 months | 0 | Mean Difference (IV, Fixed, 95% CI) | 0.0 [0.0, 0.0] | |
| 45.3 ≥ 7‐12 months | 1 | Mean Difference (IV, Fixed, 95% CI) | 0.0 [0.0, 0.0] | |
| 46 Glucose disappearance | 1 | Mean Difference (IV, Fixed, 95% CI) | Totals not selected | |
| 46.1 at 3 months | 0 | Mean Difference (IV, Fixed, 95% CI) | 0.0 [0.0, 0.0] | |
| 46.2 at 4‐6 months | 0 | Mean Difference (IV, Fixed, 95% CI) | 0.0 [0.0, 0.0] | |
| 46.3 ≥ 7‐12 months | 1 | Mean Difference (IV, Fixed, 95% CI) | 0.0 [0.0, 0.0] |
7.4. Analysis.
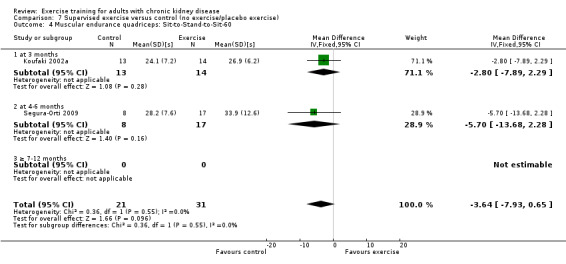
Comparison 7 Supervised exercise versus control (no exercise/placebo exercise), Outcome 4 Muscular endurance quadriceps: Sit‐to‐Stand‐to‐Sit‐60.
7.6. Analysis.
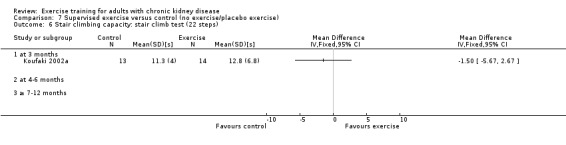
Comparison 7 Supervised exercise versus control (no exercise/placebo exercise), Outcome 6 Stair climbing capacity: stair climb test (22 steps).
7.7. Analysis.
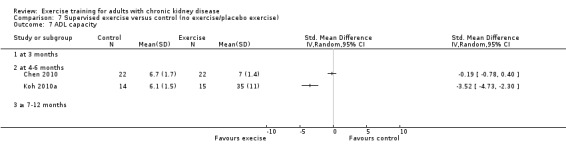
Comparison 7 Supervised exercise versus control (no exercise/placebo exercise), Outcome 7 ADL capacity.
7.13. Analysis.
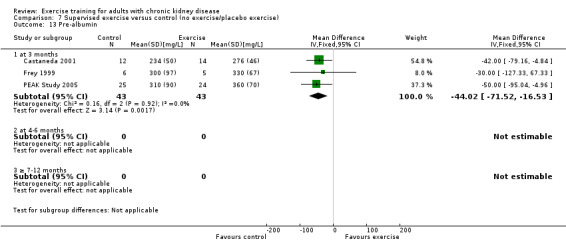
Comparison 7 Supervised exercise versus control (no exercise/placebo exercise), Outcome 13 Pre‐albumin.
7.14. Analysis.
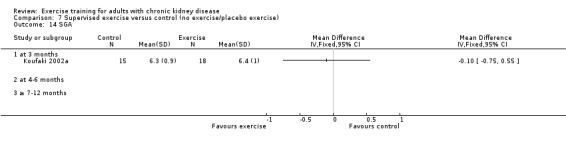
Comparison 7 Supervised exercise versus control (no exercise/placebo exercise), Outcome 14 SGA.
7.15. Analysis.
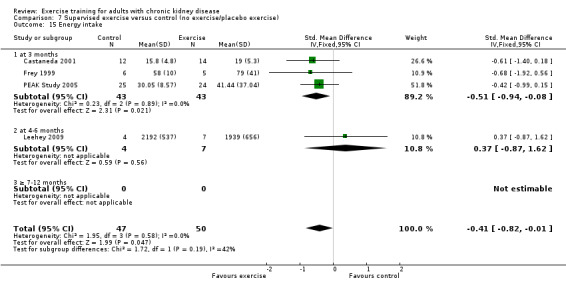
Comparison 7 Supervised exercise versus control (no exercise/placebo exercise), Outcome 15 Energy intake.
7.16. Analysis.
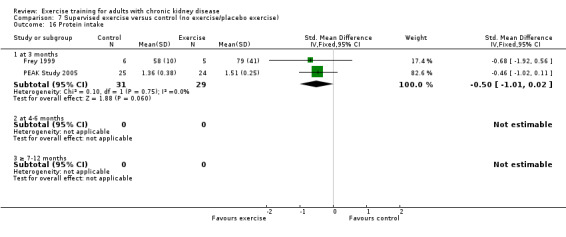
Comparison 7 Supervised exercise versus control (no exercise/placebo exercise), Outcome 16 Protein intake.
7.17. Analysis.
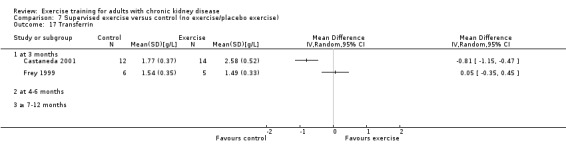
Comparison 7 Supervised exercise versus control (no exercise/placebo exercise), Outcome 17 Transferrin.
7.18. Analysis.
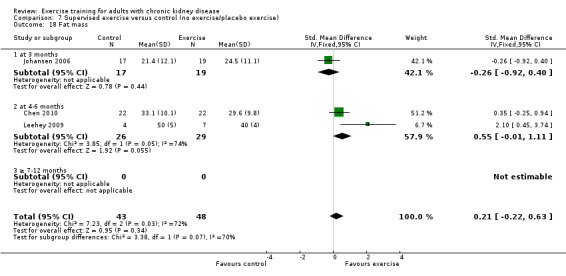
Comparison 7 Supervised exercise versus control (no exercise/placebo exercise), Outcome 18 Fat mass.
7.19. Analysis.
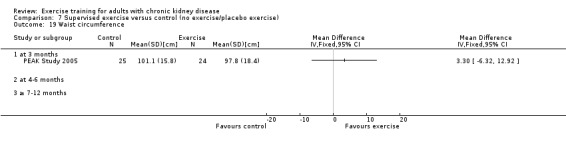
Comparison 7 Supervised exercise versus control (no exercise/placebo exercise), Outcome 19 Waist circumference.
7.20. Analysis.

Comparison 7 Supervised exercise versus control (no exercise/placebo exercise), Outcome 20 Mid‐arm circumference.
7.21. Analysis.
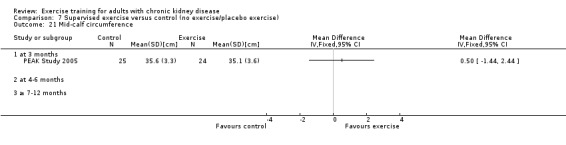
Comparison 7 Supervised exercise versus control (no exercise/placebo exercise), Outcome 21 Mid‐calf circumference.
7.22. Analysis.
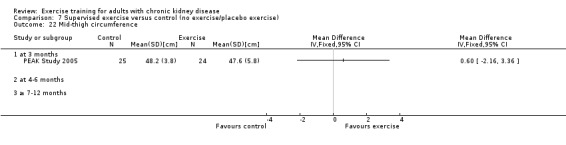
Comparison 7 Supervised exercise versus control (no exercise/placebo exercise), Outcome 22 Mid‐thigh circumference.
7.23. Analysis.
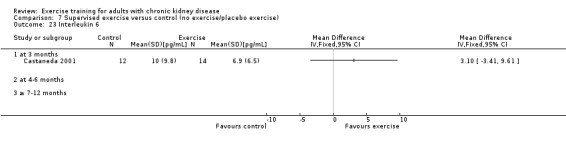
Comparison 7 Supervised exercise versus control (no exercise/placebo exercise), Outcome 23 Interleukin 6.
7.24. Analysis.

Comparison 7 Supervised exercise versus control (no exercise/placebo exercise), Outcome 24 Lymphocytes (x 109 L).
7.25. Analysis.
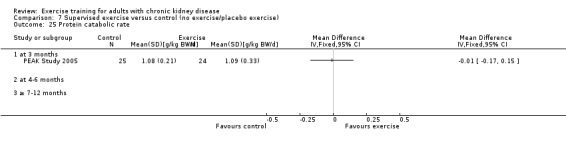
Comparison 7 Supervised exercise versus control (no exercise/placebo exercise), Outcome 25 Protein catabolic rate.
7.26. Analysis.
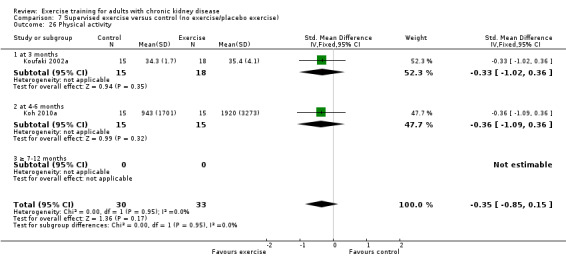
Comparison 7 Supervised exercise versus control (no exercise/placebo exercise), Outcome 26 Physical activity.
7.27. Analysis.
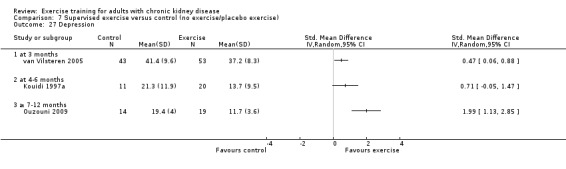
Comparison 7 Supervised exercise versus control (no exercise/placebo exercise), Outcome 27 Depression.
7.29. Analysis.
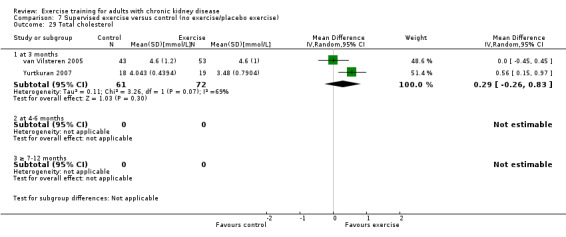
Comparison 7 Supervised exercise versus control (no exercise/placebo exercise), Outcome 29 Total cholesterol.
7.30. Analysis.
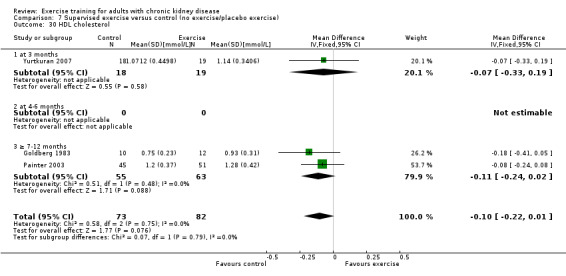
Comparison 7 Supervised exercise versus control (no exercise/placebo exercise), Outcome 30 HDL cholesterol.
7.31. Analysis.

Comparison 7 Supervised exercise versus control (no exercise/placebo exercise), Outcome 31 Type I muscle fibre area.
7.32. Analysis.
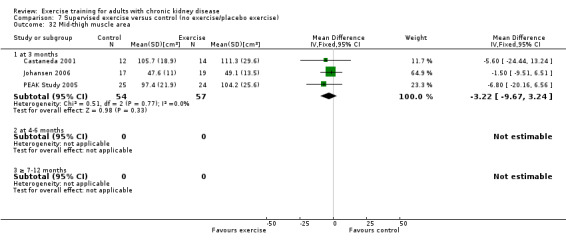
Comparison 7 Supervised exercise versus control (no exercise/placebo exercise), Outcome 32 Mid‐thigh muscle area.
7.33. Analysis.

Comparison 7 Supervised exercise versus control (no exercise/placebo exercise), Outcome 33 Thigh muscle attenuation (Hounsfield units).
7.34. Analysis.

Comparison 7 Supervised exercise versus control (no exercise/placebo exercise), Outcome 34 HRV index.
7.35. Analysis.

Comparison 7 Supervised exercise versus control (no exercise/placebo exercise), Outcome 35 Mean cardiac R‐R interval.
7.36. Analysis.

Comparison 7 Supervised exercise versus control (no exercise/placebo exercise), Outcome 36 SDNN.
7.37. Analysis.
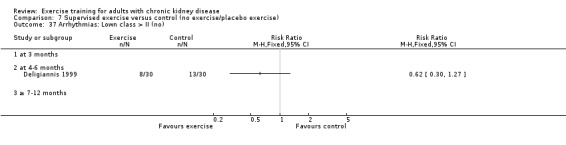
Comparison 7 Supervised exercise versus control (no exercise/placebo exercise), Outcome 37 Arrhythmias: Lown class > II (no).
7.38. Analysis.
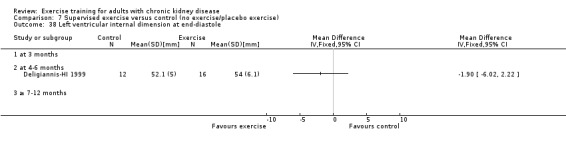
Comparison 7 Supervised exercise versus control (no exercise/placebo exercise), Outcome 38 Left ventricular internal dimension at end‐diastole.
7.39. Analysis.
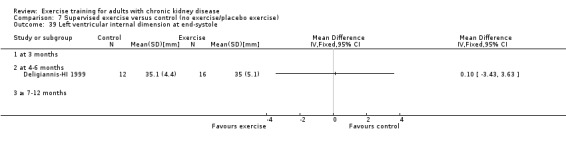
Comparison 7 Supervised exercise versus control (no exercise/placebo exercise), Outcome 39 Left ventricular internal dimension at end‐systole.
7.40. Analysis.
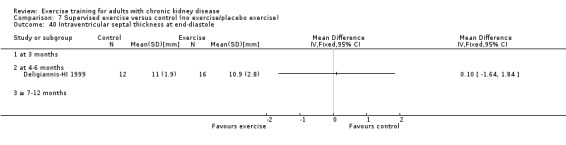
Comparison 7 Supervised exercise versus control (no exercise/placebo exercise), Outcome 40 Intraventricular septal thickness at end‐diastole.
7.41. Analysis.
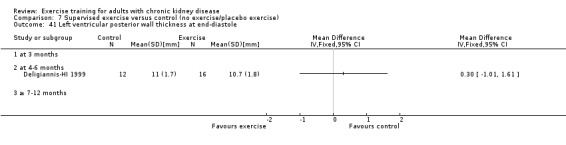
Comparison 7 Supervised exercise versus control (no exercise/placebo exercise), Outcome 41 Left ventricular posterior wall thickness at end‐diastole.
7.42. Analysis.

Comparison 7 Supervised exercise versus control (no exercise/placebo exercise), Outcome 42 Left ventricular mass.
7.43. Analysis.
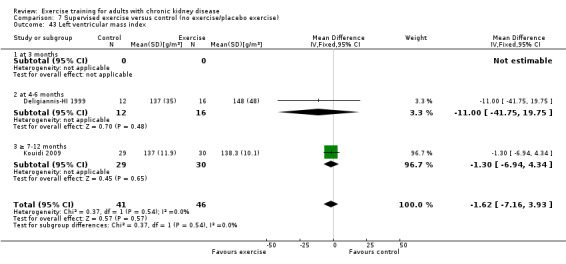
Comparison 7 Supervised exercise versus control (no exercise/placebo exercise), Outcome 43 Left ventricular mass index.
7.44. Analysis.
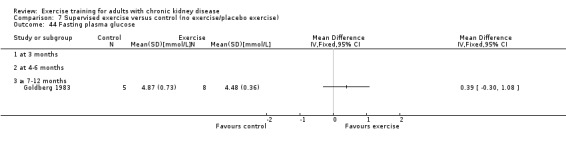
Comparison 7 Supervised exercise versus control (no exercise/placebo exercise), Outcome 44 Fasting plasma glucose.
7.45. Analysis.

Comparison 7 Supervised exercise versus control (no exercise/placebo exercise), Outcome 45 Fasting plasma insulin.
7.46. Analysis.

Comparison 7 Supervised exercise versus control (no exercise/placebo exercise), Outcome 46 Glucose disappearance.
Comparison 8. Unsupervised exercise versus control (no exercise/placebo exercise).
| Outcome or subgroup title | No. of studies | No. of participants | Statistical method | Effect size |
|---|---|---|---|---|
| 1 Aerobic capacity | 8 | 333 | Std. Mean Difference (IV, Fixed, 95% CI) | ‐0.48 [‐0.70, ‐0.26] |
| 1.1 at 3 months | 2 | 57 | Std. Mean Difference (IV, Fixed, 95% CI) | ‐0.68 [‐1.22, ‐0.14] |
| 1.2 at 4‐6 months | 3 | 55 | Std. Mean Difference (IV, Fixed, 95% CI) | ‐0.76 [‐1.32, ‐0.19] |
| 1.3 ≥ 7‐12 months | 3 | 221 | Std. Mean Difference (IV, Fixed, 95% CI) | ‐0.36 [‐0.63, ‐0.10] |
| 2 Muscular strength | 2 | 123 | Std. Mean Difference (IV, Fixed, 95% CI) | ‐0.39 [‐0.75, ‐0.03] |
| 2.1 at 3 months | 0 | 0 | Std. Mean Difference (IV, Fixed, 95% CI) | 0.0 [0.0, 0.0] |
| 2.2 at 4‐6 months | 1 | 28 | Std. Mean Difference (IV, Fixed, 95% CI) | ‐0.45 [‐1.20, 0.30] |
| 2.3 ≥ 7‐12 months | 1 | 95 | Std. Mean Difference (IV, Fixed, 95% CI) | ‐0.37 [‐0.78, 0.04] |
| 3 Walking capacity | 2 | 47 | Std. Mean Difference (IV, Fixed, 95% CI) | ‐0.37 [‐0.94, 0.21] |
| 3.1 at 3 months | 1 | 17 | Std. Mean Difference (IV, Fixed, 95% CI) | ‐0.52 [‐1.50, 0.45] |
| 3.2 at 4‐6 months | 1 | 30 | Std. Mean Difference (IV, Fixed, 95% CI) | ‐0.28 [1.00, 0.44] |
| 3.3 ≥ 7‐12 months | 0 | 0 | Std. Mean Difference (IV, Fixed, 95% CI) | 0.0 [0.0, 0.0] |
| 4 ADL capacity | 1 | Mean Difference (IV, Fixed, 95% CI) | Totals not selected | |
| 4.1 at 3 months | 0 | Mean Difference (IV, Fixed, 95% CI) | 0.0 [0.0, 0.0] | |
| 4.2 at 4‐6 months | 1 | Mean Difference (IV, Fixed, 95% CI) | 0.0 [0.0, 0.0] | |
| 4.3 ≥ 7‐12 months | 0 | Mean Difference (IV, Fixed, 95% CI) | 0.0 [0.0, 0.0] | |
| 5 Diastolic blood pressure: resting | 4 | 148 | Mean Difference (IV, Fixed, 95% CI) | 0.27 [‐2.72, 3.26] |
| 5.1 at 3 months | 1 | 19 | Mean Difference (IV, Fixed, 95% CI) | ‐4.40 [‐11.31, 2.51] |
| 5.2 at 4‐6 months | 2 | 33 | Mean Difference (IV, Fixed, 95% CI) | 1.48 [‐3.23, 6.20] |
| 5.3 ≥ 7‐12 months | 1 | 96 | Mean Difference (IV, Fixed, 95% CI) | 1.20 [‐3.45, 5.85] |
| 6 Systolic blood pressure: resting | 4 | 148 | Mean Difference (IV, Fixed, 95% CI) | 5.93 [0.32, 11.54] |
| 6.1 at 3 months | 1 | 19 | Mean Difference (IV, Fixed, 95% CI) | 6.40 [‐10.11, 22.91] |
| 6.2 at 4‐6 months | 2 | 33 | Mean Difference (IV, Fixed, 95% CI) | 11.23 [2.49, 19.98] |
| 6.3 ≥ 7‐12 months | 1 | 96 | Mean Difference (IV, Fixed, 95% CI) | 1.20 [‐6.96, 9.36] |
| 7 Heart rate: maximum | 3 | Mean Difference (IV, Fixed, 95% CI) | Subtotals only | |
| 7.1 at 3 months | 0 | 0 | Mean Difference (IV, Fixed, 95% CI) | 0.0 [0.0, 0.0] |
| 7.2 at 4‐6 months | 3 | 55 | Mean Difference (IV, Fixed, 95% CI) | ‐4.16 [‐10.27, 1.95] |
| 7.3 ≥ 7‐12 months | 0 | 0 | Mean Difference (IV, Fixed, 95% CI) | 0.0 [0.0, 0.0] |
| 8 Heart rate: resting | 2 | Mean Difference (IV, Fixed, 95% CI) | Subtotals only | |
| 8.1 at 3 months | 0 | 0 | Mean Difference (IV, Fixed, 95% CI) | 0.0 [0.0, 0.0] |
| 8.2 at 4‐6 months | 2 | 33 | Mean Difference (IV, Fixed, 95% CI) | 1.96 [‐5.72, 9.63] |
| 8.3 ≥ 7‐12 months | 0 | 0 | Mean Difference (IV, Fixed, 95% CI) | 0.0 [0.0, 0.0] |
| 9 Albumin | 1 | Mean Difference (IV, Fixed, 95% CI) | Totals not selected | |
| 9.1 at 3 months | 1 | Mean Difference (IV, Fixed, 95% CI) | 0.0 [0.0, 0.0] | |
| 9.2 at 4‐6 months | 0 | Mean Difference (IV, Fixed, 95% CI) | 0.0 [0.0, 0.0] | |
| 9.3 ≥ 7‐12 months | 0 | Mean Difference (IV, Fixed, 95% CI) | 0.0 [0.0, 0.0] | |
| 10 Energy intake | 1 | Std. Mean Difference (IV, Fixed, 95% CI) | Totals not selected | |
| 10.1 at 3 months | 0 | Std. Mean Difference (IV, Fixed, 95% CI) | 0.0 [0.0, 0.0] | |
| 10.2 at 4‐6 months | 1 | Std. Mean Difference (IV, Fixed, 95% CI) | 0.0 [0.0, 0.0] | |
| 10.3 ≥ 7‐12 months | 0 | Std. Mean Difference (IV, Fixed, 95% CI) | 0.0 [0.0, 0.0] | |
| 11 Fat mass | 2 | 106 | Std. Mean Difference (IV, Fixed, 95% CI) | 0.28 [‐0.12, 0.67] |
| 11.1 at 3 months | 0 | 0 | Std. Mean Difference (IV, Fixed, 95% CI) | 0.0 [0.0, 0.0] |
| 11.2 at 4‐6 months | 1 | 11 | Std. Mean Difference (IV, Fixed, 95% CI) | 2.10 [0.45, 3.74] |
| 11.3 ≥ 7‐12 months | 1 | 95 | Std. Mean Difference (IV, Fixed, 95% CI) | 0.17 [‐0.24, 0.57] |
| 12 Physical activity | 1 | Std. Mean Difference (IV, Fixed, 95% CI) | Totals not selected | |
| 12.1 at 3 months | 0 | Std. Mean Difference (IV, Fixed, 95% CI) | 0.0 [0.0, 0.0] | |
| 12.2 at 4‐6 months | 1 | Std. Mean Difference (IV, Fixed, 95% CI) | 0.0 [0.0, 0.0] | |
| 12.3 ≥ 7‐12 months | 0 | Std. Mean Difference (IV, Fixed, 95% CI) | 0.0 [0.0, 0.0] | |
| 13 Depression | 1 | Std. Mean Difference (IV, Fixed, 95% CI) | Totals not selected | |
| 13.1 at 3 months | 1 | Std. Mean Difference (IV, Fixed, 95% CI) | 0.0 [0.0, 0.0] | |
| 13.2 at 4‐6 months | 0 | Std. Mean Difference (IV, Fixed, 95% CI) | 0.0 [0.0, 0.0] | |
| 13.3 ≥ 7‐12 months | 0 | Std. Mean Difference (IV, Fixed, 95% CI) | 0.0 [0.0, 0.0] | |
| 14 Triglycerides | 2 | 41 | Mean Difference (IV, Random, 95% CI) | 0.21 [‐0.44, 0.87] |
| 14.1 at 3 months | 0 | 0 | Mean Difference (IV, Random, 95% CI) | 0.0 [0.0, 0.0] |
| 14.2 at 4‐6 months | 1 | 11 | Mean Difference (IV, Random, 95% CI) | 0.51 [‐0.83, 1.84] |
| 14.3 ≥ 7‐12 months | 1 | 30 | Mean Difference (IV, Random, 95% CI) | 0.12 [‐0.63, 0.87] |
| 15 Total cholesterol | 3 | 137 | Mean Difference (IV, Random, 95% CI) | 0.00 [‐0.42, 0.43] |
| 15.1 at 3 months | 0 | 0 | Mean Difference (IV, Random, 95% CI) | 0.0 [0.0, 0.0] |
| 15.2 at 4‐6 months | 1 | 11 | Mean Difference (IV, Random, 95% CI) | 0.47 [‐0.46, 1.39] |
| 15.3 ≥ 7‐12 months | 2 | 126 | Mean Difference (IV, Random, 95% CI) | ‐0.12 [‐0.61, 0.36] |
| 16 HDL cholesterol | 2 | 107 | Mean Difference (IV, Random, 95% CI) | ‐0.08 [‐0.24, 0.07] |
| 16.1 at 3 months | 0 | 0 | Mean Difference (IV, Random, 95% CI) | 0.0 [0.0, 0.0] |
| 16.2 at 4‐6 months | 1 | 11 | Mean Difference (IV, Random, 95% CI) | ‐0.21 [‐1.34, 0.92] |
| 16.3 ≥ 7‐12 months | 1 | 96 | Mean Difference (IV, Random, 95% CI) | ‐0.08 [‐0.24, 0.08] |
| 17 LDL cholesterol | 1 | Mean Difference (IV, Fixed, 95% CI) | Totals not selected | |
| 17.1 at 3 months | 0 | Mean Difference (IV, Fixed, 95% CI) | 0.0 [0.0, 0.0] | |
| 17.2 at 4‐6 months | 1 | Mean Difference (IV, Fixed, 95% CI) | 0.0 [0.0, 0.0] | |
| 17.3 at >7‐12 months | 0 | Mean Difference (IV, Fixed, 95% CI) | 0.0 [0.0, 0.0] | |
| 18 Left ventricular internal dimension at end‐diastole | 1 | Mean Difference (IV, Fixed, 95% CI) | Totals not selected | |
| 18.1 at 3 months | 0 | Mean Difference (IV, Fixed, 95% CI) | 0.0 [0.0, 0.0] | |
| 18.2 at 4‐6 months | 1 | Mean Difference (IV, Fixed, 95% CI) | 0.0 [0.0, 0.0] | |
| 18.3 ≥ 7‐12 months | 0 | Mean Difference (IV, Fixed, 95% CI) | 0.0 [0.0, 0.0] | |
| 19 Left ventricular internal dimension at end‐systole | 1 | Mean Difference (IV, Fixed, 95% CI) | Totals not selected | |
| 19.1 at 3 months | 0 | Mean Difference (IV, Fixed, 95% CI) | 0.0 [0.0, 0.0] | |
| 19.2 at 4‐6 months | 1 | Mean Difference (IV, Fixed, 95% CI) | 0.0 [0.0, 0.0] | |
| 19.3 ≥ 7‐12 months | 0 | Mean Difference (IV, Fixed, 95% CI) | 0.0 [0.0, 0.0] | |
| 20 Intraventricular septal thickness at end‐diastole | 1 | Mean Difference (IV, Fixed, 95% CI) | Totals not selected | |
| 20.1 at 3 months | 0 | Mean Difference (IV, Fixed, 95% CI) | 0.0 [0.0, 0.0] | |
| 20.2 at 4‐6 months | 1 | Mean Difference (IV, Fixed, 95% CI) | 0.0 [0.0, 0.0] | |
| 20.3 ≥ 7‐12 months | 0 | Mean Difference (IV, Fixed, 95% CI) | 0.0 [0.0, 0.0] | |
| 21 Left ventricular posterior wall thickness at end‐diastole | 1 | Mean Difference (IV, Random, 95% CI) | Totals not selected | |
| 21.1 at 3 months | 0 | Mean Difference (IV, Random, 95% CI) | 0.0 [0.0, 0.0] | |
| 21.2 at 4‐6 months | 1 | Mean Difference (IV, Random, 95% CI) | 0.0 [0.0, 0.0] | |
| 21.3 ≥ 7‐12 months | 0 | Mean Difference (IV, Random, 95% CI) | 0.0 [0.0, 0.0] | |
| 22 Left ventricular mass | 1 | Mean Difference (IV, Fixed, 95% CI) | Totals not selected | |
| 22.1 at 3 months | 0 | Mean Difference (IV, Fixed, 95% CI) | 0.0 [0.0, 0.0] | |
| 22.2 at 4‐6 months | 1 | Mean Difference (IV, Fixed, 95% CI) | 0.0 [0.0, 0.0] | |
| 22.3 ≥ 7‐12 months | 0 | Mean Difference (IV, Fixed, 95% CI) | 0.0 [0.0, 0.0] | |
| 23 Left ventricular mass index | 1 | Mean Difference (IV, Fixed, 95% CI) | Totals not selected | |
| 23.1 at 3 months | 0 | Mean Difference (IV, Fixed, 95% CI) | 0.0 [0.0, 0.0] | |
| 23.2 at 4‐6 months | 1 | Mean Difference (IV, Fixed, 95% CI) | 0.0 [0.0, 0.0] | |
| 23.3 ≥ 7‐12 months | 0 | Mean Difference (IV, Fixed, 95% CI) | 0.0 [0.0, 0.0] |
8.4. Analysis.
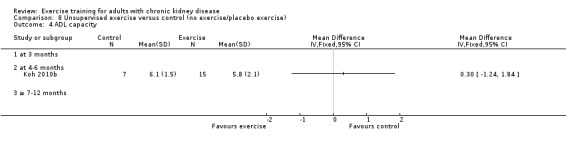
Comparison 8 Unsupervised exercise versus control (no exercise/placebo exercise), Outcome 4 ADL capacity.
8.10. Analysis.
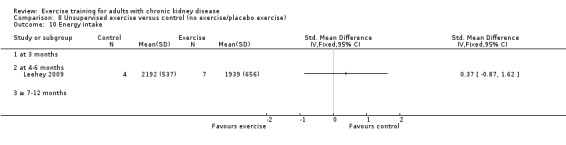
Comparison 8 Unsupervised exercise versus control (no exercise/placebo exercise), Outcome 10 Energy intake.
8.11. Analysis.
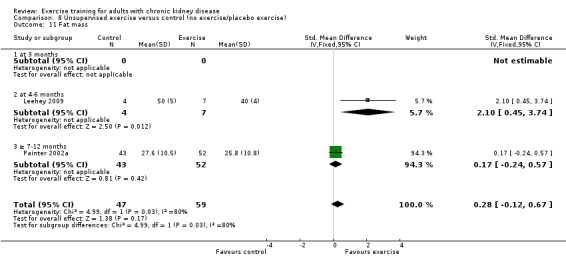
Comparison 8 Unsupervised exercise versus control (no exercise/placebo exercise), Outcome 11 Fat mass.
8.12. Analysis.
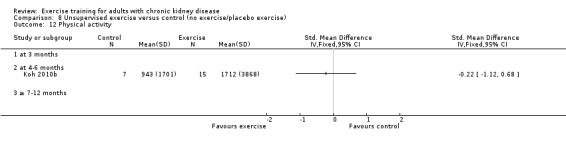
Comparison 8 Unsupervised exercise versus control (no exercise/placebo exercise), Outcome 12 Physical activity.
8.13. Analysis.
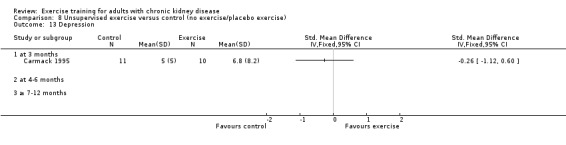
Comparison 8 Unsupervised exercise versus control (no exercise/placebo exercise), Outcome 13 Depression.
8.15. Analysis.
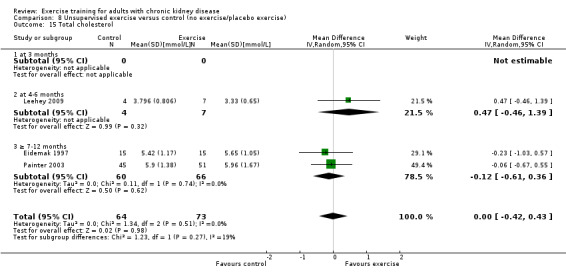
Comparison 8 Unsupervised exercise versus control (no exercise/placebo exercise), Outcome 15 Total cholesterol.
8.16. Analysis.
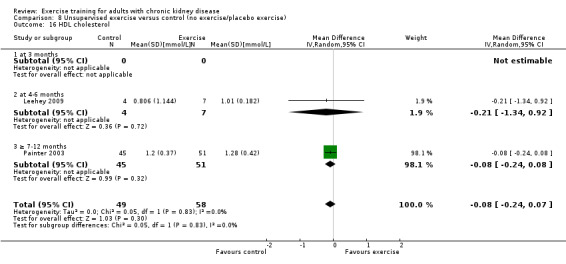
Comparison 8 Unsupervised exercise versus control (no exercise/placebo exercise), Outcome 16 HDL cholesterol.
8.17. Analysis.
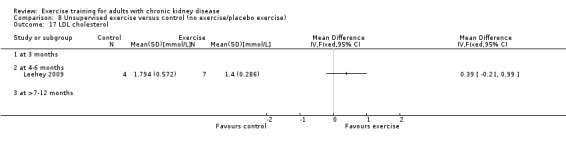
Comparison 8 Unsupervised exercise versus control (no exercise/placebo exercise), Outcome 17 LDL cholesterol.
8.18. Analysis.
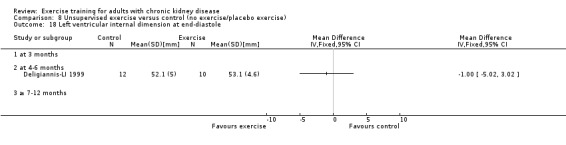
Comparison 8 Unsupervised exercise versus control (no exercise/placebo exercise), Outcome 18 Left ventricular internal dimension at end‐diastole.
8.19. Analysis.
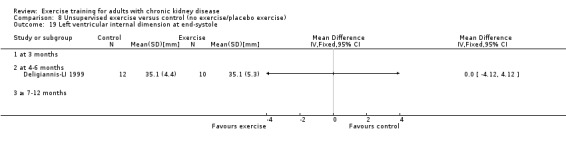
Comparison 8 Unsupervised exercise versus control (no exercise/placebo exercise), Outcome 19 Left ventricular internal dimension at end‐systole.
8.20. Analysis.
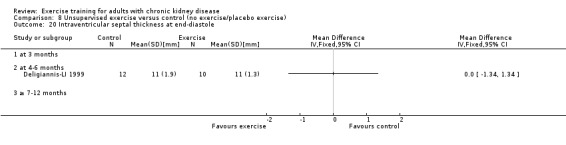
Comparison 8 Unsupervised exercise versus control (no exercise/placebo exercise), Outcome 20 Intraventricular septal thickness at end‐diastole.
8.21. Analysis.

Comparison 8 Unsupervised exercise versus control (no exercise/placebo exercise), Outcome 21 Left ventricular posterior wall thickness at end‐diastole.
8.22. Analysis.
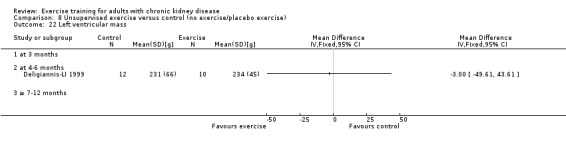
Comparison 8 Unsupervised exercise versus control (no exercise/placebo exercise), Outcome 22 Left ventricular mass.
8.23. Analysis.

Comparison 8 Unsupervised exercise versus control (no exercise/placebo exercise), Outcome 23 Left ventricular mass index.
Comparison 9. Yoga exercise versus control (no exercise/placebo exercise).
| Outcome or subgroup title | No. of studies | No. of participants | Statistical method | Effect size |
|---|---|---|---|---|
| 1 Muscular strength (high value = improved) | 1 | Std. Mean Difference (IV, Fixed, 95% CI) | Totals not selected | |
| 1.1 at 3 months | 1 | Std. Mean Difference (IV, Fixed, 95% CI) | 0.0 [0.0, 0.0] | |
| 1.2 at 4‐6 months | 0 | Std. Mean Difference (IV, Fixed, 95% CI) | 0.0 [0.0, 0.0] | |
| 1.3 ≥ 7‐12 months | 0 | Std. Mean Difference (IV, Fixed, 95% CI) | 0.0 [0.0, 0.0] | |
| 2 Grip strength | 1 | Mean Difference (IV, Fixed, 95% CI) | Totals not selected | |
| 2.1 at 3 months | 1 | Mean Difference (IV, Fixed, 95% CI) | 0.0 [0.0, 0.0] | |
| 2.2 at 4‐6 months | 0 | Mean Difference (IV, Fixed, 95% CI) | 0.0 [0.0, 0.0] | |
| 2.3 at >7‐12 months | 0 | Mean Difference (IV, Fixed, 95% CI) | 0.0 [0.0, 0.0] | |
| 3 Triglycerides | 1 | Mean Difference (IV, Fixed, 95% CI) | Totals not selected | |
| 3.1 at 3 months | 1 | Mean Difference (IV, Fixed, 95% CI) | 0.0 [0.0, 0.0] | |
| 3.2 at 4‐6 months | 0 | Mean Difference (IV, Fixed, 95% CI) | 0.0 [0.0, 0.0] | |
| 3.3 at >7‐12 months | 0 | Mean Difference (IV, Fixed, 95% CI) | 0.0 [0.0, 0.0] | |
| 4 Total cholesterol | 1 | Mean Difference (IV, Fixed, 95% CI) | Totals not selected | |
| 4.1 at 3 months | 1 | Mean Difference (IV, Fixed, 95% CI) | 0.0 [0.0, 0.0] | |
| 4.2 at 4‐6 months | 0 | Mean Difference (IV, Fixed, 95% CI) | 0.0 [0.0, 0.0] | |
| 4.3 at >7‐12 months | 0 | Mean Difference (IV, Fixed, 95% CI) | 0.0 [0.0, 0.0] | |
| 5 HDL cholesterol | 1 | Mean Difference (IV, Fixed, 95% CI) | Totals not selected | |
| 5.1 at 3 months | 1 | Mean Difference (IV, Fixed, 95% CI) | 0.0 [0.0, 0.0] | |
| 5.2 at 4‐6 months | 0 | Mean Difference (IV, Fixed, 95% CI) | 0.0 [0.0, 0.0] | |
| 5.3 at >7‐12 months | 0 | Mean Difference (IV, Fixed, 95% CI) | 0.0 [0.0, 0.0] |
9.2. Analysis.
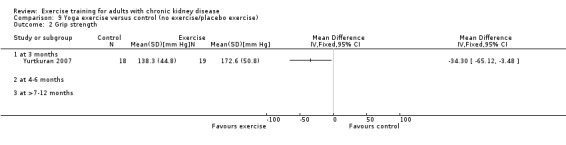
Comparison 9 Yoga exercise versus control (no exercise/placebo exercise), Outcome 2 Grip strength.
9.5. Analysis.
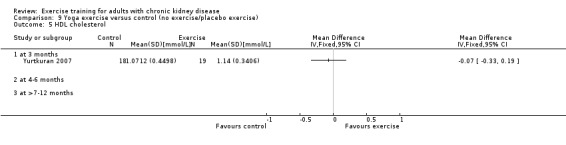
Comparison 9 Yoga exercise versus control (no exercise/placebo exercise), Outcome 5 HDL cholesterol.
Characteristics of studies
Characteristics of included studies [ordered by study ID]
Akiba 1995.
| Methods |
|
|
| Participants | Inclusion criteria
Exclusion criteria: NS |
|
| Interventions | After improvement of anaemia by rHuEPO, patients were randomised into 2 groups. Treatment group
Control group
Follow‐up assessment
|
|
| Outcomes |
|
|
| Notes |
|
|
| Risk of bias | ||
| Bias | Authors' judgement | Support for judgement |
| Random sequence generation (selection bias) | Unclear risk | NS |
| Allocation concealment (selection bias) | Unclear risk | NS (B) |
| Blinding (performance bias and detection bias) Participants | High risk | Not blinded |
| Blinding (performance bias and detection bias) Outcome assessors | Unclear risk | NS |
| Risk of selection bias? | High risk | High risk of selection bias (C) |
| Risk of detection bias? | High risk | High risk of detection bias (C) |
| Risk of attrition bias? | Unclear risk | Moderate risk of attrition bias (B) |
| Total risk of bias: A (low), B (moderate/unclear), or C (high) | High risk | High, one or more quality criteria not met (C). |
Carmack 1995.
| Methods |
|
|
| Participants | Inclusion criteria
Exclusion criteria
|
|
| Interventions | Treatment group
Control group
Follow‐up assessment
|
|
| Outcomes |
|
|
| Notes |
|
|
| Risk of bias | ||
| Bias | Authors' judgement | Support for judgement |
| Random sequence generation (selection bias) | Unclear risk | NS |
| Allocation concealment (selection bias) | Unclear risk | NS (B) |
| Blinding (performance bias and detection bias) Participants | High risk | Not blinded |
| Blinding (performance bias and detection bias) Outcome assessors | Unclear risk | NS |
| Risk of selection bias? | Unclear risk | Moderate risk of selection bias (B) |
| Risk of detection bias? | High risk | High risk of detection bias (C) |
| Risk of attrition bias? | Low risk | Low risk of attrition bias (A) |
| Total risk of bias: A (low), B (moderate/unclear), or C (high) | Unclear risk | Moderate, one or more of the quality criteria only partially met (B). |
Carney 1987.
| Methods |
|
|
| Participants | Inclusion criteria
Exclusion criteria
|
|
| Interventions | Treatment group
Control group
Follow‐up assessment
|
|
| Outcomes | Relevant to our study
Not relevant to our study: none |
|
| Notes |
|
|
| Risk of bias | ||
| Bias | Authors' judgement | Support for judgement |
| Random sequence generation (selection bias) | Unclear risk | NS |
| Allocation concealment (selection bias) | Unclear risk | NS (B) |
| Blinding (performance bias and detection bias) Participants | High risk | Not blinded |
| Blinding (performance bias and detection bias) Outcome assessors | Unclear risk | NS |
| Risk of selection bias? | Unclear risk | Moderate risk of selection bias (B) |
| Risk of detection bias? | High risk | High risk of detection bias (C) |
| Risk of attrition bias? | Unclear risk | Moderate risk of attrition bias (B) |
| Total risk of bias: A (low), B (moderate/unclear), or C (high) | Unclear risk | Moderate, one or more of the quality criteria only partially met (B). |
Castaneda 2001.
| Methods |
|
|
| Participants | Inclusion criteria
Exclusion criteria
|
|
| Interventions | Treatment group
Control group
Follow‐up assessment
|
|
| Outcomes | Relevant to our study
Not relevant to our study
|
|
| Notes |
|
|
| Risk of bias | ||
| Bias | Authors' judgement | Support for judgement |
| Random sequence generation (selection bias) | Unclear risk | NS |
| Allocation concealment (selection bias) | Unclear risk | NS (B) |
| Blinding (performance bias and detection bias) Participants | Low risk | Blinded |
| Blinding (performance bias and detection bias) Outcome assessors | Low risk | The study dietician and exercise trainer were not blinded to group assignment. However, baseline muscle strength was assessed before randomisation. Observers blinded to group assignment performed all other study measurements. |
| Risk of selection bias? | Unclear risk | Moderate risk of selection bias (B) |
| Risk of detection bias? | Low risk | Low risk of detection bias (A) |
| Risk of attrition bias? | Low risk | Low risk of selection bias (A) |
| Total risk of bias: A (low), B (moderate/unclear), or C (high) | Low risk | Low risk of bias: all quality criteria met (A) |
Chatoth 2005.
| Methods |
|
|
| Participants | Inclusion criteria
Exclusion criteria: NS |
|
| Interventions | Treatment group 1
Treatment group 2
Treatment group 3
Control group
Follow‐up assessment
|
|
| Outcomes | Relevant to our study
Not relevant to our study
|
|
| Notes |
|
|
| Risk of bias | ||
| Bias | Authors' judgement | Support for judgement |
| Random sequence generation (selection bias) | Unclear risk | NS |
| Allocation concealment (selection bias) | Unclear risk | NS (B) |
| Blinding (performance bias and detection bias) Participants | High risk | Not blinded |
| Blinding (performance bias and detection bias) Outcome assessors | Unclear risk | NS |
| Risk of selection bias? | High risk | High risk of selection bias (C) |
| Risk of detection bias? | High risk | High risk of detection bias (C) |
| Risk of attrition bias? | High risk | High risk of attrition bias (C) |
| Total risk of bias: A (low), B (moderate/unclear), or C (high) | High risk | High: one or more quality criteria not met (C). |
Chen 2010.
| Methods |
|
|
| Participants | Inclusion criteria
Exclusion criteria
|
|
| Interventions | Treatment group
Control group
Follow‐up assessment
|
|
| Outcomes | Relevant to our study
Not relevant to our study: None |
|
| Notes |
|
|
| Risk of bias | ||
| Bias | Authors' judgement | Support for judgement |
| Random sequence generation (selection bias) | Unclear risk | NS |
| Allocation concealment (selection bias) | Unclear risk | NS (B) |
| Blinding (performance bias and detection bias) Participants | Low risk | Attention‐control participants |
| Blinding (performance bias and detection bias) Outcome assessors | High risk | Not blinded |
| Risk of selection bias? | Unclear risk | Moderate risk of selection bias (B) |
| Risk of detection bias? | Unclear risk | Moderate risk of detection bias (B) |
| Risk of attrition bias? | Low risk | Low risk of attribution bias (A) |
| Total risk of bias: A (low), B (moderate/unclear), or C (high) | Unclear risk | Moderate: one or more quality criteria only partially met (B). |
Deligiannis 1999.
| Methods |
|
|
| Participants | Inclusion criteria
Exclusion criteria
|
|
| Interventions | Treatment group
Control group
Follow‐up assessment
|
|
| Outcomes | Relevant to our study
Not relevant to our study
|
|
| Notes |
|
|
| Risk of bias | ||
| Bias | Authors' judgement | Support for judgement |
| Random sequence generation (selection bias) | Unclear risk | NS |
| Allocation concealment (selection bias) | Unclear risk | NS (B) |
| Blinding (performance bias and detection bias) Participants | High risk | Not blinded |
| Blinding (performance bias and detection bias) Outcome assessors | Unclear risk | NS |
| Risk of selection bias? | High risk | High risk of selection bias (C) |
| Risk of detection bias? | High risk | High risk of detection bias (C) |
| Risk of attrition bias? | Unclear risk | Moderate risk of attrition bias (B) |
| Total risk of bias: A (low), B (moderate/unclear), or C (high) | High risk | High, one or more quality criteria not met (C). |
Deligiannis‐HI 1999.
| Methods |
|
|
| Participants | Inclusion criteria:
Exclusion criteria
|
|
| Interventions | Supervised exercise group
Home exercise group
Control group
Follow‐up assessment
|
|
| Outcomes | Relevant to our study
Not relevant to our study
|
|
| Notes |
This is the same study as Deligiannis‐LI 1999, but the study has been given different names (HI, LI) to separate data from the high intensity exercise group and the low intensity exercise group, respectively. |
|
| Risk of bias | ||
| Bias | Authors' judgement | Support for judgement |
| Random sequence generation (selection bias) | Unclear risk | NS |
| Allocation concealment (selection bias) | Unclear risk | NS (B) |
| Blinding (performance bias and detection bias) Participants | High risk | Not blinded |
| Blinding (performance bias and detection bias) Outcome assessors | Unclear risk | NS |
| Risk of selection bias? | High risk | High risk of selection bias (C) |
| Risk of detection bias? | High risk | High risk of selection bias (C) |
| Risk of attrition bias? | Unclear risk | Moderate risk of attrition bias (B) |
| Total risk of bias: A (low), B (moderate/unclear), or C (high) | High risk | High, one or more quality criteria not met (C). |
Deligiannis‐LI 1999.
| Methods | ||
| Participants | ||
| Interventions | ||
| Outcomes | ||
| Notes | This is the same study as Deligiannis‐HI 1999, but the study has been given different names (HI, LI) to separate data from the supervised, high intensity exercise group and the unsupervised, low intensity exercise group, respectively. | |
DePaul 2002.
| Methods |
|
|
| Participants | Inclusion criteria
Exclusion criteria
|
|
| Interventions | Treatment group
Control group
Follow‐up assessment
|
|
| Outcomes | Relevant to our study
Not relevant to our study: None |
|
| Notes |
|
|
| Risk of bias | ||
| Bias | Authors' judgement | Support for judgement |
| Random sequence generation (selection bias) | Low risk | Randomisation table and randomising in blocks of four |
| Allocation concealment (selection bias) | Low risk | Used concealed assignments |
| Blinding (performance bias and detection bias) Participants | High risk | Not blinded |
| Blinding (performance bias and detection bias) Outcome assessors | Low risk | Blinded |
| Risk of selection bias? | Low risk | Low risk of selection bias (A) |
| Risk of detection bias? | Low risk | Low risk of detection bias (A) |
| Risk of attrition bias? | Low risk | Low risk of attrition bias (A) |
| Total risk of bias: A (low), B (moderate/unclear), or C (high) | Low risk | Low risk of bias (A) |
Dimeo 2007.
| Methods |
|
|
| Participants | Inclusion criteria
Exclusion criteria: NS |
|
| Interventions | Treatment group
Control group
Follow‐up assessment
|
|
| Outcomes | Relevant to our study
Not relevant to our study: None |
|
| Notes |
|
|
| Risk of bias | ||
| Bias | Authors' judgement | Support for judgement |
| Random sequence generation (selection bias) | Unclear risk | NS |
| Allocation concealment (selection bias) | Unclear risk | NS |
| Blinding (performance bias and detection bias) Participants | Unclear risk | NS |
| Blinding (performance bias and detection bias) Outcome assessors | Unclear risk | NS |
| Risk of selection bias? | High risk | High risk of selection bias (C) |
| Risk of detection bias? | High risk | High risk of detection bias (C) |
| Risk of attrition bias? | High risk | High risk of attrition bias (C) |
| Total risk of bias: A (low), B (moderate/unclear), or C (high) | High risk | High, one or more quality criteria not met (C). |
Eidemak 1997.
| Methods |
|
|
| Participants | Inclusion criteria:
Exclusion criteria
|
|
| Interventions | Treatment group
Control group
Follow‐up assessment
|
|
| Outcomes | Relevant to our study
Not relevant to our study
|
|
| Notes |
|
|
| Risk of bias | ||
| Bias | Authors' judgement | Support for judgement |
| Random sequence generation (selection bias) | Unclear risk | NS |
| Allocation concealment (selection bias) | Unclear risk | NS (B) |
| Blinding (performance bias and detection bias) Participants | High risk | Not blinded |
| Blinding (performance bias and detection bias) Outcome assessors | Unclear risk | NS |
| Risk of selection bias? | High risk | High risk of selection bias (C) |
| Risk of detection bias? | High risk | High risk of detection bias (C) |
| Risk of attrition bias? | Unclear risk | Moderate risk of attrition bias (B) |
| Total risk of bias: A (low), B (moderate/unclear), or C (high) | High risk | High, one or more quality criteria not met (C). |
Fitts 1995.
| Methods |
|
|
| Participants | Inclusion criteria
Exclusion criteria
|
|
| Interventions | Treatment group
Control group
Co‐interventions
Follow‐up assessment
|
|
| Outcomes | Relevant to our study
Not relevant to our study: None |
|
| Notes |
|
|
| Risk of bias | ||
| Bias | Authors' judgement | Support for judgement |
| Random sequence generation (selection bias) | Unclear risk | NS, however balanced for age and sex |
| Allocation concealment (selection bias) | Unclear risk | NS (B) |
| Blinding (performance bias and detection bias) Participants | High risk | Not blinded |
| Blinding (performance bias and detection bias) Outcome assessors | Unclear risk | NS |
| Risk of selection bias? | High risk | High risk of selection bias (C) |
| Risk of detection bias? | High risk | High risk of detection bias (C) |
| Risk of attrition bias? | Low risk | Low risk of attrition bias (A) |
| Total risk of bias: A (low), B (moderate/unclear), or C (high) | High risk | High, one or more quality criteria not met (C). |
Fitts 1999.
| Methods |
|
|
| Participants | Inclusion criteria:
Exclusion criteria
|
|
| Interventions | Treatment groups (DR and PR)
Control groups (DC and PC)
Follow‐up assessment
Co‐interventions
|
|
| Outcomes | Relevant to our study
Not relevant to our study: None |
|
| Notes |
|
|
| Risk of bias | ||
| Bias | Authors' judgement | Support for judgement |
| Random sequence generation (selection bias) | Unclear risk | 2x2x4 factorial design, with two between‐group variables. Sequence generation method: NS |
| Allocation concealment (selection bias) | Unclear risk | NS (B) |
| Blinding (performance bias and detection bias) Participants | Unclear risk | Not blinded |
| Blinding (performance bias and detection bias) Outcome assessors | Unclear risk | NS |
| Risk of selection bias? | High risk | High risk of selection bias (C) |
| Risk of detection bias? | High risk | High risk of detection bias (C) |
| Risk of attrition bias? | Unclear risk | Moderate risk of attrition bias (B) |
| Total risk of bias: A (low), B (moderate/unclear), or C (high) | High risk | High, one or more quality criteria not met (C). |
Frey 1999.
| Methods |
|
|
| Participants | Inclusion criteria
Exclusion criteria
|
|
| Interventions | Treatment group
Control group
Follow‐up assessment
|
|
| Outcomes | Relevant to our study
Not relevant to our study
|
|
| Notes |
|
|
| Risk of bias | ||
| Bias | Authors' judgement | Support for judgement |
| Random sequence generation (selection bias) | Unclear risk | NS |
| Allocation concealment (selection bias) | Unclear risk | NS |
| Blinding (performance bias and detection bias) Participants | High risk | Not blinded |
| Blinding (performance bias and detection bias) Outcome assessors | Unclear risk | NS |
| Risk of selection bias? | High risk | High risk of selection bias (C) |
| Risk of detection bias? | High risk | High risk of detection bias (C) |
| Risk of attrition bias? | Low risk | Low risk of attrition bias (A) |
| Total risk of bias: A (low), B (moderate/unclear), or C (high) | High risk | High, one or more quality criteria not met (C). |
Goldberg 1983.
| Methods |
|
|
| Participants | Inclusion criteria
Exclusion criteria
|
|
| Interventions | Treatment group
Control group
Follow‐up assessment
|
|
| Outcomes | Relevant to our study
Not relevant to our study
|
|
| Notes |
|
|
| Risk of bias | ||
| Bias | Authors' judgement | Support for judgement |
| Random sequence generation (selection bias) | Unclear risk | NS |
| Allocation concealment (selection bias) | Unclear risk | NS |
| Blinding (performance bias and detection bias) Participants | High risk | Not blinded |
| Blinding (performance bias and detection bias) Outcome assessors | Unclear risk | NS |
| Risk of selection bias? | High risk | High risk of selection bias (C) |
| Risk of detection bias? | High risk | High risk of detection bias (C) |
| Risk of attrition bias? | Unclear risk | Moderate risk of attrition bias (B) |
| Total risk of bias: A (low), B (moderate/unclear), or C (high) | High risk | High, one or more quality criteria not met (C). |
Harter 1985.
| Methods |
|
|
| Participants | Inclusion criteria
Exclusion criteria
|
|
| Interventions | Treatment group
Control group
Follow‐up assessment
|
|
| Outcomes | Relevant to our study
Not relevant to our study
|
|
| Notes |
|
|
| Risk of bias | ||
| Bias | Authors' judgement | Support for judgement |
| Random sequence generation (selection bias) | Unclear risk | NS |
| Allocation concealment (selection bias) | Unclear risk | NS (B) |
| Blinding (performance bias and detection bias) Participants | High risk | Not blinded |
| Blinding (performance bias and detection bias) Outcome assessors | Unclear risk | NS |
| Risk of selection bias? | High risk | High risk of selection bias (C) |
| Risk of detection bias? | High risk | High risk of detection bias (C) |
| Risk of attrition bias? | High risk | High risk of attrition bias (C) |
| Total risk of bias: A (low), B (moderate/unclear), or C (high) | High risk | High, one or more quality criteria not met (C). |
Johansen 2006.
| Methods |
|
|
| Participants | Inclusion criteria
Exclusion criteria
|
|
| Interventions | Treatment group
Control group
Follow‐up assessment
Patients were randomised into 4 groups
|
|
| Outcomes | Relevant to our study
Not relevant to our study: None |
|
| Notes |
|
|
| Risk of bias | ||
| Bias | Authors' judgement | Support for judgement |
| Random sequence generation (selection bias) | Low risk | Yes; 1:1:1:1 manner by the research pharmacist using variable block sized. |
| Allocation concealment (selection bias) | Low risk | Adequate |
| Blinding (performance bias and detection bias) Participants | High risk | No blinding |
| Blinding (performance bias and detection bias) Outcome assessors | High risk | No blinding |
| Risk of selection bias? | Low risk | Low risk of selection bias (A) |
| Risk of detection bias? | High risk | High risk of detection bias (C) |
| Risk of attrition bias? | Low risk | Low risk of attrition bias (A) |
| Total risk of bias: A (low), B (moderate/unclear), or C (high) | Low risk | Low risk of bias (A) |
Jong 2004.
| Methods |
|
|
| Participants | Inclusion criteria
Exclusion criteria: NS |
|
| Interventions | Treatment group
Control group
Follow‐up assessment
|
|
| Outcomes | Relevant to our study
Not relevant to our study
|
|
| Notes |
|
|
| Risk of bias | ||
| Bias | Authors' judgement | Support for judgement |
| Random sequence generation (selection bias) | Unclear risk | NS |
| Allocation concealment (selection bias) | Unclear risk | NS (B) |
| Blinding (performance bias and detection bias) Participants | High risk | Not blinded |
| Blinding (performance bias and detection bias) Outcome assessors | Unclear risk | NS |
| Risk of selection bias? | High risk | High risk of selection bias (C) |
| Risk of detection bias? | High risk | High risk of detection bias (C) |
| Risk of attrition bias? | Unclear risk | Moderate risk of attrition bias (B) |
| Total risk of bias: A (low), B (moderate/unclear), or C (high) | High risk | High, one or more quality criteria not met (C) |
Koh 2010a.
| Methods |
|
|
| Participants | Inclusion criteria
Exclusion criteria
|
|
| Interventions | Supervised intra‐dialytic exercise group
Unsupervised home‐based exercise group
Control group
Follow‐up assessment
|
|
| Outcomes | Relevant to our study
Not relevant to our study: None |
|
| Notes |
|
|
| Risk of bias | ||
| Bias | Authors' judgement | Support for judgement |
| Random sequence generation (selection bias) | Low risk | Participants were randomly assigned by an individual not associated with the study using unrestricted computer‐ generated random numbers. |
| Allocation concealment (selection bias) | Low risk | Adequate (A) |
| Blinding (performance bias and detection bias) Participants | High risk | No blinding |
| Blinding (performance bias and detection bias) Outcome assessors | High risk | No blinding |
| Risk of selection bias? | Low risk | Low risk of selection bias (A) |
| Risk of detection bias? | High risk | High risk of detection bias (C) |
| Risk of attrition bias? | Low risk | Low risk of attrition bias (A) |
| Total risk of bias: A (low), B (moderate/unclear), or C (high) | Low risk | Low risk of bias (A) |
Koh 2010b.
| Methods | ||
| Participants | ||
| Interventions | ||
| Outcomes | ||
| Notes | This is the same study as Koh 2010a but the study has been given different names (2010a, 2010b) to separate data from the intra‐dialytic exercise group and the home‐based exercise group, respectively. | |
Konstantinidou‐D 2002.
| Methods |
|
|
| Participants | Inclusion criteria
Exclusion criteria
|
|
| Interventions | Treatment group 1
Treatment group 2
Treatment group 3
Control group
Co‐interventions
Follow‐up: at the end of the intervention period of 6 months. End of intervention data has been used. |
|
| Outcomes | Relevant to our study
Not relevant to our study
|
|
| Notes |
This is the same study as Konstantinidou‐ND 2002 and Konstantinidou‐US 2002, but the study has been given different names (D, ND, us) to separate data from the during dialysis exercise group, the exercise group that exercised on non‐dialysis days and the unsupervised, respectively. |
|
| Risk of bias | ||
| Bias | Authors' judgement | Support for judgement |
| Random sequence generation (selection bias) | Unclear risk | NS |
| Allocation concealment (selection bias) | Unclear risk | NS (B) |
| Blinding (performance bias and detection bias) Participants | High risk | Not blinded |
| Blinding (performance bias and detection bias) Outcome assessors | Unclear risk | NS |
| Risk of selection bias? | Unclear risk | Moderate risk of selection bias (B) |
| Risk of detection bias? | High risk | High risk of detection bias (C) |
| Risk of attrition bias? | Unclear risk | Moderate risk of attrition bias (B) |
| Total risk of bias: A (low), B (moderate/unclear), or C (high) | Unclear risk | Moderate, one or more of the quality criteria only partially met (B). |
Konstantinidou‐ND 2002.
| Methods | ||
| Participants | ||
| Interventions | ||
| Outcomes | ||
| Notes | This is the same study as Konstantinidou‐D 2002 and Konstantinidou‐US 2002, but the study has been given different names (D, ND, us) to separate data from the during dialysis exercise group, the exercise group that exercised on non‐dialysis days and the unsupervised, respectively. | |
Konstantinidou‐US 2002.
| Methods | ||
| Participants | ||
| Interventions | ||
| Outcomes | ||
| Notes | This is the same study as Konstantinidou‐ND 2002 and Konstantinidou‐US 2002, but the study has been given different names (D, ND, US) to separate data from the during dialysis exercise group, the exercise group that exercised on non‐dialysis days and the unsupervised, respectively. | |
Kopple 2007a.
| Methods |
|
|
| Participants | Inclusion criteria
Exclusion criteria: NS |
|
| Interventions | Cardiovascular exercise group
Resistance training group
Mixed cardiovascular and resistance training group
Control group
Follow‐up assessment
|
|
| Outcomes | Relevant to our study
Not relevant to our study
|
|
| Notes |
|
|
| Risk of bias | ||
| Bias | Authors' judgement | Support for judgement |
| Random sequence generation (selection bias) | Unclear risk | NS |
| Allocation concealment (selection bias) | Unclear risk | NS |
| Blinding (performance bias and detection bias) Participants | High risk | No blinding |
| Blinding (performance bias and detection bias) Outcome assessors | Unclear risk | NS |
| Risk of selection bias? | High risk | High risk of selection bias (C) |
| Risk of detection bias? | High risk | High risk of detection bias (C) |
| Risk of attrition bias? | Unclear risk | Moderate risk of attribution bias (B) |
| Total risk of bias: A (low), B (moderate/unclear), or C (high) | High risk | High, one or more quality criteria not met (C). |
Koufaki 2002a.
| Methods |
|
|
| Participants | Inclusion criteria
Exclusion criteria
|
|
| Interventions | Treatment group
Control group
Co‐interventions
Follow‐up assessment
|
|
| Outcomes | Relevant to our study
Not relevant to our study
|
|
| Notes |
|
|
| Risk of bias | ||
| Bias | Authors' judgement | Support for judgement |
| Random sequence generation (selection bias) | Low risk | By flip of a coin after eligible participants entered the study |
| Allocation concealment (selection bias) | Low risk | Adequate (A) |
| Blinding (performance bias and detection bias) Participants | High risk | Not blinded |
| Blinding (performance bias and detection bias) Outcome assessors | Unclear risk | NS |
| Risk of selection bias? | Low risk | Low risk of selection bias (A) |
| Risk of detection bias? | High risk | High risk of detection bias (C) |
| Risk of attrition bias? | Unclear risk | Moderate risk of attrition bias (B) |
| Total risk of bias: A (low), B (moderate/unclear), or C (high) | Unclear risk | Moderate, one or more of the quality criteria only partially met (B). |
Koufaki 2003.
| Methods |
|
|
| Participants | Inclusion criteria
Exclusion criteria: NS |
|
| Interventions | Patients' anaemia was first partially corrected with EPO (mean interval 5 months) before randomisation Treatment group
Control group
Follow‐up assessment
|
|
| Outcomes | Relevant to our study: VO2 peak, walk performance. Not relevant to our study: Hb, oxygen uptake at the ventilatory threshold, oxygen uptake kinetics. |
|
| Notes |
|
|
| Risk of bias | ||
| Bias | Authors' judgement | Support for judgement |
| Random sequence generation (selection bias) | Unclear risk | NS |
| Allocation concealment (selection bias) | Unclear risk | NS (B) |
| Blinding (performance bias and detection bias) Participants | High risk | Not blinded |
| Blinding (performance bias and detection bias) Outcome assessors | Unclear risk | NS |
| Risk of selection bias? | High risk | High risk of selection bias (C) |
| Risk of detection bias? | High risk | High risk of detection bias (C) |
| Risk of attrition bias? | High risk | High risk of attrition bias (C) |
| Total risk of bias: A (low), B (moderate/unclear), or C (high) | High risk | High, one or more quality criteria not met (C). |
Kouidi 1997a.
| Methods |
|
|
| Participants | Inclusion criteria
Exclusion criteria
|
|
| Interventions | Treatment group
Control group
Co‐interventions
Follow‐up assessment
|
|
| Outcomes | Relevant to our study
Not relevant to our study
|
|
| Notes |
|
|
| Risk of bias | ||
| Bias | Authors' judgement | Support for judgement |
| Random sequence generation (selection bias) | Unclear risk | NS |
| Allocation concealment (selection bias) | Unclear risk | NS (B) |
| Blinding (performance bias and detection bias) Participants | High risk | Not blinded |
| Blinding (performance bias and detection bias) Outcome assessors | Unclear risk | NS |
| Risk of selection bias? | Unclear risk | Moderate risk of selection bias (B) |
| Risk of detection bias? | High risk | High risk of detection bias (C) |
| Risk of attrition bias? | Unclear risk | Moderate risk of attrition bias (B) |
| Total risk of bias: A (low), B (moderate/unclear), or C (high) | Unclear risk | Moderate, one or more of the quality criteria only partially met (B). |
Kouidi 2002a.
| Methods |
|
|
| Participants | Inclusion criteria
Exclusion criteria: NS |
|
| Interventions | Treatment group
Control group
Follow‐up assessment
|
|
| Outcomes |
|
|
| Notes |
|
|
| Risk of bias | ||
| Bias | Authors' judgement | Support for judgement |
| Random sequence generation (selection bias) | Unclear risk | NS |
| Allocation concealment (selection bias) | Unclear risk | NS (B) |
| Blinding (performance bias and detection bias) Participants | High risk | Not blinded |
| Blinding (performance bias and detection bias) Outcome assessors | Unclear risk | NS |
| Risk of selection bias? | High risk | High risk of selection bias (C) |
| Risk of detection bias? | High risk | High risk of detection bias (C) |
| Risk of attrition bias? | Unclear risk | Moderate risk of attrition bias (B) |
| Total risk of bias: A (low), B (moderate/unclear), or C (high) | High risk | High, one or more quality criteria not met (C). |
Kouidi 2002b.
| Methods |
|
|
| Participants | Inclusion criteria
Exclusion criteria: NS |
|
| Interventions | Treatment group
Control group
Follow‐up assessment
|
|
| Outcomes | Relevant to our study
Not relevant to our study
|
|
| Notes |
|
|
| Risk of bias | ||
| Bias | Authors' judgement | Support for judgement |
| Random sequence generation (selection bias) | Unclear risk | NS |
| Allocation concealment (selection bias) | Unclear risk | NS (B) |
| Blinding (performance bias and detection bias) Participants | High risk | Not blinded |
| Blinding (performance bias and detection bias) Outcome assessors | Unclear risk | NS |
| Risk of selection bias? | High risk | High risk of selection bias (C) |
| Risk of detection bias? | High risk | High risk of detection bias (C) |
| Risk of attrition bias? | High risk | High risk of attrition bias (C) |
| Total risk of bias: A (low), B (moderate/unclear), or C (high) | High risk | High, one or more quality criteria not met (C). |
Kouidi 2003a.
| Methods |
|
|
| Participants | Inclusion criteria
Exclusion criteria
|
|
| Interventions | Treatment group
Control group
Follow‐up assessment
|
|
| Outcomes | Relevant to our study
Not relevant to our study
|
|
| Notes |
|
|
| Risk of bias | ||
| Bias | Authors' judgement | Support for judgement |
| Random sequence generation (selection bias) | Unclear risk | NS |
| Allocation concealment (selection bias) | Unclear risk | NS (B) |
| Blinding (performance bias and detection bias) Participants | High risk | Not blinded |
| Blinding (performance bias and detection bias) Outcome assessors | Unclear risk | NS |
| Risk of selection bias? | High risk | High risk of selection bias (C) |
| Risk of detection bias? | High risk | High risk of detection bias (C) |
| Risk of attrition bias? | High risk | High risk of attrition bias (C) |
| Total risk of bias: A (low), B (moderate/unclear), or C (high) | High risk | High, one or more quality criteria not met (C). |
Kouidi 2004a.
| Methods |
|
|
| Participants | Inclusion criteria
Exclusion criteria
|
|
| Interventions | Treatment group
Control group
Follow‐up assessment
|
|
| Outcomes | Relevant to our study
Not relevant to our study
|
|
| Notes |
|
|
| Risk of bias | ||
| Bias | Authors' judgement | Support for judgement |
| Random sequence generation (selection bias) | Unclear risk | NS |
| Allocation concealment (selection bias) | Unclear risk | NS (B) |
| Blinding (performance bias and detection bias) Participants | Unclear risk | Not blinded |
| Blinding (performance bias and detection bias) Outcome assessors | Unclear risk | NS |
| Risk of selection bias? | High risk | High risk of selection bias (C) |
| Risk of detection bias? | High risk | High risk of detection bias (C) |
| Risk of attrition bias? | High risk | High risk of attrition bias (C) |
| Total risk of bias: A (low), B (moderate/unclear), or C (high) | High risk | High, one or more quality criteria not met (C). |
Kouidi 2005.
| Methods |
|
|
| Participants | Inclusion criteria
Exclusion criteria: NS |
|
| Interventions | Treatment group
Control group
Co‐interventions
Follow‐up assessment
|
|
| Outcomes | Relevant to our study
Not relevant to our study
|
|
| Notes |
|
|
| Risk of bias | ||
| Bias | Authors' judgement | Support for judgement |
| Random sequence generation (selection bias) | Unclear risk | NS |
| Allocation concealment (selection bias) | Unclear risk | NS (B) |
| Blinding (performance bias and detection bias) Participants | High risk | Not blinded |
| Blinding (performance bias and detection bias) Outcome assessors | Unclear risk | NS |
| Risk of selection bias? | High risk | High risk of selection bias (C) |
| Risk of detection bias? | High risk | High risk of detection bias (C) |
| Risk of attrition bias? | High risk | High risk of attrition bias (C) |
| Total risk of bias: A (low), B (moderate/unclear), or C (high) | High risk | High, one or more quality criteria not met (C). |
Kouidi 2009.
| Methods |
|
|
| Participants | Inclusion criteria
Exclusion criteria
|
|
| Interventions | Treatment group
Control group
Follow‐up assessment
|
|
| Outcomes | Relevant to our study
Not relevant to our study
|
|
| Notes |
From the same study 60 patients volunteered to participate in an included substudy where baroreflex sensitivity was primary outcome measure. They measured this after 7 months but the original study continued for 10 months as presented in the article by Kouidi 2009. Data concerning blood pressure and heart rate has been extracted from Petraki´s article. |
|
| Risk of bias | ||
| Bias | Authors' judgement | Support for judgement |
| Random sequence generation (selection bias) | Unclear risk | Randomisation by lot |
| Allocation concealment (selection bias) | Unclear risk | NS |
| Blinding (performance bias and detection bias) Participants | High risk | Not blinded |
| Blinding (performance bias and detection bias) Outcome assessors | Unclear risk | NS |
| Risk of selection bias? | Unclear risk | Moderate risk of selection bias (B) |
| Risk of detection bias? | High risk | High risk of detection bias (C) |
| Risk of attrition bias? | Low risk | Low risk of attrition bias (A) |
| Total risk of bias: A (low), B (moderate/unclear), or C (high) | Unclear risk | Moderate, one or more of the quality criteria only partially met (B). |
Lee 2001.
| Methods |
|
|
| Participants | Inclusion criteria
Exclusion criteria: NS |
|
| Interventions | Treatment group
Control group
Follow‐up assessment
|
|
| Outcomes | Relevant to our study
Not relevant to our study: none |
|
| Notes |
|
|
| Risk of bias | ||
| Bias | Authors' judgement | Support for judgement |
| Random sequence generation (selection bias) | Unclear risk | NS |
| Allocation concealment (selection bias) | Unclear risk | NS |
| Blinding (performance bias and detection bias) Participants | Unclear risk | NS |
| Blinding (performance bias and detection bias) Outcome assessors | Unclear risk | NS |
| Risk of selection bias? | High risk | High risk of selection bias (C) |
| Risk of detection bias? | High risk | High risk of detection bias (C) |
| Risk of attrition bias? | High risk | High risk of attrition bias (C) |
| Total risk of bias: A (low), B (moderate/unclear), or C (high) | High risk | High, one or more quality criteria not met (C). |
Leehey 2009.
| Methods |
|
|
| Participants | Inclusion criteria
Exclusion criteria
|
|
| Interventions | Treatment group
Control group
Follow‐up assessment
|
|
| Outcomes | Relevant to our study
Not relevant to our study
|
|
| Notes |
|
|
| Risk of bias | ||
| Bias | Authors' judgement | Support for judgement |
| Random sequence generation (selection bias) | Low risk | 2x2 block randomisation scheme |
| Allocation concealment (selection bias) | Unclear risk | NS (B) |
| Blinding (performance bias and detection bias) Participants | High risk | Not blinded |
| Blinding (performance bias and detection bias) Outcome assessors | High risk | No blinded outcome assessors |
| Risk of selection bias? | Unclear risk | Moderate risk of selection bias (B) |
| Risk of detection bias? | High risk | High risk of detection bias (C) |
| Risk of attrition bias? | Unclear risk | Moderate risk of attrition bias (B) |
| Total risk of bias: A (low), B (moderate/unclear), or C (high) | Unclear risk | Moderate, one or more of the quality criteria only partially met (B). |
Matsumoto 2007.
| Methods |
|
|
| Participants | Inclusion criteria
Exclusion criteria
|
|
| Interventions | Treatment group
Control group
Follow‐up assessment
|
|
| Outcomes | Relevant to our study
Not relevant to our study
|
|
| Notes |
|
|
| Risk of bias | ||
| Bias | Authors' judgement | Support for judgement |
| Random sequence generation (selection bias) | Unclear risk | NS |
| Allocation concealment (selection bias) | Unclear risk | NS |
| Blinding (performance bias and detection bias) Participants | High risk | No |
| Blinding (performance bias and detection bias) Outcome assessors | Unclear risk | NS |
| Risk of selection bias? | Unclear risk | Moderate risk of selection bias (B) |
| Risk of detection bias? | High risk | High risk of detection bias (C) |
| Risk of attrition bias? | Unclear risk | Moderate risk of attrition bias (B) |
| Total risk of bias: A (low), B (moderate/unclear), or C (high) | Unclear risk | Moderate, one or more of the quality criteria only partially met (B). |
Molsted 2004.
| Methods |
|
|
| Participants | Inclusion criteria
Exclusion criteria
|
|
| Interventions | Treatment group
Control group
Follow‐up assessment
|
|
| Outcomes | Relevant to our study
Not relevant to our study: None |
|
| Notes |
|
|
| Risk of bias | ||
| Bias | Authors' judgement | Support for judgement |
| Random sequence generation (selection bias) | Low risk | The patients were randomly assigned to either an exercise‐ or a control group (ratio 2:1), however method not stated |
| Allocation concealment (selection bias) | Low risk | Envelope method |
| Blinding (performance bias and detection bias) Participants | High risk | Not blinded |
| Blinding (performance bias and detection bias) Outcome assessors | Low risk | All tests were carried out by blinded testers. |
| Risk of selection bias? | Low risk | Low risk of selection bias (A) |
| Risk of detection bias? | Low risk | Low risk of detection bias (A) |
| Risk of attrition bias? | Unclear risk | Moderate risk of attrition bias (B) |
| Total risk of bias: A (low), B (moderate/unclear), or C (high) | Low risk | Low risk of bias (A) |
Ouzouni 2009.
| Methods |
|
|
| Participants | Inclusion criteria
Exclusion criteria
|
|
| Interventions | Treatment group
Control group
Follow‐up assessment
|
|
| Outcomes | Relevant to our study
Not relevant to our study
|
|
| Notes |
|
|
| Risk of bias | ||
| Bias | Authors' judgement | Support for judgement |
| Random sequence generation (selection bias) | Unclear risk | NS |
| Allocation concealment (selection bias) | Unclear risk | NS (B) |
| Blinding (performance bias and detection bias) Participants | High risk | Not blinded |
| Blinding (performance bias and detection bias) Outcome assessors | Unclear risk | NS |
| Risk of selection bias? | High risk | High risk of selection bias (C) |
| Risk of detection bias? | High risk | High risk of detection bias (C) |
| Risk of attrition bias? | Low risk | Low risk of attrition bias (A) |
| Total risk of bias: A (low), B (moderate/unclear), or C (high) | Unclear risk | Moderate, one or more of the quality criteria only partially met (B). |
Painter 2002a.
| Methods |
|
|
| Participants | Inclusion criteria
Exclusion criteria
|
|
| Interventions | Treatment group
Control group
Follow up assessment
|
|
| Outcomes | Relevant to our study
Not relevant to our study
|
|
| Notes |
|
|
| Risk of bias | ||
| Bias | Authors' judgement | Support for judgement |
| Random sequence generation (selection bias) | Low risk | Adequate. Randomisation was performed using a restricted randomisation procedure, which was managed using prepared sealed envelopes containing a card indicating the allocated treatment group. After the baseline testing, the next envelope was opened. |
| Allocation concealment (selection bias) | Low risk | Sealed envelopes containing a card indicating the allocated treatment (A) |
| Blinding (performance bias and detection bias) Participants | High risk | Not blinded |
| Blinding (performance bias and detection bias) Outcome assessors | Unclear risk | NS |
| Risk of selection bias? | Low risk | Low risk of selection bias (A) |
| Risk of detection bias? | High risk | High risk of detection bias (C) |
| Risk of attrition bias? | Low risk | Low risk of attrition bias (A) |
| Total risk of bias: A (low), B (moderate/unclear), or C (high) | Low risk | Low risk of bias (A) |
Painter 2002b.
| Methods |
|
|
| Participants | Inclusion criteria
Exclusion criteria
|
|
| Interventions | Treatment group 1
Treatment group 2
Control group 1
Control group 2
Co‐interventions
Exercise training
Follow‐up assessment
|
|
| Outcomes | Relevant to our study
Not relevant to our study
|
|
| Notes |
|
|
| Risk of bias | ||
| Bias | Authors' judgement | Support for judgement |
| Random sequence generation (selection bias) | Unclear risk | Randomisation was stratified by age (< 50 versus ≥ 50) and sex. No further description of the randomisation method is reported. |
| Allocation concealment (selection bias) | Unclear risk | NS (B) |
| Blinding (performance bias and detection bias) Participants | High risk | Not blinded |
| Blinding (performance bias and detection bias) Outcome assessors | Unclear risk | NS |
| Risk of selection bias? | Unclear risk | Moderate risk of selection bias (B) |
| Risk of detection bias? | High risk | High risk of selection bias (C) |
| Risk of attrition bias? | Unclear risk | Moderate risk of attrition bias (B) |
| Total risk of bias: A (low), B (moderate/unclear), or C (high) | Unclear risk | Moderate, one or more of the quality criteria only partially met (B). |
Painter 2003.
| Methods |
|
|
| Participants | Inclusion criteria
Exclusion criteria
|
|
| Interventions | Treatment group
Control group
Follow up assessment
|
|
| Outcomes | Relevant to our study
Not relevant to our study
|
|
| Notes |
|
|
| Risk of bias | ||
| Bias | Authors' judgement | Support for judgement |
| Random sequence generation (selection bias) | Low risk | Adequate. Randomisation was performed using a restricted randomisation procedure, which was managed using prepared sealed envelopes containing a card indicating the allocated treatment group. After the baseline testing, the next envelope was opened. |
| Allocation concealment (selection bias) | Low risk | Prepared sealed envelopes containing a card indicating the allocated treatment group (A) |
| Blinding (performance bias and detection bias) Participants | High risk | Not blinded |
| Blinding (performance bias and detection bias) Outcome assessors | Unclear risk | NS |
| Risk of selection bias? | Low risk | Low risk of selection bias (A) |
| Risk of detection bias? | High risk | High risk of detection bias (C) |
| Risk of attrition bias? | Unclear risk | Moderate risk of attrition bias (B) |
| Total risk of bias: A (low), B (moderate/unclear), or C (high) | Unclear risk | Moderate, one or more of the quality criteria only partially met (B). |
Parsons 2004.
| Methods |
|
|
| Participants | Inclusion criteria
Exclusion criteria
|
|
| Interventions | Treatment group
Control group
Co‐interventions
Follow‐up assessment
|
|
| Outcomes | Relevant to our study
Not relevant to our study
|
|
| Notes |
|
|
| Risk of bias | ||
| Bias | Authors' judgement | Support for judgement |
| Random sequence generation (selection bias) | Unclear risk | NS; Patients were matched according to age, maximal work capacity and protein catabolic rate |
| Allocation concealment (selection bias) | Unclear risk | NS (B) |
| Blinding (performance bias and detection bias) Participants | High risk | Not blinded |
| Blinding (performance bias and detection bias) Outcome assessors | Unclear risk | NS |
| Risk of selection bias? | Unclear risk | Moderate risk of selection bias (B) |
| Risk of detection bias? | High risk | High risk of detection bias (C) |
| Risk of attrition bias? | Unclear risk | Moderate risk of attrition bias (B) |
| Total risk of bias: A (low), B (moderate/unclear), or C (high) | Unclear risk | Moderate, one or more of the quality criteria only partially met (B). |
PEAK Study 2005.
| Methods |
|
|
| Participants | Inclusion criteria
Exclusion criteria
|
|
| Interventions | Treatment group
Control group
Follow up assessment
|
|
| Outcomes | Related to our study
Not related to our study
|
|
| Notes |
|
|
| Risk of bias | ||
| Bias | Authors' judgement | Support for judgement |
| Random sequence generation (selection bias) | Low risk | Computer‐generated randomly‐permuted blocks stratified by gender in blocks of four to Exercise training + usual care, or usual care control |
| Allocation concealment (selection bias) | Low risk | Adequate (A) |
| Blinding (performance bias and detection bias) Participants | High risk | Not blinded |
| Blinding (performance bias and detection bias) Outcome assessors | Low risk | Yes for body composition, nutritional status, biochemical measures |
| Risk of selection bias? | Low risk | Low risk of bias for selection bias (A) |
| Risk of detection bias? | Low risk | Low risk for detection bias (A) |
| Risk of attrition bias? | Unclear risk | Moderate risk of attrition bias (B) |
| Total risk of bias: A (low), B (moderate/unclear), or C (high) | Low risk | Low risk of bias (A) |
Segura‐Orti 2009.
| Methods |
|
|
| Participants | Inclusion criteria
Exclusion criteria
|
|
| Interventions | Treatment group
Control group:
Follow‐up assessment
|
|
| Outcomes | Relevant to our study
Not relevant to our study: None |
|
| Notes |
|
|
| Risk of bias | ||
| Bias | Authors' judgement | Support for judgement |
| Random sequence generation (selection bias) | Low risk | Table of random numbers, stratified by age and gender |
| Allocation concealment (selection bias) | Low risk | Adequate (A) |
| Blinding (performance bias and detection bias) Participants | Low risk | Control group: placebo exercise |
| Blinding (performance bias and detection bias) Outcome assessors | Unclear risk | NS |
| Risk of selection bias? | Low risk | Low risk of selection bias (A) |
| Risk of detection bias? | Unclear risk | Moderate risk of detection bias (C) |
| Risk of attrition bias? | Low risk | Low risk of attrition bias (A) |
| Total risk of bias: A (low), B (moderate/unclear), or C (high) | Low risk | Low risk of bias (A) |
Toussaint 2008.
| Methods |
|
|
| Participants | Inclusion criteria
Exclusion criteria
|
|
| Interventions | Treatment group
Control group
Follow‐up assessment
|
|
| Outcomes | Relevant to our study
Not relevant to our study
|
|
| Notes |
|
|
| Risk of bias | ||
| Bias | Authors' judgement | Support for judgement |
| Random sequence generation (selection bias) | Unclear risk | NS |
| Allocation concealment (selection bias) | Low risk | Sealed envelopes |
| Blinding (performance bias and detection bias) Participants | High risk | Not blinding |
| Blinding (performance bias and detection bias) Outcome assessors | Unclear risk | NS |
| Risk of selection bias? | Unclear risk | Moderate risk of selection bias (B) |
| Risk of detection bias? | High risk | High risk of detection bias (C) |
| Risk of attrition bias? | Unclear risk | Moderate risk of attrition bias (B) |
| Total risk of bias: A (low), B (moderate/unclear), or C (high) | Unclear risk | Moderate, one or more of the quality criteria only partially met (B). |
Tsuyuki 2003.
| Methods |
|
|
| Participants | Inclusion criteria
Exclusion criteria
|
|
| Interventions | Treatment group
Control group
Follow up assessment
|
|
| Outcomes | Related to our study
Not related to our study
|
|
| Notes |
|
|
| Risk of bias | ||
| Bias | Authors' judgement | Support for judgement |
| Random sequence generation (selection bias) | Unclear risk | NS |
| Allocation concealment (selection bias) | Unclear risk | NS (B) |
| Blinding (performance bias and detection bias) Participants | High risk | Not blinded |
| Blinding (performance bias and detection bias) Outcome assessors | Unclear risk | NS |
| Risk of selection bias? | High risk | High risk for selection bias |
| Risk of detection bias? | High risk | High risk for detection bias |
| Risk of attrition bias? | Unclear risk | Moderate risk for attrition bias |
| Total risk of bias: A (low), B (moderate/unclear), or C (high) | High risk | High, one or more quality criteria not met (C). |
van Vilsteren 2005.
| Methods |
|
|
| Participants | Inclusion criteria
Exclusion criteria:
|
|
| Interventions | Treatment group
Control group
Follow up assessment
|
|
| Outcomes | Relevant to our study
Not relevant to our study
|
|
| Notes |
|
|
| Risk of bias | ||
| Bias | Authors' judgement | Support for judgement |
| Random sequence generation (selection bias) | Unclear risk | NS. Extra patients were randomised into the exercise group to compensate for the effects of drop‐out. |
| Allocation concealment (selection bias) | Unclear risk | NS (B) |
| Blinding (performance bias and detection bias) Participants | High risk | Not blinded |
| Blinding (performance bias and detection bias) Outcome assessors | Low risk | Blinded |
| Risk of selection bias? | Unclear risk | Moderate risk for selection bias (B) |
| Risk of detection bias? | Low risk | Low risk for detection bias (A) |
| Risk of attrition bias? | Low risk | Low risk for attrition bias (A) |
| Total risk of bias: A (low), B (moderate/unclear), or C (high) | Unclear risk | Moderate, one or more of the quality criteria only partially met (B) |
Yurtkuran 2007.
| Methods |
|
|
| Participants | Inclusion criteria
Exclusion criteria
|
|
| Interventions | Treatment group
Control group
Follow‐up assessment
|
|
| Outcomes | Relevant to our study
Not relevant to our study
|
|
| Notes |
|
|
| Risk of bias | ||
| Bias | Authors' judgement | Support for judgement |
| Random sequence generation (selection bias) | Low risk | Computer‐generated table of random numbers |
| Allocation concealment (selection bias) | Low risk | Adequate (A) |
| Blinding (performance bias and detection bias) Participants | High risk | No |
| Blinding (performance bias and detection bias) Outcome assessors | Low risk | Yes |
| Risk of selection bias? | Low risk | Low risk of selection bias (A) |
| Risk of detection bias? | Low risk | Low risk of detection bias (A) |
| Risk of attrition bias? | Low risk | Low risk of attrition bias (A) |
| Total risk of bias: A (low), B (moderate/unclear), or C (high) | Low risk | Low risk of bias (A) |
ACEi ‐ Angiotensin converting enzyme inhibitor; ARB ‐ angiotensin receptor blocker; CAPD ‐ continuous ambulatory peritoneal dialysis; CKD ‐ chronic kidney disease; DM ‐ diabetes mellitus; ESKD ‐ end‐stage kidney disease; EPO ‐ erythropoietin; GFR ‐ glomerular filtration rate; Hb ‐ haemoglobin; HCT ‐ haematocrit; HD ‐ haemodialysis; ITT ‐ intention‐to‐treat; NS ‐ not stated; rHuEPO ‐ recombinant human erythropoietin; RPE ‐ rating of perceived exertion; SCr ‐ serum creatinine
Characteristics of excluded studies [ordered by study ID]
| Study | Reason for exclusion |
|---|---|
| Adams 2006 | Not a RCT |
| Adorati 2000 | Not a RCT |
| Ahn 2000 | No control group |
| Ahn 2001 | No control group |
| Amaral 1999 | Not a RCT |
| Anderson 2001 | Not a RCT |
| Anderson 2004 | Wrong study design. Have used a A‐B‐A design |
| Anonymous 1998 | No exercise intervention |
| Anonymous 2001 | This article is a summary of Castaneda 2001 |
| Antonoff 1988 | This article consists of comments on a previously published article on exercise and patients with haemodialysis treatment. |
| Argani 2001 | No control group |
| Baiardi 2002 | No exercise intervention |
| Bandel 1983 | Review |
| Banerjee 2004 | Studied acute response to physical exercise |
| Bavikati 2008 | Studies life style change and not the effects of a specific exercise intervention |
| Beddhu 2009 | No exercise intervention |
| Bernardi 2005 | No exercise intervention |
| Beto 1998 | Review |
| Biehl 1997 | No control group |
| Biolo 2005 | Review |
| Blagg 1994 | No exercise intervention |
| Bolanos 1993 | Review |
| Boone 1987 | Review |
| Borregaard 2003 | Not a RCT |
| Boyce 1997 | Not a RCT |
| Brawner 1999 | Case report |
| Bronas 2009 | Review |
| Brunier 1993 | No exercise intervention |
| Bullock 1984 | No exercise intervention |
| Burke 1985 | No exercise intervention |
| Cade 1995 | Case report |
| Cade 1997 | Case report |
| Cade 2004 | Not a RCT |
| Capitanini 2008 | Not a RCT |
| Cappy 1999 | No control group |
| Carey 1997 | Review |
| Carlson 1999 | No exercise intervention |
| Carney 1983 | Not a RCT |
| Cashion 2000 | Not a RCT |
| Castaneda 1998 | Review |
| Castellino 1987 | Studied acute response to physical exercise |
| Chan 2007 | Review |
| Cheema 2005a | Review |
| Cheema 2005b | Review |
| Cheema 2006 | Not a RCT |
| Chen 2005 | Not a RCT |
| Cheng 2003 | Not a RCT |
| Clark 1996 | Studied acute response to maximal physical exercise |
| Clyne 1991a | Not a RCT |
| Clyne 1996 | Review |
| Clyne 2004a | Review |
| Clyne 2004b | Review |
| Colangelo 1997 | Review |
| Cook 2008 | Not a RCT |
| Copley 1999 | No exercise intervention |
| Copley 2001 | No exercise intervention |
| Cowan 2000 | Not a RCT |
| Cowan 2001 | No control group |
| Cowen 1995 | No ESRD control group |
| Curtin 2002 | No exercise intervention |
| Dasselaar 2004 | Not a RCT |
| Daul 1990 | No control group |
| Daul 2004 | Review |
| Death 1999 | No control group |
| Deligiannis 2002 | No exercise intervention |
| Deligiannis 2004a | Review |
| Deligiannis 2004b | Review |
| Derici 2005 | No control group |
| Desmet 2003 | No exercise intervention |
| Donwerth 1994 | Review |
| Endo 1995 | No CKD control group |
| Endo 1996 | No control group |
| Evans 2004 | Review |
| Farese 2008 | No exercise intervention |
| Fatouros 2008 | Studied acute effects of single bout exercise |
| Ferreira 2003 | Animal study |
| Finkelstein 2002 | No exercise intervention |
| Fitts 1996 | No exercise intervention |
| Fitts 1997 | Review |
| Forrest 2004 | Not a RCT |
| Francavilla 2002 | Review |
| Franssen 2002 | No exercise intervention. |
| Fritschka 2000 | No exercise intervention |
| Fritschka 2001 | No control group |
| Fritschka 2003 | No control group |
| Fuhrmann 2004 | Review |
| Fuiano 2004 | No exercise intervention |
| Fulignati 2002 | Not a RCT |
| Furuland 1998 | No exercise intervention |
| Gavin 1982 | Not a RCT |
| Germain 1985 | No exercise intervention |
| Goldberg 1979a | No control group |
| Goldberg 1979b | No control group |
| Goldberg 1980a | No control group |
| Goldberg 1980b | No control group |
| Goldberg 1984 | Review |
| Golper 1984 | Not a RCT |
| Gonzales 1993 | Randomised to exercise or to lovastatin |
| Gonzales 1996 | Randomised to exercise or to lovastatin |
| Goodman 2004 | No exercise intervention |
| Gordon 2005 | Not a RCT |
| Gordon 2009 | Not a RCT |
| Grant 2004 | Not a RCT |
| Green 1979 | Not a RCT |
| Greinert 1986 | Review |
| Guarnieri 2005 | Review |
| Gültekin 2003 | Not a RCT |
| Habedank 2009 | No exercise intervention |
| Haber 1988 | No control group |
| Hagberg 1983 | Not a RCT |
| Haouzi 1994 | Not a RCT |
| Hase 1983 | No exercise intervention |
| Hauser 1995 | No control group |
| Headley 2002 | Not a RCT |
| Headley 2008 | Study of acute response to exercise |
| Hebbar 2000 | No control group |
| Heiwe 2001a | Not a RCT |
| Heiwe 2005 | Not a RCT |
| Hensel 1973 | Study of acute response to physical exercise |
| Henson 2010 | Not a RCT |
| Hiramatsu 2003 | Not a RCT |
| Hollis 2005 | No control group |
| Horber 1985 | Not a RCT |
| Hori 1992 | Review |
| Huber 1985 | Study of acute response to physical exercise |
| Hughes 1986 | Wrong population (healthy subjects) |
| Hung 2002 | No exercise intervention. |
| Hung 2003 | Not a RCT |
| Iborra 2000 | No exercise intervention |
| Itoh 1992 | No exercise intervention |
| Jang 2009 | Not a RCT |
| Jassal 1998 | Not a RCT |
| Jassal 2002 | No exercise intervention |
| Jette 1977 | Not a RCT |
| Jindal 2004 | Review |
| Johansen 1999 | Review |
| Johansen 2000 | No exercise intervention |
| Johansen 2003a | No exercise intervention |
| Johansen 2003b | No exercise intervention |
| Johansen 2005a | Review |
| Johansen 2005b | No exercise intervention |
| Johansen 2007 | Review |
| Johansen 2008 | Review |
| Johansen 2010 | Review |
| Johnstone 2002 | Not a RCT |
| Juskowa 2006 | Only 4‐5 weeks exercise intervention |
| Kalevrosoglou 1999 | No control group |
| Kalogerakou 2006 | Not a RCT |
| Karamouzi 2002 | Not a RCT |
| Karamouzis 2009 | Not a RCT |
| Karmiel 1996 | No control group |
| Karmiel 1999 | No exercise intervention |
| Kempeneers 1988 | No control group |
| Kempeneers 1990a | Not a RCT |
| Kerby 2007 | Not a RCT |
| Kern 2009 | Wrong outcome measures |
| Kesi 2010 | Study of acute response to single bout of exercise |
| Kettner 1982 | Review |
| Kettner 1984a | Study of acute response to physical exercise |
| Kettner 1984b | Study of acute response to physical exercise |
| Kielstein 1995 | No control group |
| Kim 1991 | Not a RCT |
| Kirkpatrick 1990 | Review |
| Kiss 2005 | Review |
| Kjaer 1995 | Study of acute response to physical exercise |
| Kjaer 1999 | Review |
| Klang 1997 | No exercise intervention |
| Knap 2005 | Review |
| Kocak 2003 | No control group |
| Kolewaski 2005 | Not a RCT |
| Kong 1999a | Not a RCT |
| Kong 1999b | Not a RCT |
| Kontos 2007 | Not a RCT |
| Kopple 2003 | No control group |
| Kopple 2005 | Review |
| Kopple 2007b | Wrong outcome measures |
| Kosmadakis 2007 | Editorial |
| Kosmadakis 2010 | Review |
| Koufaki 2002b | They have an exercise intervention, but only a healthy control group and no CKD control group. |
| Kouidi 1998b | No control group |
| Kouidi 1999 | Not a RCT |
| Kouidi 2000 | Has two exercise intervention groups but no control group |
| Kouidi 2001 | Review |
| Kouidi 2002c | Not a RCT |
| Kouidi 2002d | Editorial review |
| Kouidi 2003b | Not a RCT |
| Kouidi 2004b | RCT with no control group |
| Kouidi 2004c | Review |
| Kramer 2006 | Review |
| Krause 1990 | No control group |
| Krause 1993a | No control group |
| Krause 1993b | Review |
| Krause 1993c | Not a RCT |
| Krause 1994 | No exercise intervention |
| Krause 2003a | No exercise intervention |
| Krause 2003b | No control group |
| Krause 2004a | No exercise intervention |
| Krause 2004b | Not a RCT |
| Krause 2004c | No control group |
| Kuge 2005 | Wrong population (healthy control group) |
| Kutner 1982 | No exercise intervention |
| Kutner 1992 | No exercise intervention |
| Kutner 1994 | No exercise intervention |
| Kutner 1997 | Review |
| Kutner 2000 | No exercise intervention |
| Kutner 2007 | Review |
| Kutsuna 2010 | No exercise intervention |
| Latos 1987 | Study of acute response to physical exercise training |
| Laville 1995 | Review |
| Leaf 2003a | Wrong type of outcome: the effect of a formal exercise program on the size of native veins. |
| Leaf 2003b | No control group |
| Leaf 2004 | Not a RCT |
| Lee 2005 | Not a RCT |
| Leikis 2004 | No exercise intervention |
| Lennon 1986 | No control group |
| Lens 1989 | No control group |
| Leung 1999 | Not a RCT |
| Leung 2000 | Not a RCT |
| Leung 2003 | Review |
| Leung 2004 | Study of acute response to physical exercise |
| Levendoglu 2004 | Not a RCT |
| Ling 2003 | No control group |
| Lisy 1981 | Not a RCT |
| Lo 1998 | Not a RCT |
| Lopez 1990 | No exercise intervention |
| LORD Study 2009 | No exercise intervention |
| Low 2004 | No exercise intervention |
| Lundin 1987 | Study of acute response to physical exercise |
| Lundin 1991 | No exercise intervention |
| MacDonald 2004 | Not a RCT |
| MacDonald 2005 | Not a RCT |
| Macdonald 2009 | Review |
| MacDougal 1998 | No exercise intervention |
| MacLaughlin 2010 | Not a RCT |
| Majchrzak 2008 | No exercise intervention |
| Malagoni 2008 | Not a RCT |
| Mancuso 2002 | Not a RCT |
| Manfredini 2009 | Not a RCT |
| Mao 2002 | Not a RCT |
| Marlowe 2001 | Review |
| Martin 2003 | No exercise intervention |
| Matsuoka 1991 | No exercise intervention |
| Mercer 2002 | Not a RCT |
| Mercer 2003 | No control group |
| Mercer 2004 | Review |
| Miller 1987 | No control group |
| Miller 2002 | Not a RCT |
| Mishkin 1998 | No control group |
| Miskulin 1999 | Not a RCT |
| Miyamura 2000 | Review |
| Moinuddin 2008 | Review |
| Momen 2005 | Study of acute response to physical exercise |
| Moore 1990 | Not a RCT |
| Moore 1993 | Not a RCT |
| Moore 1998 | No control group |
| Morales 2002 | No exercise intervention |
| Moran 1984 | No CKD control group |
| Moros 1993 | No exercise intervention |
| Moros 1995 | No control group |
| Moug 2004 | RCT, duration of exercise training intervention was only 6 weeks |
| Mustata 2004 | No control group |
| Mustata 2005 | No control group |
| Mustata 2007 | Not a RCT |
| Naish 2001 | No exercise intervention |
| Navaneethan 2009 | Review |
| Noakes 1993 | Not a RCT |
| Noviana 2004 | Not a RCT |
| Nowicki 2006 | Not a RCT |
| Nyberg 1995 | No exercise intervention |
| Oberley 1994 | No exercise intervention |
| Oberley 1996 | Review |
| Oberley 2000 | Review |
| Oder 2003 | Not a RCT |
| Oh‐Park 2002 | No control group |
| O´Hare 2003 | Not an RCT |
| O´Moore 1999 | No exercise intervention |
| Painter 1983 | Review |
| Painter 1985 | Not a RCT |
| Painter 1986a | No exercise intervention |
| Painter 1986b | Not a RCT |
| Painter 1986c | Study of acute response to physical exercise |
| Painter 1986d | Review |
| Painter 1987 | Wrong type of outcome: have studied compliance to physical exercise training |
| Painter 1988a | Wrong type of outcome: this report describes average exercise participation rates |
| Painter 1988b | Review |
| Painter 1994a | Review |
| Painter 1994b | Review |
| Painter 1994c | Case study |
| Painter 1994d | No exercise intervention |
| Painter 1995 | Review |
| Painter 1997 | Not a RCT |
| Painter 1998 | No exercise intervention |
| Painter 1999a | Review |
| Painter 1999b | Review |
| Painter 1999c | Review |
| Painter 1999d | Review |
| Painter 1999e | Not a RCT |
| Painter 1999f | Not a RCT |
| Painter 2000a | Not a RCT |
| Painter 2000b | Not a RCT |
| Painter 2005 | Review |
| Painter 2006 | Not a RCT |
| Painter 2008 | Review |
| Painter 2009 | Book |
| Pardell 2005 | No CKD patients |
| Park 2008 | Study of acute response to single bout exercise |
| Parrish 1981 | Study of acute response to physical exercise |
| Payne 1972 | Study of acute response to physical exercise |
| Pechter 2003a | Not a RCT |
| Pechter 2003b | Not a RCT |
| Pedersen 1986 | Study of acute response to physical exercise |
| Pennell 2004 | No control group |
| Pewen 1990 | No control group |
| Phanish 2003 | Not a RCT |
| Pianta 1999a | Review |
| Pianta 1999b | No control group |
| Plentz 2003 | No control group |
| Poortmans 1997 | Study of acute response to physical exercise |
| Poortmans 1998 | Review |
| Price 1996 | No control group |
| Pugh‐Clarke 2002 | Not a RCT |
| Pupim 2004 | Study of acute response to physical exercise |
| Qing 1999 | No control group |
| Rehacek 1979 | No control group |
| Richard 2005 | No exercise intervention |
| Richardson 1999a | RCT, exercise intervention period is < 8 weeks |
| Richardson 1999b | Not a RCT |
| Ridley 1999 | Not a RCT |
| Rieu 1996 | Not a RCT |
| Rodicio 2001 | No exercise intervention |
| Ronco 1995 | Wrong type of outcome measures |
| Rosales 1998 | No control group |
| Ross 1989 | No control group |
| Rus 2003 | No control group |
| Rössler 1979 | No control group |
| Sabry 2009 | No exercise intervention |
| Sacksteder 2001 | Not a RCT |
| Sadler 1998 | No exercise intervention |
| Sagiv 1988 | No exercise intervention |
| Saitoh 2007 | Not a RCT |
| Sakkas 2003a | No control group |
| Sakkas 2008 | Not a RCT |
| Sam 1992 | RCT, physical exercise training versus physical exercise training plus EPO‐treatment, no control group for exercise training |
| Sam 1993 | Not a RCT |
| Schatell 1999 | No exercise intervention |
| Schrag 1999 | No exercise intervention |
| Segura‐Orti 2008 | Not a RCT |
| Segura‐Orti 2010 | Review |
| Shalom 1984 | No control group |
| Sharif 2008 | No exercise intervention |
| Shield 2002 | No exercise intervention |
| Sietsema 2004 | No exercise intervention |
| Smith 1981 | Not a RCT |
| Smith 2006 | Not a RCT |
| Smye 1998 | A theoretical model |
| Snyder 1989 | No control group |
| Soffritti 2006 | Not a RCT |
| Solomon 1999 | No exercise intervention |
| Sorensen 1986 | Study of acute response to physical exercise |
| Squires 1985 | No control group |
| Stanley 1989 | No exercise intervention |
| Starky 2005 | No exercise intervention |
| Stefanovic 2005 | Review |
| Stenvinkel 2000 | No exercise intervention |
| Stephens 1991 | Not a RCT |
| Sternweiler 1970 | No exercise intervention |
| Stewart 1981 | Review |
| Stewart 1999 | Not a RCT |
| Stivers 1996 | No control group |
| Storer 1999 | No control group |
| Storer 2005 | Not a RCT |
| Straub 2008 | Not a RCT |
| Suh 2002 | No control group |
| Surgit 2001 | No control group |
| Svarstad 2002 | Study of acute response to physical exercise |
| Svoboda 2004 | Not a RCT |
| Södergård 1991 | Not a RCT |
| Tang 1999 | No control group |
| Tawney 2000 | No exercise intervention |
| Tawney 2003 | Review |
| Tentori 2008 | Not a RCT |
| Tobita 2009 | Tests a support programme and not an exercise intervention |
| Triolo 1989 | Not a RCT |
| Triolo 1991 | RCT, physical exercise training in combination with a specific diet (group A) versus a different type of diet and no exercise training (group B). |
| Tsai 1995 | Not a RCT |
| Tsay 2005 | No exercise intervention |
| Tykarski 2003 | No exercise intervention |
| Tzamaloukas 2003 | Not a RCT |
| Vaithilingam 2004 | RCT, wrong outcome measure |
| van den Ham 2001 | Not a RCT |
| van den Ham 2005 | No exercise intervention |
| van den Ham 2006 | Not a RCT |
| van den Ham 2007 | No CKD control group |
| van Zuilen 2005 | No exercise intervention |
| Violan 2001 | No control group |
| Violan 2002 | No control group |
| Vlcek 1990 | Study of acute response to physical exercise training |
| Wagner 2001 | Study of acute response to physical exercise training |
| Weinberg 1988 | Case report |
| Weissgarten 1998 | Animal study |
| Wellard 2003 | No exercise intervention |
| Wenger 1998 | Review |
| Wiberg 2003 | No control group |
| Williams 1991 | Study of factors affecting compliance to physical exercise training, and not effects of physical exercise training. |
| Winchester 2003 | Editorial comment |
| Wolfe 1985 | Not a RCT |
| Worel 1985 | Not a RCT |
| Yamaka 1984 | No control group |
| Yoshida 2003 | Animal study |
| Young 1993 | No exercise intervention |
| Zabetakis 1982 | Not a RCT |
| Zaluska 2002a | No control group |
| Zaluska 2002b | No control group |
| Zamojska 2005 | No exercise intervention |
| Zeier 2001 | No exercise training intervention |
| Zinna 2003 | Review |
Contributions of authors
Susanne Heiwe: designed the systematic review and meta‐analysis study, co‐ordinated the review process, searched for studies, screened the search results, assessed the studies for quality, extracted data, analysed data, developed the systematic review and meta‐analysis, and has had the primary role in writing the manuscript
Stefan H Jacobson: screened search results, assessed the quality of studies, extracted data, and reviewed the final manuscript.
Sources of support
Internal sources
No sources of support supplied
External sources
-
The Centre for Health Care Science, Karolinska Institutet, Sweden.
Part funding from a research grant
Declarations of interest
None known.
New
References
References to studies included in this review
Akiba 1995 {published data only}
- Akiba T, Matsui N, Marumo F. Erythropoietin can partially increase, but can not maintain exercise capacity without exercise training [abstract]. XIIth International Congress of Nephrology; 1993 June 13‐18; Jerusalem, Israel. 1993:298.
- Akiba T, Matsui N, Shinohara S, Fujiwara H, Nomura T, Marumo F. Effects of recombinant human erythropoietin and exercise training on exercise capacity in hemodialysis patients. Artificial Organs 1995;19(12):1262‐8. [MEDLINE: ] [DOI] [PubMed] [Google Scholar]
Carmack 1995 {published data only}
- Carmack CL, Amaral‐Melendez M, Boudreaux E, Brantley PJ, Franks JD, Jones GN, et al. Exercise as a component in the physical and psychological rehabilitation of hemodialysis patients. International Journal of Rehabilitation & Health 1995;1(1):13‐23. [CINAHL 2010258777] [Google Scholar]
Carney 1987 {published data only}
- Carney RM, Templeton B, Hong BA, Harter HR, Hagberg JM, Schechtman KB, et al. Exercise training reduces depression and increases the performance of pleasant activities in hemodialysis patients. Nephron 1987;47(3):194‐8. [MEDLINE: ] [DOI] [PubMed] [Google Scholar]
Castaneda 2001 {published data only}
- Castaneda C, Gordon PL, Uhlin KL, Kehayias JJ, Levey AS, Dwyer JT, et al. A randomized trial of resistance exercise training to improve nutritional status in chronic renal insufficiency [abstract]. Journal of the American Society of Nephrology 1999;10(Program & Abstracts):155A. [Google Scholar]
- Castaneda C, Gordon PL, Uhlin KL, Levey AS, Kehayias JJ, Dwyer JT, et al. Resistance training to counteract the catabolism of a low‐protein diet in patients with chronic renal insufficiency. A randomized, controlled trial. Annals of Internal Medicine 2001;135(11):965‐76. [MEDLINE: ] [DOI] [PubMed] [Google Scholar]
- Castaneda C, Gordson PL, Parker RC, Uhlin KL, Roubenoff R, Levey AS. Resistance training to reduce the malnutrition‐inflammation complex syndrome of chronic kidney disease. American Journal of Kidney Diseases 2004;43(4):607‐16. [MEDLINE: ] [DOI] [PubMed] [Google Scholar]
Chatoth 2005 {unpublished data only}
- Chatoth D. Resistance training and diet in patients with chronic renal failure. http://www.clinicaltrials.gov/ct2/show/NCT00018317 (accessed March 2011).
Chen 2010 {published data only}
- Chen JL, Godfrey S, Ng TT, Moorthi R, Liangos O, Ruthazer R, et al. Effect of intra‐dialytic, low‐intensity strength training on functional capacity in adult haemodialysis patients: a randomized pilot trial. Nephrology Dialysis Transplantation 2010;25(6):1936‐43. [MEDLINE: ] [DOI] [PMC free article] [PubMed] [Google Scholar]
Deligiannis 1999 {published data only}
- Deligiannis A, Kouidi E, Tourkantonis A. Effects of physical training on heart rate variability in patients on hemodialysis. American Journal of Cardiology 1999;84(2):197‐202. [MEDLINE: ] [DOI] [PubMed] [Google Scholar]
Deligiannis‐HI 1999 {published data only}
- Deligiannis A, Kouidi E, Tassoulas E, Gigis P, Tourkantonis A, Coats A. Cardiac effects of exercise rehabilitation in hemodialysis patients. International Journal of Cardiology 1999;70(3):253‐66. [MEDLINE: ] [DOI] [PubMed] [Google Scholar]
- Deligiannis A, Kouidi E, Vassiliou S, Tourkantonis A. The effects of exercise training on the autonomic control of heart rate in hemodialysis patients [abstract]. Nephrology Dialysis Transplantation 1996;11(6):A175. [Google Scholar]
Deligiannis‐LI 1999 {published data only}
- Deligiannis A, Kouidi E, Tassoulas E, Gigis P, Tourkantonis A, Coats A. Cardiac effects of exercise rehabilitation in hemodialysis patients. International Journal of Cardiology 1999;70(3):253‐66. [MEDLINE: ] [DOI] [PubMed] [Google Scholar]
- Deligiannis A, Kouidi E, Vassiliou S, Tourkantonis A. The effects of exercise training on the autonomic control of heart rate in hemodialysis patients [abstract]. Nephrology Dialysis Transplantation 1996;11(6):A175. [Google Scholar]
DePaul 2002 {published data only}
- DePaul V, Moreland J, Eager T, Clase CM. The effectiveness of aerobic and muscle strength training in patients receiving hemodialysis and EPO: a randomized controlled trial. American Journal of Kidney Diseases 2002;40(6):1219‐29. [MEDLINE: ] [DOI] [PubMed] [Google Scholar]
Dimeo 2007 {published data only}
- Dimeo FC, Wencke M, Krist L, Westhoff TH, Rothermund L. Effects of a stamina training programme over 8 weeks in patients after kidney transplantation. Deutsche Zeitschrift fur Sportmedizin 2007;58(7/8):204. [Google Scholar]
Eidemak 1997 {published data only}
- Eidemak I, Haaber AB, Feldt‐Rasmussen B, Kanstrup IL, Strandgaard S. Exercise training and the progression of chronic renal failure. Nephron 1997;75(1):36‐40. [MEDLINE: ] [DOI] [PubMed] [Google Scholar]
Fitts 1995 {published data only}
- Fitts SS, Guthrie MR. Six‐minute walk by people with chronic renal failure. Assessment of effort by perceived exertion. American Journal of Physical Medicine & Rehabilitation 1995;74:54‐58. [MEDLINE: ] [DOI] [PubMed] [Google Scholar]
Fitts 1999 {published data only}
- Fitts SS, Guthrie MR, Blagg CR. Exercise coaching and rehabilitation counseling improve quality of life for predialysis and dialysis patients. Nephron 1999;82(2):115‐21. [MEDLINE: ] [DOI] [PubMed] [Google Scholar]
- Fitts SS, Guthrie MR, Blagg CR. Rehabilitation should parallel the course of the disease: counselling & exercise coaching for patients [abstract]. Journal of the American Society of Nephrology 1996;7(9):1386. [Google Scholar]
Frey 1999 {published data only}
- Frey S, Mir AR, Lucas M. Visceral protein status and caloric intake in exercising versus nonexercising individuals with end‐stage renal disease. Journal of Renal Nutrition 1999;9(2):71‐7. [MEDLINE: ] [DOI] [PubMed] [Google Scholar]
Goldberg 1983 {published data only}
- Goldberg AP, Geltman EM, Hagberg JM, Gavin JR III, Delmez JA, Carney RM, et al. Therapeutic benefits of exercise training for hemodialysis patients. Kidney International 1983;Suppl 16:S303‐9. [MEDLINE: ] [PubMed] [Google Scholar]
Harter 1985 {published data only}
- Goldberg AP, Geltman EM, Gavin JR III, Carney RM, Hagberg JM, Delmez JA, et al. Exercise training reduces coronary risk and effectively rehabilitates hemodialysis patients. Nephron 1986;42(4):311‐6. [MEDLINE: ] [DOI] [PubMed] [Google Scholar]
- Harter HR, Goldberg AP. Endurance exercise training. An effective therapeutic modality for hemodialysis patients. Medical Clinics of North America 1985;69(1):159‐75. [MEDLINE: ] [DOI] [PubMed] [Google Scholar]
Johansen 2006 {published data only}
- Johansen KL, Painter PL, Gordon P, Doyle J, Sakkas GK. Effects of resistance exercise training and anabolic steroid treatment among hemodialysis patients: results of the NEXT study [abstract]. Journal of the American Society of Nephrology 2004;15(Oct):617A. [Google Scholar]
- Johansen KL, Painter PL, Sakkas GK, Gordon P, Doyle J, Shubert T. Effects of resistance exercise training and nandrolone decanoate on body composition and muscle function among patients who receive hemodialysis: A randomized, controlled trial. Journal of the American Society of Nephrology 2006;17(8):2307‐14. [MEDLINE: ] [DOI] [PubMed] [Google Scholar]
Jong 2004 {published data only}
- Jong KH, Jeong LS, Hyun YT, Suk PY, Young JM, Eun AS, et al. Effects of walking exercise for health status in patients on continuous ambulatory peritoneal dialysis [abstract]. 41st Congress. European Renal Association European Dialysis and Transplantation Association; 2004 May 15‐18; Lisbon, Portugal. 2004:188.
Koh 2010a {published data only}
- Koh KP, Fassett RG, Sharman JE, Coombes JS, Williams AD. Effect of intradialytic versus home‐based aerobic exercise training on physical function and vascular parameters in hemodialysis patients: a randomized pilot study. American Journal of Kidney Diseases 2010;55(1):88‐99. [MEDLINE: ] [DOI] [PubMed] [Google Scholar]
- Koh KP, Fassett RG, Sharman JE, Coombes JS, Williams AD. Intradialytic versus home‐based exercise training in hemodialysis patients: a randomised controlled trial. BMC Nephrology 2009;10:2. [MEDLINE: ] [DOI] [PMC free article] [PubMed] [Google Scholar]
Koh 2010b {published data only}
- Koh KP, Fassett RG, Sharman JE, Coombes JS, Williams AD. Effect of intradialytic versus home‐based aerobic exercise training on physical function and vascular parameters in hemodialysis patients: a randomized pilot study. American Journal of Kidney Diseases 2010;55(1):88‐99. [MEDLINE: ] [DOI] [PubMed] [Google Scholar]
- Koh KP, Fassett RG, Sharman JE, Coombes JS, Williams AD. Intradialytic versus home‐based exercise training in hemodialysis patients: a randomised controlled trial. BMC Nephrology 2009;10:2. [MEDLINE: ] [DOI] [PMC free article] [PubMed] [Google Scholar]
Konstantinidou‐D 2002 {published data only}
- Konstantinidou E, Koukouvou G, Kouidi E, Deligiannis A, Tourkantonis A. Exercise training in patients with end‐stage renal disease on hemodialysis: comparison of three rehabilitation programs. Journal of Rehabilitation Medicine 2002;34(1):40‐5. [MEDLINE: ] [DOI] [PubMed] [Google Scholar]
Konstantinidou‐ND 2002 {published data only}
- Konstantinidou E, Koukouvou G, Kouidi E, Deligiannis A, Tourkantonis A. Exercise training in patients with end‐stage renal disease on hemodialysis: comparison of three rehabilitation programs. Journal of Rehabilitation Medicine 2002;34(1):40‐5. [MEDLINE: ] [DOI] [PubMed] [Google Scholar]
Konstantinidou‐US 2002 {published data only}
- Konstantinidou E, Koukouvou G, Kouidi E, Deligiannis A, Tourkantonis A. Exercise training in patients with end‐stage renal disease on hemodialysis: comparison of three rehabilitation programs. Journal of Rehabilitation Medicine 2002;34(1):40‐5. [MEDLINE: ] [DOI] [PubMed] [Google Scholar]
Kopple 2007a {published data only}
- Kopple JD, Wang H, Casaburi R, Fournier M, Lewis MI, Taylor W, et al. Exercise in maintenance hemodialysis patients induces transcriptional changes in genes favoring anabolic muscle. Journal of the American Society of Nephrology 2007;18(11):2975‐86. [MEDLINE: ] [DOI] [PubMed] [Google Scholar]
Koufaki 2002a {published data only}
- Koufaki P, Mercer TH, Naish PF. Effects of exercise training on aerobic and functional capacity of end‐stage renal disease patients. Clinical Physiology & Functional Imaging 2002;22(2):115‐24. [MEDLINE: ] [DOI] [PubMed] [Google Scholar]
Koufaki 2003 {published data only}
- Koufaki P, Naish P, Mercer T. Exercise training augments EPO‐induced changes in exercise tolerance and functional capacity of dialysis patients [abstract]. Nephrology Dialysis Transplantation 2003;18(Suppl 4):157. [Google Scholar]
Kouidi 1997a {published data only}
- Kouidi E, Iacovides A, Iordanidis P, Vassiliou S, Deligiannis A, Ierodiakonou C, et al. Exercise renal rehabilitation program: psychosocial effects. Nephron 1997;77(2):152‐58. [MEDLINE: ] [DOI] [PubMed] [Google Scholar]
- Kouidi E, Iacovides A, Iordinides P, Vassiliou S, Deligiannis A, Ierodiakonou C, et al. Exercise renal rehabilitation program (ERRP): psychosocial effects [abstract]. Nephrology Dialysis Transplantation 1995;10(6):1015. [Google Scholar]
Kouidi 2002a {published data only}
- Kouidi E, Grekas D, Dombros N, Deligiannis A, Tourkantonis A. Exercise training after renal transplantation: cardiac autonomic effects [abstract M474]. ERA‐EDTA Congress. 2002.
Kouidi 2002b {published data only}
Kouidi 2003a {published data only}
- Kouidi E, Grekas D, Koukouvou G, Konstantinidou E, Kalevrosoglou J, Deligiannis A. The effects of exercise training on variables predisposing dialysis patients to cardiac death [abstract]. Nephroloigy Dialysis Transplantation 2003;18(Suppl 4):724. [Google Scholar]
Kouidi 2004a {published data only}
- Kouidi E, Konstantinidou E, Kalevrosoglou j, Grekas D, Deligiannis A. Cardiac systolic and dialstolic function in aging dialysis patients following exercise training. 41st Congress. European Renal Association. European Dialysis and Transplantation Association; 2004 May 15‐18; Lisbon, Portugal. 2004:354.
Kouidi 2005 {published data only}
- Kouidi E, Grekas DM, Ouzouni SG, Iacovides AI, Deligiannis AP. Psychosocial effects of exercise training during dialysis in uraemic patients under epoietin therapy [abstract MP338]. ERA‐EDTA Congress. 2005.
Kouidi 2009 {published data only}
- Kouidi E, Sioulis A, Koukouvou G, Konstantinidou E, Grekas D, Deligiannis A. The effects of exercise training on non‐invasive variables for cardiac risk stratification in hemodialysis patients [abstract SP662]. ERA‐EDTA Congress. 2006.
- Kouidi EJ, Grekas DM, Deligiannis AP. Effects of exercise training on noninvasive cardiac measures in patients undergoing long‐term hemodialysis: a randomized controlled trial. American Journal of Kidney Diseases 2009;54(3):511‐21. [MEDLINE: ] [DOI] [PubMed] [Google Scholar]
- Petraki M, Kouidi E, Grekas D, Deligiannis A. Effects of exercise training during hemodialysis on cardiac baroreflex sensitivity. Clinical Nephrology 2008;70(3):210‐9. [MEDLINE: ] [DOI] [PubMed] [Google Scholar]
Lee 2001 {published data only}
- Lee YK, Kim C, Pyo JH, Kim CH, Ji JW. Endurance exercise training before hemodialysis: an effective therapeutic modality for end‐stage renal disease patients. Korean Journal of Nephrology 2001;20(2):290‐97. [Google Scholar]
Leehey 2009 {published data only}
- Bast J, Qureshi S, Moinuddin I, Collins E, Jelinek C, Cooper C, et al. A randomized controlled trial of aerobic exercise in obese diabetic patients with chronic kidney disease [abstract]. Journal of the American Society of Nephrology 2008;90:960A. [Google Scholar]
- Leehey DJ, Moinuddin I, Bast JP, Qureshi S, Jelinek CS, Cooper C, et al. Aerobic exercise in obese diabetic patients with chronic kidney disease: a randomized and controlled pilot study. Cardiovascular Diabetology 2009;8:62. [MEDLINE: ] [DOI] [PMC free article] [PubMed] [Google Scholar]
Matsumoto 2007 {published data only}
- Matsumoto Y, Furuta A, Furuta S, Miyajima M, Sugino T, Nagata K, et al. The impact of pre‐dialytic endurance training on nutritional status and quality of life in stable hemodialysis patients (Sawada study). Renal Failure 2007;29(5):587‐93. [MEDLINE: ] [DOI] [PubMed] [Google Scholar]
Molsted 2004 {published data only}
- Molsted S, Eidemak I, Sorensen HT, Kristensen JH. Five months of physical exercise in hemodialysis patients: effects on aerobic capacity, physical function and self‐rated health. Nephron 2004;96(3):c76‐81. [MEDLINE: ] [DOI] [PubMed] [Google Scholar]
Ouzouni 2009 {published data only}
- Ouzouni S, Kouidi E, Sioulis A, Grekas D, Deligiannis A. Effects of intradialytic exercise training on health‐related quality of life indices in haemodialysis patients. Clinical Rehabilitation 2009;23(1):53‐63. [MEDLINE: ] [DOI] [PubMed] [Google Scholar]
Painter 2002a {published data only}
- Painter P, Stewart A, Hector L, Ray K, Dibble S, Tomlanovich S. Exercise increases self‐reported physical functioning in kidney transplant recipients [abstract]. Medicine & Science in Sports & Exercise 1997;29(5 Suppl):S207. [Google Scholar]
- Painter P, Tomlanovich SL, Hector L, Ray K, Ascher NL. Exercise (EX) training alone does not change cardiovascular (CV) risk profile following renal transplant (RTX) [abstract]. Journal of the American Society of Nephrology. 2001;12:911A. [Google Scholar]
- Painter PL, Hector L, Ray K, Lynes L, Dibble S, Paul SM, et al. A randomized trial of exercise training after renal transplantation. Transplantation 2002;74(1):42‐8. [MEDLINE: ] [DOI] [PubMed] [Google Scholar]
Painter 2002b {published data only}
- Painter P, Moore G, Carlson L, Paul S, Myll J, Phillips W, et al. Effects of exercise training plus normalization of hematocrit on exercise capacity and health‐related quality of life. American Journal of Kidney Diseases 2002;39(2):257‐65. [MEDLINE: ] [DOI] [PubMed] [Google Scholar]
Painter 2003 {published data only}
- Painter P, Hector L, Ray K, Lynes L, Paul SM, Dodd M, et al. Effects of exercise training on coronary heart disease risk factors in renal transplant recipients. American Journal of Kidney Diseases 2003;42(2):362‐69. [MEDLINE: ] [DOI] [PubMed] [Google Scholar]
Parsons 2004 {published data only}
- Parsons TL, Toffelmire EB, King‐VanVlack CE. The effect of an exercise program during hemodialysis on dialysis efficacy, blood pressure and quality of life in end‐stage renal disease (ESRD) patients. Clinical Nephrology 2004;61(4):261‐74. [MEDLINE: ] [DOI] [PubMed] [Google Scholar]
PEAK Study 2005 {published data only}
- Cheema B, Abas H, Smith B, O'Sullivan A, Chan M, Patwardhan A, et al. Progressive exercise for anabolism in kidney disease (PEAK): a randomized, controlled trial of resistance training during hemodialysis. Journal of the American Society of Nephrology 2007;18(5):1594‐601. [MEDLINE: ] [DOI] [PubMed] [Google Scholar]
- Cheema B, Abas H, Smith B, O'Sullivan A, Chan M, Patwardhan A, et al. Randomized controlled trial of intradialytic resistance training to target muscle wasting in ESRD: the Progressive Exercise for Anabolism in Kidney Disease (PEAK) study. American Journal of Kidney Diseases 2007;50(4):544‐84. [MEDLINE: ] [DOI] [PubMed] [Google Scholar]
- Cheema B, Sullivan A, Chan M, et al. A randomized controlled trial of progressive resistance training during maintenance hemodialysis treatment: The PEAK Study [abstract]. Journal of Aging and Physical Activity 2004;12(3):260. [Google Scholar]
- Smith BC, Cheema BS, O'Sullivan AJ, Pang G, Lloyd BD, Patwardhan A, et al. Resistance training during hemodialysis reduces C‐reactive protein. Results from a randomized controlled trial of progressive exercise for anabolism in kidney disease (the PEAK Study) [abstract]. Journal of the American Geriatrics Society 2005;53(Suppl 1):13‐4. [Google Scholar]
Segura‐Orti 2009 {published data only}
- Segura‐Orti E, Kouidi E, Lison JF. Effect of resistance exercise during hemodialysis on physical function and quality of life: randomized controlled trial. Clinical Nephrology 2009;71(5):527‐37. [MEDLINE: ] [DOI] [PubMed] [Google Scholar]
Toussaint 2008 {published data only}
- Toussaint ND, Polkinghorne KR, Kerr PG. Impact of intradialytic exercise on arterial compliance and B‐type natriuretic peptide levels in hemodialysis patients. Hemodialysis International 2008;12(2):254‐63. [MEDLINE: ] [DOI] [PubMed] [Google Scholar]
Tsuyuki 2003 {published data only}
- Tsuyuki K, Kimura Y, Chiashi K, Matsushita C, Ninomiya K, Choh K, et al. Oxygen uptake efficiency slope as monitoring tool for physical training in chronic hemodialysis patients. Therapeutic Apheresis & Dialysis 2003;7(4):461‐7. [MEDLINE: ] [DOI] [PubMed] [Google Scholar]
van Vilsteren 2005 {published data only}
- Vilsteren MC, Greef MH, Huisman RM. The effects of a low‐to‐moderate intensity pre‐conditioning exercise programme linked with exercise counselling for sedentary haemodialysis patients in The Netherlands: results of a randomized clinical trial. Nephrology Dialysis Transplantation 2005;20(1):141‐6. [MEDLINE: ] [DOI] [PubMed] [Google Scholar]
Yurtkuran 2007 {published data only}
- Yurtkuran M, Alp A, Yurtkuran M, Dilek K. A modified yoga‐based exercise program in hemodialysis patients: a randomized controlled study. Complementary Therapies in Medicine 2007;15(3):164‐71. [MEDLINE: ] [DOI] [PubMed] [Google Scholar]
References to studies excluded from this review
Adams 2006 {published data only}
- Adams GR, Vaziri ND. Skeletal muscle dysfunction in chronic renal failure: effects of exercise. American Journal of Physiology ‐ Renal Physiology 2006;290(4):F753‐61. [MEDLINE: ] [DOI] [PubMed] [Google Scholar]
Adorati 2000 {published data only}
- Adorati M. The effect of intradialytic exercise on solute removal. Nephrology Dialysis Transplantation 2000;15(8):1264. [MEDLINE: ] [DOI] [PubMed] [Google Scholar]
Ahn 2000 {published data only}
- Ahn JH. The effect of the self efficacy promotion and exercise training program of kidney transplant recipients. Journal of Korean Academy of Nursing 2000;30(5):1181‐94. [Google Scholar]
- Ahn JH. The effect of the self efficacy promotion and exercise training program on anxiety, depression and quality of life of kidney transplant recipients. Journal of Korean Academy of Adult Nursing 2001;13(2):223‐32. [Google Scholar]
- Ahn JH, Kim NC. The effects of the self efficacy promotion and exercise program on the weight, body fat rate, exercise time and cardiopulmonary function of kidney transplant recipients. Journal of Korean Academy of Adult Nursing 2000;12(3):452‐62. [Google Scholar]
Ahn 2001 {published data only}
- Ahn JH, Ha HS, Hong JJ. The change of muscle strength, muscle endurance, flexibility and activities of daily living of the kidney transplant recipients. Journal of Korean Academy of Adult Nursing 2001;13(1):5‐14. [Google Scholar]
Amaral 1999 {published data only}
- Amaral‐Melendez M, McKnight GT, Franks BD, Domingue J, Reyes R. Physiological and psychological responses to submaximal exercise at different times in renal disease patients [abstract]. Medicine & Science in Sports & Exercise 1999;31(5 Suppl):S360. [Google Scholar]
Anderson 2001 {published data only}
- Anderson JE. Ambulatory and pre and post hemodialysis blood pressure is lower after 3 months of exercise therapy [abstract]. Journal of the American Society of Nephrology 2001;12:319A. [Google Scholar]
Anderson 2004 {published data only}
- Anderson JE, Boivin Jr MR, Hatchett L. Effect of exercise training on interdialytic ambulatory and treatment‐related blood pressure in hemodialysis patients. Renal Failure 2004;26(5):539‐44. [MEDLINE: ] [DOI] [PubMed] [Google Scholar]
Anonymous 1998 {published data only}
- Anonymous. Life options rehabilitation program endorses qualitative research to understand patient perspectives. Dialysis & Transplantation 1998;27(4):192. [EMBASE: 1998135858] [Google Scholar]
Anonymous 2001 {published data only}
- Anonymous. Summaries for patients: Weight‐training exercises to counteract the negative effects of low‐protein diets in people with kidney disease. Annals of Internal Medicine 2001;135(11):S‐60. [MEDLINE: ] [DOI] [PubMed] [Google Scholar]
Antonoff 1988 {published data only}
- Antonoff A, Boone JL, Lundin AP, Zabetakis PM, Zimmerman SW. Exercise and dialysis patients. Dialysis & Transplantation 1988;17(4):172‐74. [EMBASE: 1988111247] [Google Scholar]
Argani 2001 {published data only}
- Argani H, Firoozi F, Jabbari R. Exercise during dialysis increases efficacy of dialysis [abstract]. Nephrology Dialysis Transplantation 2001;16(6):A114. [Google Scholar]
Baiardi 2002 {published data only}
- Baiardi F, Esposti ED, Cocchi R, Fabbri A, Sturani A, Valpiani G, et al. Effects of clinical and individual variables on quality of life in chronic renal failure patients. Journal of Nephrology 2002;15(1):61‐7. [MEDLINE: ] [PubMed] [Google Scholar]
Bandel 1983 {published data only}
- Bandel‐Walcer R. Physical therapy and exercise: an under‐utilized patient service. Nephrol Nurse 1983;5(3):16‐20. [MEDLINE: ] [PubMed] [Google Scholar]
Banerjee 2004 {published data only}
- Banerjee A, Kong CH, Farrington K. The haemodynamic response to submaximal exercise during isovolaemic haemodialysis. Nephrology Dialysis Transplantation 2004;19(6):1528‐32. [MEDLINE: ] [DOI] [PubMed] [Google Scholar]
Bavikati 2008 {published data only}
- Bavikati VV, Sperling LS, Salmon RD, Faircloth GC, Gordon TL, Franklin BA, et al. Effect of comprehensive therapeutic lifestyle changes on prehypertension. American Journal of Cardiology 2008;102(12):1677‐80. [MEDLINE: ] [DOI] [PubMed] [Google Scholar]
Beddhu 2009 {published data only}
- Beddhu S, Baird BC, Zitterkoph J, Neilson J, Greene T. Physical activity and mortality in chronic kidney disease (NHANES III). Clinical Journal of the American Society of Nephrology: CJASN 2009;4(12):1901‐6. [MEDLINE: ] [DOI] [PMC free article] [PubMed] [Google Scholar]
Bernardi 2005 {published data only}
- Bernardi A, Biasia F, Pati T, Piva M, Scaramuzzo P, Stoppa F, et al. Factors affecting nutritional status, response to exercise, and progression of chronic rejection in kidney transplant recipients. Journal of Renal Nutrition 2005;15(1):54‐7. [MEDLINE: ] [DOI] [PubMed] [Google Scholar]
Beto 1998 {published data only}
- Beto JA, Bansal VK. Interventions for other risk factors: tobacco use, physical inactivity, menopause, and homocysteine. American Journal of Kidney Diseases 1998;32(5 Suppl 3):S172‐83. [MEDLINE: ] [DOI] [PubMed] [Google Scholar]
Biehl 1997 {published data only}
- Biehl AM, Graver V, Stenehjem A. Should patients with chronic renal kidney failure exercise? ‐ a pilot study. Fysioterapeuten 1997;74(6):8‐10. [Google Scholar]
Biolo 2005 {published data only}
- Biolo G, Ciocchi B, Stulle M, Piccoli A, Lorenzon S, Dal Mas V, et al. Metabolic consequences of physical inactivity. Journal of Renal Nutrition 2005;15(1):49‐53. [MEDLINE: ] [DOI] [PubMed] [Google Scholar]
Blagg 1994 {published data only}
- Blagg CR. The socioeconomic impact of rehabilitation. American Journal of Kidney Diseases 1994;24(1 Suppl 1):S17‐21. [MEDLINE: ] [PubMed] [Google Scholar]
Bolanos 1993 {published data only}
- Bolanos L, Mesa L, Vazquez C, Lavilla J, Errasti P. Physical exercise and chronic renal insufficiency [Ejercicio físico e insuficiencia renal crónica]. Revista de Medicina de la Universidad de Navarra 1993;38(1):38‐41. [MEDLINE: ] [PubMed] [Google Scholar]
Boone 1987 {published data only}
- Boone JL. Exercise and the hemodialysis patient. Dialysis & Transplantation 1987;16(5):243‐45. [EMBASE: 1987124322] [Google Scholar]
Borregaard 2003 {published data only}
- Borregaard S, Krause N, Rieckert H. Exercise training during hemodialysis [Bewegungstherapie während einer Dialyse. Eine experimentelle Studie zum Krfat‐ und Ausdauerverhalten und zur Lebensqualität]. Deutsche Zeitschrift für Sportmedizin 2003;54(12):347‐51. [Google Scholar]
Boyce 1997 {published data only}
- Boyce ML, Robergs RA, Avasthi PS, Roldan C, Foster A, Montner P, et al. Exercise training by individuals with predialysis renal failure: cardiorespiratory endurance, hypertension, and renal function. American Journal of Kidney Diseases 1997;30(2):180‐92. [MEDLINE: ] [DOI] [PubMed] [Google Scholar]
Brawner 1999 {published data only}
- Brawner CA, Hakim M, Schairer JR. End‐stage renal disease: case report from Henry Ford Hospital. Clinical Exercise Physiology 1999;1(1):13‐6. [Google Scholar]
Bronas 2009 {published data only}
- Bronas UG. Exercise training and reduction of cardiovascular disease risk factors in patients with chronic kidney disease. Advances in Chronic Kidney Disease 2009;16(6):449‐58. [MEDLINE: ] [DOI] [PubMed] [Google Scholar]
Brunier 1993 {published data only}
- Brunier GM, Graydon J. The influence of physical activity on fatigue in patients with ESRD on hemodialysis. Anna Journal 1993;20(4):457‐61. [MEDLINE: ] [PubMed] [Google Scholar]
Bullock 1984 {published data only}
- Bullock RE, Amer HA, Simpson I, Ward MK, Hall RJ. Cardiac abnormalities and exercise tolerance in patients receiving renal replacement therapy. British Medical Journal Clinical Research Ed 1984;289(6457):1479‐84. [MEDLINE: ] [DOI] [PMC free article] [PubMed] [Google Scholar]
Burke 1985 {published data only}
- Burke E, Germain M, Fitzgibbon J, Braden G. Maximal exercise during hemodialysis [abstract]. Medicine & Science in Sports & Exercise 1985;17(2):183. [Google Scholar]
Cade 1995 {published data only}
- Cade P. Patient's perspective: exercise and a positive attitude help dialysis patients to thrive. Nephrology News & Issues 1995;9(4):26‐28. [MEDLINE: ] [PubMed] [Google Scholar]
Cade 1997 {published data only}
- Cade P. How exercise can change "disability" to "ability" in the ESRD patient. Nephrology News & Issues 1997;11(8):55‐6. [MEDLINE: ] [PubMed] [Google Scholar]
Cade 2004 {published data only}
- Cade P. Leg training. Assessing the body's energy reserves. Nephrology News & Issues 2004;18(5):70. [MEDLINE: ] [PubMed] [Google Scholar]
Capitanini 2008 {published data only}
- Capitanini A, Cupisti A, Mochi N, Rossini D, Lupi A, Michelotti G, et al. Effects of exercise training on exercise aerobic capacity and quality of life in hemodialysis patients. Journal of Nephrology 2008;21(5):738‐43. [MEDLINE: ] [PubMed] [Google Scholar]
Cappy 1999 {published data only}
- Cappy CS, Jablonka J, Schroeder ET. The effects of exercise during hemodialysis on physical performance and nutrition assessment. Journal of Renal Nutrition 1999;9(2):63‐70. [MEDLINE: ] [DOI] [PubMed] [Google Scholar]
Carey 1997 {published data only}
- Carey S, Painter P. An exercise program for CAPD patients. Nephrology News & Issues 1997;11(6):15‐18. [MEDLINE: ] [PubMed] [Google Scholar]
Carlson 1999 {published data only}
- Carlson L, Carey S. Staff responsibility to exercise. Advances in Renal Replacement Therapy 1999;6(2):172‐80. [MEDLINE: ] [DOI] [PubMed] [Google Scholar]
Carney 1983 {published data only}
- Carney RM, McKevitt PM, Goldberg AP, Hagberg J, Delmez JA, Harter HR. Psychological effects of exercise training in hemodialysis patients. Nephron 1983;33(3):179‐81. [MEDLINE: ] [DOI] [PubMed] [Google Scholar]
Cashion 2000 {published data only}
- Cashion AK, Cowan PA, Milstead EJ, Gaber AO, Hathaway DK. Heart rate variability, mortality, and exercise in patients with end‐stage renal disease. Progress in Transplantation 2000;10(1):10‐16. [MEDLINE: ] [DOI] [PubMed] [Google Scholar]
- Cashion AK, Holmes SL, Arheart KL, Acchiardo, SR, Hathaway DK. Heart rate variability and mortality in patients with end stage renal disease. Nephrology Nursing Journal: Journal of the American Nephrology Nurses' Association 2005;32(2):173‐84. [MEDLINE: ] [PubMed] [Google Scholar]
Castaneda 1998 {published data only}
- Castaneda C, Grossi L, Dwyer J. Potential benefits of resistance exercise training on nutritional status in renal failure. Journal of Renal Nutrition 1998;8(1):2‐10. [MEDLINE: ] [DOI] [PubMed] [Google Scholar]
Castellino 1987 {published data only}
- Castellino P, Bia M, DeFronzo RA. Metabolic response to exercise in dialysis patients. Kidney International 1987;32(6):877‐83. [MEDLINE: ] [DOI] [PubMed] [Google Scholar]
Chan 2007 {published data only}
- Chan M, Cheema BS, Fiatarone Singh MA. Progressive resistance training and nutrition in renal failure. Journal of Renal Nutrition 2007;17(1):84‐7. [MEDLINE: ] [DOI] [PubMed] [Google Scholar]
Cheema 2005a {published data only}
- Cheema BS, Smith BC, Singh MA. A rationale for intradialytic exercise training as standard clinical practice in ESRD. American Journal of Kidney Diseases 2005;45(5):912‐6. [MEDLINE: ] [DOI] [PubMed] [Google Scholar]
Cheema 2005b {published data only}
- Cheema BS, Singh MA. Exercise training in patients receiving maintenance hemodialysis: a systematic review of clinical trials. American Journal of Nephrology 2005;25(4):352‐64. [MEDLINE: ] [DOI] [PubMed] [Google Scholar]
Cheema 2006 {published data only}
- Cheema BS, O´Sullivan AJ, Patwardhan NA, Kelly J, Gillin A, Fiatarone Singh MA. Progressive resistance training during hemodialysis: rationale and method of a randomized‐controlled trial. Hemodialysis International 2006;10(3):303‐10. [MEDLINE: ] [DOI] [PubMed] [Google Scholar]
Chen 2005 {published data only}
- Chen JL, Coomber S, Jaber BL, Liangos O, Levey AS, Castaneda C. Resistance exercise in maintenance dialysis‐feasibility study [abstract]. Journal of the American Society of Nephrology 2005;16:716A. [Google Scholar]
Cheng 2003 {published data only}
- Cheng YY, Wong YF, Chu BY, Lam WO, Ho YW. Rehabilitating a dialysis patient. Peritoneal Dialysis International 2003;23 Suppl 2:S81‐3. [MEDLINE: ] [PubMed] [Google Scholar]
Clark 1996 {published data only}
- Clark BA, Shannon C, Brown RS, Gervino EV. Extrarenal potassium homeostasis with maximal exercise in end‐stage renal disease. Journal of the American Society of Nephrology 1996;7(8):1223‐27. [MEDLINE: ] [DOI] [PubMed] [Google Scholar]
Clyne 1991a {published data only}
- Clyne N, Ekholm J, Jogestrand T, Lins LE, Pehrsson SK. Effects of exercise training in predialytic uremic patients. Nephron 1991;59(1):84‐9. [MEDLINE: ] [DOI] [PubMed] [Google Scholar]
Clyne 1996 {published data only}
- Clyne N. Physical working capacity in uremic patients. Scandinavian Journal of Urology & Nephrology 1996;30(4):247‐52. [MEDLINE: ] [DOI] [PubMed] [Google Scholar]
Clyne 2004a {published data only}
- Clyne N. The importance of exercise training in predialysis patients with chronic kidney disease. Clinical Nephrology 2004;61 Suppl 1:S10‐3. [MEDLINE: ] [PubMed] [Google Scholar]
Clyne 2004b {published data only}
- Clyne N. Physical working capacity and muscle strength in chronic renal failure are improved by exercise [Motion förbättrar arbetsförmågan och muskelstyrkan vid kronisk njursvikt]. Läkartidningen 2004;101(50):4111‐5. [MEDLINE: ] [PubMed] [Google Scholar]
Colangelo 1997 {published data only}
- Colangelo RM, Stillman MJ, Kessler‐Fogil D, Kessler‐Hartnett D. The role of exercise in rehabilitation for patients with end‐stage renal disease. Rehabilitation Nursing 1997;22(6):288‐92. [MEDLINE: ] [DOI] [PubMed] [Google Scholar]
Cook 2008 {published data only}
- Cook S, MacLaughlin H, Newell G, Holesgrove M, Kariyawasama D, Roseke M, et al. Can a structured multidisciplinary programme combining exercise, diet and orlistat achieve significant weight loss and improved functional ability in patients with chronic kidney disease? [abstract MP664]. ERA‐EDTA Congress. 2006.
- Cook SA, MacLaughlin H, Macdougall IC. A structured weight management programme can achieve improved functional ability and significant weight loss in obese patients with chronic kidney disease. Nephrology Dialysis Transplantation 2008;23(1):263‐8. [MEDLINE: ] [DOI] [PubMed] [Google Scholar]
Copley 1999 {published data only}
- Copley JB, Lindberg JS. The risks of exercise. Advances in Renal Replacement Therapy 1999;6(2):165‐71. [MEDLINE: ] [DOI] [PubMed] [Google Scholar]
Copley 2001 {published data only}
- Copley JB. Resistance training enhances the value of protein restriction in the treatment of chronic kidney disease. Annals of Internal Medicine 2001;135(11):999‐1001. [MEDLINE: ] [DOI] [PubMed] [Google Scholar]
Cowan 2000 {published data only}
- Cowan PA, Hathaway DK, Kreider R, Wicks MN, Soberman J, Jordan P, et al. Effect of exercise training on functional capacity and quality of life of kidney transplant recipients. Medicine & Science in Sports & Exercise 2000;32(5 Suppl):S160. [Google Scholar]
Cowan 2001 {published data only}
- Cowan PA, Cashion AK, Kreider RB, Hathaway DK, Gaber AO. Exercise results in sustained improvement in cardiac autonomic function in kidney and kidney‐pancreas transplant recipients. Medicine & Science in Sports & Exercise 2001;33(5 Suppl):S139. [Google Scholar]
Cowen 1995 {published data only}
- Cowen TD, Huang CT, Lebow J, DeVivo MJ, Hawkins LN. Functional outcomes after inpatient rehabilitation of patients with end‐stage renal disease. Archives of Physical Medicine & Rehabilitation 1995;76(4):355‐9. [MEDLINE: ] [DOI] [PubMed] [Google Scholar]
Curtin 2002 {published data only}
- Curtin RB, Klag MJ, Bultman DC, Schatell D. Renal rehabilitation and improved patient outcomes in Texas dialysis facilities. American Journal of Kidney Diseases 2002;40(2):331‐8. [MEDLINE: ] [DOI] [PubMed] [Google Scholar]
Dasselaar 2004 {published data only}
- Dasselaar J, Huisman R, Franssen C, Farrington K, Banerjee A, Kong C. The haemodynamic response to submaximal exercise during isovolaemic haemodialysis. Nephrology Dialysis Transplantation 2004;19(6):1528‐32. [MEDLINE: ] [DOI] [PubMed] [Google Scholar]
Daul 1990 {published data only}
- Daul AE, Volker K, Alberty A, Hollmann W, Philipp Th. Benefits of exercise training for the physical and psychosocial rehabilitation of patients on maintenance hemodialysis [Dialyse‐Sportgruppe: Eine Möglichkeit zur Verbesserung der körperlichen Leistungsfähigkeit und der psycho‐sozialen Rehabilitation chronischer Dialysenpatienten]. Nieren‐ und Hochdruckkrankheiten 1990;19(6):275‐84. [EMBASE: 1990246165] [Google Scholar]
Daul 2004 {published data only}
- Daul AE, Schafers RF, Daul K, Philipp T. Exercise during hemodialysis. Clinical Nephrology 2004;61 Suppl 1:S26‐30. [MEDLINE: ] [PubMed] [Google Scholar]
Death 1999 {published data only}
- Death C. Exercising to fitness on dialysis. Edtna‐Erca Journal 1999;25(2):13‐5. [MEDLINE: ] [DOI] [PubMed] [Google Scholar]
Deligiannis 2002 {published data only}
- Deligiannis A. Report from the second International Congress on quality of life in end‐stage renal disease, Thessaloniki, Greece, March 8‐9, 2002. Nephrology Dialysis Transplantation 2002;17(11):1888‐9. [MEDLINE: ] [DOI] [PubMed] [Google Scholar]
Deligiannis 2004a {published data only}
- Deligiannis A. Cardiac adaptations following exercise training in hemodialysis patients. Clinical Nephrology 2004;61 Suppl 1:S39‐45. [MEDLINE: ] [PubMed] [Google Scholar]
Deligiannis 2004b {published data only}
- Deligiannis A. Exercise rehabilitation and skeletal muscle benefits in hemodialysis patients. Clinical Nephrology 2004;61 Suppl 1:S46‐50. [MEDLINE: ] [PubMed] [Google Scholar]
Derici 2005 {published data only}
- Derici U, Canseven N, Sindel S. Dialysate leakage in CAPD patients. Edtna‐Erca Journal 2005;31(1):13‐4. [MEDLINE: ] [DOI] [PubMed] [Google Scholar]
Desmet 2003 {published data only}
- Desmet C, Beguin C, Swine C, Jadoul M, Universite Catholique de Louvain Collaborative Group. Falls in hemodialysis patients: prospective study of incidence, risk factors and complications. American Journal of Kidney Diseases 2005;45(1):148‐53. [MEDLINE: ] [DOI] [PubMed] [Google Scholar]
Donwerth 1994 {published data only}
- Donwerth JJ. Nursing overview: Reduction of posttransplant hypertension. Dialysis & Transplantation 1994;23(8):456‐58+460‐61. [EMBASE: 1994307725] [Google Scholar]
Endo 1995 {published data only}
- Endo F, Usuda S, Nakamura M, Kurashige S. The effects of rehabilitation on the immune responses in patients I: The effects of exercise training on the T‐cell activity in chronic hemaodialysis patients. Journal of Physical Therapy Science 1995;7:15‐20. [Google Scholar]
Endo 1996 {published data only}
- Endo F, Asakawa Y, Usuda S, Yamamoto T. Effects of daily walking exercise on chronic hemodialysis outpatients. Journal of Physical Therapy Science 1996;8(1):1‐4. [Google Scholar]
Evans 2004 {published data only}
- Evans N, Forsyth E. End‐stage renal disease in people with type 2 diabetes: systemic manifestations and exercise implications. Physical Therapy 2004;84(5):454‐63. [MEDLINE: ] [PubMed] [Google Scholar]
Farese 2008 {published data only}
- Farese S, Aregger F, Ivo B, Kruse A, Frey FJ, Uehlinger DE. Transcutaneous electrical muscle stimulation and passive cycling movements increase blood pressure and enhance urea and phosphate removal during hemodialysis [abstract]. Journal of the American Society of Nephrology 2007;18(Abstracts):78A. [Google Scholar]
- Farese S, Budmiger R, Aregger F, Bergmann I, Frey FJ, Uehlinger DE. Effect of transcutaneous electrical muscle stimulation and passive cycling movements on blood pressure and removal of urea and phosphate during hemodialysis. American Journal of Kidney Diseases 2008;52(4):745‐52. [MEDLINE: ] [DOI] [PubMed] [Google Scholar]
Fatouros 2008 {published data only}
- Fatouros IG, Pasadakis P, Sovatzidis A, Chatzinikolaou A, Panagoutsos S, Sivridis D, et al. Acute exercise may exacerbate oxidative stress response in hemodialysis patients. Nephron 2008;109(2):C55‐64. [MEDLINE: ] [DOI] [PubMed] [Google Scholar]
Ferreira 2003 {published data only}
- Ferreira LG, Bergamaschi CT, Lazaretti‐Castro M, Varros ER, Heilberg IP. Effects of long‐term creatine supplementation and physical exercise on body composition, bone mineral density and renal function in rats [abstract M413]. ERA‐EDTA Congress. 2003.
Finkelstein 2002 {published data only}
- Finkelstein FO, Watnick S, Finkelstein SH, Wuerth D. The treatment of depression in patients maintained on dialysis. Journal of Psychosomatic Research 2002;53(4):957‐60. [MEDLINE: ] [DOI] [PubMed] [Google Scholar]
Fitts 1996 {published data only}
- Fitts SS, Guthrie MR, Blagg CR. Rehabilitation should parallel the course of the disease: counselling & exercise coaching for patients [abstract]. Journal of the American Society of Nephrology 1996;7(9):1386. [Google Scholar]
Fitts 1997 {published data only}
- Fitts SS. Physical benefits and challenges of exercise for people with chronic renal disease. Journal of Renal Nutrition 1997;7(3):123‐28. [Google Scholar]
Forrest 2004 {published data only}
- Forrest GP. Inpatient rehabilitation of patients requiring hemodialysis. Archives of Physical Medicine & Rehabilitation 2004;85(1):51‐3. [MEDLINE: ] [DOI] [PubMed] [Google Scholar]
Francavilla 2002 {published data only}
- Francavilla G. Cristofalo M. Castellino P. Francavilla VC. Kidney and physical exercise. Effects of programmed training [Rene ed esercicizio fisico: effetti dellállenamento programmato]. Medicina dello Sport 2002;55(3):241‐45. [EMBASE: 2002460903] [Google Scholar]
Franssen 2002 {published data only}
- Franssen FM, Wouters EF, Schols AM. The contribution of starvation, deconditioning and ageing to the observed alterations in peripheral skeletal muscle in chronic organ diseases. Clinical Nutrition 2002;21(1):1‐14. [MEDLINE: ] [DOI] [PubMed] [Google Scholar]
Fritschka 2000 {published data only}
- Fritschka E, Mahlmeister J, Endlein‐Frank E, Liebscher‐Steinecke R, Wanner C, Birkner B, et al. A prospective study on the long‐term effect of a new multidisciplinary physical fitness training for patients with kidney disease and high blood pressure in relation to rehabilitation [Eine prospektive Studie zum langzeiteffekt enines neuen multidisziplinären Gesundheitstrainings bei nierenkranken Patienten mit Bluthochdruck im Rahmen der stationären Rehabilitation]. Nieren‐ und Hochdruckkrankheiten 2000;29(12):625‐7. [EMBASE: 2001013440] [Google Scholar]
- Fritschka E, Mahlmeister J, Endlein‐Frank E, Liebscher‐Steinecke R, Wanner C, Birkner B, et al. A prospective study on the long‐term‐effect of a new multidisciplinary health training program, in renal patients with high blood pressure carried during rehabilitation in hospital [Eine prospektive Studie zum Langzeiteffekt eines neuen multidisziplinären Gesundheitstrainings bei nierenkranken Patienten mit Bluthochdruck im Rahmen der stationären Rehabilitat]. Prävention und Rehabilitation 2001;13(1):11‐3. [EMBASE: 2001138445] [Google Scholar]
Fritschka 2001 {published data only}
- Fritschka E, Mahlmeister J, Liebscher‐Steinecke R, Schätzlein S, Endlein‐Frank E. Rehabilitation in patients with chronic renal insufficiency, in dialysis patients, and after renal transplantation [Rehabilitation bei Patienten mot chronischer Niereninsuffiziens, Dialysepateinten und nach Nierentransplantation]. Prävention und Rehabilitation 2001;13(2):67‐77. [EMBASE: 2001235298] [Google Scholar]
Fritschka 2003 {published data only}
- Fritschka E, Mahlmeister J, Liebscher‐Steinecke R. Preventive strategies and aims of vocational rehabilitation in chronic renal insufficiency patients [Möglichkeiten der Prävention und der sozialen und beruflichen Wiedereingliederung in der nephrologischen Rhabilitation]. Nieren‐ und Hochdruckkrankenheit 2003;32(9):408‐19. [MEDLINE: ] [Google Scholar]
Fuhrmann 2004 {published data only}
- Fuhrmann I, Krause R. Principles of exercising in patients with chronic kidney disease, on dialysis and for kidney transplant recipients. Clinical Nephrology 2004;61 Suppl 1:S14‐25. [MEDLINE: ] [PubMed] [Google Scholar]
Fuiano 2004 {published data only}
- Fuiano G, Mancuso D, Cianfrone P, Comi N, Mazza G, Marino F, et al. Can young adult patients with proteinuric IgA nephropathy perform physical exercise?. American Journal of Kidney Diseases 2004;44(2):257‐63. [MEDLINE: ] [DOI] [PubMed] [Google Scholar]
Fulignati 2002 {published data only}
- Fulignati P, Staffolani E, Costanzi S, Passalacqua S, Sturniolo A, Tullio T, et al. Improvement of the purification with muscular mobilization during dialysis [abstract]. International Journal of Artificial Organs 2002;25(7):667. [Google Scholar]
- Staffolani E, Splendiani G. Exercise training in dialysis patients. Artificial Organs 2003;27(9):858. [MEDLINE: ] [DOI] [PubMed] [Google Scholar]
Furuland 1998 {published data only}
- Furuland H, Linde T, Danielsson BG. Physical exercise capacity in patients with end‐stage renal disease after normalization of hemoglobin with erythropoietin (EPO) [abstract]. Journal of the American Society of Nephrology 1998;9(Program & Abstract):337A. [Google Scholar]
Gavin 1982 {published data only}
- Gavin JR III, Goldberg AP, Hagberg J, Delmez JA, Geltman E, Harter HR. Endurance exercise training improves insulin sensitivity in uremia [abstract]. Clinical Research 1982;30(2):393A. [Google Scholar]
Germain 1985 {published data only}
- Germain M, Burke E, Fitzgibbons J, Braden G. Maximal exercise during hemodialysis physiological effects [abstract]. Kidney International 1985;27(1):161. [Google Scholar]
Goldberg 1979a {published data only}
- Goldberg AP, Hagberg JM, Delmez JA, Florman RW, Harter HR. Effects of exercise training on coronary risk factors in hemodialysis patients. Proceedings of the Clinical Dialysis & Transplant Forum 1979;9:39‐43. [MEDLINE: ] [PubMed] [Google Scholar]
Goldberg 1979b {published data only}
- Goldberg AP, Hagberg JM, Delmez JA. Exercise training improves abnormal lipid and carbohydrate metabolism in hemodialysis patients. Transactions of the American Society for Artificial Organs 1979;25:431‐6. [MEDLINE: ] [DOI] [PubMed] [Google Scholar]
Goldberg 1980a {published data only}
- Goldberg AP, Hagberg JM, Delmez JA, Haynes ME, Harter HR. Metabolic effects of exercise training in hemodialysis patients. Kidney International 1980;18(6):754‐61. [MEDLINE: ] [DOI] [PubMed] [Google Scholar]
Goldberg 1980b {published data only}
- Goldberg AP, Hagberg J, Delmez JA, Carney RM, McKevitt PM, Ehsani AA, et al. The metabolic and psychological effects of exercise training in hemodialysis patients. American Journal of Clinical Nutrition 1980;33(7):1620‐8. [MEDLINE: ] [DOI] [PubMed] [Google Scholar]
Goldberg 1984 {published data only}
- Goldberg AP. A potential role for exercise training in modulating coronary risk factors in uremia. American Journal of Nephrology 1984;4(2):132‐33. [MEDLINE: ] [DOI] [PubMed] [Google Scholar]
Golper 1984 {published data only}
- Golper TA. Therapy for uremic hyperlipidemia. Nephron 1984;38(4):217‐25. [MEDLINE: ] [DOI] [PubMed] [Google Scholar]
Gonzales 1993 {published data only}
- Gonzalez‐Molina M, Cabello M, Tinahones F, Burgos D, Lillo J, Soriguer F. Effect of diet, exercise and HMG‐CoA reductase on hypercholesterolaemia in renal transplant patients [abstract]. Nephrology Dialysis Transplantation 1993;8(9):1040. [Google Scholar]
Gonzales 1996 {published data only}
- Gonzalez‐Molina M, Cabello M, Tinahones F, Burgos D, Lillo J, Soriguer F, et al. Hyperlipoproteinemia in renal transplant patients: Effect of hypocaloric diet, exercise and HMG‐CoA reductase inhibition [Hyperlipoproteinemia en el transplante renal: respuesta a dieta la hipocalórica, ejercico físico y lovastatina]. Nefrologia 1996;16(4):359‐64. [EMBASE: 1996302763] [Google Scholar]
Goodman 2004 {published data only}
- Goodman ED, Ballou MB. Perceived barriers and motivators to exercise in hemodialysis patients. Nephrology Nursing Journal: Journal of the American Nephrology Nurses' Association 2004;31(1):23‐29. [MEDLINE: ] [PubMed] [Google Scholar]
Gordon 2005 {published data only}
- Gordon EJ, Prohaska T, Siminoff LA, Minich PJ, Sehgal AR. Needed: tailored exercise regimens for kidney transplant recipients. American Journal of Kidney Diseases 2005;45(4):769‐74. [MEDLINE: ] [DOI] [PMC free article] [PubMed] [Google Scholar]
Gordon 2009 {published data only}
- Gordon EJ, Prohaska TR, Gallant MP, Sehgal AR, Strogatz D, Yucel R, et al. Longitudinal analysis of physical activity, fluid intake, and graft function among kidney transplant recipients. Transplant International 2009;22(10):990‐8. [MEDLINE: ] [DOI] [PMC free article] [PubMed] [Google Scholar]
Grant 2004 {published data only}
- Grant SJ, Miller BW. Effects of exercise on musculoskeletal complaints and blood pressure in hemodialysis patients. Advances in Chronic Kidney Disease 2004;11(2):240. [Google Scholar]
Green 1979 {published data only}
- Greene MC, Zabetakis PM, Gleim GW, Pasternak FL, Saraniti AJ, Michelis MF, et al. Effect of exercise on lipid metabolism and dietary intake in hemodialysis patients. Proceedings of the Clinical Dialysis & Transplant Forum 1979;9:80‐6. [MEDLINE: ] [PubMed] [Google Scholar]
Greinert 1986 {published data only}
- Greinert M, Kielstein R, Lachhein L. Exercise training in patients with chronic kidney disease [Sporttherapie bei chronisch niereninsuffizienten Patienten]. Medizin und Sport 1986;26(6):179‐81. [Google Scholar]
Guarnieri 2005 {published data only}
- Guarnieri G, Grassi G, Barazzoni R, Zanetti M, Biolo G. The impact of inflammation on metabolic regulation in chronic kidney disease: a review. Journal of Renal Nutrition 2005;15(1):121‐4. [MEDLINE: ] [DOI] [PubMed] [Google Scholar]
Gültekin 2003 {published data only}
- Gultekin Z, Akman B, Ozdemir FN. Preliminary effect of exercise training on anxiety and depression scores in dialysis patients [Diyaliz hastalarinda egzersiz egitimin anksiyete ve depresyon ölcegi puanlari üzerine etkisi]. Fizyoterapi Rehabilitasyon 2003;14(1):16‐22. [EMBASE: 2003410887] [Google Scholar]
Habedank 2009 {published data only}
- Habedank D, Kung T, Karhausen T, Haehling S, Doehner W, Schefold JC, et al. Exercise capacity and body composition in living‐donor renal transplant recipients over time. Nephrology Dialysis Transplantation 2009;24(12):3854‐60. [MEDLINE: ] [DOI] [PubMed] [Google Scholar]
Haber 1988 {published data only}
- Haber P, Burghuber OC. Principles and general practice of goal‐oriented planning of training in patients with diabetic nephropathy and in dialysis patients [Grundlagen und Praxis einer zielorientierten Trainungsplanung bei Patienten mit diabetischer Nephropathie und bei Dialysepatienten]. Wiener Medizinische Wochenschrift 1988;138(14):350‐2. [MEDLINE: ] [PubMed] [Google Scholar]
Hagberg 1983 {published data only}
- Hagberg JM, Goldberg AP, Ehsani AA, Heath GW, Delmez JA, Harter HR. Exercise training improves hypertension in hemodialysis patients. American Journal of Nephrology 1983;3(4):209‐12. [MEDLINE: ] [DOI] [PubMed] [Google Scholar]
Haouzi 1994 {published data only}
- Haouzi P, Andre JL, Durand PY, Chanliau J, Uffholtz H, Kessler M. Haemodialysis induced arterial potassium changes and control of breathing during exercise. Nephrology Dialysis Transplantation 1994;9(7):877‐9. [MEDLINE: ] [PubMed] [Google Scholar]
Hase 1983 {published data only}
- Hase H, Nakamura T, Ebine K, Akaike M, Nomura M, Chang K. Evaluation of exercise tolerance and cardiac function on symptom limited treadmill exercise test in chronic hemodialysis patients, and exercise training. Nippon Jinzo Gakkai Shi. Japanese Journal of Nephrology 1983;25(10):1255‐65. [MEDLINE: ] [PubMed] [Google Scholar]
Hauser 1995 {published data only}
- Hauser SP. Case management of the kidney transplant recipient. Anna Journal 1995;22(4):369‐74. [MEDLINE: ] [PubMed] [Google Scholar]
Headley 2002 {published data only}
- Headley S, Germain M, Mailloux P, Mulhern J, Ashworth B, Burris J, et al. Resistance training improves strength and functional measures in patients with end‐stage renal disease. American Journal of Kidney Diseases 2002;40(2):355‐64. [MEDLINE: ] [DOI] [PubMed] [Google Scholar]
Headley 2008 {published data only}
- Headley SA, Germain MJ, Milch CM, Buchholz MP, Coughlin MA, Pescatello LS. Immediate blood pressure‐lowering effects of aerobic exercise among patients with chronic kidney disease. Nephrology 2008;13(7):601‐6. [MEDLINE: ] [DOI] [PubMed] [Google Scholar]
Hebbar 2000 {published data only}
- Hebbar S, Manley HJ, Brook JJ, McElwee JB. Regular exercise improves the quality of sleep in chronic hemodialysis patients [abstract]. Journal of the American Society of Nephrology 2000;11(Program & Abstracts):233A. [Google Scholar]
Heiwe 2001a {published data only}
- Heiwe S, Tollbäck A, Clyne N. Twelve weeks of exercise training increases muscle function and walking capacity in elderly predialysis patients and healthy subjects. Nephron 2001;88(1):48‐56. [MEDLINE: ] [DOI] [PubMed] [Google Scholar]
Heiwe 2005 {published data only}
- Heiwe S, Clyne N, Tollback A, Borg K. Effects of regular resistance training on muscle histopathology and morphometry in elderly patients with chronic kidney disease. American Journal of Physical Medicine & Rehabilitation 2005;84(11):865‐74. [MEDLINE: ] [DOI] [PubMed] [Google Scholar]
Hensel 1973 {published data only}
- Hensel G, Bundschu HD, Durr F. Effect of physical exertion on various hemodynamic values in patients treated regularly by hemodialysis [Der Einfluss körperlicher Belastung auf verschiedene hämodynamische Grössen bei Patienten unter regelmässiger Hämodialysebehandlung]. Medizinische Welt 1973;24(16):639‐42. [MEDLINE: ] [PubMed] [Google Scholar]
Henson 2010 {published data only}
- Henson A, Gillespie B, McCarthy A, Finch L, Chatterton S, Devlin J, et al. Intradialytic exercise: a feasibility study. Renal Society of Australasia Journal 2010;6(1):11‐5. [Google Scholar]
Hiramatsu 2003 {published data only}
- Hiramatsu M. Improving outcome in geriatric peritoneal dialysis patients. Peritoneal Dialysis International 2003;23 Suppl 2:S84‐9. [MEDLINE: ] [PubMed] [Google Scholar]
Hollis 2005 {published data only}
- Hollis J, Corden E, Williams PF. Longitudinal evaluation of a weight reduction program for patients on peritoneal dialysis. Peritoneal Dialysis International 2005;25 Suppl 3:S152‐4. [MEDLINE: ] [PubMed] [Google Scholar]
Horber 1985 {published data only}
- Horber FF, Scheidegger JR, Grunig BE, Frey FJ. Thigh muscle mass and function in patients treated with glucocorticoids. European Journal of Clinical Investigation 1985;15(6):302‐7. [MEDLINE: ] [DOI] [PubMed] [Google Scholar]
Hori 1992 {published data only}
- Hori K, Fujimi S. Management of blood glucose in diabetic dialysis patients. Nippon Rinsho ‐ Japanese Journal of Clinical Medicine 1992;50(Suppl):192‐6. [MEDLINE: ] [PubMed] [Google Scholar]
Huber 1985 {published data only}
- Huber W, Marquard E. Plasma potassium and blood pH following physicalexercise in dialysis patients. Nephron 1985;40(3):383‐4. [MEDLINE: ] [DOI] [PubMed] [Google Scholar]
Hughes 1986 {published data only}
- Hughes JR, Casal DC, Leon AS. Psychological effects of exercise: a randomized cross‐over trial. Journal of Psychosomatic Research 1986;30(3):355‐60. [MEDLINE: ] [DOI] [PubMed] [Google Scholar]
Hung 2002 {published data only}
- Hung AM, Chertow GM, Young BS, Carey S, Johansen KL. Inflammatory markers are unrelated to physical activity, performance, and functioning in hemodialysis. Journal of Renal Nutrition 2002;12(3):170‐6. [MEDLINE: ] [DOI] [PubMed] [Google Scholar]
Hung 2003 {published data only}
- Hung AM, Chertow GM, Young BS, Carey S, Johansen KL. Inflammatory markers are unrelated to physical activity, performance, and functioning in hemodialysis. Advances in Renal Replacement Therapy 2003;10(3):232‐40. [MEDLINE: ] [DOI] [PubMed] [Google Scholar]
Iborra 2000 {published data only}
- Iborra Molto C, Pico Vicent L, Montiel Castillo A, Clemente Ramon F. Quality of life and exercise in renal disease. Edtna‐Erca Journal 2000;26(1):38‐40. [MEDLINE: ] [DOI] [PubMed] [Google Scholar]
Itoh 1992 {published data only}
- Itoh H, Yanagisawa E, Ikeda C, Nakamura M, Hatogai F, et al. Effects of recombinant human erythropoietin (r‐HuEPO) on hemodynamic and metabolic response during exercise in hemodialysis patients with anemia [abstract]. Circulation 1992;86(4 Suppl 1):I400. [Google Scholar]
Jang 2009 {published data only}
- Jang EJ, Kim HS. Effects of exercise intervention on physical fitness and health‐relalted quality of life in hemodialysis patients. Journal of Korean Academy of Nursing 2009;39(4):584‐93. [MEDLINE: ] [DOI] [PubMed] [Google Scholar]
Jassal 1998 {published data only}
- Jassal SV, Brissenden JE, Roscoe JM. Specialized chronic care for dialysis patients‐‐a five‐year study. Clinical Nephrology 1998;50(2):84‐9. [MEDLINE: ] [PubMed] [Google Scholar]
Jassal 2002 {published data only}
- Jassal S, Borganza C, Naglie G. Can older patients do better on dialysis? Identifying a motivation problem [abstract T386]. ERA‐EDTA Congress. 2002.
Jette 1977 {published data only}
- Jette M, Posen G, Cardarelli C. Effects of an exercise programme in a patient undergoing hemodialysis treatment. Journal of Sports Medicine & Physical Fitness 1977;17(2):181‐6. [MEDLINE: ] [PubMed] [Google Scholar]
Jindal 2004 {published data only}
- Jindal RM, Zawada ET Jr. Obesity and kidney transplantation. American Journal of Kidney Diseases 2004;43(6):943‐52. [MEDLINE: ] [DOI] [PubMed] [Google Scholar]
Johansen 1999 {published data only}
- Johansen KL. Physical functioning and exercise capacity in patients on dialysis. Advances in Renal Replacement Therapy 1999;6(2):141‐8. [MEDLINE: ] [DOI] [PubMed] [Google Scholar]
Johansen 2000 {published data only}
- Johansen KL, Chertow GM, Ng AV, Mulligan K, Carey S, Schoenfeld PY, et al. Physical activity levels in patients on hemodialysis and healthy sedentary controls. Kidney International 2000;57(6):2564‐70. [MEDLINE: ] [DOI] [PubMed] [Google Scholar]
Johansen 2003a {published data only}
- Johansen KL, Shubert T, Doyle J, Soher B, Sakkas GK, Kent‐Braun JA. Muscle atrophy in patients receiving hemodialysis: effects on muscle strength, muscle quality, and physical function. Kidney International 2003;63(1):291‐7. [MEDLINE: ] [DOI] [PubMed] [Google Scholar]
Johansen 2003b {published data only}
- Johansen KL, Sakkas GK, Doyle J, Shubert T, Dudley RA. Exercise counseling practices among nephrologists caring for patients on dialysis. American Journal of Kidney Diseases 2003;41(1):171‐8. [MEDLINE: ] [DOI] [PubMed] [Google Scholar]
- Johansen KL, Sakkas GK, Doyle J, Shubert T, Dudley RA. Exercise counseling practices among nephrologists caring for patients receiving maintenance hemodialysis [abstract]. Journal of the American Society of Nephrology 2002;13(Program & Abstracts):625A. [Google Scholar]
Johansen 2005a {published data only}
- Johansen KL. Exercise and chronic kidney disease: current recommendations. Sports Medicine 2005;35(6):485‐99. [MEDLINE: ] [DOI] [PubMed] [Google Scholar]
Johansen 2005b {published data only}
- Johansen KL, Doyle J, Sakkas GK, Kent‐Braun JA. Neural and metabolic mechanisms of excessive muscle fatigue in maintenance hemodialysis patients. American Journal of Physiology ‐ Regulatory Integrative & Comparative Physiology 2005;289(3):R805‐13. [MEDLINE: ] [DOI] [PubMed] [Google Scholar]
Johansen 2007 {published data only}
- Johansen KL. Exercise in the end‐stage renal disease population. Journal of the American Society of Nephrology 2007;18(6):1845‐54. [MEDLINE: ] [DOI] [PubMed] [Google Scholar]
Johansen 2008 {published data only}
- Johansen KL. Exercise and dialysis. Hemodialysis International 2008;12(3):290‐300. [MEDLINE: ] [DOI] [PubMed] [Google Scholar]
Johansen 2010 {published data only}
- Johansen KL, Finkelstein FO, Revicki DA, Gitlin M, Evans C, Mayne TJ. Systematic review and meta‐analysis of exercise tolerance and physical functioning in dialysis patients treated with erythropoiesis‐stimulating agents. American Journal of Kidney Diseases 2010;55(3):535‐48. [MEDLINE: ] [DOI] [PubMed] [Google Scholar]
Johnstone 2002 {published data only}
- Johnstone S, Hays R, King C. Evaluating the impact of a physical rehabilitation program for dialysis patients. Nephrology News & Issues 2002;16(9):39‐42. [MEDLINE: ] [PubMed] [Google Scholar]
Juskowa 2006 {published data only}
- Juskowa J, Lewandowska M, Bartlomiejczyk I, Foroncewicz B, Korabiewska I, Niewczas M, et al. Physical rehabilitation and risk of atherosclerosis after successful kidney transplantation. Transplantation Proceedings 2006;38(1):157‐60. [MEDLINE: ] [DOI] [PubMed] [Google Scholar]
Kalevrosoglou 1999 {published data only}
- Kalevrosoglou J, Kabouris C, Daniilidis M, Agouridaki C, Kouidi E, Grekas D. Exercise training in HD patients during the hemodialysis treatment: Metabolic and immunologic alterations [abstract]. Nephrology Dialysis Transplantation 1999;14(9):A200. [Google Scholar]
Kalogerakou 2006 {published data only}
- Kalogerakou T, Papadakis E, Kosmadakis G, Papakonstantinou M, Tsaggalis G, Zerefos S, et al. Effects of intradialytic exercise on nutritional indices in hemodialysis patients [abstract MP451]. ERA‐EDTA Congress. 2006.
Karamouzi 2002 {published data only}
- Karamouzis M, Kouidi E, Karamouzis I, Grekas D, Deligiannis A, Tourkantonis A, et al. The effect of systematic exercise on bone metabolism and aerobic capacity of chronic hemodialysis patients [abstract]. Nephrology Dialysis Transplantation 2002;17(Suppl 1):130. [Google Scholar]
Karamouzis 2009 {published data only}
- Karamouzis I, Grekas D, Karamouzis M, Kallaras K, Stergiou‐Michailidou V, Kouidi E, et al. Physical training in patients on hemodialysis has a beneficial effect on the levels of eicosanoid hormone‐like substances. Hormones 2009;8(2):129‐37. [MEDLINE: ] [DOI] [PubMed] [Google Scholar]
Karmiel 1996 {published data only}
- Karmiel JC. The Easy Bike Program: an exercise‐during‐dialysis program. Topics in Clinical Nutrition 1996;12(1):74‐8. [Google Scholar]
Karmiel 1999 {published data only}
- Karmiel JC. The rehab exercise "E": a natural role for renal dietitians. Journal of Renal Nutrition 1999;9(4):214‐9. [MEDLINE: ] [DOI] [PubMed] [Google Scholar]
Kempeneers 1988 {published data only}
- Kempeneers GL, Myrburgh KH, Wiggins T, Adams B, Zyl‐Smit R, Noakes TD. The effect of an exercise training program in renal transplant recipients. Transplantation Proceedings 1988;20(1 Suppl 1):381‐2. [EMBASE: 1988111923] [Google Scholar]
Kempeneers 1990a {published data only}
- Kempeneers G, Noakes TD, Zyl‐Smit R, Myburgh KH, Lambert M, Adams B, et al. Skeletal muscle limits the exercise tolerance of renal transplant recipients: Effects of a graded exercise training program. American Journal of Kidney Diseases 1990;16(1):57‐65. [MEDLINE: ] [DOI] [PubMed] [Google Scholar]
Kerby 2007 {published data only}
- Kerby J, Lee‐Yu N, Lee S, Frazer J, Cook D, Hardy D, et al. Measurement of physical performance, quality of life and nutritional status outcomes following implementation of an exercise program for haemodialysis patients [abstract]. Physiotherapy 2007;93(S1):S4p3. [Google Scholar]
Kern 2009 {published data only}
- Kern J, Stewart A, Becker P. The effect of exercising with manual compression foot pumps, on dialysis efficiency, in patients with end stage renal disease. South African Journal of Physiotherapy 2009;65(2):9‐12. [Google Scholar]
Kesi 2010 {published data only}
- Kesi I, Sagi B, Vas T, Kovacs T, Wittmann I, Nagy J. Heart rate recovery after exercise is associated with renal function in patients with a homogenous chronic renal disease. Nephrology Dialysis Transplantation 2010;25(2):509‐13. [MEDLINE: ] [DOI] [PubMed] [Google Scholar]
Kettner 1982 {published data only}
- Kettner A. Exercise in dialysis patients. International Journal of Artificial Organs 1982;5(2):83‐4. [MEDLINE: ] [PubMed] [Google Scholar]
Kettner 1984a {published data only}
- Kettner A, Goldberg A, Harter H. Endurance exercise in hemodialysis patients effects on the sympathetic nervous system and serum glucose regulation. Contributions to Nephrology 1984;41:269‐71. [MEDLINE: ] [PubMed] [Google Scholar]
Kettner 1984b {published data only}
- Kettner A, Goldberg A, Hagberg J, Delmez J, Harter H. Cardiovascular and metabolic responses to submaximal exercise in hemodialysis patients. Kidney International 1984;26(1):66‐71. [MEDLINE: ] [DOI] [PubMed] [Google Scholar]
Kielstein 1995 {published data only}
- Kielstein R. Goals and results of physical exercise training in ESRF patients. Nephrology News & Issues 1995;9(6):S7‐S8. [MEDLINE: ] [PubMed] [Google Scholar]
Kim 1991 {published data only}
- Kim NS. Effects of progressive muscle relaxation therapy on the reduction of discomfort level in hemodialysis patients. Journal of the Catholic Medical College 1991;44(3):967‐76. [Google Scholar]
Kirkpatrick 1990 {published data only}
- Kirkpatrick WG. Can the rate of progression of chronic renal failure be altered?. American Journal of the Medical Sciences 1990;300(6):396‐401. [MEDLINE: ] [DOI] [PubMed] [Google Scholar]
Kiss 2005 {published data only}
- Kiss I, Farsang C, Rodicio JL. Treatment of hypertension in dialysed patients. Journal of Hypertension 2005;23(1):222‐6. [MEDLINE: ] [DOI] [PubMed] [Google Scholar]
Kjaer 1995 {published data only}
- Kjaer M, Keiding S, Engfred K, Rasmussen K, Sonne B, Kirkegard P, et al. Glucose homeostasis during exercise in humans with a liver or kidney transplant. American Journal of Physiology 1995;268(4 Pt 1):E636‐44. [MEDLINE: ] [DOI] [PubMed] [Google Scholar]
Kjaer 1999 {published data only}
- Kjaer M, Beyer N, Secher NH. Exercise and organ transplantation. Scandinavian Journal of Medicine & Science in Sports 1999;9(1):1‐14. [MEDLINE: ] [DOI] [PubMed] [Google Scholar]
Klang 1997 {published data only}
- Klang B, Clyne N. Well‐being and functional ability in uraemic patients before and after having started dialysis treatment. Scandinavuan Journal of Caring Sciences 1997;11(3):159‐66. [MEDLINE: ] [DOI] [PubMed] [Google Scholar]
Knap 2005 {published data only}
- Knap B, Buturovic‐Ponikvar J, Ponikvar R, Bren AF. Regular exercise as a part of treatment for patients with end‐stage renal disease. Therapeutic Apheresis & Dialysis 2005;9(3):211‐3. [MEDLINE: ] [DOI] [PubMed] [Google Scholar]
Kocak 2003 {published data only}
- Kocak R, Can F. The effect of rehabilitation on activities of daily living and fatigue level in hemodialysis patients [Hemdiyaliz hastalarinda rehabilitasyonun günl¨k yasam aktiviteleri ve fizisel yorgunluk düzeyine etkisi]. Fizyoterapi Rehabilitasyon 2003;14(2):80‐6. [EMBASE: 2004058755] [Google Scholar]
Kolewaski 2005 {published data only}
- Kolewaski CD, Mullally MC, Parsons TL, Paterson ML, Toffelmire EB, King‐VanVlack CE. Quality of life and exercise rehabilitation in end stage renal disease. CANNT Journal 2005;15(4):22‐9. [MEDLINE: ] [PubMed] [Google Scholar]
Kong 1999a {published data only}
- Kong C, Tattersall J. Exercise during dialysis increases Kt/V and reduces the post‐dialysis rebound [abstract]. Journal of the American Society of Nephrology 1999;10(Program & Abstract):332A. [Google Scholar]
Kong 1999b {published data only}
- Kong CH, Tattersall JE, Greenwood RN, Farrington K. The effect of exercise during haemodialysis on solute removal. Nephrology Dialysis Transplantation 1999;14(12):2927‐31. [MEDLINE: ] [DOI] [PubMed] [Google Scholar]
Kontos 2007 {published data only}
- Kontos PC, Miller KL, Brooks D, Jassal SV, Spanjevic L, Devins GM, et al. Factors influencing exercise participation by older adults requiring chronic hemodialysis: a qualitative study. International Urology & Nephrology 2007;39(4):1303‐11. [MEDLINE: ] [DOI] [PubMed] [Google Scholar]
Kopple 2003 {published data only}
- Kopple JD, Casaburi R, Storer T. Maintenance hemodialysis (MHD) patients display improved exercise capacity, muscle function and physical performance with low intensity endurance exercise [abstract]. Journal of the American Society of Nephrology 2003;14:857A. [Google Scholar]
Kopple 2005 {published data only}
- Kopple JD, Storer T, Casburi R. Impaired exercise capacity and exercise training in maintenance hemodialysis patients. Journal of Renal Nutrition 2005;15(1):44‐8. [MEDLINE: ] [DOI] [PubMed] [Google Scholar]
Kopple 2007b {published data only}
- Kopple JD, Wang H, Casaburi R, Fournier M, Lewis MI, Taylor W, et al. Exercise in maintenance hemodialysis patients induces transcriptional changes in genes favoring anabolic muscle. Journal of the American Society of Nephrology 2007;18(11):2975‐86. [MEDLINE: ] [DOI] [PubMed] [Google Scholar]
Kosmadakis 2007 {published data only}
Kosmadakis 2010 {published data only}
- Kosmadakis GC, Bevington A, Smith AC, Clapp EL, Viana JL, Bishop NC, et al. Physical exercise in patients with severe kidney disease. Nephron 2010;115(1):c7‐c16. [MEDLINE: ] [DOI] [PubMed] [Google Scholar]
Koufaki 2002b {published data only}
- Koufaki P, Nash PF, Mercer TH. Assessing the efficacy of exercise training in patients with chronic disease. Medicine & Science in Sports & Exercise 2002;34(8):1234‐41. [MEDLINE: ] [DOI] [PubMed] [Google Scholar]
Kouidi 1998b {published data only}
- Kouidi E, Albani M, Natsis K, Megalopoulos A, Gigis P, Guiba‐Tziampiri O, et al. The effects of exercise training on muscle atrophy in haemodialysis patients. Nephrology Dialysis Transplantation 1998;13(3):685‐99. [MEDLINE: ] [DOI] [PubMed] [Google Scholar]
Kouidi 1999 {published data only}
- Kouidi E, Vassiliou S, Grekas D, Deligiannis A, Tourkantonis A. Exercise renal rehabilitation programs: Training during hemodialysis compared to the one on the off‐dialysis days [abstract]. Nephrology Dialysis Transplantation 1999;14(9):A182. [Google Scholar]
Kouidi 2000 {published data only}
- Kouidi E, Vassiliou S, Grekas D, Deligiannis A, Tourkantonis A. Cardiorespiratory adaptations to long‐term physical training in dialysis patients. Proceedings of the XXXVII Congress of ERA‐EDTA, European Renal Association;2000; Nice (France). 2000:306.
Kouidi 2001 {published data only}
- Kouidi EJ. Central and peripheral adaptations to physical training in patients with end‐stage renal disease. Sports Medicine 2001;31(9):651‐5. [MEDLINE: ] [DOI] [PubMed] [Google Scholar]
Kouidi 2002c {published data only}
- Kouidi E, Grekas D, Dombros N, Deligiannis A, Tourkantonis A. Exercise training after renal transplantation: Cardiac autonomic effects [abstract]. Nephrology Dialysis Transplantation 2002;17(Suppl 1):179. [Google Scholar]
Kouidi 2002d {published data only}
- Kouidi E. Exercise training in dialysis patients: why, when, and how?. Artificial Organs 2002;26(12):1009‐13. [MEDLINE: ] [DOI] [PubMed] [Google Scholar]
Kouidi 2003b {published data only}
- Kouidi E. Letter to the Editor. Artificial Organs 2003;27(9):859‐69. [EMBASE: 2003372784] [Google Scholar]
Kouidi 2004b {published data only}
- Kouidi E, Grekas D, Deligiannis A, Tourkantonis A. Outcomes of long‐term exercise training in dialysis patients: comparison of two training programs. Clinical Nephrology 2004;61 Suppl 1:S31‐8. [MEDLINE: ] [PubMed] [Google Scholar]
Kouidi 2004c {published data only}
- Kouidi E. Health‐related quality of life in end‐stage renal disease patients: the effects of renal rehabilitation. Clinical Nephrology 2004;61 Suppl1:S60‐71. [MEDLINE: ] [PubMed] [Google Scholar]
Kramer 2006 {published data only}
- Kramer H. Obesity and chronic kidney disease. Contributions to Nephrology 2006;151:1‐18. [MEDLINE: ] [DOI] [PubMed] [Google Scholar]
Krause 1990 {published data only}
- Krause R, Abel HH, Bennhold I, Koepchen HP. Physical exercise during hemodialysis [abstract]. Kidney International 1990;37(4):1182. [Google Scholar]
Krause 1993a {published data only}
- Krause R, Abel H‐H, Fuhrmann I. Exercise therapy in patients with chronic kidney disease [Bewegungs‐ und Sportherapie bei chronisch Nierenkranken]. In: Conradi E, Brenke R editor(s). Bewegungstherapie ‐ Grundlagen, Ergebnisse, Trends. First Edition. Berlin: Ullstein‐Mosby, 1993:189‐201. [ISBN:3‐86126‐507‐9] [Google Scholar]
Krause 1993b {published data only}
- Krause R, Fuhrmann I, Jurké MA. Indications, experiences and practical issues for exercise training in patients with chronic kidney disease [Indikationen, Erfahrungen und praktische Anleitungen für die Sporttherapie bei chronischen Nierenpatienten]. EDTNA‐ERCA Journal 1993;XX(1):52‐5. [Google Scholar]
Krause 1993c {published data only}
- Krause R, Muthny FA, Kielstein R, Daul A, Asmus G. Experiences of a rehabilitation exercise for patients with dialysis (a retrospective participant survey) [abstract] [Erfahrung mit Rehabilitationssport für Dialysepatienten (eine retrospektive Teilnehmerbefragung)]. Nieren‐Hochdruckkr 1991;20:423‐4. [Google Scholar]
Krause 1994 {published data only}
- Krause R, Fuhrmann I. Sports therapy as a prevention of complications in chronic renal patients [abtsract]. PECDED 1994;23(Suppl 1):S107. [Google Scholar]
Krause 2003a {published data only}
- Krause R, Weber F, Fuhrmann I, Schott E, Opitz M, Mienert K. Analysis sport of motor skills in dialysis patients and kidney transplant [abstract] [Analyse sportmotorischer Fertigkeiten bei Dialysepatienten und Nieren‐Transplantierten]. Deutsche Zeitschrift für Sportmedizin 2003;54(7‐8):S38. [Google Scholar]
Krause 2003b {published data only}
- Krause R, Mienert K, Schott E, Hopfenmüller J, Bergner D, Bühring M. Workouts ("Bettergometrie") during hemodialysis reduces atherosclerosis ‐ Risk Factors [abstract] [Ausdauertraining ("Bettergometrie") während Hämodialyse senkt Atherosklerose ‐ Risikofaktoren]. Deutsche Zeitschrift für Sportmedizin 2003;54(7‐8):46. [Google Scholar]
Krause 2004a {published data only}
- Krause R, Daul AE. Preface. Clinical Nephrology 2004;61(Suppl 1):S1. [PubMed] [Google Scholar]
Krause 2004b {published data only}
- Krause R, Daul AE. Nephrologists' view on exercise training in chronic kidney disease. Clinical Nephrology 2004;61(Suppl 1):S2‐4. [MEDLINE: ] [PubMed] [Google Scholar]
Krause 2004c {published data only}
- Krause R, Weber F, Fuhrmann I, Mienert K, Schott ES, Hopfenmüller W, et al. Training during hemodialysis rehabilitates ESRD patients for dialy‐living‐activities: comparative evaluation of functional status and patient's questionnaire [abstract SP452]. ERA‐EDTA Congress. 2004.
Kuge 2005 {published data only}
- Kuge N, Suzuki T, Isoyama S. Does handgrip exercise training increase forearm ischemic vasodilator responses in patients receiving hemodialysis?. Tohoku Journal of Experimental Medicine 2005;207(4):303‐12. [MEDLINE: ] [DOI] [PubMed] [Google Scholar]
Kutner 1982 {published data only}
- Kutner N, Cardenas D. Assessment of rehabilitation outcomes among chronic dialysis patients. American Journal of Nephrology 1982;2(3):128‐32. [MEDLINE: ] [DOI] [PubMed] [Google Scholar]
Kutner 1992 {published data only}
- Kutner NG, Cardenas DD, Bower JD. Rehabilitation, aging and chronic renal disease. American Journal of Physical Medicine & Rehabilitation 1992;71(2):97‐101. [MEDLINE: ] [DOI] [PubMed] [Google Scholar]
Kutner 1994 {published data only}
- Kutner NG, Lin LS, Fielding B, Brogan D, Hall WD. Continued survival of older hemodialysis patients: investigation of psychosocial predictors. American Journal of Kidney Diseases 1994;24(1):42‐9. [MEDLINE: ] [DOI] [PubMed] [Google Scholar]
Kutner 1997 {published data only}
- Kutner NG. Curtin RB. Oberley E. Sacksteder P. Fulfilling the promise: Linking rehabilitation interventions with ESRD patient outcomes. Dialysis & Transplantation 1997;26(5):282+284‐92. [EMBASE: 1997136709] [Google Scholar]
Kutner 2000 {published data only}
- Kutner NG, Zhang R, McClellan WM. Patient‐reported quality of life early in dialysis treatment: effects associated with usual exercise activity. Nephrology Nursing Journal 2000;27(4):357‐67. [MEDLINE: ] [PubMed] [Google Scholar]
Kutner 2007 {published data only}
- Kutner NG. How can exercise be incorporated into the routine care of patients on dialysis?. International Urology & Nephrology 2007;39(4):1281‐5. [MEDLINE: ] [DOI] [PubMed] [Google Scholar]
Kutsuna 2010 {published data only}
- Kutsuna T, Matsunaga A, Matsumoto T, Ishii A, Yamamoto K, Hotta K, et al. Physical activity is necessary to prevent deterioration of the walking ability of patients undergoing maintenance hemodialysis. Therapeutic Apheresis & Dialysis 2010;14(2):193‐200. [MEDLINE: ] [DOI] [PubMed] [Google Scholar]
Latos 1987 {published data only}
- Latos DL, Strimel D, Drews MH, Allison TG. Acid‐base and electrolyte changes following maximal and submaximal exercise in hemodialysis patients. American Journal of Kidney Diseases 1987;10(6):439‐45. [MEDLINE: ] [DOI] [PubMed] [Google Scholar]
Laville 1995 {published data only}
- Laville M, Fouque D. Muscular function in chronic renal failure. Advances in Nephrology From the Necker Hospital 1995;24:245‐69. [MEDLINE: ] [PubMed] [Google Scholar]
Leaf 2003a {published data only}
- Leaf DA, MacRae HS, Grant E, Kraut J. Isometric exercise increases the size of forearm veins in patients with chronic renal failure. American Journal of the Medical Sciences 2003;325(3):115‐9. [MEDLINE: ] [DOI] [PubMed] [Google Scholar]
Leaf 2003b {published data only}
- Leaf DA, Deitrick RW, Kleinman MT. Physical exercise training and lipid peroxidation in maintenance hemodialysis patients [abstract]. Medical & Science in Sports & Exercise 2003;35(5 Suppl 1):S236. [Google Scholar]
Leaf 2004 {published data only}
- Leaf DA, Kleinman MT, Deitrick RW. The effects of exercise on markers of lipid peroxidation in renal dialysis patients compared with control subjects. American Journal of the Medical Sciences 2004;327(1):9‐14. [MEDLINE: ] [DOI] [PubMed] [Google Scholar]
Lee 2005 {published data only}
- Lee SJ, Kim HJ, Yoo JS, Han JW, Park YS, Jung MY, et al. Effects of walking exercise program for health status in patients on continuous ambulatory peritoneal dialysis. Korean Journal of Nephrology 2005;24(1):126‐36. [Google Scholar]
Leikis 2004 {published data only}
- Leikis MJ, Petersen AC, Kent AB, McKenna MJ, McMahon LP. Exercise tolerance is similar for predialysis, haemodialysis and transplant patients when haemoglobin concentration is at physiological concentrations. [abstract]. Journal of the American Society of Nephrology 2004;15(Oct):551A. [Google Scholar]
Lennon 1986 {published data only}
- Lennon DL, Shrago E, Madden M, Nagle F, Hanson P, Zimmerman S. Carnitine status, plasma lipid profiles, and exercise capacity of dialysis patients: effects of a submaximal exercise program. MMetabolism: Clinical & Experimental 1986;35(8):728‐35. [MEDLINE: ] [DOI] [PubMed] [Google Scholar]
Lens 1989 {published data only}
- Lens XM, Oliva JA, Codinach P, Pascual R, Carrio J, Mallafre JM. Physical exercise and serum potassium in renal insufficiency [Ejercicio físico y potasio sérico en la insufficiencia renal]. Revista Clinica Espanola 1989;184(6):285‐8. [MEDLINE: ] [PubMed] [Google Scholar]
Leung 1999 {published data only}
- Leung RW, Headley SA, Manos TM, Coughlin MA, Germain MJ. Timing of intradialytic exercise on urea kinetics: Testing Smye's model [abstract]. Journal of the American Society of Nephrology 1999;10(Program & Abstracts):333A. [Google Scholar]
Leung 2000 {published data only}
- Leung RW, Headley SA, Germain MJ, Manos TM, Coughlin MA. Effect of intradialytic exercise on urea kinetics [abstract]. Medicine & Science in Sports & Exercise 2000;32(5 Suppl):S160. [Google Scholar]
Leung 2003 {published data only}
- Leung DK. Psychosocial aspects in renal patients. Peritoneal Dialysis International 2003;23 Suppl 2:S90‐94. [MEDLINE: ] [PubMed] [Google Scholar]
Leung 2004 {published data only}
- Leung R. Physiological effects of exercise during dialysis on chronic renal failure patients. Journal of Exercise Science & Fitness 2004;2(1):30‐5. [Google Scholar]
Levendoglu 2004 {published data only}
- Levendoglu F, Altintepe L, Okudan N, Ugurlu H, Gokbel H, Tonbul Z, et al. A twelve week exercise program improves the psychological status, quality of life and work capacity in hemodialysis patients. Journal of Nephrology 2004;17(6):826‐32. [MEDLINE: ] [PubMed] [Google Scholar]
Ling 2003 {published data only}
- Ling K, Wong F, Chan W, Chan S, Chan E, Cheng Y, et al. Effects of a home exercise program based on Tai Chi in patients with end‐stage renal disease. Peritoneal Dialysis International 2003;23(S2):S99‐S103. [PubMed] [Google Scholar]
Lisy 1981 {published data only}
- Lisy Z, Chrastek J, Tomasek R, Souckova E. A comparison of hypertensive and dialyzed persons response to physical exercise (author's transl) [Srovnani reakce hypertenznich a dialyzovanych osob na telesnou zatez]. Casopis Lekaru Ceskych 1981;120(8):224‐8. [MEDLINE: ] [PubMed] [Google Scholar]
Lo 1998 {published data only}
- Lo CY, Li L, Lo WK, Chan ML, So E, Tang S, et al. Benefits of exercise training in patients on continuous ambulatory peritoneal dialysis. American Journal of Kidney Diseases 1998;32(6):1011‐8. [MEDLINE: ] [DOI] [PubMed] [Google Scholar]
Lopez 1990 {published data only}
- Lopez Calbet JA, Nolla Sole JM, Ruiz Martin JM, Rozadilla A. [Physical exercise and serum potassium in kidney insufficiency] [Ejercicio físico y potasio sérico en la insufficienca renal]. Rev Clin Esp 1990;186(3):145‐6. [PubMed] [Google Scholar]
LORD Study 2009 {published data only}
- Fassett RG, Robertson IK, Geraghty DP, Ball MJ, Burton NW, Coombes JS. Physical activity levels in patients with chronic kidney disease entering the LORD trial. Medicine & Science in Sports & Exercise 2009;41(5):985‐91. [MEDLINE: ] [DOI] [PubMed] [Google Scholar]
Low 2004 {published data only}
- Low WM. Training program in action: the National kidney foundation exercise program. Journal of Aging & Physical Activity 2004;12(3):445. [Google Scholar]
Lundin 1987 {published data only}
- Lundin AP, Stein RA, Brown CD, LaBelle P, Kalman FS, Delano BG, et al. Fatigue, acid‐base and electrolyte changes with exhaustive treadmill exercise in hemodialysis patients. Nephron 1987;46(1):57‐62. [MEDLINE: ] [DOI] [PubMed] [Google Scholar]
Lundin 1991 {published data only}
- Lundin AP, Akerman MJ, Chesler RM, Delano BG, Goldberg N, Stein RA, et al. Exercise in hemodialysis patients after treatment with recombinant human erythropoietin. Nephron 1991;58(3):315‐9. [MEDLINE: ] [DOI] [PubMed] [Google Scholar]
MacDonald 2004 {published data only}
MacDonald 2005 {published data only}
- Macdonald JH, Marcora SM, Jibani M, Phanish MK, Holly J, Lemmey AB. Intradialytic exercise as anabolic therapy in haemodialysis patients ‐ a pilot study. Clinical Physiology & Functional Imaging 2005;25(2):113‐8. [MEDLINE: ] [DOI] [PubMed] [Google Scholar]
Macdonald 2009 {published data only}
- Macdonald JH, Kirkman D, Jibani M. Kidney transplantation: a systematic review of interventional and observational studies of physical activity on intermediate outcomes. Advances in Chronic Kidney Disease 2009;16(6):482‐500. [MEDLINE: ] [DOI] [PubMed] [Google Scholar]
MacDougal 1998 {published data only}
- Macdougall IC. Quality of life and anemia: The nephrology experience. Seminars in Oncology 1998;25(3 Suppl 7):39‐42. [MEDLINE: ] [PubMed] [Google Scholar]
MacLaughlin 2010 {published data only}
- MacLaughlin H, Cook S, Holesgrove M, Kariyawasam D, Newell G, Roseke M, et al. Weight loss and reduction in cardiovascular risk factors can be achieved with a multidisciplinary programme combining diet, exercise and orlistat (Xenical (R)) in patients with chronic kidney disease [abstract]. Nephrology Dialysis Transplantation 2006;21 (Suppl 4). [Google Scholar]
- MacLaughlin HL, Cook SA, Kariyawasam D, Roseke M, Niekerk M, Macdougall IC. Nonrandomized trial of weight loss with orlistat, nutrition education, diet, and exercise in obese patients with CKD: 2‐year follow‐up. American Journal of Kidney Diseases 2010;55(1):69‐76. [MEDLINE: ] [DOI] [PubMed] [Google Scholar]
Majchrzak 2008 {published data only}
- Majchrzak KM, Pupim LB, Flakoll PJ, Ikizler TA. Resistance exercise augments the acute anabolic effects of intradialytic oral nutritional supplementation. Nephrology Dialysis Transplantation 2008;23(4):1362‐9. [MEDLINE: ] [DOI] [PubMed] [Google Scholar]
Malagoni 2008 {published data only}
- Malagoni AM, Catizone L, Mandini S, Soffritti S, Manfredini R, Boari B, et al. Acute and long‐term effects of an exercise program for dialysis patients prescribed in hospital and performed at home. Journal of Nephrology 2008;21(6):871‐8. [MEDLINE: ] [PubMed] [Google Scholar]
Mancuso 2002 {published data only}
- Mancuso D, Cianfrone P, Mazza G, Vecchi ML, Comi N, Caglioti A, et al. Post‐exercise proteinuria in patients (pts) with IgA nephropathy in baseline conditions and after treatment with ramipril (R) [abstract]. Nephrology Dialysis Transplantation 2002;17(Suppl 1):209‐10. [Google Scholar]
Manfredini 2009 {published data only}
- Manfredini F, Rigolin GM, Malagoni AM, Catizone L, Mandini S, Sofritti O, et al. Exercise training and endothelial progenitor cells in haemodialysis patients. Journal of International Medical Research 2009;37(2):534‐40. [MEDLINE: ] [DOI] [PubMed] [Google Scholar]
Mao 2002 {published data only}
- Mao P, Xu W, Chen H. The effect of exercise during hemodialysis on bone mineral density and hemodialysis adequacy [abstract]. Journal of the American Society of Nephrology 2002;13(Program & Abstracts):708A‐709A. [Google Scholar]
Marlowe 2001 {published data only}
- Marlowe E. Rehabilitation concerns in the treatment of patients with chronic renal failure. American Journal of Physical Medicine & Rehabilitation 2001;80(10):762‐4. [MEDLINE: ] [DOI] [PubMed] [Google Scholar]
Martin 2003 {published data only}
- Martin CJ, Gaffney S. Exercise in dialysis: magic bullet or unnecessary risk?. Nephrology Nursing Journal 2003;30(5):580‐1. [MEDLINE: ] [PubMed] [Google Scholar]
Matsuoka 1991 {published data only}
- Matsuoka K, Nakao T, Atsumi Y, Takekoshi H. Exercise regimen for patients with diabetic nephropathy. Journal of Diabetic Complications 1991;5(2‐3):98‐100. [MEDLINE: ] [DOI] [PubMed] [Google Scholar]
Mercer 2002 {published data only}
- Mercer TH, Crawford C, Gleeson NP, Naish PF. Low‐volume exercise rehabilitation improves functional capacity and self‐reported functional status of dialysis patients. American Journal of Physical Medicine & Rehabilitation 2002;81(3):162‐7. [MEDLINE: ] [DOI] [PubMed] [Google Scholar]
Mercer 2003 {published data only}
- Mercer T, Koufaki P, Naish P. Favourable changes in functional capacity, SGA and chronic systemic inflammation following exercise training of dialysis patients [abstract T517]. ERA‐EDTA Congress. 2003.
Mercer 2004 {published data only}
- Mercer TH, Koufaki P, Naish PF. Nutritional status, functional capacity and exercise rehabilitation in end‐stage renal disease. Clinical Nephrology 2004;61 Suppl 1:S54‐9. [MEDLINE: ] [PubMed] [Google Scholar]
Miller 1987 {published data only}
- Miller TD, Squires RW, Gau GT, Ilstrup DM, Frohnert PP, Sterioff S. Graded exercise testing and training after renal transplantation ‐ a preliminary study. Mayo Clinic Proceedings 1987;62(9):773‐7. [MEDLINE: ] [DOI] [PubMed] [Google Scholar]
Miller 2002 {published data only}
- Miller BW, Cress CL, Johnson ME, Nichols DH, Schnitzler, MA. Exercise during hemodialysis decreases the use of antihypertensive medications. American Journal of Kidney Diseases 2002;39(4):828‐33. [MEDLINE: ] [DOI] [PubMed] [Google Scholar]
Mishkin 1998 {published data only}
- Mishkin GJ, Mishkin MA, Vassalotti JA, Bosch JP. Light exercise during hemodialysis (HD) enhances vascular refilling rates (RR) [abstract]. Journal of the American Society of Nephrology 1998;9(Program & Abstracts):300A. [Google Scholar]
Miskulin 1999 {published data only}
- Miskulin DC, Sepandj F, Murphy B. The effects of intradialytic exercise on urea clearance [abstract]. Journal of the American Society of Nephrology 1999;10(Program & Absracts):334A. [Google Scholar]
Miyamura 2000 {published data only}
- Miyamura M. Kidney disease and physical activity. Nippon Rinsho ‐ Japanese Journal of Clinical Medicine 2000;58 Suppl:491‐7. [MEDLINE: ] [PubMed] [Google Scholar]
Moinuddin 2008 {published data only}
- Moinuddin I, Leehey DJ. A comparison of aerobic exercise and resistance training in patients with and without chronic kidney disease. Advances in Chronic Kidney Disease 2008;15(1):83‐96. [MEDLINE: ] [DOI] [PubMed] [Google Scholar]
Momen 2005 {published data only}
- Momen A, Bower D, Leuenberger UA, Boehmer J, Lerner S, Alfrey EJ, et al. Renal vascular response to static handgrip exercise: sympathetic vs. autoregulatory control. American Journal of Physiology ‐ Heart & Circulatory Physiology 2005;289(4):H1770‐6. [MEDLINE: ] [DOI] [PubMed] [Google Scholar]
Moore 1990 {published data only}
- Moore GE, Painter P, Stray‐Gundersen J, Brinker KR, Mitchell JH. Mechanisms of adaptation to exercise in hemodialysis patients [abstract]. Kidney International 1990;37(1):311. [Google Scholar]
Moore 1993 {published data only}
- Moore GE, Parsons DB, Stray‐Gundersen J, Painter PL, Brinker KR, Mitchell JH. Uremic myopathy limits aerobic capacity in hemodialysis patients. American Journal of Kidney Diseases 1993;22(2):277‐87. [MEDLINE: ] [DOI] [PubMed] [Google Scholar]
Moore 1998 {published data only}
- Moore GE, Painter PL, Brinker KR, Stray‐Gundersen J, Mitchell JH. Cardiovascular response to submaximal stationary cycling during hemodialysis. American Journal of Kidney Diseases 1998;31(4):631‐7. [MEDLINE: ] [DOI] [PubMed] [Google Scholar]
Morales 2002 {published data only}
- Morales JM, Gonzalez Molina M, Campistol JM, Castillo D, Anaya F, Oppenheimer F, et al. Prevention of cardiovascular risk in renal transplantation. Consensus document [Prevención del riesgo cardiovascular en el transplante renal. Documento de consenso]. Nefrologia 2002;22 Suppl 4:35‐56. [MEDLINE: ] [PubMed] [Google Scholar]
Moran 1984 {published data only}
- Rodriguez Moran M, Almazan Enriquez A, Ramos Boyero M, Rodriguez Rodriguez JM, Gomez Alonso A. Hand exercise effect in maturation and blood flow of dialysis arteriovenous fistulas ultrasound study. Angiology 1984;35(10):641‐4. [MEDLINE: ] [DOI] [PubMed] [Google Scholar]
Moros 1993 {published data only}
- Moros Garcia MT, Villarroya Aparicio A, Moros Garcia J. Survey results concerning activity and physical exercise in haemodialysis patients in Saragossa (Spain). Rehabilitacion Fisica XXI 1993;4(16):16‐21. [EMBASE: 1993253776] [Google Scholar]
Moros 1995 {published data only}
- Moros MT, Moros J, Ros R, Villarroya A, Coarasa A. Effects of exercise in the elderly with chronic renal failure [Efectos del entrenamiento en el insuficiente renal crónico anciano]. Revista de Medicina de la Universidad de Navarra 1995;39(3):136‐40. [MEDLINE: ] [PubMed] [Google Scholar]
Moug 2004 {published data only}
- Moug SJ, Grant S, Creed G, Boulton Jones M. Exercise during haemodialysis: West of Scotland pilot study. Scottish Medical Journal 2004;49(1):14‐7. [MEDLINE: ] [DOI] [PubMed] [Google Scholar]
Mustata 2004 {published data only}
- Mustata S, Chan C, Lai V, Miller JA. Impact of an exercise program on arterial stiffness and insulin resistance in hemodialysis patients. Journal of the American Society of Nephrology 2004;15(10):2713‐8. [MEDLINE: ] [DOI] [PubMed] [Google Scholar]
Mustata 2005 {published data only}
- Mustafa S, Cooper L, Langrick N, Simon N, Jassal SV, Oreopoulos DG. The effect of a Tai Chi exercise program on quality of life in patients on peritoneal dialysis: a pilot study. Peritoneal Dialysis International 2005;25(3):291‐4. [MEDLINE: ] [PubMed] [Google Scholar]
Mustata 2007 {published data only}
- Mustata S, Groeneveld S, Kiland KJ, Stone JA, Manns B, Davidson W, et al. Effects of exercise training on physical fitness, arterial stiffness and quality of life in patients with chronic kidney disease [abstract]. Journal of the American Society of Nephrology 2007;18(Abstracts):585A‐6A. [Google Scholar]
Naish 2001 {published data only}
- Naish PF, Koufaki P, Percer T. Nutritional status is associated with physical functioning and quality of life in end stage renal disease patients [abstract]. Journal of the American Society of Nephrology 2001;12(Program & Abstracts):341A. [Google Scholar]
Navaneethan 2009 {published data only}
- Navaneethan SD, Yehnert H, Moustarah F, Schreiber MJ, Schauer PR, Beddhu S. Weight loss interventions in chronic kidney disease: A systematic review and meta‐analysis. Clinical Journal of the American Society of Nephrology: CJASN 2009;4(10):1565‐74. [MEDLINE: ] [DOI] [PMC free article] [PubMed] [Google Scholar]
Noakes 1993 {published data only}
- Noakes TD, Diesel W, Moore GE, Mitchell JH. VO(2peak) and end‐stage renal disease. Medicine & Science in Sports & Exercise 1993;25(12):1429‐31. [EMBASE: 1993358395] [DOI] [PubMed] [Google Scholar]
Noviana 2004 {published data only}
- Noviana L, Staples D, Chan M, Cheema B, Pang G, Kelly J, et al. Nutritional status and physical performance in a sample of patients undergoing maintenance haemodialysis [abstract]. Proceedings of the 12th International Congress on Nutrition and Metabolism in Renal Disease. 2004.
Nowicki 2006 {published data only}
Nyberg 1995 {published data only}
- Nyberg G, Hallste G, Norden G, Hadimeri H, Wramner L. Physical performance does not improve in elderly patients following successful kidney transplantation. Nephrology Dialysis Transplantation 1995;10(1):86‐90. [MEDLINE: ] [PubMed] [Google Scholar]
Oberley 1994 {published data only}
- Oberley ET, Compton A. Nursing interventions for rehabilitating renal patients. Anna Journal 1994;21(7):407‐11. [MEDLINE: ] [PubMed] [Google Scholar]
Oberley 1996 {published data only}
- Oberley ET, Schatell DR. Home hemodialysis: survival, quality of life, and rehabilitation. Advances in Renal Replacement Therapy 1996;3(2):147‐53. [MEDLINE: ] [DOI] [PubMed] [Google Scholar]
Oberley 2000 {published data only}
- Oberley ET, Sadler JH, Alt PS. Renal rehabilitation: obstacles, progress, and prospects for the future. American Journal of Kidney Diseases 2000;35(4 Suppl 1):S141‐7. [MEDLINE: ] [DOI] [PubMed] [Google Scholar]
Oder 2003 {published data only}
- Oder TF, Teodorescu V, Uribarri J. Effect of exercise on the diameter of arteriovenous fistulae in hemodialysis patients. ASAIO Journal 2003;49(5):554‐5. [MEDLINE: ] [DOI] [PubMed] [Google Scholar]
Oh‐Park 2002 {published data only}
- Oh‐Park M, Fast A, Gopal S, Lynn R, Frei G, Drenth R, et al. Exercise for the dialyzed: aerobic and strength training during hemodialysis. American Journal of Physical Medicine & Rehabilitation 2002;81(11):814‐21. [MEDLINE: ] [DOI] [PubMed] [Google Scholar]
O´Hare 2003 {published data only}
- O'Hare AM, Tawney K, Bacchetti P, Johansen KL. Decreased survival among sedentary patients undergoing dialysis: Results from the dialysis morbidity and mortality study wave 2. American Journal of Kidney Diseases 2003;41(2):447‐54. [MEDLINE: ] [DOI] [PubMed] [Google Scholar]
O´Moore 1999 {published data only}
- O'Moore B. Regular exercise: vitally important for the transplant recipient. Advances in Renal Replacement Therapy 1999;6(2):187‐8. [MEDLINE: ] [DOI] [PubMed] [Google Scholar]
Painter 1983 {published data only}
- Painter P, Zimmerman SW. The role of exercise in the long term rehabilitation of patients with end stage renal disease. AANNT Journal 1983;10(6):41‐6. [MEDLINE: ] [PubMed] [Google Scholar]
Painter 1985 {published data only}
- Painter P, HIill M, Nelson‐Worel J, Thornberry D, Shelp W, Harrington NA, et al. Effects of exercise training during hemodialysis [abstract]. Kidney International 1985;27(1):149. [Google Scholar]
Painter 1986a {published data only}
- Painter P, Hanson P, Besozzi M, Zimmerman S, Glass N. Cardiovascular responses to exercise post renal transplantation [abstract]. Kidney International 1986;29(1):434. [Google Scholar]
Painter 1986b {published data only}
- Painter PL, Nelson‐Worel JN, Hill MM, Thornbery DR, Shelp WR, Harrington AR, et a, Effects of exercise training during hemodialysis. Nephron 1986;43(2):87‐92. [MEDLINE: ] [DOI] [PubMed] [Google Scholar]
Painter 1986c {published data only}
- Painter P. Exercise capacity in hemodialysis, CAPD and renal transplant patients. Nephron 1986;42(1):47‐51. [MEDLINE: ] [DOI] [PubMed] [Google Scholar]
Painter 1986d {published data only}
- Painter P, Zimmerman SW. Exercise in end‐stage renal disease. American Journal of Kidney Diseases 1986;7(5):386‐94. [MEDLINE: ] [DOI] [PubMed] [Google Scholar]
Painter 1987 {published data only}
- Painter P. Participation in exercise training during hemodialysis ‐ A multicenter trial program [abstract]. Medicine & Science in Sports & Exercise 1987;19(2 Suppl):S19. [Google Scholar]
Painter 1988a {published data only}
- Painter P. Exercise training during hemodialysis: Rates of participation. Dialysis & Transplantation 1988;17(4):165‐8. [EMBASE: 1988111246] [Google Scholar]
Painter 1988b {published data only}
- Painter PL. Exercise in end‐stage renal disease. Exercise & Sport Sciences Reviews 1988;16:305‐39. [MEDLINE: ] [PubMed] [Google Scholar]
Painter 1994a {published data only}
- Painter P. The importance of exercise training in rehabilitation of patients with end‐stage renal disease. American Journal of Kidney Diseases 1994;24(1 Suppl 1):S2‐9. [MEDLINE: ] [PubMed] [Google Scholar]
Painter 1994b {published data only}
- Painter P. Exercise for individuals with end‐stage renal disease. In: Goldberg L, Elliot DL editor(s). Exercise for prevention and treatment of illness. Philadelphia: FA Davis Co, 1994:289‐300. [Google Scholar]
Painter 1994c {published data only}
- Painter P, Carlson L. Case study of the anemic patient: epoetin alfa‐‐focus on exercise. Anna Journal 1994;21(3):304‐7. [MEDLINE: ] [PubMed] [Google Scholar]
Painter 1994d {published data only}
- Painter P. Exercise gives ESRD patients strength and self‐esteem. Nephrol News & Issues 1994;8(9):26‐7. [MEDLINE: ] [PubMed] [Google Scholar]
Painter 1995 {published data only}
- Painter P, Blagg CR, Moore GE. Exercise for the dialysis patients ‐ A guide for the nephrologist. Buffalo: Medical Media Associates Inc, 1995. [Google Scholar]
Painter 1997 {published data only}
- Painter P. Rehabilitation on the other side of the world ‐ Hong Kong encourages ESRD patients to stay healthy with exercise. Nephrology News & Issues 1997;11(10):57‐9. [MEDLINE: ] [PubMed] [Google Scholar]
Painter 1998 {published data only}
- Painter P, Stewart A, Tomlanovich S, Dibble S. Health related quality of life (HRQOL) in hemodialysis patients and transplant recipients: The effects of physical activity [abstract]. Journal of the American Society of Nephrology 1998;9(Program & Abstracts):692A. [Google Scholar]
Painter 1999a {published data only}
- Painter P, Johansen K. Physical functioning in end‐stage renal disease. Introduction: a call to activity. Advances in Renal Replacement Therapy 1999;6(2):107‐9. [MEDLINE: ] [DOI] [PubMed] [Google Scholar]
Painter 1999b {published data only}
- Painter P, Stewart AL, Carey S. Physical functioning: definitions, measurement, and expectations. Advances in Renal Replacement Therapy 1999;6(2):110‐23. [MEDLINE: ] [DOI] [PubMed] [Google Scholar]
Painter 1999c {published data only}
- Painter P, Johansen K. Physical functioning in end‐stage renal disease. Introduction: a call to activity. Advances in Renal Replacement Therapy 1999;6(2):107‐9. [MEDLINE: ] [DOI] [PubMed] [Google Scholar]
Painter 1999d {published data only}
- Painter P. Exercise after renal transplantation. Advances in Renal Replacement Therapy 1999;6(2):159‐64. [MEDLINE: ] [DOI] [PubMed] [Google Scholar]
Painter 1999e {published data only}
- Painter PL, Carlson L, Carey S, Myll J. Improvement in measured and self‐reported physical functioning in hemodialysis patients with exercise [abstract]. Journal of the American Society of Nephrology 1999;10(Program & Abstracts):84A. [Google Scholar]
Painter 1999f {published data only}
- Painter P, Carey S, Carlson L, Myll J. Health‐related quality of life in hemodialysis patients: Results of the Renal Exercise Demonstration Project [abstract]. Medicine & Science in Sports & Exercise 1999;31(5 Suppl):S360. [Google Scholar]
Painter 2000a {published data only}
- Painter P, Carlson L, Carey S, Paul SM, Myll J. Physical functioning and health‐related quality‐of‐life changes with exercise training in hemodialysis patients. American Journal of Kidney Diseases 2000;35(3):482‐92. [MEDLINE: ] [DOI] [PubMed] [Google Scholar]
Painter 2000b {published data only}
- Painter P, Carlson L, Carey S, Paul SM, Myll J. Low‐functioning hemodialysis patients improve with exercise training. American Journal of Kidney Diseases 2000;36(3):600‐8. [MEDLINE: ] [DOI] [PubMed] [Google Scholar]
Painter 2005 {published data only}
- Painter P. Physical functioning in end‐stage renal disease patients: update 2005. Hemodialysis International 2005;9(3):218‐35. [MEDLINE: ] [DOI] [PubMed] [Google Scholar]
Painter 2006 {published data only}
- Painter P. Improving physical functioning: time to be a part of routine care. American Journal of Kidney Diseases 2006;48(1):167‐70. [MEDLINE: ] [DOI] [PubMed] [Google Scholar]
Painter 2008 {published data only}
- Painter P. Exercise in chronic disease: physiological research needed. Exercise & Sport Sciences reviews 2008;36(2):83‐90. [MEDLINE: ] [DOI] [PubMed] [Google Scholar]
Painter 2009 {published data only}
- Painter P. End‐stage renal disease. In: Egrman JK, Gordon PM, Visich PS, Keteyian SJ editor(s). Clinical exercise physiology. 2nd Edition. Champaign: Human Kinetics, 2009:265‐77. [Google Scholar]
Pardell 2005 {published data only}
- Pardell H. High blood pressure, smoking and cardiovascular risk. Journal of Hypertension 2005;23(1):219‐21. [MEDLINE: ] [DOI] [PubMed] [Google Scholar]
Park 2008 {published data only}
- Park J, Campese VM, Middlekauff HR. Exercise pressor reflex in humans with end‐stage renal disease. American Journal of Physiology ‐ Regulatory Integrative & Comparative Physiology 2008;295(4):R1188‐94. [MEDLINE: ] [DOI] [PMC free article] [PubMed] [Google Scholar]
Parrish 1981 {published data only}
- Parrish AE. The effect of minimal exercise on the blood lactate in azotemic subjects. Clinical Nephrology 1981;16(1):35‐9. [MEDLINE: ] [PubMed] [Google Scholar]
Payne 1972 {published data only}
- Payne RM, Soderblom RE, Lobstein P, Hull AR, Mullins CB. Exercise‐induced hemodynamic effects of arteriovenous fistulas used for hemodialysis. Kidney International 1972;2(6):344‐48. [MEDLINE: ] [DOI] [PubMed] [Google Scholar]
Pechter 2003a {published data only}
- Pechter U, Ots M, Mesikepp S, Zilmer K, Kullissaar T, Vihalemm T, et al. Beneficial effects of water‐based exercise in patients with chronic kidney disease. International Journal of Rehabilitation Research 2003;26(2):153‐6. [MEDLINE: ] [DOI] [PubMed] [Google Scholar]
Pechter 2003b {published data only}
- Pechter U, Maaroos J, Mesikepp S, Veraksits A, Ots M. Regular low‐intensity aquatic exercise improves cardio‐respiratory functional capacity and reduces proteinuria in chronic renal failure patients. Nephrology Dialysis Transplantation 2003;18(3):624‐5. [MEDLINE: ] [DOI] [PubMed] [Google Scholar]
Pedersen 1986 {published data only}
- Pedersen EB, Danielsen H, Nielsen AH, Knudsen F, Jensen T, Kornerup HJ, et al. Effect of exercise on plasma concentrations of arginine vasopressin, angiotensin II and aldosterone in hypertensive and normotensive renal transplant recipients. Scandinavian Journal of Clinical & Laboratory Investigation 1986;46(2):151‐7. [MEDLINE: ] [DOI] [PubMed] [Google Scholar]
Pennell 2004 {published data only}
- Pennell P, Rojas C, Asif A, Rossini E. Managing metabolic complications of peritoneal dialysis. Clinical Nephrology 2004;62(1):35‐43. [MEDLINE: ] [DOI] [PubMed] [Google Scholar]
Pewen 1990 {published data only}
- Pewen WF, Roy BA, Christie LG, Purvis ML, Walker JV, Carlson K. Effects of a 12 week program of treadmill exercise on maximal exercise capacity in continuous ambulatory peritoneal‐dialysis (CAPD) [abstract]. Kidney International 1990;37:333. [Google Scholar]
Phanish 2003 {published data only}
- Phanish MK, Marcora SM, Lemmey AB. Malnutrition, chronic inflammation and atherosclerosis in dialysis patients. Nephrology Dialysis Transplantation 2003;18(2):446. [MEDLINE: ] [DOI] [PubMed] [Google Scholar]
Pianta 1999a {published data only}
- Pianta TF. The role of physical therapy in improving physical functioning of renal patients. Advances in Renal Replacement Therapy 1999;6(2):149‐58. [MEDLINE: ] [DOI] [PubMed] [Google Scholar]
Pianta 1999b {published data only}
- Pianta TF, Kutner NG. Improving physical functioning in the elderly dialysis patient: relevance of physical therapy. ANNA Journal 1999;26(1):11‐4. [MEDLINE: ] [PubMed] [Google Scholar]
Plentz 2003 {published data only}
- Plentz R, Moreira P, Silva A, Consolim‐Colombo F, Irigoyen MC. Effects of exercise training in cardiorespiratory function in end‐stage renal patients [abstract T565]. ERS‐EDTA. 2003.
Poortmans 1997 {published data only}
- Poortmans JR, Hermans L, Vandervliet A, Niset G, Godefroid C. Renal responses to exercise in heart and kidney transplant patients. Transplant International 1997;10(4):323‐7. [MEDLINE: ] [DOI] [PubMed] [Google Scholar]
Poortmans 1998 {published data only}
- Poortmans JR, Niset G, Godefroid C, Lamotte M. Responses to exercise and limiting factors in hemodialysis and renal transplant patients. In: Rieu, M editor(s). Medicine and Sport Science: Physical work capacity in organ transplantation. Vol. 42, New York: S. Karger AG, 1998:113‐33. [Google Scholar]
Price 1996 {published data only}
- Price SG. Hydro‐therapy in CAPD training. Edtna‐Erca Journal 1996;22(3):8‐10. [MEDLINE: ] [PubMed] [Google Scholar]
Pugh‐Clarke 2002 {published data only}
- Pugh‐Clarke K, Koufaki P, Rowley V, Mercer T, Naish P. Improvement in quality of life of dialysis patients during six months of exercise. Edtna‐Erca Journal 2002;28(1):11‐2. [MEDLINE: ] [DOI] [PubMed] [Google Scholar]
Pupim 2004 {published data only}
- Pupim LB, Flakoll PJ, Levenhagen DK, Ikizler TA. Exercise augments the acute anabolic effects of intradialytic parenteral nutrition in chronic hemodialysis patients. American Journal of Physiology ‐ Endocrinology & Metabolism 2004;286(4):E589‐97. [MEDLINE: ] [DOI] [PubMed] [Google Scholar]
Qing 1999 {published data only}
- Qing DP, Tang ZT, Storer T, Casaburi R, Sawelson S, Kopple JD, et al. Effect of exercise training of gene expression for IGF‐1, IGF‐R and IGFBPs in skeletal muscle of maintenance hemodialysis patients [abstract]. Journal of the American Society of Nephrology 1999;10(Program & Abstracts):266A. [Google Scholar]
Rehacek 1979 {published data only}
- Rehacek J, Rauser V. Influencing uraemic patients, neuromuscular system by exercise during dialysis (author's transl) [Ovlivneni nervosvaloveho aparatu uremiku zatezi pri dialyze]. Casopis Lekaru Ceskych 1979;118(39):1190‐2. [MEDLINE: ] [PubMed] [Google Scholar]
Richard 2005 {published data only}
- Richard R, Verdier JC, Doutreleau S, Piquard F, Geny B, Rieu M. Exercise limitation in trained heart and kidney transplant recipients: central and peripheral limitations. Journal of Heart & Lung Transplantation 2005;24(11):1774‐80. [MEDLINE: ] [DOI] [PubMed] [Google Scholar]
Richardson 1999a {published data only}
- Richardson D, Lindley EJ, Will EJ, Smye SW. The effect of timing and duration of exercise on hemodialysis (HD) dose and patient hemodynamics [abstract]. Journal of the American Society of Nephrology 1999;10(Program & AbstractS):337A. [Google Scholar]
Richardson 1999b {published data only}
- Richardson D, Lindley EJ, Will EJ, Smye SW. Demonstrating increased clearance of urea during exercise on haemodialysis (HD). A methodological study [abstract]. Journal of the American Society of Nephrology 1999;10(Program & Abstracts):337A. [Google Scholar]
Ridley 1999 {published data only}
- Ridley J, Hoey K, Ballagh‐Howes N. The exercise‐during‐hemodialysis program: report on a pilot study. Cannt Journal 1999;9(3):20‐6. [MEDLINE: ] [PubMed] [Google Scholar]
Rieu 1996 {published data only}
- Rieu M. Physical exercise and transplantation [abstract]. Science & Sports 1996;11(1):3‐4. [EMBASE: 1994220091] [Google Scholar]
Rodicio 2001 {published data only}
- Rodicio JL, Alcazar JM. Hypertension in chronic renal failure. Journal of Hypertension 2001;19(11):2111‐4. [MEDLINE: ] [DOI] [PubMed] [Google Scholar]
Ronco 1995 {published data only}
- Ronco C, Crepaldi C, Brendolan A, Greca G. Intradialytic exercise increases effective dialysis efficiency and reduces rebound [abstract]. Journal of the American Society of Nephrology 1995;6:612A. [Google Scholar]
Rosales 1998 {published data only}
- Rosales LM, Schneditz D, Chmielnicki H, Shaw K, Levin NW. Exercise and extracorporeal blood cooling during hemodialysis. ASAIO Journal 1998;44(5):M574‐8. [MEDLINE: ] [DOI] [PubMed] [Google Scholar]
Ross 1989 {published data only}
- Ross DL, Grabeau GM, Smith S, Seymour M, Knierim N, Pitetti KH. Efficacy of exercise for end‐stage renal disease patients immediately following high‐efficiency hemodialysis: a pilot study. American Journal of Nephrology 1989;9(5):376‐83. [MEDLINE: ] [DOI] [PubMed] [Google Scholar]
Rus 2003 {published data only}
- Rus RR, Ponikvar R, Kenda RB, Buturovic‐Ponikvar J. Effect of local physical training on the forearm arteries and veins in patients with end‐stage renal disease. Blood Purification 2003;21(6):389‐94. [MEDLINE: ] [DOI] [PubMed] [Google Scholar]
Rössler 1979 {published data only}
- Rössler E, Aurich E, Strangfeld D, Schimmelpfennig R. The effect of training on the physical fitness of patients with chronic kidney failure [Der Einfluss korperlichen Trainings auf die physische Leistungsfahigkeit chronisch niereninsuffizienter Patienten]. Zeitschrift fur Urologie und Nephrologie 1979;72(2):119‐28. [MEDLINE: ] [PubMed] [Google Scholar]
Sabry 2009 {published data only}
- Sabry AA, Ghaith O, Medhat T, George SK, Elshafey EM. Is there a role for oral L‐carnitine therapy in anemia and cardiac dysfunction management in Egyptian patients on maintenance hemodialysis?. European Journal of General Medicine 2009;6(2):7‐15. [EMBASE: 2009353516] [Google Scholar]
Sacksteder 2001 {published data only}
- Sacksteder P, Schatell D. The Renaissance in renal rehabilitation: 2001. Part. II. Nephrol News & Issues 2001;15(11):61‐8. [MEDLINE: ] [PubMed] [Google Scholar]
Sadler 1998 {published data only}
- Sadler JH. Health promotion for end‐stage renal disease patients. Advances in Renal Replacement Therapy 1998;5(4):275‐85. [MEDLINE: ] [DOI] [PubMed] [Google Scholar]
Sagiv 1988 {published data only}
- Sagiv M, Rudoy J, Rotstein A, Dotan R, Grodjinovski A, Fisher N, et al. Maximal exercise response in hemodialysis patients [abstract]. Medicine & Science in Sports & Exercise 1988;20(2 Suppl):S27. [Google Scholar]
Saitoh 2007 {published data only}
- Saitoh M, Sakamoto J, Uewaki R, Maeda T, Matsunaga A, Masuda T. Long‐term following‐up of the physical function and ADL level after home‐based exercise training in patients of chronic renal failure [abstract 37‐22]. The World Congress of Physiotherapy; 2007, June; Vancouver (Canada). 2007.
Sakkas 2003a {published data only}
- Sakkas GK, Sargeant AJ, Mercer TH, Ball D, Koufaki P, Karatzaferi C, et al. Changes in muscle morphology in dialysis patients after 6 months of aerobic exercise training. Nephrology Dialysis Transplantation 2003;18(9):1854‐61. [MEDLINE: ] [DOI] [PubMed] [Google Scholar]
Sakkas 2008 {published data only}
- Sakkas GK, Hadjigeorgiou GM, Karatzaferi C, Maridaki MD, Giannaki CD, Mertens PR, et al. Intradialytic aerobic exercise training ameliorates symptoms of restless legs syndrome and improves functional capacity in patients on hemodialysis: a pilot study. ASAIO Journal 2008;54(2):185‐90. [MEDLINE: ] [DOI] [PubMed] [Google Scholar]
Sam 1992 {published data only}
- Sam MV, Swanepoel C, Noakes TD. Effects of exercise training and recombinant human erythropoietin (EPO) in patients receiving chronic haemodialysis [abstract]. Kidney International 1993;43(5):1182. [Google Scholar]
Sam 1993 {published data only}
- Sam MV, Swanepoel CR, Noakes TD. Effects of exercise training and recombinant human erythropoietin (rHuEPO) in patients receiving chronic haemodialysis [abstract]. Medicine & Science in Sports & Exercise 1993;25(5 Suppl):S14. [Google Scholar]
Schatell 1999 {published data only}
- Schatell D, Thompson N, Oberley E. Life Options Patient Opinion Study identifies keys to a long life for dialysis patients. Nephrology News & Issues 1999;13(4):24‐6. [MEDLINE: ] [PubMed] [Google Scholar]
Schrag 1999 {published data only}
- Schrag WF, Campbell M, Ewert J, Hartley S, Niemann J, Ross D. Multidisciplinary team renal rehabilitation: interventions and outcomes. Advances in Renal Replacement Therapy 1999;6(3):282‐8. [MEDLINE: ] [DOI] [PubMed] [Google Scholar]
Segura‐Orti 2008 {published data only}
- Segura‐Orti E, Rodilla‐Alama V, Lison JF. Physiotherapy during hemodialysis: results of a progressive resistance‐training programme [Fisioterapia durante la hemodialisis: resultados de un programa de fuerza‐resistencia]. Nefrologia 2008;28(1):67‐72. [MEDLINE: ] [PubMed] [Google Scholar]
Segura‐Orti 2010 {published data only}
- Segura‐Orti E. Exercise in haemodyalisis patients: a literature systematic review [Ejercicio en pacientes en hemodialisis: revision sistematica de la literatura]. Nefrologia 2010;30(2):236‐46. [MEDLINE: ] [DOI] [PubMed] [Google Scholar]
Shalom 1984 {published data only}
- Shalom R, Blumenthal JA, Williams RS, McMurray RG, Dennis VW. Feasibility and benefits of exercise training in patients on maintenance dialysis. Kidney International 1984;25(6):958‐63. [MEDLINE: ] [DOI] [PubMed] [Google Scholar]
Sharif 2008 {published data only}
- Sharif A, Moore R, Baboolal K. Influence of lifestyle modification in renal transplant recipients with postprandial hyperglycemia. Transplantation 2008;85(3):353‐8. [MEDLINE: ] [DOI] [PubMed] [Google Scholar]
Shield 2002 {published data only}
- Shield CH. The impact of nutrition and fitness on quality of life.[Erratum appears in Nephrol News Issues. 2002 Jun;16(7):9]. Nephrology News & Issues 2002;16(5):52‐5. [MEDLINE: ] [PubMed] [Google Scholar]
Sietsema 2004 {published data only}
- Sietsema KE, Amato A, Adler SG, Brass EP. Exercise capacity as a predictor of survival among ambulatory patients with end‐stage renal disease. Kidney International 2004;65(2):719‐24. [MEDLINE: ] [DOI] [PubMed] [Google Scholar]
Smith 1981 {published data only}
- Smith BC, Carson HM. The relationship of health locus of control to patients with end‐stage renal disease. Patient Counselling & Health Education 1981;3(2):63‐6. [MEDLINE: ] [DOI] [PubMed] [Google Scholar]
Smith 2006 {published data only}
- Smith S, Greig C, Jenkins D, Davidson I. Improvements in functional and clinical parameters following a simple 12 month exercise programme in long term haemodialysis patients [abstract MP511]. ERA‐EDTA Congress. 2006.
Smye 1998 {published data only}
- Smye SW, Lindley EJ, Will EJ. Simulating the effect of exercise on urea clearance in hemodialysis. Journal of the American Society of Nephrology 1998;9(1):128‐32. [MEDLINE: ] [DOI] [PubMed] [Google Scholar]
Snyder 1989 {published data only}
- Snyder TE. An exercise program for dialysis patients. American Journal of Nursing 1989;89(3):362‐4. [MEDLINE: ] [PubMed] [Google Scholar]
Soffritti 2006 {published data only}
- Soffritti S, Malagoni AM, Russo G, Boari B, Manfredini R, Zamboni P, et al. Physical performance and quality of life in dialysis patients: effects of an exercise program prescribed at hosptial and carried out at home [abstract]. Nephrology Dialysis Transplantation 2006;21(Suppl 4):iv434. [Google Scholar]
Solomon 1999 {published data only}
- Solomon‐Dimmitt R. Focus on rehabilitation: teamwork that works. Advances in Renal Replacement Therapy 1999;6(3):278‐81. [MEDLINE: ] [DOI] [PubMed] [Google Scholar]
Sorensen 1986 {published data only}
- Sorensen SS, Danielsen H, Jespersen B, Pedersen EB. Hypotension in end‐stage renal disease: effect of postural change, exercise and angiotensin II infusion on blood pressure and plasma concentrations of angiotensin II, aldosterone and arginine vasopressin in hypotensive patients with chronic renal failure treated by dialysis. Clinical Nephrology 1986;26(6):288‐96. [MEDLINE: ] [PubMed] [Google Scholar]
Squires 1985 {published data only}
- Squires RW, Brekke JD, Gau GT, Muri A, Frohnert PP. Early exercise testing and training after renal transplantation [abstract]. Medicine & Science in Sports & Exercise 1985;17(2):184. [Google Scholar]
Stanley 1989 {published data only}
- Stanley KW. Introduction to CAPD. Physiotherapy 1989;75(4):207‐8. [EMBASE: 1989103446] [Google Scholar]
Starky 2005 {published data only}
- Sterky E, Stegmayr BG. Elderly patients on haemodialysis have 50% less functional capacity than gender‐ and age‐matched healthy subjects. Scandinavian Journal of Urology & Nephrology 2005;39(5):423‐30. [MEDLINE: ] [DOI] [PubMed] [Google Scholar]
Stefanovic 2005 {published data only}
- Stefanovic V, Milojkovic M. Effects of physical exercise in patients with end stage renal failure, on dialysis and renal transplantation: Current status and recommendations. International Journal of Artificial Organs 2005;28(1):8‐15. [MEDLINE: ] [DOI] [PubMed] [Google Scholar]
Stenvinkel 2000 {published data only}
- Stenvinkel P, Elinder CG, Barany P. Physical activity promotes health also among dialysis patients. International Journal of Cardiology 2000;72(3):299‐300. [MEDLINE: ] [DOI] [PubMed] [Google Scholar]
Stephens 1991 {published data only}
- Stephens R, Williams A, McKnight T, Dodd S. Effects of self‐monitored exercise on selected blood chemistry parameters of end‐stage renal disease patients. American Journal of Physical Medicine & Rehabilitation 1991;70(3):149‐53. [MEDLINE: ] [DOI] [PubMed] [Google Scholar]
Sternweiler 1970 {published data only}
- Sternweiler MR. The use of physiotherapeutic modalities in the detection and treatment of the sequelae to organ transplantation. Progress in Physical Therapy 1970;1(2):95‐105. [MEDLINE: ] [PubMed] [Google Scholar]
Stewart 1981 {published data only}
- Stewart JH. Exercise and rehabilitation in dialysis patients. Medical Journal of Australia 1981;1(12):610‐1. [MEDLINE: ] [DOI] [PubMed] [Google Scholar]
Stewart 1999 {published data only}
- Stewart P. Exercise and a cycle of life: help us help ourselves. Advances in Renal Replacement Therapy 1999;6(2):184‐6. [MEDLINE: ] [DOI] [PubMed] [Google Scholar]
Stivers 1996 {published data only}
- Stivers AP. Issues in rehabilitation. Part II. How an exercise program can benefit patients and the dialysis facility. Nephrology News & Issues 1996;10(6):39. [MEDLINE: ] [PubMed] [Google Scholar]
Storer 1999 {published data only}
- Storer TW, Casaburi R, Gottron C, Walsh D, Sawelson S, Kopple JD. Muscle strength and function improves with endurance exercise training in maintenance hemodialysis patients [abstract]. Journal of the American Society of Nephrology 1999;10(Program & Abstracts):269A. [Google Scholar]
Storer 2005 {published data only}
- Storer TW, Casaburi R, Sawelson S, Kopple JD. Endurance exercise training during haemodialysis improves strength, power, fatigability and physical performance in maintenance haemodialysis patients. Nephrology Dialysis Transplantation 2005;20(7):1429‐37. [MEDLINE: ] [DOI] [PubMed] [Google Scholar]
Straub 2008 {published data only}
- Straub CK, Murphy SO, Rosenblum R. Exercise in the management of fatigue in patients on peritoneal dialysis. Nephrology Nursing Journal: Journal of the American Nephrology Nurses' Association 2008;35(5):469‐75. [MEDLINE: ] [PubMed] [Google Scholar]
Suh 2002 {published data only}
- Suh MR, Jung HH, Kim SB, Park JS, Yang WS. Effects of regular exercise on anxiety, depression, and quality of life in maintenance hemodialysis patients. Renal Failure 2002;24(3):337‐45. [MEDLINE: ] [DOI] [PubMed] [Google Scholar]
Surgit 2001 {published data only}
- Surgit O, Ersoz G, Gursel Y, Ersoz S. Effects of exercise training on specific immune parameters in transplant recipients. Transplantation Proceedings 2001;33(7‐8):3298. [MEDLINE: ] [DOI] [PubMed] [Google Scholar]
Svarstad 2002 {published data only}
- Svarstad E, Myking O, Ofstad J, Iversen BM. Effect of light exercise on renal hemodynamics in patients with hypertension and chronic renal disease. Scandinavian Journal of Urology & Nephrology 2002;36(6):464‐72. [MEDLINE: ] [DOI] [PubMed] [Google Scholar]
Svoboda 2004 {published data only}
- Svoboda L. Czech exercise program for dialysis and transplant patients, 10 years experience. Clinical Nephrology 2004;61 Suppl 1:S6‐9. [MEDLINE: ] [PubMed] [Google Scholar]
Södergård 1991 {published data only}
- Södergård TM, Clyne N. Improved physical capacity and muscular endurance in pre‐dialysis patients after exercise in group [Förbättrad arbetsförmåga och muskeluthållighet hos patienter med måttlig uremi efter gruppträning]. Sjukgymnasten 1991;10:14‐6. [Google Scholar]
Tang 1999 {published data only}
- Yun TZ, Peiyuan QD, Storer T, Casaburi R, Sawelson S, Kopple JD. Effect of exercise training on myostatin gene expression in skeletal muscle of maintenance hemodialysis patients [abstract]. Journal of the American Society of Nephrology 1999;10(Program & Abstracts):269A. [Google Scholar]
Tawney 2000 {published data only}
- Tawney KW, Tawney PJ, Hladik G, Hogan SL, Falk RJ, Weaver C, et al. The life readiness program: a physical rehabilitation program for patients on hemodialysis. American Journal of Kidney Diseases 2000;36(3):581‐91. [MEDLINE: ] [DOI] [PubMed] [Google Scholar]
Tawney 2003 {published data only}
- Tawney KW, Tawney PJ, Kovach J. Disablement and rehabilitation in end‐stage renal disease. Seminars in Dialysis 2003;16(6):447‐52. [MEDLINE: ] [DOI] [PubMed] [Google Scholar]
Tentori 2008 {published data only}
- Tentori F. Focus on: Physical exercise in hemodialysis patients. Journal of Nephrology 2008;21(6):808‐12. [MEDLINE: ] [PubMed] [Google Scholar]
Tobita 2009 {published data only}
- Tobita I, Suzuki S, Kobayashi T, Shimizu Y, Umeshita K. A programme to encourage participation of haemodialysis patients in an exercise regimen. Journal of Renal Care 2009;35(1):48‐53. [MEDLINE: ] [DOI] [PubMed] [Google Scholar]
Triolo 1989 {published data only}
- Triolo G, Segoloni GP, Tetta C, Vercellone A, Cassader M, Boggio‐Bertinet D, et al. Effect of combined diet and physical exercise on plasma lipids of renal transplant recipients. Nephrology Dialysis Transplantation 1989;4(3):237‐8. [MEDLINE: ] [DOI] [PubMed] [Google Scholar]
Triolo 1991 {published data only}
- Triolo G, Boggio‐Bertinet D, Schieroni MP, Cassader M, Tognarelli G, Cogno C, et al. Role of nutritional support and physical exercise in the dyslipidemia of renal transplantation [Ruolo dell'apporto nutrizionale e dell'esercizio fisico nella dislipidemia del trapianto di rene]. Minerva Urologica e Nefrologica 1991;43(3):159‐63. [MEDLINE: ] [PubMed] [Google Scholar]
Tsai 1995 {published data only}
- Tsai TJ, Lai JS, Lee SH, Chen YM, Lan C, Yang BJ, et al. Breathing‐coordinated exercise improves the quality of life in hemodialysis patients. Journal of the American Society of Nephrology 1995;6(5):1392‐400. [MEDLINE: ] [DOI] [PubMed] [Google Scholar]
Tsay 2005 {published data only}
- Shiow‐Luan T, Yuh‐Chain L, Yue‐Ching L. Effects of an adaptation training programme for patients with end‐stage renal disease. Journal of Advanced Nursing 2005;50(1):39‐46. [MEDLINE: ] [DOI] [PubMed] [Google Scholar]
Tykarski 2003 {published data only}
- Tykarski A, Mastej M, Niklas A, Lopatka P, Krasinska B, Kosicka T. Blood pressure response during exercise test i hypertensive patients depending on time of drugs administration [abstract T260]. ERA‐EDTA Congress. 2003.
Tzamaloukas 2003 {published data only}
- Tzamaloukas AH, Murata GH, Vanderjagt DJ, Glew RH. Estimates of body water, fat‐free mass, and body fat in patients on peritoneal dialysis by anthropometric formulas. Kidney International 2003;63(5):1605‐17. [MEDLINE: ] [DOI] [PubMed] [Google Scholar]
Vaithilingam 2004 {published data only}
- Vaithilingam I, Polkinghorne KR, Atkins RC, Kerr PG. Time and exercise improve phosphate removal in hemodialysis patients. American Journal of Kidney Diseases 2004;43(1):85‐9. [MEDLINE: ] [DOI] [PubMed] [Google Scholar]
van den Ham 2001 {published data only}
- Ham ECH, Kooman JP, Schols AM, Does JD, Akkermans M, Janssen P, et al. Reduced exercise capacity and muscle weakness in renal patients: Response to exercise training [abstract]. Journal of the American Society of Nephrology 2001;12(Program & Abstracts):920A. [Google Scholar]
van den Ham 2005 {published data only}
- Ham EC, Kooman JP, Schols AM, Nieman FH, Does JD, Franssen FM, et al. Similarities in skeletal muscle strength and exercise capacity between renal transplant and hemodialysis patients. American Journal of Transplantation 2005;5(8):1957‐65. [MEDLINE: ] [DOI] [PubMed] [Google Scholar]
van den Ham 2006 {published data only}
- Ham E CH, Kooman JP, Schols A, Leunissen KM, Hooff JP. Comparison of the response to exercise training in renal transplant patients, hemodialysis patients and healthy controls: a study on exercise capacity, body composition, muscular structure and enzyme capacity and quality of life [abstract SP733]. ERA‐EDTA Congress. 2006.
van den Ham 2007 {published data only}
- Ham EC, Kooman JP, Schols AM, Nieman FH, Does JD, Akkermans MA, et al. The functional, metabolic, and anabolic responses to exercise training in renal transplant and hemodialysis patients. Transplantation 2007;83(8):1059‐68. [MEDLINE: ] [DOI] [PubMed] [Google Scholar]
van Zuilen 2005 {published data only}
- Zuilen AD, Wetzels JF, Blankestijn PJ, Bots ML, Buren M, Dam MA, et al. Rationale and design of the MASTERPLAN study: Multifactorial approach and superior treatment efficacy in renal patients with the aid of nurse practitioners. Journal of Nephrology 2005;18(1):30‐4. [MEDLINE: ] [PubMed] [Google Scholar]
Violan 2001 {published data only}
- Violan MA, Pomes T, Torregrosa VJ, Campistol JM, Poch E. Long‐term effects of a training program on exercise tolerance in renal transplant patients [abstract]. Journal of the American Society of Nephrology 2001;12(Program & Abstracts):921A‐922A. [Google Scholar]
Violan 2002 {published data only}
- Violan MA, Pomes T, Maldonado S, Roura G, Fuente I, Verdaguer T, et al. Exercise capacity in hemodialysis and renal transplant patients. Transplantation Proceedings 2002;34(1):417‐8. [MEDLINE: ] [DOI] [PubMed] [Google Scholar]
Vlcek 1990 {published data only}
- Vlcek J, Schuck O. The influence of submaximal physical exercise on the function of transplanted kidney. Nephrology Dialysis Transplantation 1990;5(8):633‐4. [EMBASE: 1990293155] [DOI] [PubMed] [Google Scholar]
Wagner 2001 {published data only}
- Wagner PD, Masanes F, Wagner H, Sala E, Miro O, Campistol JM, et al. Muscle angiogenic growth factor gene responses to exercise in chronic renal failure. American Journal of Physiology ‐ Regulatory Integrative & Comparative Physiology 2001;281(2):R539‐46. [MEDLINE: ] [DOI] [PubMed] [Google Scholar]
Weinberg 1988 {published data only}
- Weinberg MS, Blonsky SL, Kolker JD, Galligan E, Trebbin WM, Solomon RJ. Reduction of hyperlipidemia in continuous ambulatory peritoneal dialysis. Dialysis & Transplantation 1988;17(9):478‐80. [EMBASE: 1988213475] [Google Scholar]
Weissgarten 1998 {published data only}
- Weissgarten J, Averbukh Z, Modai D. Exercise training and the progression of chronic renal failure. Nephron 1998;79(2):224. [MEDLINE: ] [DOI] [PubMed] [Google Scholar]
Wellard 2003 {published data only}
- Wellard S. Validation of physical activity measurement for people on dialysis treatment. Edtna‐Erca Journal 2003;29(3):140‐2. [MEDLINE: ] [DOI] [PubMed] [Google Scholar]
Wenger 1998 {published data only}
- Wenger NK. Lipid metabolism, physical activity, and postmenopausal hormone therapy. American Journal of Kidney Diseases 1998;32(5 Suppl 3):S80‐8. [MEDLINE: ] [DOI] [PubMed] [Google Scholar]
Wiberg 2003 {published data only}
- Wiberg EM. Well‐designed training programs crucial for dialysis patients [Viktigt att finna bra träningsformer för dialyspatienter]. Läkartidningen 2003;100(7):519‐26. [MEDLINE: ] [PubMed] [Google Scholar]
Williams 1991 {published data only}
- Williams A, Stephens R, McKnight T, Dodd S. Factors affecting adherence of end‐stage renal disease patients to an exercise programme. British Journal of Sports Medicine 1991;25(2):90‐3. [MEDLINE: ] [DOI] [PMC free article] [PubMed] [Google Scholar]
Winchester 2003 {published data only}
- Winchester JF. Special articles. Advances in Renal Replacement Therapy 2003;10(3):224. [EMBASE: 2004004676 ] [Google Scholar]
Wolfe 1985 {published data only}
- Wolfe GA, Feinstein EI, Dwyer HJ, Massry SG. Effects of exercise training on physical work capacity of hemodialysis patients ‐ a controlled study [abstract]. Kidney International 1985;27(1):176. [Google Scholar]
Worel 1985 {published data only}
- Worel JN, Painter P, Hill M, Thornberry D, Shelp W. Compliance and benefits of exercise training during hemodialysis [abstract]. Medicine & Science in Sports & Exercise 1985;17(2):289. [Google Scholar]
Yamaka 1984 {published data only}
- Yamaka T, Chang K, Akaike M, Tsuyuki K, Nomura M, Hase H, et al. Effects of exercise training on hemodialysis‐induced hypotension and subjective complaints during hemodialysis therapy in hemodialysis patients. Nippon Jinzo Gakkai Shi. Japanese Journal of Nephrology 1984;26(4):399‐406. [MEDLINE: ] [PubMed] [Google Scholar]
Yoshida 2003 {published data only}
- Yoshida K, Kawamura T, Xu H‐L, Kohzuki M. Effects of exercise training and angiotensin converting enzyme inhibition in fructose‐fed rats [abstract W174]. ERA‐EDTA Congress. 2003.
Young 1993 {published data only}
- Young VR, Caggiula A. Nutrition workshop. American Journal of Kidney Diseases 1993;21(1):118‐9. [MEDLINE: ] [DOI] [PubMed] [Google Scholar]
Zabetakis 1982 {published data only}
- Zabetakis PM, Gleim GW, Pasternack FL, Saraniti A, Nicholas JA, Michelis MF. Long‐duration submaximal exercise conditioning in hemodialysis patients. Clinical Nephrology 1982;18(1):17‐22. [MEDLINE: ] [PubMed] [Google Scholar]
Zaluska 2002a {published data only}
- Zaluska A, Zaluska WT, Bednarek‐Skublewska A, Ksiazek A. Nutrition and hydration status improve with exercise training using stationary cycling during hemodialysis (HD) in patients with end‐stage renal disease (ESRD). Annales Universitatis Mariae Curie‐Sklodowska ‐ Sectio d ‐ Medicina 2002;57(2):342‐6. [MEDLINE: ] [PubMed] [Google Scholar]
Zaluska 2002b {published data only}
- Zaluska W, Zaluska A, Bednarek‐Skublewska A, Ksiazek A. Nutrition status improve with intradialytic exercise training in patients with end‐stage renal failure (ESRD) on hemodialysis (HD) [abstract 88]. ERA‐EDTA Congress. 2002. [PubMed]
Zamojska 2005 {published data only}
- Zamojska S, Szklarek M, Czupryniak A, Nowicki M. Determinants of low physical activity in chronic hemodialysis patients [abstract SP353]. ERA‐EDTA Congress. 2005.
Zeier 2001 {published data only}
- Zeier MG. Exercise‐induced anuria in a renal allograft recipient. Neprology Dialysis Transplantation 2001;16(12):2431‐3. [MEDLINE: ] [DOI] [PubMed] [Google Scholar]
Zinna 2003 {published data only}
- Zinna EM, Yarasheski KE. Exercise treatment to counteract protein wasting of chronic diseases. Current Opinion in Clinical Nutrition & Metabolic Care 2003;6(1):87‐93. [MEDLINE: ] [DOI] [PubMed] [Google Scholar]
References to studies awaiting assessment
Sun 2003 {published data only}
- Sun Y‐B, Chen B‐L, Jia Q, Wang J‐M. Exercise therapy during hemodialysis to improve adequacy of dialysis randomized controlled trial. Chinese Journal of Clinical Rehabilitation [Zhongguo Linchuang Kangfu] 2003;7(27):3702‐3. [EMBASE: 2004216560] [Google Scholar]
Additional references
ACSM 1998
- Pollock ML, Gaesser GA, Butcher JD, Després JP, Dishman RK, Franklin BA, et al. American College of Sports Medicine Position Stand. The recommended quantity and quality of exercise for developing and maintaining cardiorespiratory and muscular fitness, and flexibility in healthy adults. Medicine & Science in Sports & Exercise 1998;30(6):975‐91. [MEDLINE: ] [DOI] [PubMed] [Google Scholar]
ACSM 2004
- Pescatello LS, Franklin BA, Fagard R, Farquhar WB, Kelley GA, Ray CA. American College of Sports Medicine position stand: exercise and hypertension. Medicine & Science in Sports & Exercise 2004;36(3):533‐53. [MEDLINE: ] [DOI] [PubMed] [Google Scholar]
ACSM 2006
- American College of Sports Medicine. ACSM's guidelines for exercise testing and prescription. 7th Edition. Baltimore: Lippincott, Williams & Wilkins, 2006. [Google Scholar]
Albright 2000
- Albright A, Franz M, Hornsby G, Kriska A, Marrero D, Ullrich I, et al. American College of Sports Medicine position stand. Exercise and type 2 diabetes. Medicine & Science in Sports & Exercise 2000;32(7):1345‐60. [MEDLINE: ] [DOI] [PubMed] [Google Scholar]
Barany 1993
- Barany P, Freyschuss U, Pettersson E, Bergstrom J. Treatment of anaemia in haemodialysis patients with erythropoietin: long‐term effects on exercise capacity. Clinical Science 1993;84(4):441‐7. [MEDLINE: ] [DOI] [PubMed] [Google Scholar]
Blair 1992
- Blair SN, Kohl HW, Gordon NF, Paffenberger RS Jr. How much physical activity is good for health?. Annual Review of Public Health 1992;13:99‐126. [MEDLINE: ] [DOI] [PubMed] [Google Scholar]
Bohannon 1994
- Bohannon RW, Hull D, Palmeri D. Muscle strength impairments and gait performance deficits in kidney transplantation candidates. American Journal of Kidney Diseases 1994;24(3):480‐5. [MEDLINE: ] [DOI] [PubMed] [Google Scholar]
Bouchard 1994
- Bouchard C, Shephard R, Stephens T. Physical activity, fitness and health: international proceedings and consensus statement. Champaign: Human Kinetics, 1994. [Google Scholar]
Brautbar 1983
- Brautbar N. Skeletal myopathy in uremia: abnormal energy metabolism. Kidney International ‐ Supplement 1983;24:S81‐6. [MEDLINE: ] [PubMed] [Google Scholar]
Brodin 2001
- Brodin E, Ljungman S, Hedberg M, Sunnerhagen KS. Physical activity, muscle performance and quality of life in patients treated with chronic peritoneal dialysis. Scandinavian Journal of Urology & Nephrology 2001;35(1):71‐8. [MEDLINE: ] [DOI] [PubMed] [Google Scholar]
CESG 1990
- Anonymous. Association between recombinant human erythropoietin and quality of life and exercise capacity of patients receiving haemodialysis. Canadian Erythropoietin Study Group. BMJ 1990;300(6724):573‐8. [MEDLINE: ] [DOI] [PMC free article] [PubMed] [Google Scholar]
Clyne 1987
- Clyne N, Jogestrand T, Lins LE, Pehrsson SK, Ekelund LG. Factors limiting physical working capacity in predialytic uraemic patients. Acta Medica Scandinavica 1987;222(2):183‐90. [MEDLINE: ] [DOI] [PubMed] [Google Scholar]
Clyne 1991b
- Clyne N, Ekholm J, Jogestrand T, Lins LE, Pehrsson SK. Effects of exercise training in predialytic uremic patients. Nephron 1991;59(1):84‐9. [MEDLINE: ] [DOI] [PubMed] [Google Scholar]
Clyne 1992
- Clyne N, Jogestrand T. Effect of erythropoietin treatment on physical exercise capacity and on renal function in predialytic uraemic patients. Nephron 1992;60(4):390‐6. [MEDLINE: ] [DOI] [PubMed] [Google Scholar]
Clyne 1993
- Clyne N, Esbjörnsson M, Jansson E, Jogestrand T, Lins LE, Pehrsson SK. Effects of renal failure on skeletal muscle. Nephron 1993;63(4):395‐9. [MEDLINE: ] [DOI] [PubMed] [Google Scholar]
Davis 1983
- Davis TA, Karl IE, Goldberg A, Harter H. Effects of exercise training on muscle protein catabolism in uremia. Kidney International ‐ Supplement 1983;24:52‐7. [MEDLINE: ] [PubMed] [Google Scholar]
Davis 1987
- Davis TA, Klahr S, Karl IE. Insulin‐stimulated protein metabolism in chronic azotemia and exercise. American Journal of Physiology 1987;253(1 Pt 2):F164‐9. [MEDLINE: ] [DOI] [PubMed] [Google Scholar]
Diesel 1990
- Diesel W, Noakes T, Swanepoel C, Lambert M. Isokinetic muscle strength predicts maximum exercise tolerance in renal patients on chronic hemodialysis. American Journal of Kidney Diseases 1990;16(2):109‐14. [MEDLINE: ] [DOI] [PubMed] [Google Scholar]
Eidemak 1995
- Eidemak I, Feldt‐Rasmussen B, Kanstrup IL, Nielsen SL, Schmitz O, Strandgaard S. Insulin resistance and hyperinsulinaemia in mild to moderate progressive chronic renal failure and its association with aerobic work capacity. Diabetologia 1995;38(5):565‐72. [MEDLINE: ] [DOI] [PubMed] [Google Scholar]
Evans 2007
- Evans RK, Bond DS, Wolfe LG, Meador JG, Herrick JE, Kellum JM, et al. Participation in 150 min/wk of moderate or higher intensity physical activity yields greater weight loss after gastric bypass surgery. Surgery for Obesity & Related Diseases 2007;3(5):526‐30. [MEDLINE: ] [DOI] [PubMed] [Google Scholar]
Fennicchia 2004
- Fennicchia LM, Kanaley JA, Azevedo JL, Miller CS, Weinstock RS, Carhart RL, et al. Influence of resistance exercise training on glucose control in women with type 2 diabetes. Metabolism: Clinical & Experimental 2004;53(3):284‐9. [MEDLINE: ] [DOI] [PubMed] [Google Scholar]
Fluckey 1994
- Fluckey JD, Hickey MS, Brambrink JK, Harter KK, Alexander K, Craig BW. Effects of resistance exercise on glucose tolerance in normal and glucose‐intolerant subjects. Journal of Applied Physiology 1994;77(3):1087‐92. [MEDLINE: ] [DOI] [PubMed] [Google Scholar]
Goldstein 1992
- Goldstein DJ. Beneficial health effects of modest weight loss. International Journal of Obesity & Related Metabolic Disorders: Journal of the International Association for the Study of Obesity 1992;16(6):397‐415. [MEDLINE: ] [PubMed] [Google Scholar]
Gordon 1995
- Gordon N. The exercise prescription. The health professional's guide to diabetes and exercise. Alexandria: American Diabetes Association, 1995:71‐82. [Google Scholar]
Guarnieri 1983
- Guarnieri G, Toigo G, Situlin R, Faccini L, Coli U, Landini S, et al. Muscle biopsy studies in chronically uremic patients: evidence for malnutrition. Kidney International ‐ Supplement 1983;24:S187‐93. [MEDLINE: ] [PubMed] [Google Scholar]
Heiwe 2001
- Heiwe S, Tollbäck A, Clyne N. Twelve weeks of exercise training increases muscle function and walking capacity in elderly predialysis patients and healthy subjects. Nephron 2001;88(1):48‐56. [MEDLINE: ] [DOI] [PubMed] [Google Scholar]
Heiwe 2003
- Heiwe S, Clyne N, Dahlgren MA. Living with chronic renal failure: patients' experiences of their physical and functional capacity. Physiotherapy Research International 2003;8(4):167‐77. [MEDLINE: ] [DOI] [PubMed] [Google Scholar]
Higgins 2002
- Higgins JP, Thompson SG. Quantifying heterogeneity in a meta‐analysis. Statistics in Medicine 2002;21(11):1539‐58. [MEDLINE: ] [DOI] [PubMed] [Google Scholar]
Higgins 2003
- Higgins JP, Thompson SG, Deeks JJ, Altman DG. Measuring inconsistency in meta‐analysis. BMJ 2003;327(7414):557‐60. [MEDLINE: ] [DOI] [PMC free article] [PubMed] [Google Scholar]
Higgins 2005
- Higgins JPT, Green S. Assessment of study quality. Cochrane Handbook for Systematic Reviews of Interventions 4.2.5 http://www.cochrane.org/resources/handbook/hbook.htm [updated May 2005] 2005.
Hollis 1999
- Hollis S, Campbell F. What is meant by intention to treat analysis? Survey of published randomised controlled trials. BMJ 1999;319(7211):670‐4. [MEDLINE: ] [DOI] [PMC free article] [PubMed] [Google Scholar]
Jadad 1996
- Jadad AR, Moore RA, Carroll D, Jenkinson C, Reynolds DJ, Gavaghan DJ, et al. Assessing the quality of reports from randomized clinical trials: is blinding necessary. Controlled Clinical Trials 1996;17(1):1‐12. [MEDLINE: ] [DOI] [PubMed] [Google Scholar]
Jakicic 1999
- Jakicic JM, Winters C, Lang W, Wing RR. Effects of intermittent exercise and use of home exercise equipment on adherence, weight loss, and fitness in overweight women: a randomized trial. JAMA 1999;282(16):1554‐60. [MEDLINE: ] [DOI] [PubMed] [Google Scholar]
Jakicic 2001
- Jakicic JM, Clark K, Coleman E, Donnelly JE, Foret J, Melanson E, et al. American College of Sports Medicine position stand. Appropriate intervention strategies for weight loss and prevention of weight regain for adults. Medicine & Science in Sports & Exercise 2001;33(12):2145‐56. [MEDLINE: ] [DOI] [PubMed] [Google Scholar]
Johansen 2003
- Johansen KL, Shubert T, Doyle J, Soher B, Sakkas GK, Kent‐Braun JA. Muscle atrophy in patients receiving hemodialysis: effects on muscle strength, muscle quality, and physical function. Kidney International 2003;63(1):291‐7. [MEDLINE: ] [DOI] [PubMed] [Google Scholar]
Jones 1990
- Jones DA, Round JM. Skeletal Muscle in Health and Disease. Manchester: Manchester University Press, 1990. [Google Scholar]
KDOQI 2002
- National Kidney Foundation. KDOQI Clinical Practice Guidelines for Chronic Kidney Disease: Evaluation, Classification and Stratification. http://www.kidney.org/professionals/kdoqi/guidelines_ckd/toc.htm (accessed March 2011).
Kelley 1997
- Kelley G. Dynamic resistance exercise and resting blood pressure in adults: a meta‐analysis. Journal of Applied Physiology 1997;82(5):1559‐65. [MEDLINE: ] [DOI] [PubMed] [Google Scholar]
Kelley 1999
- Kelley GA. Aerobic exercise and resting blood pressure among women: a meta‐analysis. Preventive Medicine 1999;28(3):264‐75. [MEDLINE: ] [DOI] [PubMed] [Google Scholar]
Kelley 2001
- Kelley GA, Kelley KA, Tran ZV. Aerobic exercise and resting blood pressure: a meta‐analytic review of randomized controlled trials. Preventive Cardiology 2001;4(2):73‐80. [EMBASE: 2001165511] [DOI] [PMC free article] [PubMed] [Google Scholar]
Kempeneers 1990b
- Kempeneers G, Noakes TD, Zyl‐Smit R, Myburgh KH, Lambert M, Adams B, et al. Skeletal muscle limits the exercise tolerance of renal transplant recipients: effects of a graded exercise training program. American Journal of Kidney Diseases 1990;16(1):57‐65. [MEDLINE: ] [DOI] [PubMed] [Google Scholar]
Kettner 1987
- Kettner‐Melsheimer A, Weiss M, Huber W. Physical work capacity in chronic renal disease. International Journal of Artificial Organs 1987;10(1):23‐30. [MEDLINE: ] [PubMed] [Google Scholar]
Kouidi 1997b
- Kouidi E, Iacovides A, Iordanidis P, Vassiliou S, Deligiannis A, Ierodiakonou C, et al. Exercise renal rehabilitation program: psychosocial effects. Nephron 1997;77(2):152‐8. [MEDLINE: ] [DOI] [PubMed] [Google Scholar]
Kouidi 1998a
- Kouidi E, Albani M, Natsis K, Megalopoulos A, Gigis P, Guiba‐Tziampiri O, et al. The effects of exercise training on muscle atrophy in haemodialysis patients. Nephrology Dialysis Transplantation 1998;13(3):685‐99. [MEDLINE: ] [DOI] [PubMed] [Google Scholar]
Laupacis 1991
- Laupacis A, Wong C, Churchill D. The use of generic and specific quality‐of‐life measures in hemodialysis patients treated with erythropoietin. The Canadian Erythropoietin Study Group. Controlled Clinical Trials 1991;12(4 Suppl):168S‐179S. [MEDLINE: ] [DOI] [PubMed] [Google Scholar]
Lim 1989
- Lim VS, DeGowin RL, Zavala D, Kirchner PT, Abels R, Perry P, et al. Recombinant human erythropoietin treatment in pre‐dialysis patients. A double‐blind placebo‐controlled trial. Annals of Internal Medicine 1989;110(2):108‐14. [MEDLINE: ] [DOI] [PubMed] [Google Scholar]
Maiorana 2002
- Maiorana A, O'Discroll G, Goodman C, Taylor R, Green D. Combined aerobic and resistance exercise improves glycemic control and fitness in type 2 diabetes. Diabetes Research & Clinical Practice 2002;56(2):115‐23. [MEDLINE: ] [DOI] [PubMed] [Google Scholar]
McMahon 1999
- McMahon LP, McKenna MJ, Sangkabutra T, Mason K, Sostaric S, Skinner SL, et al. Physical performance and associated electrolyte changes after haemoglobin normalization: a comparative study in haemodialysis patients. Nephrology Dialysis Transplantation 1999;14(5):1182‐7. [MEDLINE: ] [DOI] [PubMed] [Google Scholar]
Moher 1998
- Moher D, Pham B, Jones A, Cook DJ, Jadad AR, Moher M, et al. Does quality of reports of randomised trials affect estimates of intervention efficacy reported in meta‐analyses?. Lancet 1998;352(9128):609–13. [MEDLINE: ] [DOI] [PubMed] [Google Scholar]
Renal Group 2011
- Willis NS, Mitchell R, Higgins GY, Webster AC, Craig JC. Cochrane Renal Group. About The Cochrane Collaboration (Cochrane Review Groups (CRGs)) 2011, Issue 4. Art. No.: RENAL (accessed April 2011).
Ritz 1980
- Ritz E, Boland R, Kreusser W. Effects of vitamin D and parathyroid hormone on muscle: potential role in uremic myopathy. American Journal of Clinical Nutrition 1980;33(7):1522‐9. [MEDLINE: ] [DOI] [PubMed] [Google Scholar]
Sakkas 2003b
- Sakkas GK, Ball D, Mercer TH, Sargeant AJ, Tolfrey K, Naish PF. Atrophy of non‐locomotor muscle in patients with end‐stage renal failure. Nephrology Dialysis Transplantation 2003;18(10):2074‐81. [MEDLINE: ] [DOI] [PubMed] [Google Scholar]
Schulz 1995
- Schulz KF, Chalmers I, Hayes RJ, Altman DG. Empirical evidence of bias: dimensions of methodological quality associated with estimates of treatment effects in controlled trials. JAMA 1995;273(5):408‐12. [MEDLINE: ] [DOI] [PubMed] [Google Scholar]
Stamler 1989
- Stamler J, Rose G, Stamler R, Elliott P, Dyer A, Marmot M. INTERSALT study findings: public health and medical care implications. Hypertension 1989;14(5):570‐7. [MEDLINE: ] [DOI] [PubMed] [Google Scholar]
Thompson 1996
- Thompson RT, Muirhead N, Marsh GD, Gravelle D, Potwarka JJ, Driedger AA. Effect of anaemia correction on skeletal muscle metabolism in patients with end‐stage renal disease: 31P magnetic resonance spectroscopy assessment. Nephron 1996;73(3):436‐41. [MEDLINE: ] [DOI] [PubMed] [Google Scholar]
Tokmatidis 2004
- Tokmatidis SP, Zois CE, Volaklis KA, Kotsa K, Touvra AM. The effects of a combined strength and aerobic exercise program on glucose control and insulin action in women with type 2 diabetes. European Journal of Applied Physiology 2004;92(4‐5):437‐42. [MEDLINE: ] [DOI] [PubMed] [Google Scholar]
Whelton 2002
- Whelton SP, Chin A, Xin X, He J. Effect of aerobic exercise on blood pressure: a meta‐analysis of randomized controlled trials. Annals of Internal Medicine 2002;146(7):493‐503. [MEDLINE: ] [DOI] [PubMed] [Google Scholar]
Wilmore 1999
- Wilmore JH, Costill DL. Physiology of sports and exercise. 2nd Edition. Champaign: Human Kinetics, 1999. [Google Scholar]
References to other published versions of this review
Heiwe 2001b
- Heiwe S, Jacobson SH. Exercise training for adults with chronic kidney disease. Cochrane Database of Systematic Reviews 2001, Issue 3. [DOI: 10.1002/14651858.CD003236] [DOI] [PMC free article] [PubMed] [Google Scholar]