

Summary
Epithelial ovarian cancer (OC) is often diagnosed at an advanced stage with peritoneal metastasis, and preclinical models mimicking the natural course of OC peritoneal metastasis are essential to improve treatment. We implanted ES2 and ID8 cells in the ovaries of mice and obtained highly metastatic (HM) sublines from their omental metastases after three cycles in vivo selection. Orthotopic xenografts derived from the HM sublines showed enhanced omental tropism and more extensive metastasis with earlier onset. The HM cells exhibited increased in vitro migration and invasion properties, and RNA sequencing revealed that the genes related to epithelial-mesenchymal transition and extracellular matrix regulation were significantly altered in the HM cells. Among them, the upregulated genes were significantly associated with poorer survival in OC patients. In conclusion, these HM sublines can be leveraged to establish spontaneous metastatic OC mouse models, which may serve as ideal preclinical models for anti-metastasis therapy for OC patients.
Subject areas: Biological sciences, Cell biology, Cancer
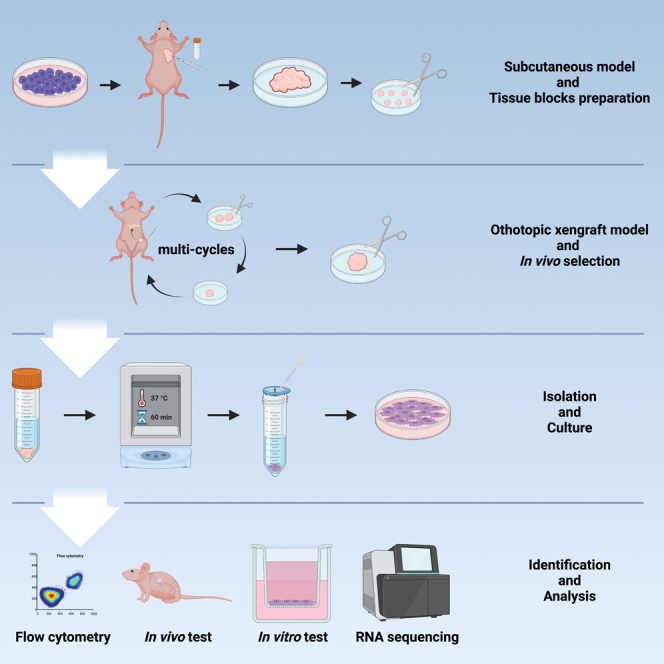
Graphical abstract
Highlights
-
•
Highly metastatic cell sublines with omental tropism are built by in vivo selection
-
•
Highly metastatic cell sublines allow highly efficient orthotopic modeling
-
•
Gene expression pattern in highly metastatic cells is in line with that of human tumor
Biological sciences; Cell biology; Cancer
Introduction
Epithelial ovarian cancer (OC) is the most lethal malignancy of the female reproductive system, with a 5-year overall survival (OS) of 46%.1 Despite advances in treatment strategies in recent years, such as the integration of vascular endothelial growth factor receptor and poly ADP-ribose polymerase inhibitors into traditional platinum-based chemotherapy regimens, the survival time of women with OC has only modestly improved.2 Up to 80% of patients with OC are diagnosed at an advanced stage with peritoneal metastases,3 and their 5-year survival rate drops to below 30%.4 However, there is no effective treatment targeting OC metastatic diseases, and many encouraging results of preclinical studies have failed to show efficacy in clinical trials involving metastatic tumors.5 Emerging evidence has highlighted the significant differences in molecular and functional phenotypes between primary tumors and their metastatic lesions.6 Thus, appropriate preclinical models of OC peritoneal metastasis mimicking the natural course of disease progression should be of great value in terms of mechanism exploration, therapeutic target identification, and treatment efficacy evaluation.
The progression of OC involves a series of consecutive, partially overlapping events consisting of in situ growth, exfoliation, abdominal spreading, omentum colonization, and ascites formation.7,8 A variety of in vitro and in vivo models are currently employed in preclinical OC research, but their ability to represent the disease state is far from sufficient. The transwell assay is a widely used in vitro metastatic model.9 However, it can only distinguish cells with different levels of invasiveness and motility. Organotypic 3D matrix10 and ex vivo culture of omentum11 have been utilized in OC studies, which were mainly focused on the roles of nonmalignant compositions in the omental microenvironment instead of the changes in cancer cells during metastasis. The animal model is another crucial preclinical model in OC studies. The engrafted tumor model, including subcutaneous, intraperitoneal, and orthotopic models, is frequently used in OC studies. The subcutaneous model is convenient to build and monitor, but it is less physiologically relevant to ovarian cancers, which grow in the intraperitoneal space. Indeed, metastasis is rarely observed in most subcutaneous mouse models, including OC.12,13 The in vivo metastatic OC models currently used mainly refer to the intraperitoneal14 and orthotopic models.15 The intraperitoneal model is able to recapitulate the implantation metastasis of OC at advanced stages, but it is generated without primary tumor growth. The orthotopic model is an ideal in vivo model, yet some researchers think it is not suitable for studies on the late stage of OC progression because the formation of ascites is unstable. In addition, technological difficulties in generating and monitoring orthotopic models have limited their use.16 Thus, the establishment of preclinical models is required for future OC research.
In our previous study, a modified orthotopic xenograft mouse model was established.15 As tumor cells are heterogeneous and highly metastatic (HM) tumor cell variants preexist in the parental population,17 in vivo selection can enrich for these cell subpopulations.18,19 In this study, we developed a spontaneous metastatic mouse model based on orthotopic engraftment and acquired two HM OC cell sublines, ES2-HM and ID8-HM, with high omental metastatic tropism through in vivo selection. The mouse model and HM OC cells could be effectively applied to explore the metastatic mechanism and individual therapeutic strategy of OC.
Results
The in vivo selection of highly metastatic OC cells
To mimic the spontaneous intraperitoneal metastasis of human OC, orthotopic OC mouse models were chosen for in vivo selection of HM cells. In a previous study, we compared two ways to establish orthotopic OC mouse models, i.e., cell injection and tissue block transplantation, and found that the latter favored xenograft formation and intraperitoneal metastasis.15 Therefore, tissue blocks of subcutaneous xenografts derived from luciferase-labeled ES2 cells were used for the establishment of orthotopic mouse models (Balb/c nude mice) at passage 1. In subsequent passages, the omental metastatic lesions of previous passages were transplanted into the ovarian bursa (Figures 1A, 1B, and S1). Over three cycles of in vivo selection, tumor progression was gradually accelerated, and the survival of tumor-bearing mice was shortened. Passage 1 mice showed extensive peritoneal dissemination 17.00 ± 1.7 days after transplantation and reached a humane endpoint due to obvious ascites formation 23.33 ± 7.5 days after transplantation, while the average progression-free time and survival in passage 3 mice were less than 12 days and 16 days, respectively, indicating a significant increase in the metastatic ability of tumor cells (Figures 1C and S2). Finally, the tumor cells were derived from the omental metastases of passage 3 mice and named ES2-HM. Similarly, a HM subline of ID8 (ID8-HM) was established by three cycles of consecutive in vivo selection in C57BL/6 mice. The purity of the HM cells isolated from xenografts was confirmed by the high proportion of cells expressing luciferase and EGFP as revealed by Flow cytometry and bioluminescent imaging (BLI) (Figure S3).
Figure 1.

The in vivo selection of highly metastatic (HM) OC cells
(A) Schematic diagram of the establishment of HM cells.
(B) Orthotopic transplantation of tissue blocks. The incision should be made at the lowest point in the depression area between the rib bow and the thigh near the spine on a left lateral position. Circle: White, spleen; Blue, kidney; Red, suitable area for incision. Arrow: Yellow, the lowest point in the side view; Blue, incision of ovary bursa; Green, tissue block; Red, suture of ovary bursa.
(C) The procedures of in vivo selection for ES2-HM cells. After 3 rounds of in vivo selection, the HM cells, named ES2-HM, are gained from the omental metastatic tumor of passage 3 mice. Arrow: The omental tissue with the strongest luminescent signals is determined by ex vivo imaging and obtained for orthotopic inoculation in the mice of the next passage.
HM cells exhibit enhanced metastatic abilities in vivo
Orthotopic transplantation of tissue blocks was conducted to evaluate the metastatic abilities of ES2-HM cells versus parental ES2 cells in vivo. Monitored by in vivo BLI, the mice bearing ES2-HM xenografts exhibited widespread intraperitoneal metastasis 13 days after transplantation, while the disease progression in the ES2 group was much milder (Figure 2A). When reaching the endpoint, the ES2-HM mice had larger abdominal circumferences and more intensive tumor involvement within the abdominal cavity (Figure 2B). In particular, the ES2-HM mice developed significantly more metastatic lesions in their contralateral ovaries and omentum (Figures 2C and 2D) than the ES2 mice. Hematoxylin-eosin (HE) and immunohistochemistry (IHC) staining of omental tissues showed wide infiltration of tumor cells in the omentum of ES2-HM mice, accompanied by increased CD31 and endoglin signals, suggesting enhanced angiogenesis within the omentum of ES2-HM mice (Figure 2E). Similarly, ID8-HM cell-derived orthotopic OC xenografts developed intraperitoneal metastases more rapidly and more widely than ID8 tumors (Figure 2F).
Figure 2.

The metastatic abilities of HM cells in vivo
(A) Representative BLI images of orthotopic models of ES2-HM cells and their parental cells. Right: the curves of tumor burden by BLI, data are represented as mean ± SD.
(B) Representative images of ascites and peritoneal dissemination in mice bearing ES2 and ES2-HM.
(C) The bilateral ovaries and uterus of the mice and BLI images. Cells are inoculated in the left ovary of the mice. Right: tumor volume of the primary tumors, data are represented as mean ± SD.
(D) Omentum of the mice and the BLI images. Right: radiance value of the omentum, data are represented as mean ± SD.
(E) Representative images of HE and IHC (CD31 and endogin) staining of the paraffin-embedded sections (HE, magnification 40×, scale bar: 200 μm; IHC, magnification 200×, scale bar: 50 μm. Arrows: staining positive cells).
(F) Representative BLI images of orthotopic models of ID8-HM cells and their parental cells. Right: the curves of tumor burden by BLI, data are represented as mean ± SD. BLI, bioluminescent imaging; HE, hematoxylin-eosin; IHC, immunohistochemistry.
In vitro phenotype of HM cells
To verify the phenotypic shift of the tumor cells after in vivo selection, in vitro assays were conducted to compare the HM cells to their parental counterparts in terms of cell proliferation, migration, invasion, and adhesion properties. Morphologically, the HM cells were significantly slenderer and more refractive under a light microscope (Figures 3A and S4A). The cell proliferation was reduced in the HM cells, as revealed by 5-ehtynyl-2′-deoxyuridine (EdU) assays (Figures 3B and S4C). The colony formation ability was slightly reduced in the ES2-HM cells (Figure 3C). As expected, the HM cells exhibited significantly enhanced mobility in Transwell assays (Figures 3D and S4B) when the membranes were coated with Matrigel, which simulated the extracellular matrix (ECM) (Figures 3E and S4B). However, the ES2-HM cells exhibited a largely weakened Matrigel adhesion ability when compared to parental ES2 cells (Figure 3F). These morphological and functional alterations that occurred in the ES2-HM cells were consistent with an epithelial-mesenchymal transition (EMT). The epithelial marker (E-cadherin) was downregulated in ES2-HM cells. However, no significant change in the mesenchymal marker (vimentin) was observed (Figure 3G).
Figure 3.

In vitro phenotype of HM cells
(A) The morphology under light microscope (magnification 200×, scale bar: 50 μm).
(B) EdU assays, left: representative of fluorescent images, right: statistic chart (magnification 200×, scale bar: 50 μm).
(C) Colony formation assays, left: representative of images, right: statistic chart.
(D) Transwell migration assay, left: representative of fluorescent images, right: statistic chart (magnification 200×, scale bar: 50 μm).
(E) Transwell invasion assays, left: representative of fluorescent images, right: statistic chart (magnification 200×, scale bar: 50 μm).
(F) Matrigel adhesion assays, left: representative of fluorescent images, right: statistic chart (magnification 100×, scale bar: 100 μm).
(G) Western blot analysis of E-cadherin and vimentin in ES2 and ES2-HM. Data are represented as mean ± SD. P values were calculated using the unpaired Student’s t test or Welch’s t-test. ∗, P < 0.05; ∗∗, P < 0.01.
The transcriptome alterations in HM cells
HM variants of cancer cells are believed to possess specific gene-expression signatures predetermining metastasis.20 To determine the gene expression alterations in ES2-HM cells versus ES2 cells, we performed mRNA sequencing. Based on the filter criteria of fold change >2 and adjusted p value <0.05, as many as 558 differentially expressed genes (DEGs) were identified, of which 295 genes were significantly upregulated and 263 genes were downregulated (Figures 4A and 4B). By performing gene set enrichment analysis (GSEA), several ECM regulation-related gene sets and ECM component-related gene sets were enriched in ES2-HM cells. In addition, some EMT-related signaling pathways, such as the transforming growth factor β and Wingless / Integrated (WNT) pathways,21 were upregulated in ES2-HM cells (Figures 4C–4G). The upregulated expression of genes involved in ECM regulation and EMT in ES2-HM cells, including fibrillin 1, vascular endothelial growth factor A, SPARC cwcv and kazal-like domains proteoglycan 1, hyaluronan synthase 2, Wnt family member 7B and A disintegrin and metalloproteinase with thrombospondin type 1 motifs 2 (ADAMTS2), was confirmed by quantitative reverse transcription-polymerase chain reaction (qRT-PCR) analysis, with ADAMTS2 expression showing the largest fold change (Figure 4H). Moreover, the expression of ADAMTS2 in ES2-HM cells was also higher than that in other OC cell lines, such as SKOV3, A2780, CAOV3, OVCAR3, OVCAR4, and IGROV1 (Figure 4I). Similarly, a higher Adamts2 mRNA level was found in ID8-HM than in ID8 (Figure 4J). ADAMTS2 is a member of the a disintegrin and metalloproteinase with thrombospondin type 1 motif family with a domain that can cleave the aminopropeptides of fibrillar collagens.22 The western blot results showed that ADAMTS2 expression was upregulated in both the cell lysate and the cell culture supernatant of ES2-HM cells (Figure 4K). IHC demonstrated a higher expression of ADAMTS2 in the HM cells derived orthotopic xenografts and picrosirius red staining showed less fibrillar collagen deposition in the HM cells derived omental metastasis versus their parental cells (Figures 4L, 4M, and S5). These findings underscore the role of ECM remodeling and EMT in OC metastasis.
Figure 4.

The mRNA sequencing results of the ES2-HM and the parental ES2 cells
(A) The volcano plot generated from transcriptome analyses of RNA sample from ES2 and ES2-HM.
(B) The heatmap of the DEGs.
(C–G) GSEA analysis. The upregulated gene sets in ES2-HM based on hallmark gene sets, Kyoto Encyclopedia of Genes and Genomes gene sets and Gene Ontology gene sets.
(H) qRT-PCR. The mRNA levels of a series of genes involved in ECM regulation and EMT in ES2 and ES2-HM, data are represented as mean ± SD.
(I) qRT-PCR. ADAMTS2 mRNA levels in OC cells, data are represented as mean ± SD.
(J) qRT-PCR. Adamts2 mRNA levels in ID8 and ID8-HM cells, data are represented as mean ± SD.
(K) Western blot Analysis of ADAMTS2 protein levels in the lysate (upper panel) and the cell culture supernatant (lower panel) of OC cell lines.
(L) Representative images of IHC (ADAMTS2) staining in ES2 and ES2-HM derived orthotopic xenografts and picrosirius red staining in ES2 and ES2-HM derived omental metastasis (magnification 400×, scale bar: 20 μm).
(M) Representative images of IHC (ADAMTS2) staining in ID8 and ID8-HM tumors (magnification 400×, scale bar: 20 μm). P values were calculated using the unpaired Student’s t test or Welch’s t-test. ∗, P < 0.05; ∗∗, P < 0.01. DEGs, differentially expressed genes; ECM, extracellular matrix; EMT, epithelial-mesenchymal transition; ADAMTS2, A disintegrin and metalloproteinase with thrombospondin type 1 motifs 2.
Highly expression of genes upregulated in ES2-HM predicted poor prognosis in ovarian cancer patients
An excellent in vitro model of cancer should be able to reflect the characteristics of tumors from patients. To confirm the representativeness of ES2-HM, we collected paired tumor tissues of omental metastases and primary sites from 49 OC patients, and IHC revealed that ADAMTS2 expression was higher in omental metastases than in primary sites (Figures 5A and S6), which was in accordance with the results of the Oncomine database23 (Figure 5B). Next, IHC and survival analysis were performed on a tissue chip generated from 53 OC patients. The patients with higher expression of ADAMTS2 had a shorter OS than those with lower expression (Figures 5C and S6). Kaplan-Meier curve and Cox regression were used to investigate the associations between genes upregulated in ES2-HM and OS of OC patients from The Cancer Genome Atlas (TCGA) database. The results showed that some of the genes upregulated in ES2-HM were significantly associated with the OS of patients and that high ADAMTS2 expression was a risk factor for OS in OC patients (Figures 5D and 5E). Combined with the 53 OC patients’ IHC analysis and their clinical and pathological information, we confirmed that high expression of ADAMTS2 was a risk factor for OS in OC patients (Figures 5F and S7). Analysis of TCGA data and OC patient tissue chips suggested that the molecular characteristics of OC could be reflected by ES2-HM cells.
Figure 5.

Highly expression of genes upregulated in ES2-HM predicted poor prognosis in ovarian cancer patients
(A) Representative images of ADAMTS2 staining in paired tumor tissues of omental metastasis and primary site from 49 ovarian cancer patients (magnification 400×, scale bar: 20 μm). Right: IHC scores are shown in violin plot.
(B) ADAMTS2 mRNA levels in primary and metastatic tumors of ovarian cancer from Oncomine database, data are represented as mean ± SD.
(C) The difference of OS between ADAMTS2-High and ADAMTS2-low patients by KM analysis.
(D) The associations between genes upregulated in ES2-HM and overall survival of ovarian cancer patients from TCGA database by KM analysis.
(E) The associations between genes upregulated in ES2-HM and overall survival of ovarian cancer patients from TCGA database by univariate Cox regression analysis.
(F) The influence of ADAMTS2 and clinical-pathological factors on the OS of 53 ovarian cancer patients by univariate Cox regression analysis. P values were calculated using the paired t-test(A), Mann-Whitney test (B) or log rank test (C–F). ∗, P < 0.05; ∗∗∗, P < 0.001. ADAMTS2, A disintegrin and metalloproteinase with thrombospondin type 1 motifs 2; OS, overall survival; KM, Kaplan-Meier.
The aforementioned results demonstrated that the spontaneous metastatic mouse model and the HM cells from in vivo selection, such as ES2-HM and ID8-HM, can serve as ideal preclinical models for anti-metastasis therapy for OC.
Discussion
In this study, we successfully developed a spontaneous metastatic OC mouse model and a strategy to establish an omentum-derived OC HM cell line through in vivo selection. Based on orthotopic engraftment, the spontaneous metastatic model could recapitulate the whole progression of OC, consisting of in situ growth, exfoliation, abdominal spreading, omentum colonization, and ascites formation.7 Similar to its parental cells, the HM cells may represent a cell subline enriched with heterogeneous cell clones with omental tropism. The cells exhibited strong metastasis potential both in vivo and in vitro and showed marked omental metastatic proclivity in vivo. The DEGs were screened by RNA sequencing, which revealed that the HM properties of ES2-HM cells may be related to ECM regulation and EMT. Combined with analyses of clinical samples, we demonstrated that the spontaneous metastatic model and the derived HM cells could be appropriate preclinical models for OC research.
The pivotal role of the tumor microenvironment (TME) in the initiation and progression of OC and resistance against anticancer agents has received increased attention.24 Therefore, in vivo models play an irreplaceable role in OC studies. The mouse models utilized in OC research can be classified into two categories. The first is the transplantation model, including subcutaneous, intraperitoneal, and orthotopic models. The subcutaneous model is widely used in studies involving therapy and chemoresistance owing to the convenience of monitoring. The crosstalk between tumor cells and microenvironment components is not negligible.25 The lack of an appropriate microenvironment limits the significance of the subcutaneous model. The intraperitoneal model is a metastatic model that reflects the late stage of OC. Omental tropism is a prominent characteristic of OC metastasis.7 The passive metastasis built by intraperitoneal injection is not able to recapture the omental tropism of OC cells. The orthotopic model is an ideal model for tumor research, considering that it has a physically relative TME. However, some researchers think the anatomical difference between mouse and human ovaries makes the orthotopic model less desirable for studies on the late stage of tumor progression. The bursa covering mouse ovaries might disturb ascites formation, which is a widely recognized behavior of OC.7,16 In this study, we developed a spontaneous metastatic mouse model based on orthotopic engrafts that was able to recapitulate the sequential courses of OC progression, in which we observed stable in situ growth, omental metastasis, and ascites formation. The second type of model is the genetically engineered mouse model (GEMM), a spontaneous tumor model widely used in research on OC initiation. However, the development of GEMMs requires an understanding of the genetic basis of OC,26 which is still unclear. Furthermore, the long periods needed, undesired tumorigenesis, difficulties of monitoring and high-cost limit the utilization of GEMMs.27 The spontaneous metastatic mouse model is easy to generate and the cost is relatively lower than that of GEMMs. In addition, the progression of tumors can be monitored by BLI, which is a noninvasive imaging technique.
Although there are plenty of OC cell lines that could be utilized, the representativeness of the cell lines was recently challenged. Silvia et al. investigated the genomic profiles of 47 OC cell lines, which indicated that some OC cell lines frequently used were probably not of the high-grade serous OC subtype.28 Considering the heterogeneity of OC, patient-derived xenografts (PDXs) and patient-derived organoids (PDOs) are becoming increasingly popular and can maintain the histological and molecular characteristics of patients.29 The method commonly used to establish PDXs is subcutaneous injection. The relevant TME is not present in subcutaneous models, which limits the application of PDXs. Combined with the spontaneous metastatic model, PDXs could be more reflective of cancer progression in patients. Employing PDOs instead of OC cell lines could enhance the representativeness of spontaneous metastatic models. This combination will help PDXs and PDOs become ideal models for research involving the development of individual therapy strategies and investigating chemoresistance mechanisms. Immunotherapy has become a frontier in cancer treatment and has been approved for use in any solid tumor.30 However, there is currently no approved immunotherapy for OC. Several clinical trials have failed in OC. The use of immune checkpoint inhibitors did not improve the progression-free survival or OS of OC patients.31,32 Previous studies indicated that OC may be immunogenic. Thus, strategies are being adapted to improve the efficacy of immunotherapy, including selecting patients based on immune profiling and combining with other therapeutics.33 The syngeneic OC model with a complete immune system is particularly useful in studying antitumor immunity. The ID8-HM cell line was isolated from C57BL/6 mice, and its success indicated that spontaneous metastasis could occur in the syngeneic OC model, which should facilitate the development of immunotherapies.
Due to the high level of metastasis in OC, it is important to apply paired metastatic and primary OC cells in metastasis-associated studies. Many studies on the establishment of HM cell lines have been carried out utilizing invasion assays in vitro and subcutaneous and peritoneal disseminated tumor models in vivo because of the convenience of their establishment and monitoring. In terms of OC, Gu et al. screened A2780-M cells through continuous Transwell invasion assays.9 Yu et al. established the SKOV3.ip1 cell line from the ascites of the mouse injected by SKOV3 cells intraperitoneally.34 In recent decades, the unique organ metastasis and colonization patterns of different types of tumors have attracted attention. The classic seed-and-soil hypothesis from Paget35 has given rise to two major research hotspots: the cancer cell “seeds” that cause metastasis and the premetastatic niche “soil” that provides a congenial environment in targeted organs. It is believed that in vivo selection could enrich cells with enhanced metastatic ability.36 Therefore, we employed the spontaneous metastatic model to generate HM cells through in vivo selection, which may reflect the properties and gene expression profiles of metastatic OC more accurately. EMT is an important cellular remodeling mechanism.37 Upregulation of the main EMT-related genes and signaling pathways was observed in ES2-HM cells by RNA sequencing. The formation of a premetastatic niche requires the activity of cancer cells.38 We found that multiple mRNAs of genes related to the formation of the premetastatic niche were upregulated in ES2-HM cells, such as ADAMTS2, matrix metalloproteinase 2, vascular endothelial growth factor A, colony stimulating factor 3, and transforming growth factor β2. ADAMTS2 was the most upregulated gene in ES2-HM cells, and its mRNA level was increased in both ES2-HM and ID8-HM cells, suggesting that its ability to modify ECM may be enhanced in HM cells. Moreover, more active angiogenesis was observed in ES2-HM-derived omental metastasis, which indicated the activation of endothelial cells and the reconstruction of the omental microenvironment. These results suggested that the induction of the premetastatic niche and the EMT of cancer cells contributed to the outgrowth of HM cells in the omentum. The formation mechanisms of the omental premetastatic niche will be explored in the next study. Considering that the high mortality of OC patients could be attributed to the wide metastasis within the peritoneal cavity,39 the paired HM and parental cells expanded the pool of cell lines for OC research.
Limitations of the study
As the basis of in vivo selection is enrichment, studies have shown that the proportion of cancer stem cell-like side populations after enrichment declines rapidly upon passaging.40 Similarly, HM cells may lose their HM properties under long-term in vitro culturing. Therefore, it is necessary to regularly repeat in vivo selection to maintain the enrichment state. Considering that the most common pathological subtype of epithelial OC is high-grade serous carcinoma, which accounts for more than 70%,41 more attempts need to be made to conduct spontaneous metastatic models on other OC cell lines, PDXs, and PDOs to improve the tool platform for exploring the metastatic mechanism of OC and individual therapeutic strategies for OC patients.
STAR★Methods
Key resources table
| REAGENT or RESOURCE | SOURCE | IDENTIFIER |
|---|---|---|
| Antibodies | ||
| β-Actin Rabbit mAb | Abclonal | Cat# AC026; RRID: AB_2768234 |
| GAPDH Monoclonal antibody | Proteintech | Cat# 60004-1-Ig; RRID: AB_2107436 |
| CD31 (PECAM-1) (D8V9E) XP®Rabbit mAb | CST | Cat# 77699; RRID: AB_2722705 |
| ADAMTS2 Polyclonal Antibody | Invitrogen | Cat# PA5-78728; RRID: AB_2745844 |
| Anti-CD105 antibody | Abcam | ab221675 |
| Recombinant Anti-Vimentin antibody [EPR3776] - Cytoskeleton Marker | Abcam | Cat# ab92547, RRID: AB_10562134 |
| E-Cadherin Rabbit mAb | Abclonal | A20798 |
| ADAMTS2 Rabbit pAb | Abclonal | A10272 |
| Chemicals, peptides, and recombinant proteins | ||
| Matrigel | Corning | #354234 |
| Calcium AM | Invitrogen | C1429 |
| D-Luciferin potassium salt | Perkin-Elmer | #122799 |
| A rabbit biotin-streptavidin horseradish peroxidase detection system | ZSGB-BIO | SP-9001 |
| Collagenase type Ⅰ | Biosharp | BS163 |
| Cell-Light EdU kit | RiboBio | C10310-1 |
| RIPA | Beyotime | P0013B |
| Cooktail | Sigma | P8340 |
| BCA assay | Beyotime | P10012 |
| Ponceau S | Beyotime | P0022 |
| TRIzol reagent | Vazyme | R401-01 |
| SYBR Green Fast qPCR Mix | Abclonal | RK21203 |
| ABScript III RT Master Mix | Abclonal | RK20429 |
| Picrosirius red | Maokang Biotech | MM1036 |
| RNAiso Plus | Takara | #9109 |
| Deposited data | ||
| GDC TCGA Ovarian Cancer | TCGA | 2022. Sep. 19 |
| RNA-seq matrix of ES2 and ES2-HM | GSA-Human | HRA004178 |
| The expression of ADAMTS2 in primary and metastatic site from Oncomine database | Mendeley Data | https://doi.org/10.17632/z7rz4488t8.1 |
| Experimental models: Cell lines | ||
| ES-2 | China Center for Type Culture Collection | GDC0322 |
| ID8-luc | Xiao Haihua’s laboratory, Chinese Academy of Sciences, Beijing | N/A |
| Experimental models: Organisms/strains | ||
| Mouse:4-week-old BALB/c Nude Mice: CAnN.Cg-Foxn1nu/Crl | Charles River | 401 |
| Mouse:4-week-old C57BL/6N: C57BL/6NCrl | Charles River | 213 |
| Oligonucleotides | ||
| qRT-PCR primers | See Table S1 for primer | N/A |
| Software and algorithms | ||
| GSEA | US San Diego | 4.2.3 |
| R | CRAN | 4.1.3 |
| Prism | Graphpad | 9.4 |
| Living Image® Software | Caliper Life Science | 4.3.1 |
Resource availability
Lead contact
Further information and requests for resources and reagents should be directed to and will be fulfilled by the lead contact, Zehua Wang (zehuawang@hust.edu.cn) or Jing Cai (jingcai@hust.edu.cn).
Materials availability
This study did not generate new unique reagents.
Experimental model and subject details
Cell lines
The murine OC cell line ID8 expressing firefly luciferase was a gift of Xiao Haihua’s laboratory, Chinese Academy of Sciences, Beijing, China. The human OC cell line ES2 cells were purchased from China Center for Type Culture Collection, Wuhan, China, and its subline expressing firefly luciferase and EGFP was established and maintained as previously described.15 Both cells were cultured in DMEM/F12 medium supplemented with 10% FBS. For subcutaneous inoculation, cells were collected in a logarithmic growth phase. The cells have been authenticated using short tandem repeat profiling within the last two years. All cells were free of mycoplasma.
Animals
All animal experiments were conducted at the Laboratory Animal Center at the Huazhong University of Science and Technology and approved by the Institutional Animal Care and Use Committee at Tongji Medical College, Huazhong University of Science and Technology. Female BALB/c Nude mice aged 4 weeks (Charles River, China) and female C57BL/6N aged 4 weeks (Charles River, China) were housed under specific pathogen-free (SPF) conditions. The tumor-bearing mice were euthanized at a humane endpoint of massive ascites formation.
Human subjects
The research was approved by the Ethics Committee of Tongji Medical College, Huazhong University of Science and Technology. The informed consent was obtained from all patients. The clinical and pathological information of patients used in this study are available in the main text or the Table S2.
Method details
Orthotopic models
Orthotopic inoculation was conducted on mice aged 5 weeks (3 mice per group). Briefly, tissue blocks (sized 1–2 mm3) derived from subcutaneous tumors were inserted into the ovarian bursa of the mice (detailed procedures shown in Figure 1B).
In vivo selection
For in vivo selection, one cycle of selection consists of orthotopic transplantation and subsequently spontaneous omental metastasis. For in vivo passaging, omental metastasis lesions were obtained for orthotopic transplantation in mice. Briefly, passage 1 orthotopic mouse models using ES2 cells were established. When peritoneal dissemination was detected, omental tissue, containing metastatic lesions was obtained for transplantation of passage 2 mice. Three cycles of selection were conducted in this study (procedures shown in Figure 1C).
Bioluminescent imaging (BLI)
Disease progression was monitored by BLI on an in vivo imaging system (IVIS, Lumina Ⅱ, Caliper Life Science, USA) every three days. The firefly luciferase substrate D-luciferin potassium salt (#122799, Perkin-Elmer, USA) was intraperitoneally injected into the mice at a dose of 150 mg/kg, 15 minutes prior to imaging. During imaging, isoflurane was administered to keep the mice anesthetized. The radiance value was measured by Living Image® Software (4.3.1, Caliper Life Science, USA) using the region of interest (ROI) tools. For ex vivo BLI, the tissues and cells were immersed in the working D-luciferin working solution at a concentration of 150 μg/ml and incubated at 37 °C for 3 minutes before imaging.
Immunohistochemistry (IHC)
Tissues were fixed in formalin and embedded in paraffin, and the sections were used for hematoxylin-eosin staining and IHC. For IHC, the sections were subjected to heat-mediated antigen retrieval in pH 6.0 citrate buffer after routine deparaffinization and rehydration. The following staining steps were conducted using a rabbit biotin-streptavidin horseradish peroxidase detection system (SP-9001, ZSGB-BIO, China). The staining images of tumor tissues were evaluated by two researchers, according to the staining intensity. The CD31 antibody (#77699, CST, USA) and endoglin antibody (ab221675, Abcam, UK) were diluted at 1:100. The ADAMTS2 antibody (PA5-78728, Invitrogen, USA) was diluted at 1:500. Finally, the sections were counterstained with hematoxylin.
Primary culture
The omental tissue obtained from passage 3 mice was minced into 0.1 mm3 pieces. The samples were digested with 1 mg/ml of collagenase type Ⅰ (BS163, Biosharp, China) at 37 °C on a thermostat shaker at 150 rpm for 1 hour. After a 75 μm filtration, the suspension was centrifuged, and the cells were then plated in flasks.
Flow cytometry
The tumor cells were collected and washed by PBS for three times. Then the cells were diluted to a concentration of about 5×10⁶/ml. After that the expression of EGFP was analyzed by the flow cytometer (MoFlo XDP, Beckman Coulter). The radio of EGFP+ cells was calculated.
5-Ehtynyl-2′-deoxyuridine (EdU) assay
A Cell-Light EdU kit (C10310-1, RiboBio, China) was used to detect the proliferative proportion of cancer cells. The assay was conducted following the manufacturer’s instructions. Fluorescent images were captured at a magnification of 200×. At least 10 images were captured for each sample. Edu positive cell (red) numbers and total cell (blue) numbers were counted and Edu positive ratios of every image were calculated. The average Edu positive ratio was calculated for each sample. The assays were performed in triplicate.
Transwell migration and invasion assay
In migration assays, 25,000 cells suspended in 300 μl of serum-free medium were added to the upper compartment of permeable transwell insert in a 24-well plate (#3422, Corning, USA), and 500 μl of DMEM/F12 medium supplemented with 5% fetal bovine serum was added to the lower compartment. Any air bubbles that may have existed under the chamber were eliminated. The plates were then incubated at 37 °C for 24 hours. The non-invading cells on the apical side of the chamber were carefully removed with a cotton swab. Left cells were stained by calcium AM (C1429, Invitrogen, USA), and images were acquired of the upper, lower, left, right, and middle quadrants of the membrane under a fluorescence microscope at a magnification of 200×. The cell number was counted and averaged for each sample. For invasion assays, the transwell insert was coated with 100 μl of Matrigel (#354234, Corning, USA) working solution at a concentration of 200–300 μg/ml and incubated at 37 °C for 2 hours. The assays were performed in triplicate.
Adhesion assay
The 96-well plates were coated with 100 μl of Matrigel (#354234, Corning, USA) working solution at a concentration of 40 μg/ml and incubated at 37 °C for 30 minutes. Then, 10,000 cells/100 μl suspension was added to each well and incubated at 37 °C for 40 or 80 minutes. The supernatant was discarded and the wells were rinsed with phosphate-buffered saline (PBS). Images of the cells were acquired under a fluorescence microscope at a magnification of 100×. Five fields of view were randomly selected in each well. The cell number was counted and averaged for each sample. The assays were performed in triplicate.
Colony formation assay
One hundred cells were inoculated in each well of a 6-well plate. Culture medium was added, and the cells were cultured for 10 days in an incubator. After washing with PBS, the cells were fixed with 4% paraformaldehyde for 30 minutes and stained with 0.1% crystal violet solution for 15–30 minutes. The plate was carefully rinsed with running water until the eluate was clear. Following drying of the plate, photos were taken, and the number of clones in each well was counted. The assays were performed in triplicate.
Western blot
For cell lysate, total cellular proteins were extracted by RIPA (P0013B, Beyotime, China) with 1% cooktail (P8340, Sigma, USA). For cell culture supernatant, proteins in supernatant were concentrated by Amicon® Ultra-4 Centrifugal Filter (UFC8030, Millipore, the USA) following the manufacturer’s instructions. Proteins were quantified by BCA assay (P10012, Beyotime, China) and 10 μg of each sample was loaded for blotting process. The primary antibodies used were anti-ADAMTS2 (1:1000, A10272, Abclonal, China), anti-GAPDH (1:10000, 60004-1-Ig, Proteintech, USA), E-cadherin (1:1000, A20798, Abclonal, China), vimentin (1:1000, ab92547, Abcam, UK) and β-actin (1:1000, AC026, Abclonal, China). Ponceau S (P0022, Beyotime, China) was used to stain culture supernatant western blot for total protein concentrations. Each experiment was performed in triplicate.
Quantitative reverse transcription- polymerase chain reaction (qRT-PCR)
Total RNAs of cells were isolated using TRIzol reagent (R401-01, Vazyme, China), followed by reverse transcription with ABScript III RT Master Mix (RK20429, Abclonal, China). qRT-PCR was performed with SYBR Green Fast qPCR Mix (RK21203, Abclonal, China) on a qTOWER3 Real-Time PCR System (analytikjena, Germany). The relative expression of each mRNA was normalized using 2−ΔΔCt method. Each experiment was performed in triplicate. The primers (Tsingke, China) used were presented in Table S1.
Picrosirius red staining
Picrosirius red (MM1036, Maokang Biotech, China) was used to stain collagen in paraffin tissues. The assay was conducted following the manufacturer’s instructions. In brief, after deparaffinization and rehydration, tissue sections were stained with Weigert's hematoxylin and picrosirius red. Then tissue sections were washed in two changes of acidified water. Finally, sections were dehydrated and cleared. Images were acquired at a magnification of 400×. The collagen fibers were dyed red.
Next-generation sequencing
The total RNA was extracted from cultured cells with RNAiso Plus (#9109, Takara, Japan) and applied to Oligo(dT) magnetic beads to enrich the mRNA with poly-A tail. Then, the mRNA was randomly cut into fragments with divalent cations in NEB Fragmentation Buffer. The mRNA fragments were transcribed into cDNA and amplified to construct the library. After quality inspection and pooling, the library sequencing was conducted at the Illumina Novaseq 6000 platform (Novogene Co., Ltd., Beijing, China). The following analyses were performed by R (4.1.3) and GSEA (4.2.3).44,45
Oncomine and The Cancer Genome Atlas (TCGA) database
For ovarian cancer data of Oncomine database, differential ADAMTS2 mRNA expressions between primary and metastatic tumors were analyzed using Mann-Whitney test and visualized by Graphpad Prism 9.4. The primary data from Oncomine was provided in Supplement data. For data of TCGA, Kaplan-Meier (KM) analyses for overall survival were performed using “survival” and “survminer” packages. Univariate cox regression analyses were performed using “survival” and “survminer” packages and the result was visualized by “forestploter” package.
Quantification and statistical analysis
Graphpad Prism 9.4 and R 4.1.3 were used to perform all statistical analysis. All data are presented as the mean ± standard deviation or in quartiles. The differences between two groups were analyzed by unpaired or paired t-test, Welch’s t-test or Mann-Whitney test. The differences among three groups were analyzed by one-way analysis of variance. KM analyses were performed in survival analyses and log-rank test was utilized. Cox regression was applied to screen survival-associated genes and clinical-pathological factors. The results were considered to be statistically significant at P values < 0.05. More details were provided in figure legends.
Acknowledgments
This study was supported by the National Natural Science Foundation of China (No. 81772781, No.81472443).
Author contributions
Conceptualization, Y.F.Q., G.J., C.J., and W.Z.H.; Methodology, Y.F.Q. and G.J.; Formal Analysis, Y.F.Q., G.J., C.J., and W.Z.H.; Investigation, Y.F.Q., G.J., G.X.J., H.L., and G.L.L.; Resources, C.J. and W.Z.H.; Writing- Original Draft, Y.F.Q., G.J., C.J., and W,Z,H,; Writing- Review & Editing, Y.F.Q., C.J., and W.Z.H.; Supervision, W.Z.H.; Project Administration, C.J.; Funding Acquisition, W.Z.H.
Declaration of interests
The authors declare no competing interests.
Published: April 23, 2023
Footnotes
Supplemental information can be found online at https://doi.org/10.1016/j.isci.2023.106719.
Contributor Information
Jing Cai, Email: jingcai@hust.edu.cn.
Zehua Wang, Email: zehuawang@hust.edu.cn.
Supplemental information
Data and code availability
-
•
The raw sequence data reported in this paper have been deposited in the Genome Sequence Archive42 in National Genomics Data Center,43 China National Center for Bioinformation/Beijing Institute of Genomics, Chinese Academy of Sciences (GSA-Human: HRA004178) that are publicly accessible at https://ngdc.cncb.ac.cn/gsa-human. The GSA number is listed in the key resources table. The data from Oncomine database has been deposited at Mendeley and are publicly available as of the date of publication. The DOI is listed in the key resources table. All the other data reported in this paper will be shared by the lead contact upon request.
-
•
There is no original code in this study.
-
•
Any additional information required to reanalyze the data reported in this paper is available from the lead contact upon request.
References
- 1.Lheureux S., Gourley C., Vergote I., Oza A.M. Epithelial ovarian cancer. Lancet. 2019;393:1240–1253. doi: 10.1016/S0140-6736(18)32552-2. [DOI] [PubMed] [Google Scholar]
- 2.Kuroki L., Guntupalli S.R. Treatment of epithelial ovarian cancer. BMJ. 2020;371:m3773. doi: 10.1136/bmj.m3773. [DOI] [PubMed] [Google Scholar]
- 3.Doig T., Monaghan H. Sampling the omentum in ovarian neoplasia: when one block is enough. Int. J. Gynecol. Cancer. 2006;16:36–40. doi: 10.1111/j.1525-1438.2006.00273.x. [DOI] [PubMed] [Google Scholar]
- 4.Siegel R.L., Miller K.D., Wagle N.S., Jemal A. Cancer statistics, 2023. CA. Cancer J. Clin. 2023;73:17–48. doi: 10.3322/caac.21763. [DOI] [PubMed] [Google Scholar]
- 5.Kerbel R.S. A decade of experience in developing preclinical models of advanced- or early-stage spontaneous metastasis to study aantiangiogenic drugs, metronomic chemotherapy, and the tumor microenvironment. Cancer J. 2015;21:274–283. doi: 10.1097/PPO.0000000000000134. [DOI] [PubMed] [Google Scholar]
- 6.Lambert A.W., Pattabiraman D.R., Weinberg R.A. Emerging biological principles of metastasis. Cell. 2017;168:670–691. doi: 10.1016/j.cell.2016.11.037. [DOI] [PMC free article] [PubMed] [Google Scholar]
- 7.Naora H., Montell D.J. Ovarian cancer metastasis: integrating insights from disparate model organisms. Nat. Rev. Cancer. 2005;5:355–366. doi: 10.1038/nrc1611. [DOI] [PubMed] [Google Scholar]
- 8.Suhail Y., Cain M.P., Vanaja K., Kurywchak P.A., Levchenko A., Kalluri R., Kshitiz Systems biology of cancer metastasis. Cell Syst. 2019;9:109–127. doi: 10.1016/j.cels.2019.07.003. [DOI] [PMC free article] [PubMed] [Google Scholar]
- 9.Ruibin J., Guoping C., Zhiguo Z., Maowei N., Danying W., Jianguo F., Linhui G. Establishment and characterization of a highly metastatic ovarian cancer cell line. BioMed Res. Int. 2018;2018:3972534. doi: 10.1155/2018/3972534. [DOI] [PMC free article] [PubMed] [Google Scholar]
- 10.Watters K.M., Bajwa P., Kenny H.A. Organotypic 3D models of the ovarian cancer tumor microenvironment. Cancers. 2018;10:E265. doi: 10.3390/cancers10080265. [DOI] [PMC free article] [PubMed] [Google Scholar]
- 11.Mitra A.K., Chiang C.Y., Tiwari P., Tomar S., Watters K.M., Peter M.E., Lengyel E. Microenvironment-induced downregulation of miR-193b drives ovarian cancer metastasis. Oncogene. 2015;34:5923–5932. doi: 10.1038/onc.2015.43. [DOI] [PMC free article] [PubMed] [Google Scholar]
- 12.Hoffman R.M. Orthotopic metastatic mouse models for anticancer drug discovery and evaluation: a bridge to the clinic. Invest. N. Drugs. 1999;17:343–359. doi: 10.1023/A:1006326203858. [DOI] [PubMed] [Google Scholar]
- 13.Ireson C.R., Alavijeh M.S., Palmer A.M., Fowler E.R., Jones H.J. The role of mouse tumour models in the discovery and development of anticancer drugs. Br. J. Cancer. 2019;121:101–108. doi: 10.1038/s41416-019-0495-5. [DOI] [PMC free article] [PubMed] [Google Scholar]
- 14.Pisano S., Lenna S., Healey G.D., Izardi F., Meeks L., Jimenez Y.S., Velazquez O.S., Gonzalez D., Conlan R.S., Corradetti B. Assessment of the immune landscapes of advanced ovarian cancer in an optimized in vivo model. Clin. Transl. Med. 2021;11:e551. doi: 10.1002/ctm2.551. [DOI] [PMC free article] [PubMed] [Google Scholar]
- 15.Guo J., Cai J., Zhang Y., Zhu Y., Yang P., Wang Z. Establishment of two ovarian cancer orthotopic xenograft mouse models for in vivo imaging: a comparative study. Int. J. Oncol. 2017;51:1199–1208. doi: 10.3892/ijo.2017.4115. [DOI] [PubMed] [Google Scholar]
- 16.Karakashev S., Zhang R.-G. Mouse models of epithelial ovarian cancer for preclinical studies. Zool. Res. 2021;42:153–160. doi: 10.24272/j.issn.2095-8137.2020.382. [DOI] [PMC free article] [PubMed] [Google Scholar]
- 17.Lawson D.A., Kessenbrock K., Davis R.T., Pervolarakis N., Werb Z. Tumour heterogeneity and metastasis at single-cell resolution. Nat. Cell Biol. 2018;20:1349–1360. doi: 10.1038/s41556-018-0236-7. [DOI] [PMC free article] [PubMed] [Google Scholar]
- 18.Nakayama J., Han Y., Kuroiwa Y., Azuma K., Yamamoto Y., Semba K. The in vivo selection method in breast cancer metastasis. Int. J. Mol. Sci. 2021;22:1886. doi: 10.3390/ijms22041886. [DOI] [PMC free article] [PubMed] [Google Scholar]
- 19.Ma L., Sakamoto Y., Kanai A., Otsuka H., Takahashi A., Kakimi K., Imai T., Shimokawa T. Characterization of a novel murine colon carcinoma subline with high-metastatic activity established by in vivo selection method. Int. J. Mol. Sci. 2020;21:E2829. doi: 10.3390/ijms21082829. [DOI] [PMC free article] [PubMed] [Google Scholar]
- 20.Nguyen D.X., Massagué J. Genetic determinants of cancer metastasis. Nat. Rev. Genet. 2007;8:341–352. doi: 10.1038/nrg2101. [DOI] [PubMed] [Google Scholar]
- 21.Gonzalez D.M., Medici D. Signaling mechanisms of the epithelial-mesenchymal transition. Sci. Signal. 2014;7:re8. doi: 10.1126/scisignal.2005189. [DOI] [PMC free article] [PubMed] [Google Scholar]
- 22.Leduc C., Dupont L., Joannes L., Monseur C., Baiwir D., Mazzucchelli G., Deroanne C., Colige A., Bekhouche M. In vivo N-terminomics highlights novel functions of ADAMTS2 and ADAMTS14 in skin collagen matrix building. Front. Mol. Biosci. 2021;8:643178. doi: 10.3389/fmolb.2021.643178. [DOI] [PMC free article] [PubMed] [Google Scholar]
- 23.Rhodes D.R., Kalyana-Sundaram S., Mahavisno V., Varambally R., Yu J., Briggs B.B., Barrette T.R., Anstet M.J., Kincead-Beal C., Kulkarni P., et al. Oncomine 3.0: genes, pathways, and networks in a collection of 18,000 cancer gene expression profiles. Neoplasia. 2007;9:166–180. doi: 10.1593/neo.07112. [DOI] [PMC free article] [PubMed] [Google Scholar]
- 24.Jiang Y., Wang C., Zhou S. Targeting tumor microenvironment in ovarian cancer: premise and promise. Biochim. Biophys. Acta, Rev. Cancer. 2020;1873:188361. doi: 10.1016/j.bbcan.2020.188361. [DOI] [PubMed] [Google Scholar]
- 25.Cummings M., Freer C., Orsi N.M. Targeting the tumour microenvironment in platinum-resistant ovarian cancer. Semin. Cancer Biol. 2021;77:3–28. doi: 10.1016/j.semcancer.2021.02.007. [DOI] [PubMed] [Google Scholar]
- 26.Howell V.M. Genetically engineered mouse models for epithelial ovarian cancer: are we there yet? Semin. Cell Dev. Biol. 2014;27:106–117. doi: 10.1016/j.semcdb.2014.03.019. [DOI] [PubMed] [Google Scholar]
- 27.Zhai Y., Wu R., Kuick R., Sessine M.S., Schulman S., Green M., Fearon E.R., Cho K.R. High-grade serous carcinomas arise in the mouse oviduct via defects linked to the human disease. J. Pathol. 2017;243:16–25. doi: 10.1002/path.4927. [DOI] [PMC free article] [PubMed] [Google Scholar]
- 28.Domcke S., Sinha R., Levine D.A., Sander C., Schultz N. Evaluating cell lines as tumour models by comparison of genomic profiles. Nat. Commun. 2013;4:2126. doi: 10.1038/ncomms3126. [DOI] [PMC free article] [PubMed] [Google Scholar]
- 29.Yoshida G.J. Applications of patient-derived tumor xenograft models and tumor organoids. J. Hematol. Oncol. 2020;13:4. doi: 10.1186/s13045-019-0829-z. [DOI] [PMC free article] [PubMed] [Google Scholar]
- 30.Ferrall L., Lin K.Y., Roden R.B.S., Hung C.-F., Wu T.-C. Cervical cancer immunotherapy: facts and hopes. Clin. Cancer Res. 2021;27:4953–4973. doi: 10.1158/1078-0432.CCR-20-2833. [DOI] [PMC free article] [PubMed] [Google Scholar]
- 31.Moore K.N., Bookman M., Sehouli J., Miller A., Anderson C., Scambia G., Myers T., Taskiran C., Robison K., Mäenpää J., et al. Atezolizumab, bevacizumab, and chemotherapy for newly diagnosed stage III or IV ovarian cancer: placebo-controlled randomized phase III trial (IMagyn050/GOG 3015/ENGOT-OV39) J. Clin. Oncol. 2021;39:1842–1855. doi: 10.1200/JCO.21.00306. [DOI] [PMC free article] [PubMed] [Google Scholar]
- 32.Pujade-Lauraine E., Fujiwara K., Ledermann J.A., Oza A.M., Kristeleit R., Ray-Coquard I.-L., Richardson G.E., Sessa C., Yonemori K., Banerjee S., et al. Avelumab alone or in combination with chemotherapy versus chemotherapy alone in platinum-resistant or platinum-refractory ovarian cancer (JAVELIN Ovarian 200): an open-label, three-arm, randomised, phase 3 study. Lancet Oncol. 2021;22:1034–1046. doi: 10.1016/S1470-2045(21)00216-3. [DOI] [PubMed] [Google Scholar]
- 33.Morand S., Devanaboyina M., Staats H., Stanbery L., Nemunaitis J. Ovarian cancer immunotherapy and personalized medicine. Int. J. Mol. Sci. 2021;22:6532. doi: 10.3390/ijms22126532. [DOI] [PMC free article] [PubMed] [Google Scholar]
- 34.Yu D., Wolf J.K., Scanlon M., Price J.E., Hung M.C. Enhanced c-erbB-2/neu expression in human ovarian cancer cells correlates with more severe malignancy that can be suppressed by E1A. Cancer Res. 1993;53:891–898. [PubMed] [Google Scholar]
- 35.Paget S. The distribution of secondary growths in cancer of the breast. 1889. Cancer Metastasis Rev. 1989;8:98–101. [PubMed] [Google Scholar]
- 36.Gumireddy K., Sun F., Klein-Szanto A.J., Gibbins J.M., Gimotty P.A., Saunders A.J., Schultz P.G., Huang Q. In vivo selection for metastasis promoting genes in the mouse. Proc. Natl. Acad. Sci. USA. 2007;104:6696–6701. doi: 10.1073/pnas.0701145104. [DOI] [PMC free article] [PubMed] [Google Scholar]
- 37.Pastushenko I., Blanpain C. EMT transition states during tumor progression and metastasis. Trends Cell Biol. 2019;29:212–226. doi: 10.1016/j.tcb.2018.12.001. [DOI] [PubMed] [Google Scholar]
- 38.Liu Y., Cao X. Characteristics and significance of the pre-metastatic niche. Cancer Cell. 2016;30:668–681. doi: 10.1016/j.ccell.2016.09.011. [DOI] [PubMed] [Google Scholar]
- 39.Lengyel E. Ovarian cancer development and metastasis. Am. J. Pathol. 2010;177:1053–1064. doi: 10.2353/ajpath.2010.100105. [DOI] [PMC free article] [PubMed] [Google Scholar]
- 40.Rizzo S., Hersey J.M., Mellor P., Dai W., Santos-Silva A., Liber D., Luk L., Titley I., Carden C.P., Box G., et al. Ovarian cancer stem cell-like side populations are enriched following chemotherapy and overexpress EZH2. Mol. Cancer Therapeut. 2011;10:325–335. doi: 10.1158/1535-7163.MCT-10-0788. [DOI] [PMC free article] [PubMed] [Google Scholar]
- 41.Lheureux S., Braunstein M., Oza A.M. Epithelial ovarian cancer: evolution of management in the era of precision medicine. CA A Cancer J. Clin. 2019;69:280–304. doi: 10.3322/caac.21559. [DOI] [PubMed] [Google Scholar]
- 42.Chen T., Chen X., Zhang S., Zhu J., Tang B., Wang A., Dong L., Zhang Z., Yu C., Sun Y., et al. The genome sequence archive family: toward explosive data growth and diverse data types. Dev. Reprod. Biol. 2021;19:578–583. doi: 10.1016/j.gpb.2021.08.001. [DOI] [PMC free article] [PubMed] [Google Scholar]
- 43.CNCB-NGDC Members and Partners Database resources of the national genomics data center, China national center for bioinformation in 2022. Nucleic Acids Res. 2022;50:D27–D38. doi: 10.1093/nar/gkab951. [DOI] [PMC free article] [PubMed] [Google Scholar]
- 44.Mootha V.K., Lindgren C.M., Eriksson K.-F., Subramanian A., Sihag S., Lehar J., Puigserver P., Carlsson E., Ridderstråle M., Laurila E., et al. PGC-1alpha-responsive genes involved in oxidative phosphorylation are coordinately downregulated in human diabetes. Nat. Genet. 2003;34:267–273. doi: 10.1038/ng1180. [DOI] [PubMed] [Google Scholar]
- 45.Subramanian A., Tamayo P., Mootha V.K., Mukherjee S., Ebert B.L., Gillette M.A., Paulovich A., Pomeroy S.L., Golub T.R., Lander E.S., Mesirov J.P. Gene set enrichment analysis: a knowledge-based approach for interpreting genome-wide expression profiles. Proc. Natl. Acad. Sci. USA. 2005;102:15545–15550. doi: 10.1073/pnas.0506580102. [DOI] [PMC free article] [PubMed] [Google Scholar]
Associated Data
This section collects any data citations, data availability statements, or supplementary materials included in this article.
Supplementary Materials
Data Availability Statement
-
•
The raw sequence data reported in this paper have been deposited in the Genome Sequence Archive42 in National Genomics Data Center,43 China National Center for Bioinformation/Beijing Institute of Genomics, Chinese Academy of Sciences (GSA-Human: HRA004178) that are publicly accessible at https://ngdc.cncb.ac.cn/gsa-human. The GSA number is listed in the key resources table. The data from Oncomine database has been deposited at Mendeley and are publicly available as of the date of publication. The DOI is listed in the key resources table. All the other data reported in this paper will be shared by the lead contact upon request.
-
•
There is no original code in this study.
-
•
Any additional information required to reanalyze the data reported in this paper is available from the lead contact upon request.