

Objective
The aim of this study was to determine the potential of photon-counting detector computed tomography (PCD-CT) for radiation dose reduction compared with conventional energy-integrated detector CT (EID-CT) in the assessment of interstitial lung disease (ILD) in systemic sclerosis (SSc) patients.
Methods
In this retrospective study, SSc patients receiving a follow-up noncontrast chest examination on a PCD-CT were included between May 2021 and December 2021. Baseline scans were generated on a dual-source EID-CT by selecting the tube current-time product for each of the 2 x-ray tubes to obtain a 100% (D100), a 66% (D66), and a 33% dose image (D33) from the same data set. Slice thickness and kernel were adjusted between the 2 scans. Image noise was assessed by placing a fixed region of interest in the subcutaneous fat. Two independent readers rated subjective image quality (5-point Likert scale), presence, extent, diagnostic confidence, and accuracy of SSc-ILD. D100 interpreted by a radiologist with 22 years of experience served as reference standard. Interobserver agreement was calculated with Cohen κ, and mean variables were compared by a paired t test.
Results
Eighty patients (mean 56 ± 14; 64 women) were included. Although CTDIvol of PCD-CT was comparable to D33 (0.72 vs 0.76 mGy, P = 0.091), mean image noise of PCD-CT was comparable to D100 (131 ± 15 vs 113 ± 12, P > 0.05). Overall subjective image quality of PCD-CT was comparable to D100 (4.72 vs 4.71; P = 0.874). Diagnostic accuracy was higher in PCD-CT compared with D33/D66 (97.6% and 92.5%/96.3%, respectively) and comparable to D100 (98.1%).
Conclusions
With PCD-CT, a radiation dose reduction of 66% compared with EID-CT is feasible, without penalty in image quality and diagnostic performance for the evaluation of ILD.
Key Words: computed tomography, systemic sclerosis, radiation dosage, interstitial lung disease, pulmonary fibrosis, chest
Systemic sclerosis (SSc) is a systemic autoimmune disease caused by endothelial dysfunction resulting in small-vessel vasculopathy, fibroblast dysfunction with resultant disproportionate high collagen production and fibrosis, as well as immunological abnormalities.1 Although theoretically any organ system may be affected, pulmonary vessel and fibrotic manifestations resulting in interstitial lung disease (ILD) and pulmonary hypertension are the chief reason of SSc-related death.2 In autopsy studies, up to 100% of SSc patients have shown pulmonary involvement.3
To date, various diagnostic tests are used to detect ILD in SSc patients: The 2 main players are pulmonary function tests and computed tomography (CT).4,5 A recent study showed that 50% to 66% of general rheumatologists and SSc experts ordered CT for ILD screening in newly diagnosed SSc patients.6 Pulmonary function tests are also broadly used to screen SSc patients for ILD, but contrary to CT, they have a low sensitivity for subtle lung changes resulting in a high rate of false-negatives.7,8 Up to 60% of SSc patients will develop interstitial abnormalities during the course of follow-up imaging9 with predominant ground-glass opacities (GGOs) and a low level of reticulation consistent with a nonspecific interstitial pneumonia pattern.10 The downside of CT, however, is repetitive SSc patient exposure to ionizing radiation during long-term follow-up imaging. Recent studies demonstrated that ionizing radiation led to increased DNA damage and chromosome aberrations after standard dose chest CT, whereas no such effect was observed for low-dose CT.11
Therefore, various approaches have been examined for the reduction of radiation dose without a loss in diagnostic accuracy. Among other efforts, reduced slice imaging,5 low radiation dose imaging,12 and the use of magnetic resonance imaging13,14 have been evaluated for the assessment of lung parenchyma alterations in SSc patients. So far, these efforts have been accompanied by a loss of accuracy.15 Photon-counting detector CT (PCD-CT) has already demonstrated an increase in dose efficiency and therefore yields the potential to improve image quality at lower radiation dose.16–18 Studies on preclinical PCD-CTs systems demonstrated encouraging results in lung imaging,19–22 with a gain in image noise and contrast-to-noise-ratio,22–24 along with a betterment of shape and texture features as a result of the higher spatial resolution of PCD-CT in comparison to EID-CT.25
Therefore, this project analyzed the potential of PCD-CT for radiation dose reduction in CT imaging of SSc patients, compared with EID-CT.
METHODS
Patient Cohort
Local ethics committee approval for this study has been sought, and all patients signed written informed consent for the retrospective use of their data. Consecutive patients with SSc confirmed by ACR/EULAR 2013 classification26 receiving a clinically indicated noncontrast chest CT between May and December 2021 have been retrospectively scrutinized. Inclusion criteria were as follows: examination performed on a dual-source PCD-CT (NAEOTOM Alpha; Siemens Healthcare GmbH, Forchheim, Germany) and having a baseline CT performed on a dual-source EID-CT (SOMATOM Force; Siemens Healthcare GmbH, Forchheim, Germany) scan using a split dose protocol. Exclusion criteria were examinations without a dual split dose baseline CT and a weight/age adapted kVp.
Pulmonary Function Test
All patients underwent pulmonary function testing (ZAN500 SpireTM; ZAN, Steyr-Dietach, Austria) at each of the 2 visits (baseline and follow-up). The pulmonary function test (PFT) parameters consisted in the absolute as well as the percentage predicted values with height, age, and sex adjustment (%predicted) of the forced expiratory volume in 1 second (FEV1), total lung capacity (TLC), forced vital capacity (FVC), and FEV1-to-FVC ratio. For reasons of comparability, the percentage of predicted values has been used for statistics.
Image Acquisition
Baseline scans were obtained on an EID-CT with a 2 × 192-slice dual-source CT system (SOMATOM Force; Siemens Healthcare GmbH, Forchheim, Germany) applying the dual-source mode using tin filtration. Images at different dose levels from the same acquired data set were generated by adjusting the tube current time product for each x-ray tubes separately at a fixed tube voltage of 100 kV to obtain a 66% dose image (D66) and a 33% dose image (D33) as shown previously.27 The 66% dose tube has been operated with the larger field of view (50 cm) and the 33% dose tube with the smaller field of view (35 cm). A 100% dose scan (D100) was calculated using the combined image information of the 2 tubes.
For reconstruction, a lung convolution kernel (Bl64) at a slice thickness of 1 mm and an increment of 0.75 mm was used. An advanced modeled iterative reconstruction algorithm (ADMIRE, Siemens) at a level of 3 was applied. To correct for different slice thickness settings of EID and PCD reconstructions, all EID data were resampled to a unified slice thickness of 1.5 mm using an in-house MATLAB script applying cubic interpolation (Release 2019a; MathWorks, Natick, MA) (see Supplemental Material, http://links.lww.com/RLI/A720).
Follow-up scans were acquired on a dual-source PCD-CT (NAEOTOM Alpha; Siemens) using tin filtration. Scanning parameters were as follows: ultra-high resolution mode, 100 kVp, and an image quality level of 15. In PCD-CT, the user can choose the quality reference tube current-time product by selecting among a set of image quality levels. For reconstruction, a lung convolution kernel (Bl64) at a slice thickness of 1.5 mm and an increment of 1 mm was used. A quantum iterative reconstruction algorithm at the level of 3 was used as suggested by Sartoretti et al.28 All scans were performed with automated exposure control. Scanning and reconstruction parameters are detailed in the supplement (Supplemental Table 1, http://links.lww.com/RLI/A721).
Image Quality Assessment
Quantitative Image Quality
Image attenuation (in Hounsfield units, HU) and image noise (defined as standard deviation of attenuation) were measured using a circular region of interest, which was placed in the subcutaneous fat by one blinded reader (in training with 3 years of experience). The region of interest size was fixed at 90 mm2.
Qualitative Image Quality
Qualitative image quality of EID-CT and PCD-CT images was evaluated by 2 readers (both in training, with 2 and 4 years of experience, respectively) in a randomized, blinded fashion. Image evaluation was carried out on a picture archiving and communication system (DeepUnity; Dedalus, DH Healthcare GmbH, Bonn, Germany).
First, readers had to assess overall image quality on a 5-point Likert scale (1, nondiagnostic; 2, fair, 3, moderate; 4, good; 5, perfect). In a second step, readers had to separately evaluate image noise (1, nonacceptable image noise; 2, moderate noise; 3, average image noise; 4, fair image noise; 5, minimal image noise) and sharpness of vessels and bronchi (1, nonacceptable reduction of sharpness; 2, significantly reduced sharpness with blurring; 3, minimally reduced sharpness with blurring; 4, minimally reduced sharpness; 5, perfect sharpness).
Detection of Interstitial Lung Disease
The same 2 readers evaluated the presence (yes/no) and extent of ILD. As formerly proposed, ILD was present if minimum one of the subsequent findings was found: GGOs, subpleural reticulation with or without pleural irregularities (fine reticular changes), traction bronchiectasis, and/or honeycombing (coarse reticulation), as proposed formerly.5 Scars and band-like changes typical for earlier infection were not considered as ILD. According to Goh et al,29 the degree of ILD was rated as no lung involvement, lung involvement below 20% (ie, limited disease), and lung involvement above 20% (ie, extensive disease). First, readers were trained on a set of 10 patients with typical ILD findings (reticulations, honeycombing, and GGO). Second, we provided a list of 320 image series (including images of the 80 included patients in 4 different scan modes) in a random manner to the readers. Readers had to rate if a specific ILD finding was present (yes/no) and assign confidence levels to the diagnosis (score 1 to 4: 1, not confident; 2, confident only under limited conditions; 3, probably confident; 4, fully confident).
Expert readout of the EID-CT D100 data set by a senior radiologist with 22 years of experience in thoracic imaging was used as standard of reference and as well as basis for SSc grading.
Statistical Analysis
Quantitative variables were expressed as mean ± standard deviation (SD), whereas categorical variables were expressed as percentages. Cohen κ was used to assess the interobserver agreement according to Koch et al30 (none to slight agreement, 0.01–0.20; fair agreement, 0.21–0.40; moderate agreement, 0.41–0.60; substantial agreement, 0.61–0.80; almost perfect agreement, 0.81–0.99). Quantitative variables were compared using a paired t test. P values were adjusted with Bonferroni correction for multiple comparisons wherever appropriate. A P value <0.05 was determined as statistically significant. Sensitivity, specificity, accuracy, and negative predictive value for the detection of ILD were calculated with a 95% confidence interval. Calculations were performed on commercially available software (IBM SPSS Statistics for Windows, Version 26.0; IBM Corp, Armonk, NY).
RESULTS
Patient Population
The final study population comprised 80 consecutive patients (median age, 60 years; range, 19–88 years; 64 women). Thirty percent of patients (n = 24) showed less than 20% of lung fibrosis (limited disease), 30% of patients (n = 24) showed more than 20% of lung fibrosis (extensive disease), and 40% of patients (n = 32) showed no lung fibrosis. The median time between baseline (EID-CT) and follow-up (PCD-CT) scan was of 12 ± 2 months (Supplementary Figure 1, http://links.lww.com/RLI/A722).
Pulmonary Function Parameters
Systemic sclerosis patients had a broad range in lung function impairment, with a mean FEV1 %predicted at baseline of 95.1% (range, 58%–139%). Mean FEV1/FVC at baseline was 102.8% (range, 88%–126%), and mean TLC %predicted was 97.3% (range, 48%–159%). Values obtained on the follow-up visit were not statistically significant different from the values obtained at baseline (P = 0.439, P = 0.247, and P = 0.760, respectively). This likewise holds true for the subgroup analysis for the patients with limited and extensive disease (Table 1).
TABLE 1.
Patient Characteristics and PFT
| No. Patients | 80 |
|---|---|
| Age (mean ± SD) | 56 ± 14; range, 19–88 y |
| Sex | 64 women, 16 men |
| Interstitial lung changes | n = 48 (60%) Limited disease (<20%; n = 24) Extensive disease (>20%; n = 24) |
| PFT | Baseline | Follow-up | P |
|---|---|---|---|
| Overall | |||
| FEV1% (range) | 95.1 (58–139) | 95.1 (48–132) | 0.439 |
| FVC% (range) | 92.1 (52–133) | 91.9 (44–126) | 0.945 |
| FEV1/FVC% (range) | 102.8 (88–126) | 102.6 (89–122) | 0.247 |
| TLC% (range) | 97.3 (48–159) | 97.9 (48–164) | 0.760 |
| No interstitial lung changes at baseline CT | |||
| FEV1% (range) | 94.3 (60–127) | 93.9 (59–126) | 0.673 |
| FVC% (range) | 91.6 (63–125) | 91.9 (55–124) | 0.847 |
| FEV1/FVC% (range) | 101.4 (92–112) | 102.0 (91–122) | 0.656 |
| TLC% (range) | 100.0 (58–120) | 98.5 (65–121) | 0.597 |
| Limited disease (fibrosis <20% on baseline CT) | |||
| FEV1% (range) | 93.1 (67–130) | 94.0 (71–130) | 0.163 |
| FVC% (range) | 89.9 (63–124) | 89.8 (68–124) | 0.634 |
| FEV1/FVC% (range) | 103.3 (88–116) | 103.8 (89–124) | 0.520 |
| TLC% (range) | 98.8 (63–128) | 101.0 (67–164) | 0.429 |
| Extensive disease (fibrosis >20% on baseline CT) | |||
| FEV1% (range) | 93.1 (58–139) | 92.2 (48–132) | 0.667 |
| FVC% (range) | 88.6 (48–120) | 87.1 (44–126) | 0.447 |
| FEV1/FVC% (range) | 105.7 (94–114) | 106.3 (97–114) | 0.582 |
| TLC% (range) | 81.3 (48–120) | 84.9 (48–129) | 0.307 |
PFT values include the percentage predicted values; age, height, and sex group adjusted (%predicted) of FEV1, TLC, FVC, and FEV1-to-FVC ratio. Overall, there was no statistically difference in pulmonary function parameters between the baseline and follow-up CT. Similarly, no significant differences have been found in the subgroup analysis.
PFT, pulmonary function test; CT, computed tomography; FEV1, forced expiratory volume in 1 second; TLC, total lung capacity; FVC, forced vital capacity.
Radiation Dose
In EID-CT, the mean volume CT dose index (CTDIvol) for D100, D66, and D33 was 2.30 ± 0.74 mGy, 1.52 ± 0.49 mGy, and 0.76 ± 0.24 mGy, respectively. The mean CTDIvol in PCD-CT was 0.72 ± 0.23 mGy. No significant difference in radiation dose (CTDIvol) was found between PCD-CT and D33 (0.72 vs 0.76 mGy, P = 0.091). The radiation dose in the D66 and D100 scans was significantly higher as compared with PCD-CT (P < 0.001) (Table 2, Fig. 1).
TABLE 2.
Results of Objective Image Assessment
| Mode | Mean ± SD | t | P | d | |
|---|---|---|---|---|---|
| CTDIvol, mGy | EID-CT (D100) | 2.30 ± 0.74 | −23.00 | <0.001 | −2.56 |
| EID-CT (D66) | 1.52 ± 0.49 | −18.93 | <0.001 | −2.11 | |
| EID-CT (D33) | 0.76 ± 0.24 | −1.71 | 0.091 | — | |
| PCD-CT | 0.72 ± 0.23 | — | — | — | |
| Image noise (HU) | EID-CT (D100) | 113 ± 12.2 | 23.00 | <0.001 | 1.08 |
| EID-CT (D66) | 147 ± 16.4 | −8.37 | <0.001 | −0.93 | |
| EID-CT (D33) | 163 ± 17.7 | −14.53 | <0.001 | −1.62 | |
| PCD-CT | 131 ± 15.2 | — | — | — | |
| SNR | EID-CT (D100) | 0.98 ± 0.16 | −8.09 | <0.001 | −0.90 |
| EID-CT (D66) | 0.77 ± 0.15 | 5.46 | <0.001 | 0.61 | |
| EID-CT (D33) | 0.67 ± 0.10 | 13.43 | <0.001 | 1.50 | |
| PCD-CT | 0.84 ± 0.13 | — | — | — |
Table comparing radiation dose (CTDIvol), image noise, and SNR between EID-CT and PCD-CT. P values indicates differences from the EID-CT scan to PCD-CT.
CTDIvol, volume computed tomography dose index; EID-CT, energy-integrated detector computed tomography; PCD-CT, photon-counting detector CT; HU, Hounsfield units; SNR, signal-to-noise ratio.
FIGURE 1.
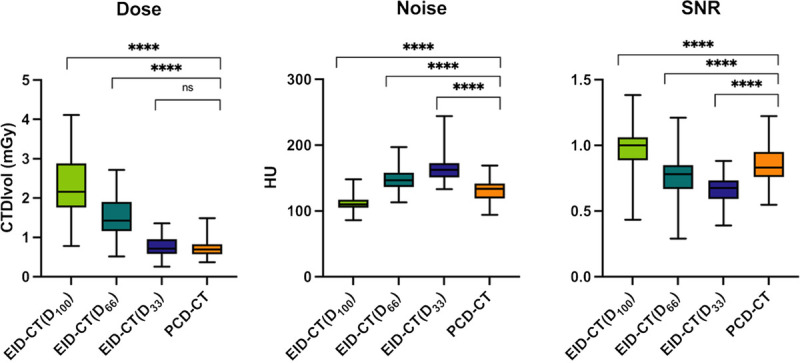
Objective image assessment. Boxplots comparing different dose levels in EID-CT with PCD-CT for dose, noise, and SNR. SNR, signal-to-noise-ratio; EID-CT, energy-integrated CT; PCD-CT, photon-counting CT. Asterisk indicates significance (****P ≤ 0.001); ns, not significant.
Image Quality Evaluation
Quantitative Image Quality
Mean image noise of PCD-CT was significantly higher to that of the D100 (131 ± 15.2 vs 113 ± 12.2; P < 0.001) but significantly lower compared with that of the D66 and D33 scans (147 ± 16.4 and 163 ± 17.7 HU; P < 0.001). Similarly, SNR was significantly lower in PCD-CT than in the D100 scan (0.84 ± 0.13 vs 0.98 ± 0.16; P < 0.001) and significantly higher as compared with the D66 and the D33 scans (0.77 ± 0.15 and 0.67 ± 0.10; P < 0.001) (Table 2, Fig. 1).
Qualitative Image Quality
Overall, agreement between readers for subjective image quality was substantial to almost perfect (κ = 0.693–0.871). All examinations obtained a subjective score >1, meaning that readers felt the scans were acceptable for diagnostic purposes. In all 3 categories (overall image quality, noise, and sharpness), qualitative scores improved with increasing dose in EID-CT. No significant difference has been found between D100 and PCD-CT (Figs. 1 and 2).
FIGURE 2.
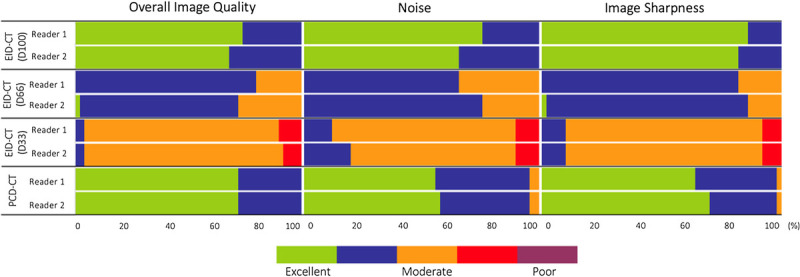
Qualitative image assessment for EID-CT at different dose levels and PCD-CT with a 5-point Likert scale. EID-CT, energy-integrated CT; PCD-CT, photon-counting detector CT.
Overall Image Quality
Mean overall image quality score was 4.71 for D100, 3.77 for D66, and 2.95 for D33, respectively. In PCD-CT, overall image quality was rated 4.72. No significant difference was found for the best performing EID-CT scan at D100 and PCD-CT (P = 0.874), whereas D33 and D66 performed significantly worse (P < 0.001). Mean interreader agreement was substantial (κ = 0.77) (Figs. 3 and 4).
FIGURE 3.
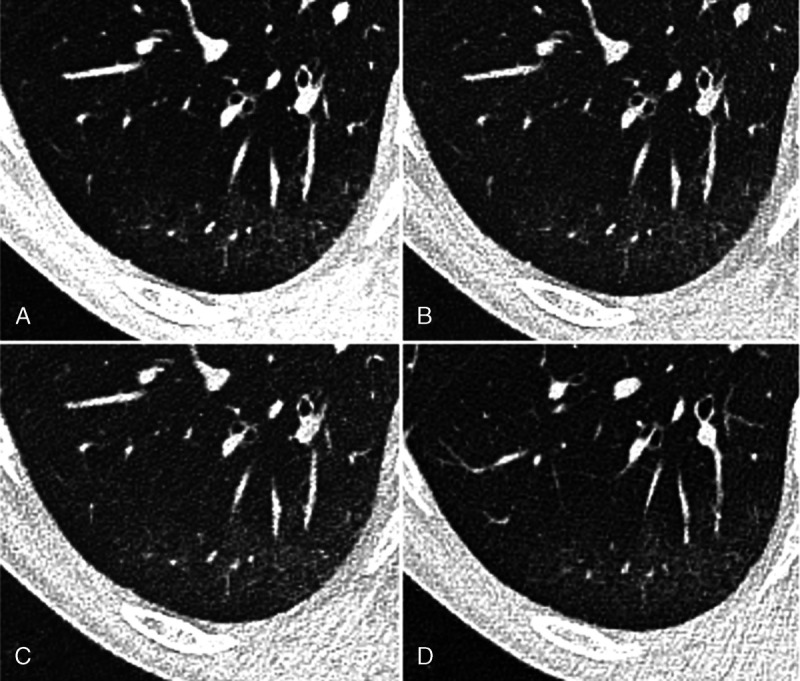
Chest computed tomography (CT) of a 55-year-old male patient with limited interstitial lung disease (<20% ILD) in SSc in axial plane. A, EID-CT with 100% dose (4/4)*, (B) EID-CT with 66% dose (4/3)*, (C) EID-CT with 33% dose (3/2)*, and (D) images derived from PCD-CT (4/3)*. There are subtle subpleural ground-glass opacities and reticular thickening consistent with incipient ILD. Asterisk indicates diagnostic confidence (reader 1/reader 2).
FIGURE 4.
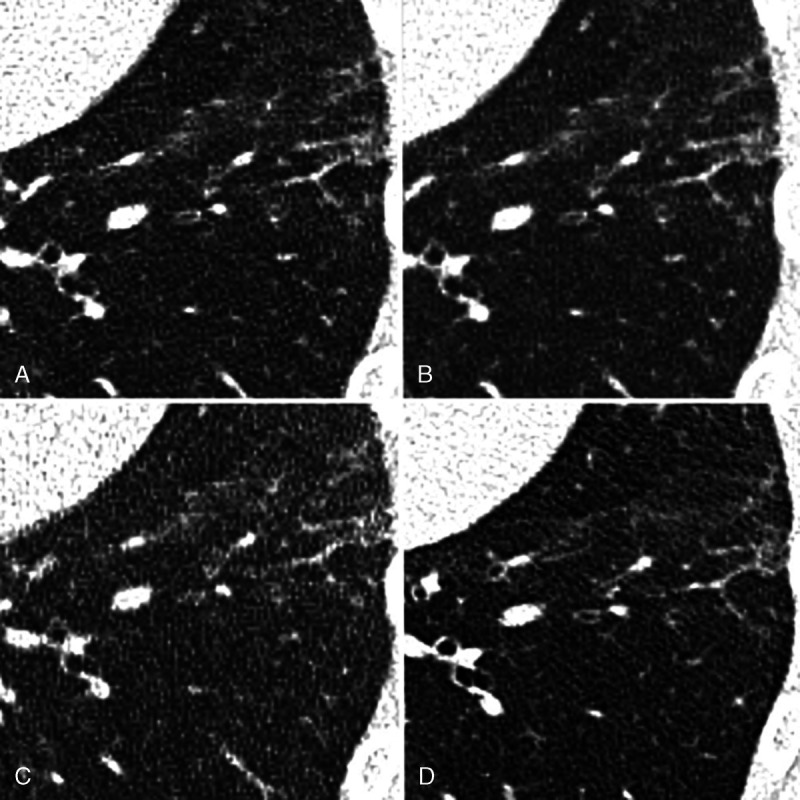
Chest computed tomography (CT) of a 43-year-old male patient with limited interstitial lung disease (<20% ILD) in SSc in axial plane. A, EID-CT with 100% dose (3/4), (B) EID-CT with 66% dose (3/49), (C) EID-CT with 33% dose (3/3), and (D) images derived from PCD-CT (4/4). There is subpleural fine reticular thickening as well as ground-glass opacities consistent with ILD.
Image Noise
Mean subjective image noise has been rated 4.7 for D100, 3.7 for D66, and 3.0 for D33, respectively. In PCD-CT, mean image noise was rated 4.5. D100 performed best (P = 0.014), whereas the performance of PCD-CT was rated second, followed by D66 and D33. Mean interreader agreement was substantial (κ = 0.77).
Image Sharpness
Mean image sharpness was rated 4.84 for D100, 3.85 for D66, 3.02 for D33, and 4.65 for PCD-CT, respectively. D100 performed best (P = 0.001), whereas the performance of PCD-CT was rated second followed by D66 and D33. Mean interreader agreement was substantial (κ = 0.76).
Detection of Interstitial Lung Disease
Sensitivity of ILD detection was 98% for both readers in D100 and 96.1% (reader 1) versus 98.0% (reader 2) in PCD-CT. Specificity was equally 96.6% (reader 1) versus 100.0% (reader 2) for D100 and PCD-CT. An accuracy of 98% and 99% was calculated for D100, whereas accuracy in PCD-CT was 95% and 98%, respectively. In a subcohort of limited disease versus no-ILD sensitivity of ILD detection was 97.3% for both readers in D100 and 94.6% (reader 1) versus 97.3% (reader 2) in PCD-CT. Specificity was equally 94.7% (reader 1) versus 100.0% (reader 2) for D100 and PCD-CT. An accuracy of 96.4% and 98.2% was calculated for D100, whereas accuracy in PCD-CT was 97.2% and 95%, respectively. For detailed results, please refer to Table 3.
TABLE 3.
Diagnostic Accuracy in Detecting ILD Changes
| EID-CT (D100) Reader 1; Reader 2 | EID-CT (D66) Reader 1; Reader 2 | EID-CT (D33) Reader 1; Reader 2 | PCD-CT Reader 1; Reader 2 | |
|---|---|---|---|---|
| Sensitivity (CI) | 98.0% (94.2%–100.0%); 98.0% (94.2%–100.0%) | 94.1% (87.6%–100.0%); 96.1% (90.8%–100.0%) | 92.2% (84.7%–99.5%); 92.2% (84.8%–99.5%) | 96.1% (90.8%–100.0%); 98.0% (94.2%–100.0%) |
| Specificity (CI) | 96.6% (89.9%–100.0%); 100.0% (100.0%–100.0%) | 100.0% (100.0%–100.0%); 96.6% (89.9%–100.0%) | 93.1% (83.9%–100.0%); 93.1 (83.9%–100.0%) | 96.6% (89.9%–100.0%); 100.0% (100.0%–100.0%) |
| Accuracy (CI) | 97.5% (91.3%–99.7%); 98.8% (93.2%–100.0%) | 96.3% (89.4%–99.2%); 96.3% (89.4%–99.2%) | 92.5% (84.4%–97.2%); 92.5% (84.4%–97.2%) | 96.3% (89.4%–99.2%); 98.8% (93.2%–100.0%) |
| NPV (CI) | 96.6% (89.9%–100%); 96.7% (90.2%–100.0%) | 90.6% (80.5%–100.0%); 93.3% (84.4%–100.0%) | 87.1% (75.3%–98.9%); 87.1% (75.3%–98.9%) | 93.3% (84.4%–100.0%); 96.7% (90.2%–100.0%) |
Table indicating diagnostic accuracy of the different scanning protocols.
ILD, interstitial lung disease; EID-CT, energy-integrated CT; PCD-CT, photon-counting detector; CI, confidence interval; NPV, negative predictive value.
No significant difference between D100 and PCD-CT in the diagnostic confidence for the exclusion of lung findings associated with ILD as well as in the detection of limited/extensive disease with a slightly better performance of PCD-CT regarding the detection in limited/extensive disease could be shown (3.75 ± 0.44 vs 3.69 ± 0.47 and 3.90 ± 0.31 vs 3.85 ± 0.37, respectively). In diagnostic confidence regarding the exclusion of lung findings in ILD as well as in the detection of extensive disease, D66 performed comparable to D100 (P = 0.623 vs P = 0.577). The agreement between readers was fair to excellent (κ = 0.375–0.870) (Table 4).
TABLE 4.
Subjective Analysis Result of Diagnostic Confidence in ILD Assessment
| ILD Typical Changes | Mode | Diagnostic Confidence (Reader 1/Reader 2) | κ | n |
|---|---|---|---|---|
| No lung changes associated with ILD | EID-CT (D100) | 3.86 ± 0.35/3.77 ± 0.43 | 0.699 | 32 |
| EID-CT (D66) | 3.82 ± 0.39/3.73 ± 0.46 | 0.744 | 32 | |
| EID-CT (D33) | 3.05 ± 0.72/3.00 ± 0.62 | 0.759 | 32 | |
| PCD-CT | 3.82 ± 0.39/3.82 ± 0.39 | 0.694 | 32 | |
| Limited disease <20% ILD | EID-CT (D100) | 3.78 ± 0.43/3.61 ± 0.50 | 0.62 | 24 |
| EID-CT (D66) | 3.28 ± 0.46/3.33 ± 0.49 | 0.87 | 24 | |
| EID-CT (D33) | 2.67 ± 0.49/2.50 ± 0.71 | 0.737 | 24 | |
| PCD-CT | 3.78 ± 0.43/3.72 ± 0.46 | 0.667 | 24 | |
| Extensive disease >20% ILD | EID-CT (D100) | 3.90 ± 0.32/3.80 ± 0.42 | 0.615 | 24 |
| EID-CT (D66) | 3.80 ± 0.42/3.80 ± 0.42 | 0.375 | 24 | |
| EID-CT (D33) | 3.40 ± 0.52/3.30 ± 0.48 | 0.783 | 24 | |
| PCD-CT | 3.90 ± 0.32/3.90 ± 0.32 | 0.787 | 24 | |
| Ground-glass opacities | EID-CT (D100) | 3.96 ± 0.20/3.94 ± 0.24 | 0.79 | 80 |
| EID-CT (D66) | 3.64 ± 0.49/3.60 ± 0.50 | 0.915 | 80 | |
| EID-CT (D33) | 2.66 ± 0.52/2.66 ± 0.52 | 0.821 | 80 | |
| PCD-CT | 3.90 ± 0.30/3.86 ± 0.35 | 0.811 | 80 | |
| Fine reticular thickening | EID-CT (D100) | 3.90 ± 0.30/3.88 ± 0.33 | 0.645 | 80 |
| EID-CT (D66) | 3.72 ± 0.45/3.74 ± 0.44 | 0.848 | 80 | |
| EID-CT (D33) | 2.76 ± 0.43/2.72 ± 0.45 | 0.896 | 80 | |
| PCD-CT | 3.86 ± 0.35/3.88 ± 0.33 | 0.735 | 80 | |
| Coarse reticulation | EID-CT (D100) | 3.94 ± 0.24/3.96 ± 0.20 | 0.79 | 80 |
| EID-CT (D66) | 3.88 ± 0.33/3.96 ± 0.20 | 0.912 | 80 | |
| EID-CT (D33) | 3.74 ± 0.44/3.76 ± 0.43 | 0.84 | 80 | |
| PCD-CT | 3.98 ± 0.14/3.98 ± 0.14 | 1 | 80 |
Detection and distinction in no lung changes, limited, and extensive disease were assessed and evaluated on a 4-point Likert scale.
ILD, interstitial lung disease, EID-CT, energy-integrated CT; PCD-CT, photon-counting detector CT.
Differentiation of Interstitial Lung Disease Findings
Overall, interreader agreement for the differentiation of specific ILD findings (GGOs, fine reticular thickening, coarse reticulation) was substantial to almost perfect (κ = 0.645–1). Similarly, the diagnostic confidence for the differentiation of ILD findings was rated similar in D100 and PCD-CT (P = 0.280). Differences between D66 and D33 to D100 were statistically significant (P < 0.001) (Table 4).
DISCUSSION
Our results indicated that, with PCD-CT, a radiation dose reduction of 66% compared with EID-CT is feasible while conserving diagnostic image quality and a high diagnostic accuracy for the detection of SSc-ILD. Although radiation dose in PCD-CT was similar to the 33% dose EID-CT scan, overall qualitative image quality, image noise, as well as diagnostic performance remained comparable to the 100% dose EID-CT scan.
Different approaches for ILD imaging have already been assessed on quantitative CT,31 MRI,32 and nuclear medicine imaging.33 To date, CT is considered the reference standard for the evaluation of ILD.34,35 Repetitive CT scanning, however, is controversial due to repetitive patient exposure to ionizing radiation during long-term follow-up imaging. Decreasing radiation dose, however, may go along with deterioration of image quality, hampering the detection of subtle lung parenchymal changes encountered in early SSc-ILD.36
Reduced-dose CT protocols with a fraction of radiation exposure compared with whole-chest HRCT for detecting of SSc-ILD have been under evaluation.5,15 There is already proof for the feasibility of a limited slice EID-CT protocol with a substantial reduced radiation dose reaching effective dose levels of 0.014 mSv.5
Contrary to EID-CT, PCD-CT measures the energy as well as the number of photons.37 Registered photons lead to an electrical pulse, which is proportional to the pulse height of each individual photon energy.17 By considering only pulses that are larger than a specific preset threshold, the electric noise below this specific threshold can be eliminated.16,38,39 In diseases, such as ILD, attenuation changes of 1 to 3 HU may indicate a progression of severity.40 Therefore, an increase in image noise could reduce the diagnostic confidence substantially.
In our study, mean radiation dose could be lowered from 2.31 mGy to 0.73 mGy without a penalty in image quality and diagnostic confidence for SSc-ILD evaluation.
To simulate lower dose values in EID-CT, we used a scan mode that is only available on dual-source CT scanners, in which the tube current of both x-ray tubes is adapted separately.27 Thus, it is possible to generate 3 different CT data sets of different radiation doses (in our case, 100%, 66%, and 33% of the total dose) from a single, and most importantly, dose-neutral, CT scan.
Photon-counting detector CT substantially outperformed EID-CT at similar dose levels with reference to overall image quality, image noise, and image sharpness. Further, we noted also a substantial drop in reader confidence between D100/PCD-CT and D33 images, likely having impact on the detection of early and subtle lung changes emphasizing again the strength of PCD-CT (spatial resolution and elimination of electronic noise). In terms of ILD, this could lead to an improved detection of minor lung parenchymal changes, potentially leading to an earlier detection of ILD of SSc-ILD. These findings may be translatable also to other ILDs. Similarly, other prototype and preclinical PCD-CT studies found improved image quality at low-dose levels compared with EID-CT. For example, Ferda et al41 reported superior subjective image quality for PCD-CT in comparison to EID-CT at similar dose levels. Pourmorteza et al21 found that PCD-CT is able to decrease image noise compared with conventional EID-CT at similar dose levels. Symons et al,22 who evaluated dose-reduced chest PCD-CT scans, could show an improvement in diagnostic quality in the evaluation of lung nodules as compared with EID-CT. Still, there are further possibilities with PCD-CT regarding optimization of scanning parameters and postprocessing such as matrix size (up to 1024 × 1024 pixel), ultra-high resolution mode (down to 0.2 mm slice thickness), and different kernels or higher reconstruction levels (up to quantum iterative reconstruction 4), which should be evaluated and addressed in future studies.
Altogether, our results indicate that a considerable dose reduction for ILD assessment in SSc patients is feasible in PCD-CT, while conserving image quality and diagnostic performance. We hypothesize that this holds true also for other ILDs.
Our study has the following limitations that must be acknowledged. First, due to different default settings for HRCT in EID- and PCD-CT and the retrospective setting of our study, slice thickness had to be retrospectively unified to 1.5 mm using cubic interpolation of the readily reconstructed data. Second, the increment in PCD-CT was different from EID-CT (1 and 0.75 mm). Third, the EID-CT scans, which we used as reference standard, were acquired within a median of 1 year before the PCD-CT scan. Potential changes in the extension or type of interstitial changes over time might have had an impact on our results. However, PFT at baseline was not statistically significant different from the follow-up visit. Fourth, as one of the first clinically used PCD-CT systems, optimal scanning and reconstruction parameters still need to be tested. The parameters used for this study are suggested by the vendor and are under frequent evaluation. Fifth, there was no delay between the reading sessions. However, because the 320 image sets were randomized between patients and reconstructions (D33, D66, D100, and PCD-CT), recall-bias should be limited.
In conclusion, PCD-CT has the potential for a radiation dose reduction compared with conventional EID-CT systems while maintaining image quality and diagnostic performance for detecting SSc-ILD. It is expected that our results hold not only true for SSc-ILD but can be translated to the broad category of ILDs underlining the utility and importance of our findings.
Supplementary Material
Footnotes
Conflicts of interests and sources of funding: All authors declare that the research was conducted in the absence of any commercial or financial relationships that could be construed as a potential conflict of interest. V.M. is funded by the research grant “Young Talents in Clinical Research” of the SAMS and the G. and J. Bangerter-Rhyner Foundation.
The project is also funded by the Foundation for Pneumoconiosis Research Switzerland and the Iten Kohaut Foundation Switzerland.
Supplemental digital contents are available for this article. Direct URL citations appear in the printed text and are provided in the HTML and PDF versions of this article on the journal’s Web site (www.investigativeradiology.com).
Contributor Information
Lisa Jungblut, Email: lisa.jungblut@usz.ch.
André Euler, Email: andre.euler@usz.ch.
Jochen von Spiczak, Email: jochen.vonspiczak@usz.ch.
Thomas Sartoretti, Email: thomas.sartoretti@usz.ch.
Victor Mergen, Email: victor.mergen@usz.ch.
Vanessa Englmaier, Email: Vanessa.Englmaier@usz.ch.
Anna Landsmann, Email: Anna.Landsmann@usz.ch.
Carmen-Marina Mihai, Email: Carmen-Marina.Mihai@usz.ch.
Oliver Distler, Email: Oliver.distler@usz.ch.
Hatem Alkadhi, Email: hatem.alkadhi@usz.ch.
Thomas Frauenfelder, Email: thomas.frauenfelder@usz.ch.
REFERENCES
- 1.Gabrielli A, Avvedimento EV, Krieg T. Scleroderma. N Engl J Med. 2009;360:1989–2003. [DOI] [PubMed] [Google Scholar]
- 2.Elhai M Meune C Boubaya M, et al. Mapping and predicting mortality from systemic sclerosis. Ann Rheum Dis. 2017;76:1897–1905. [DOI] [PubMed] [Google Scholar]
- 3.Weaver AL, Divertie MB, Titus JL. Pulmonary scleroderma. Dis Chest. 1968;54:490–498. [DOI] [PubMed] [Google Scholar]
- 4.Fischer A, Patel NM, Volkmann ER. Interstitial lung disease in systemic sclerosis: focus on early detection and intervention. Open Access Rheumatol. 2019;11:283–307. [DOI] [PMC free article] [PubMed] [Google Scholar]
- 5.Frauenfelder T Winklehner A Nguyen TD, et al. Screening for interstitial lung disease in systemic sclerosis: performance of high-resolution CT with limited number of slices: a prospective study. Ann Rheum Dis. 2014;73:2069–2073. [DOI] [PubMed] [Google Scholar]
- 6.Bernstein EJ, Khanna D, Lederer DJ. Screening high-resolution computed tomography of the chest to detect interstitial lung disease in systemic sclerosis: a global survey of rheumatologists. Arthritis Rheumatol. 2018;70:971–972. [DOI] [PMC free article] [PubMed] [Google Scholar]
- 7.Denzler S Vuong D Bogowicz M, et al. Impact of CT convolution kernel on robustness of radiomic features for different lung diseases and tissue types. Br J Radiol. 2021;94:20200947. [DOI] [PMC free article] [PubMed] [Google Scholar]
- 8.Martini K Baessler B Bogowicz M, et al. Applicability of radiomics in interstitial lung disease associated with systemic sclerosis: proof of concept. Eur Radiol. 2021;31:1987–1998. [DOI] [PMC free article] [PubMed] [Google Scholar]
- 9.Hoffmann-Vold AM Allanore Y Alves M, et al. Progressive interstitial lung disease in patients with systemic sclerosis-associated interstitial lung disease in the EUSTAR database. Ann Rheum Dis. 2021;80:219–227. [DOI] [PMC free article] [PubMed] [Google Scholar]
- 10.Desai SR Veeraraghavan S Hansell DM, et al. CT features of lung disease in patients with systemic sclerosis: comparison with idiopathic pulmonary fibrosis and nonspecific interstitial pneumonia. Radiology. 2004;232:560–567. [DOI] [PubMed] [Google Scholar]
- 11.Sakane H Ishida M Shi L, et al. Biological effects of low-dose chest CT on chromosomal DNA. Radiology. 2020;295:439–445. [DOI] [PubMed] [Google Scholar]
- 12.Ley S Fidler L Schenk H, et al. Low dose computed tomography of the lung for detection and grading of interstitial lung disease: a systematic simulation study. Pulmonology. 2021;27:14–25. [DOI] [PubMed] [Google Scholar]
- 13.Khaji RA Kabwebwe VM Mringo AG, et al. Factors affecting motivation among key populations to engage with tuberculosis screening and testing Services in Northwest Tanzania: a mixed-methods analysis. Int J Environ Res Public Health. 2021;18. [DOI] [PMC free article] [PubMed] [Google Scholar]
- 14.Ohno Y Nishio M Koyama H, et al. Oxygen-enhanced MRI for patients with connective tissue diseases: comparison with thin-section CT of capability for pulmonary functional and disease severity assessment. Eur J Radiol. 2014;83:391–397. [DOI] [PubMed] [Google Scholar]
- 15.Nguyen-Kim TDL Maurer B Suliman YA, et al. The impact of slice-reduced computed tomography on histogram-based densitometry assessment of lung fibrosis in patients with systemic sclerosis. J Thorac Dis. 2018;10:2142–2152. [DOI] [PMC free article] [PubMed] [Google Scholar]
- 16.Jungblut L Bluthgen C Polacin M, et al. First performance evaluation of an artificial intelligence-based computer-aided detection system for pulmonary nodule evaluation in dual-source photon-counting detector CT at different low-dose levels. Invest Radiol. 2022;57:108–114. [DOI] [PubMed] [Google Scholar]
- 17.Willemink MJ Persson M Pourmorteza A, et al. Photon-counting CT: technical principles and clinical prospects. Radiology. 2018;289:293–312. [DOI] [PubMed] [Google Scholar]
- 18.Leng S Bruesewitz M Tao S, et al. Photon-counting detector CT: system design and clinical applications of an emerging technology. Radiographics. 2019;39:729–743. [DOI] [PMC free article] [PubMed] [Google Scholar]
- 19.Leng S Yu Z Halaweish A, et al. Dose-efficient ultrahigh-resolution scan mode using a photon counting detector computed tomography system. J Med Imaging (Bellingham). 2016;3:043504. [DOI] [PMC free article] [PubMed] [Google Scholar]
- 20.Bartlett DJ Koo CW Bartholmai BJ, et al. High-resolution chest computed tomography imaging of the lungs: impact of 1024 matrix reconstruction and photon-counting detector computed tomography. Invest Radiol. 2019;54:129–137. [DOI] [PMC free article] [PubMed] [Google Scholar]
- 21.Pourmorteza A Symons R Henning A, et al. Dose efficiency of quarter-millimeter photon-counting computed tomography: first-in-human results. Invest Radiol. 2018;53:365–372. [DOI] [PubMed] [Google Scholar]
- 22.Symons R Pourmorteza A Sandfort V, et al. Feasibility of dose-reduced chest CT with photon-counting detectors: initial results in humans. Radiology. 2017;285:980–989. [DOI] [PMC free article] [PubMed] [Google Scholar]
- 23.Higashigaito K Euler A Eberhard M, et al. Contrast-enhanced abdominal CT with clinical photon-counting detector CT: assessment of image quality and comparison with energy-integrating detector CT. Acad Radiol. 2022;29:689–697. [DOI] [PubMed] [Google Scholar]
- 24.Gutjahr R Halaweish AF Yu Z, et al. Human imaging with photon counting-based computed tomography at clinical dose levels: contrast-to-noise ratio and cadaver studies. Invest Radiol. 2016;51:421–429. [DOI] [PMC free article] [PubMed] [Google Scholar]
- 25.Leng S Gutjahr R Ferrero A, et al. Ultra-high spatial resolution, multi-energy CT using photon counting detector technology. Proc SPIE Int Soc Opt Eng. 2017;10132:101320Y. [DOI] [PMC free article] [PubMed] [Google Scholar]
- 26.van den Hoogen F Khanna D Fransen J, et al. 2013 classification criteria for systemic sclerosis: an American College of Rheumatology/European League Against Rheumatism Collaborative Initiative. Arthritis Rheum. 2013;65:2737–2747. [DOI] [PMC free article] [PubMed] [Google Scholar]
- 27.Bellini D Ramirez-Giraldo JC Bibbey A, et al. Dual-source single-energy multidetector CT used to obtain multiple radiation exposure levels within the same patient: phantom development and clinical validation. Radiology. 2017;283:526–537. [DOI] [PMC free article] [PubMed] [Google Scholar]
- 28.Sartoretti T Racine D Mergen V, et al. Quantum iterative reconstruction for low-dose ultra-high-resolution photon-counting detector CT of the lung. Diagnostics (Basel). 2022;12. [DOI] [PMC free article] [PubMed] [Google Scholar]
- 29.Goh NS Desai SR Veeraraghavan S, et al. Interstitial lung disease in systemic sclerosis: a simple staging system. Am J Respir Crit Care Med. 2008;177:1248–1254. [DOI] [PubMed] [Google Scholar]
- 30.Landis JR, Koch GG. The measurement of observer agreement for categorical data. Biometrics. 1977;33:159–174. [PubMed] [Google Scholar]
- 31.Wu X Kim GH Salisbury ML, et al. Computed tomographic biomarkers in idiopathic pulmonary fibrosis. The future of quantitative analysis. Am J Respir Crit Care Med. 2019;199:12–21. [DOI] [PubMed] [Google Scholar]
- 32.Mirsadraee S Tse M Kershaw L, et al. T1 characteristics of interstitial pulmonary fibrosis on 3T MRI—a predictor of early interstitial change? Quant Imaging Med Surg. 2016;6:42–49. [DOI] [PMC free article] [PubMed] [Google Scholar]
- 33.Fanti S De Fabritiis A Aloisi D, et al. Early pulmonary involvement in systemic sclerosis assessed by technetium-99m-DTPA clearance rate. J Nucl Med. 1994;35:1933–1936. [PubMed] [Google Scholar]
- 34.Wijsenbeek M Kreuter M Olson A, et al. Progressive fibrosing interstitial lung diseases: current practice in diagnosis and management. Curr Med Res Opin. 2019;35:2015–2024. [DOI] [PubMed] [Google Scholar]
- 35.Distler O Volkmann ER Hoffmann-Vold AM, et al. Current and future perspectives on management of systemic sclerosis-associated interstitial lung disease. Expert Rev Clin Immunol. 2019;15:1009–1017. [DOI] [PubMed] [Google Scholar]
- 36.Goh KL, Liew SC. Dual-energy x-ray approach for object/energy-specific attenuation coefficient correction in single-photon emission computed tomography: effects of contrast agent. J Med Imaging (Bellingham). 2021;8:052106. [DOI] [PMC free article] [PubMed] [Google Scholar]
- 37.Taguchi K, Iwanczyk JS. Vision 20/20: single photon counting x-ray detectors in medical imaging. Med Phys. 2013;40:100901. [DOI] [PMC free article] [PubMed] [Google Scholar]
- 38.Mergen V Higashigaito K Allmendinger T, et al. Tube voltage-independent coronary calcium scoring on a first-generation dual-source photon-counting CT-a proof-of-principle phantom study. Int J Cardiovasc Imaging. 2021. [DOI] [PubMed] [Google Scholar]
- 39.Mergen V Higashigaito K Allmendinger T, et al. Tube voltage-independent coronary calcium scoring on a first-generation dual-source photon-counting CT—a proof-of-principle phantom study. Int J Cardiovasc Imaging. 2022;38:905–912. [DOI] [PubMed] [Google Scholar]
- 40.Stoel BC Bode F Rames A, et al. Quality control in longitudinal studies with computed tomographic densitometry of the lungs. Proc Am Thorac Soc. 2008;5:929–933. [DOI] [PubMed] [Google Scholar]
- 41.Ferda J Vendis T Flohr T, et al. Computed tomography with a full FOV photon-counting detector in a clinical setting, the first experience. Eur J Radiol. 2021;137:109614. [DOI] [PubMed] [Google Scholar]
Associated Data
This section collects any data citations, data availability statements, or supplementary materials included in this article.