Abstract
Purpose:
Standard balanced steady-state free precession (bSSFP) cine MRI often suffers from blood outflow artifacts. We propose a method that spatially encodes these outflowing spins to reduce their effects in the intended slice.
Methods:
Bloch simulations were performed to characterize through-plane flow and to investigate how the use of phase-encoding along the slice-select’s direction (“slice-encoding”) could alleviate its issues. Phantom scans and in vivo cines were acquired on a 3T system, comparing the standard 2D acquisition to the proposed slice-encoding method. Nineteen healthy volunteers were recruited for short-axis and horizontal-long-axis oriented scans. An expert radiologist evaluated each slice-encoded/standard cine pairs in a rank comparison test and graded their quality on a one-to-five scale. The grades were used for a nonparametric-paired evaluation for independent samples with a null hypothesis that there was no statistical difference between the two quality-grade distributions for α = 0.05 significance.
Results:
Bloch simulation results demonstrated this technique’s feasibility, showing a fully resolved slice profile given a sufficient number of slice-encodes. These results were confirmed with the phantom experiments. Each in vivo slice-encoded cine had a higher quality than its corresponding standard acquisition. The non-parametric paired evaluation came to 0.01 significance, encouraging us to reject the null hypothesis and conclude that slice-encoding effectively works in reducing outflow effects.
Conclusion:
The slice-encoding bSSFP technique is helpful in mitigating outflow effects and is achievable within a single breath hold, being a useful alternative for cases where the flow artifacts are significant.
Keywords: cardiac cine, bSSFP, signal-profile, out-of-slice (OOS), slice-encoding
INTRODUCTION
Balanced Steady-State Free Precession (bSSFP) is the workhorse in cardiac cine MRI for a wide spectrum of clinical indications1–5. Of the broad family of “steady-state” sequences–those whose kernel demands repetitions to be short and frequent enough to achieve eventual equilibrium between the magnetization’s relaxation and recovery6–9– bSSFP has become the imaging technique of choice for many cardiac MRI applications. The kernel in bSSFP lacks any net gradient-caused intravoxel phase dispersion and has a π rad/TR incremental RF-phase ramp, causing off-resonance induced dephasing to be almost completely refocused midway between pulses10,11. This effect credits bSSFP readouts with relatively high signal-to-noise ratio (SNR) and T2/T1 signal-dependence, both of which are useful for enhancing blood-myocardium contrast12–14.
Unfortunately, the features providing bSSFP with the aforementioned benefits also make it vulnerable to flow-effects. With balanced gradients, excited spins leaving the slice linger on, tapering-off via T2-decay to ultimately contribute to the bulk signal15. Therefore, a signal profile originally intended for 2D space spans a 3D volume. This outflowing signal aliases along the axis it is projected on, as illustrated in Figure 1, causing commonly seen outflow artifacts in cine imaging.16 These artifacts include a coherent out-of-slice (OOS) contribution mis-projected onto the intended slice during the readout, often appearing as an erroneous signal pileup, and “ghosts” or “zippers” that run along the phase-encoding direction17.
Figure 1.
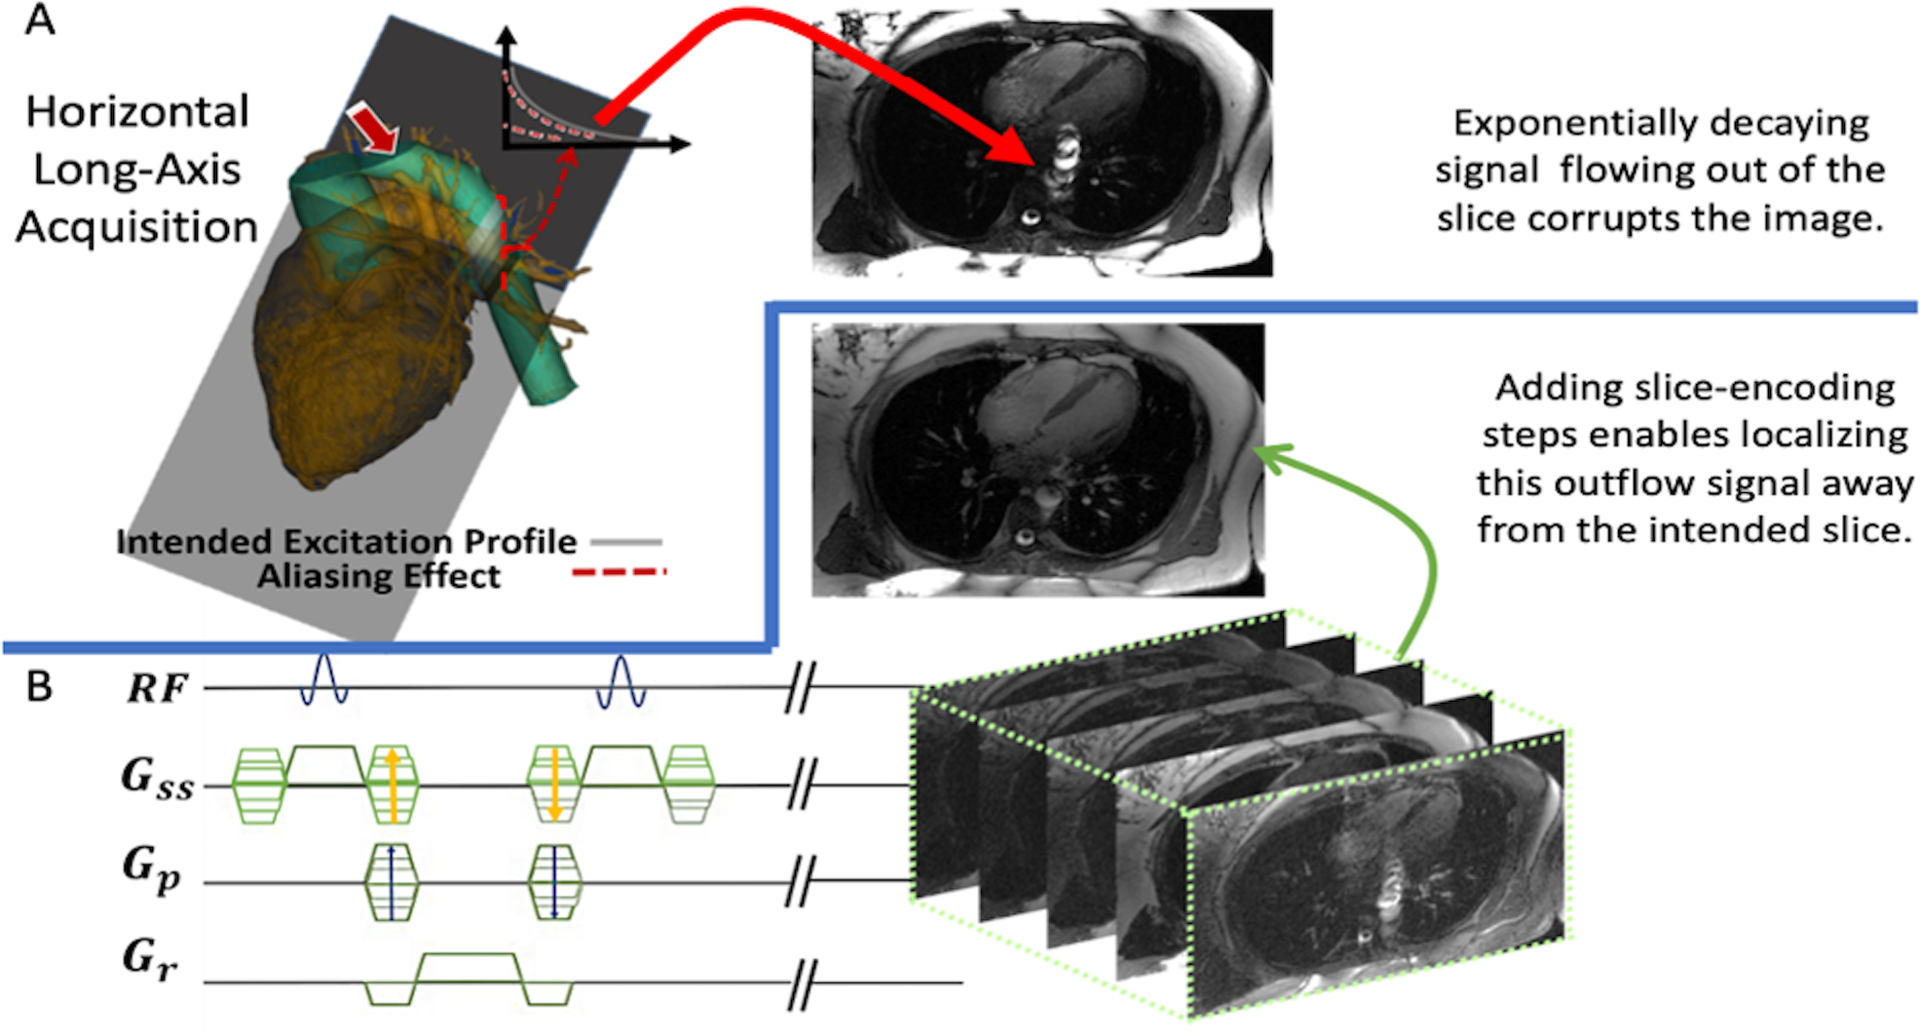
An overview describing our proposed sequence. (A) The slice intended to be acquired is positioned through a heart’s horizontal-long axis (HLA), which is penetrated by the descending aorta. Any through-plane flow from the aorta will have signal tapering off via T2 decay. Having this unaccounted for will have the out-of-slice signal corrupting the final image as indicated by the red arrow. (B) Our proposed sequence is displayed: adding slice-encoding steps to treat the signal as a 3D space, without any change to the 2D excitation’s profile. Upon a 3D IFFT the final image will be found in the center-partition without any influence from the out-of-slice spins, which will be spatially encoded to their respective locations.
The extent of the outflowing spins’ impact on the images depends on their off-resonances. Markl et al. called this coherent sum of the OOS spins “frequency offset-dependent outflow effects”18, 19 where outflowing spins exhibit noticeable signal enhancement. This is most particular for isochromats with rad/TR phase accumulation and is visualized in Supporting Information Figure S1. The on-resonance spins, by definition, don’t have added phase accrual in the rotating frame. The rad/TR RF-phase ramp will therefore cause adjacently excited inflowing on-resonance spins to cancel, while causing adjacently excited rad/TR spins to add coherently. Outflowing spins are still subject to the MRI bore’s gradients. As such– as long as they are in the receivers’ sensitivity region–they are prone to be mis-frequency-encoded, causing their mis-projection onto the resulting slice15. Further complications arise if the flow is pulsatile: inconsistent spin-inflow contributes to signal phase variations between adjacently acquired k-space lines, causing mis-encodings (“zippers”) along a Cartesian grid’s phase-encoding direction19. This provides three main “ingredients” for the flow artifacts in bSSFP cardiac cine imaging: existence of outflowing spins, those spins having off-resonance, and them having pulsatile time-varying velocities15–20. The first two ingredients pose issues for the frequency-encoding direction because any tipped spin in the receiving coils’ proximity contributes to the bulk signal during the readout18. The third contributes to phase-encoding issues because the pulsatile spin-inflow between adjacent k-space lines varies the bulk signal’s phase between readouts19.
Schar et al. carried out an in-depth evaluation on 3T cine-bSSFP imaging, emphasizing the importance of localized shimming19 to mitigate off-resonance effects. This was similar to Deshpande et al’s 1.5T work on coronary artery imaging, which proposed pursuing pre-scans to find the appropriate central frequency to limit the outflow artifact’s extent20. Unfortunately, this method requires a “trial and error” approach for acquiring an image with minimal outflow corruption. Datta et al. proposed having a net through-plane dephasing gradient in the bSSFP acquisition in an attempt to cancel out the outflowing spins21. The overall outflow signal intensity from the bSSFP stopbands is reduced as a result; however, the range of off-resonances showing noticeable outflowing signal is widened. The dephasing gradient also does not discriminate between in-slice versus out of slice, corrupting the slice’s actual signal. Bieri et al. carried out work to reduce mis-phase-encoding in bSSFP imaging. Originally intended for eddy current-induced phase-offsets in bSSFP imaging22, he attempted to null the bulk-signal’s flow-induced phase offsets with adjacent readouts. The method assumed adjacent k-space lines would have similar in-flow induced phase-accrual23. Therefore, bSSFP’s linear RF phase ramp would contribute to cancelling their phase-accumulation if their readouts were consecutively acquired, minimizing the appearance of zipper artifacts. However, this method does not address the fact that there is still unlocalized signal beyond the imaged slice, letting it contribute to the acquisition’s readout.
Because outflowing spins gives the signal a 3D profile, we hypothesized that their associated artifacts can be reduced if they are spatially encoded for. As such, we propose adding through-slice phase-encoding steps (“slice-encoding”) to increase the acquisition’s through-slice field of view (FOV) beyond the nominal slice-thickness to localize this outflowing signal. We tested this hypothesis with Bloch-simulations, phantom scans, and on nineteen healthy volunteers.
THEORY
Outflowing Signal
To conceptualize outflowing signal, imagine a system of through-plane flowing spins moving at a velocity and has already achieved steady equilibrium. Each ensemble of spins has its own specified off-resonant phase-accumulation per TR and will leave the slice with its magnitude decaying according to15
| (1) |
where is the elapsed time from when it left the slice, with magnitude . This equation can be expressed in terms of distance downstream from the slice, . However, to get a sense of how impactful the OOS signal is to the entire acquisition, it makes sense to convey Equation 1 in terms of fractional spin-replacement rate, 18. This describes the number of spins inflowing at each TR as a fraction of the slice’s full capacity. With a nominal slice-thickness, , the flow’s velocity is related to as:
| (2) |
The out of slice amplitude from Equation 1 can then be expressed in terms of :
| (3) |
This relationship (Equation 3) argues for a more powerful case of the OOS spins’ severity than a mere substitution for , showing that even slow ensembles could significantly corrupt the image if its nominal thickness is small.
It must be noted that this conceptualization is brief in that it discusses only a single outflowing ensemble. This narration does not analytically define the total acquired signal as a sum of all the spin ensembles within and outside of the imaging slice; however, the phenomenon it conveys is the cause of the image artifacts we aimed to remove with experiments detailed in the Methods section.
Flow-Compensation
Bieri et al. proposed two flow-compensation based techniques to limit flow effects in bSSFP23: the k-space pairing technique and M1 nulled gradient waveforms. Both aimed to eliminate the variable bulk signal phase when imaging with pulsatile flow. Eliminating this velocity-induced phase accumulation does well to minimize the bulk signal’s phase variability from line-to-line in k-space, however it does not eliminate the outflowing signal.
Pulse Sequence
We propose the pulse sequence illustrated in Figure 1 to mitigate the aforementioned artifacts, which includes Fourier spatial encoding along the slice-select’s direction. The resulting data has a through-slice resolution, typically chosen as the nominal slice-thickness. With NSE total partitions, the effective through-slice FOV is expanded to NSE , describing the k-space resolution as . The incremental gradient-lobe amplitude needed to achieve such a k-space resolution can be solved as , with being its duration. These slice-encoding steps would give the raw data three spatial dimensions, unlike two for the standard bSSFP sequence. After a 3D inverse Fourier transform is performed on k-space, the final image unfolded from the outflow artifacts will be held in the center slice. The additional up-and-downstream slices of the 3D space will serve as a buffer to tolerate outflow-induced aliasing, before the target image is contaminated.
METHODS
Bloch simulations were carried out to prove the proposed hypothesis on a theoretical basis and phantom experiments were done to show a proof of concept. The sequence’s feasibility and clinical implications were assessed with results from the healthy volunteer scans. This study was approved by our institutional review board and each human subject provided a written informed consent.
Bloch Simulation
Much of the following was based off of the Bloch simulation designed by Markl et al18. The Bloch simulations made for this study investigated the physical effects involved and sought to assess how those effects impact the acquisition. This is illustrated in Figure 2.
Figure 2.
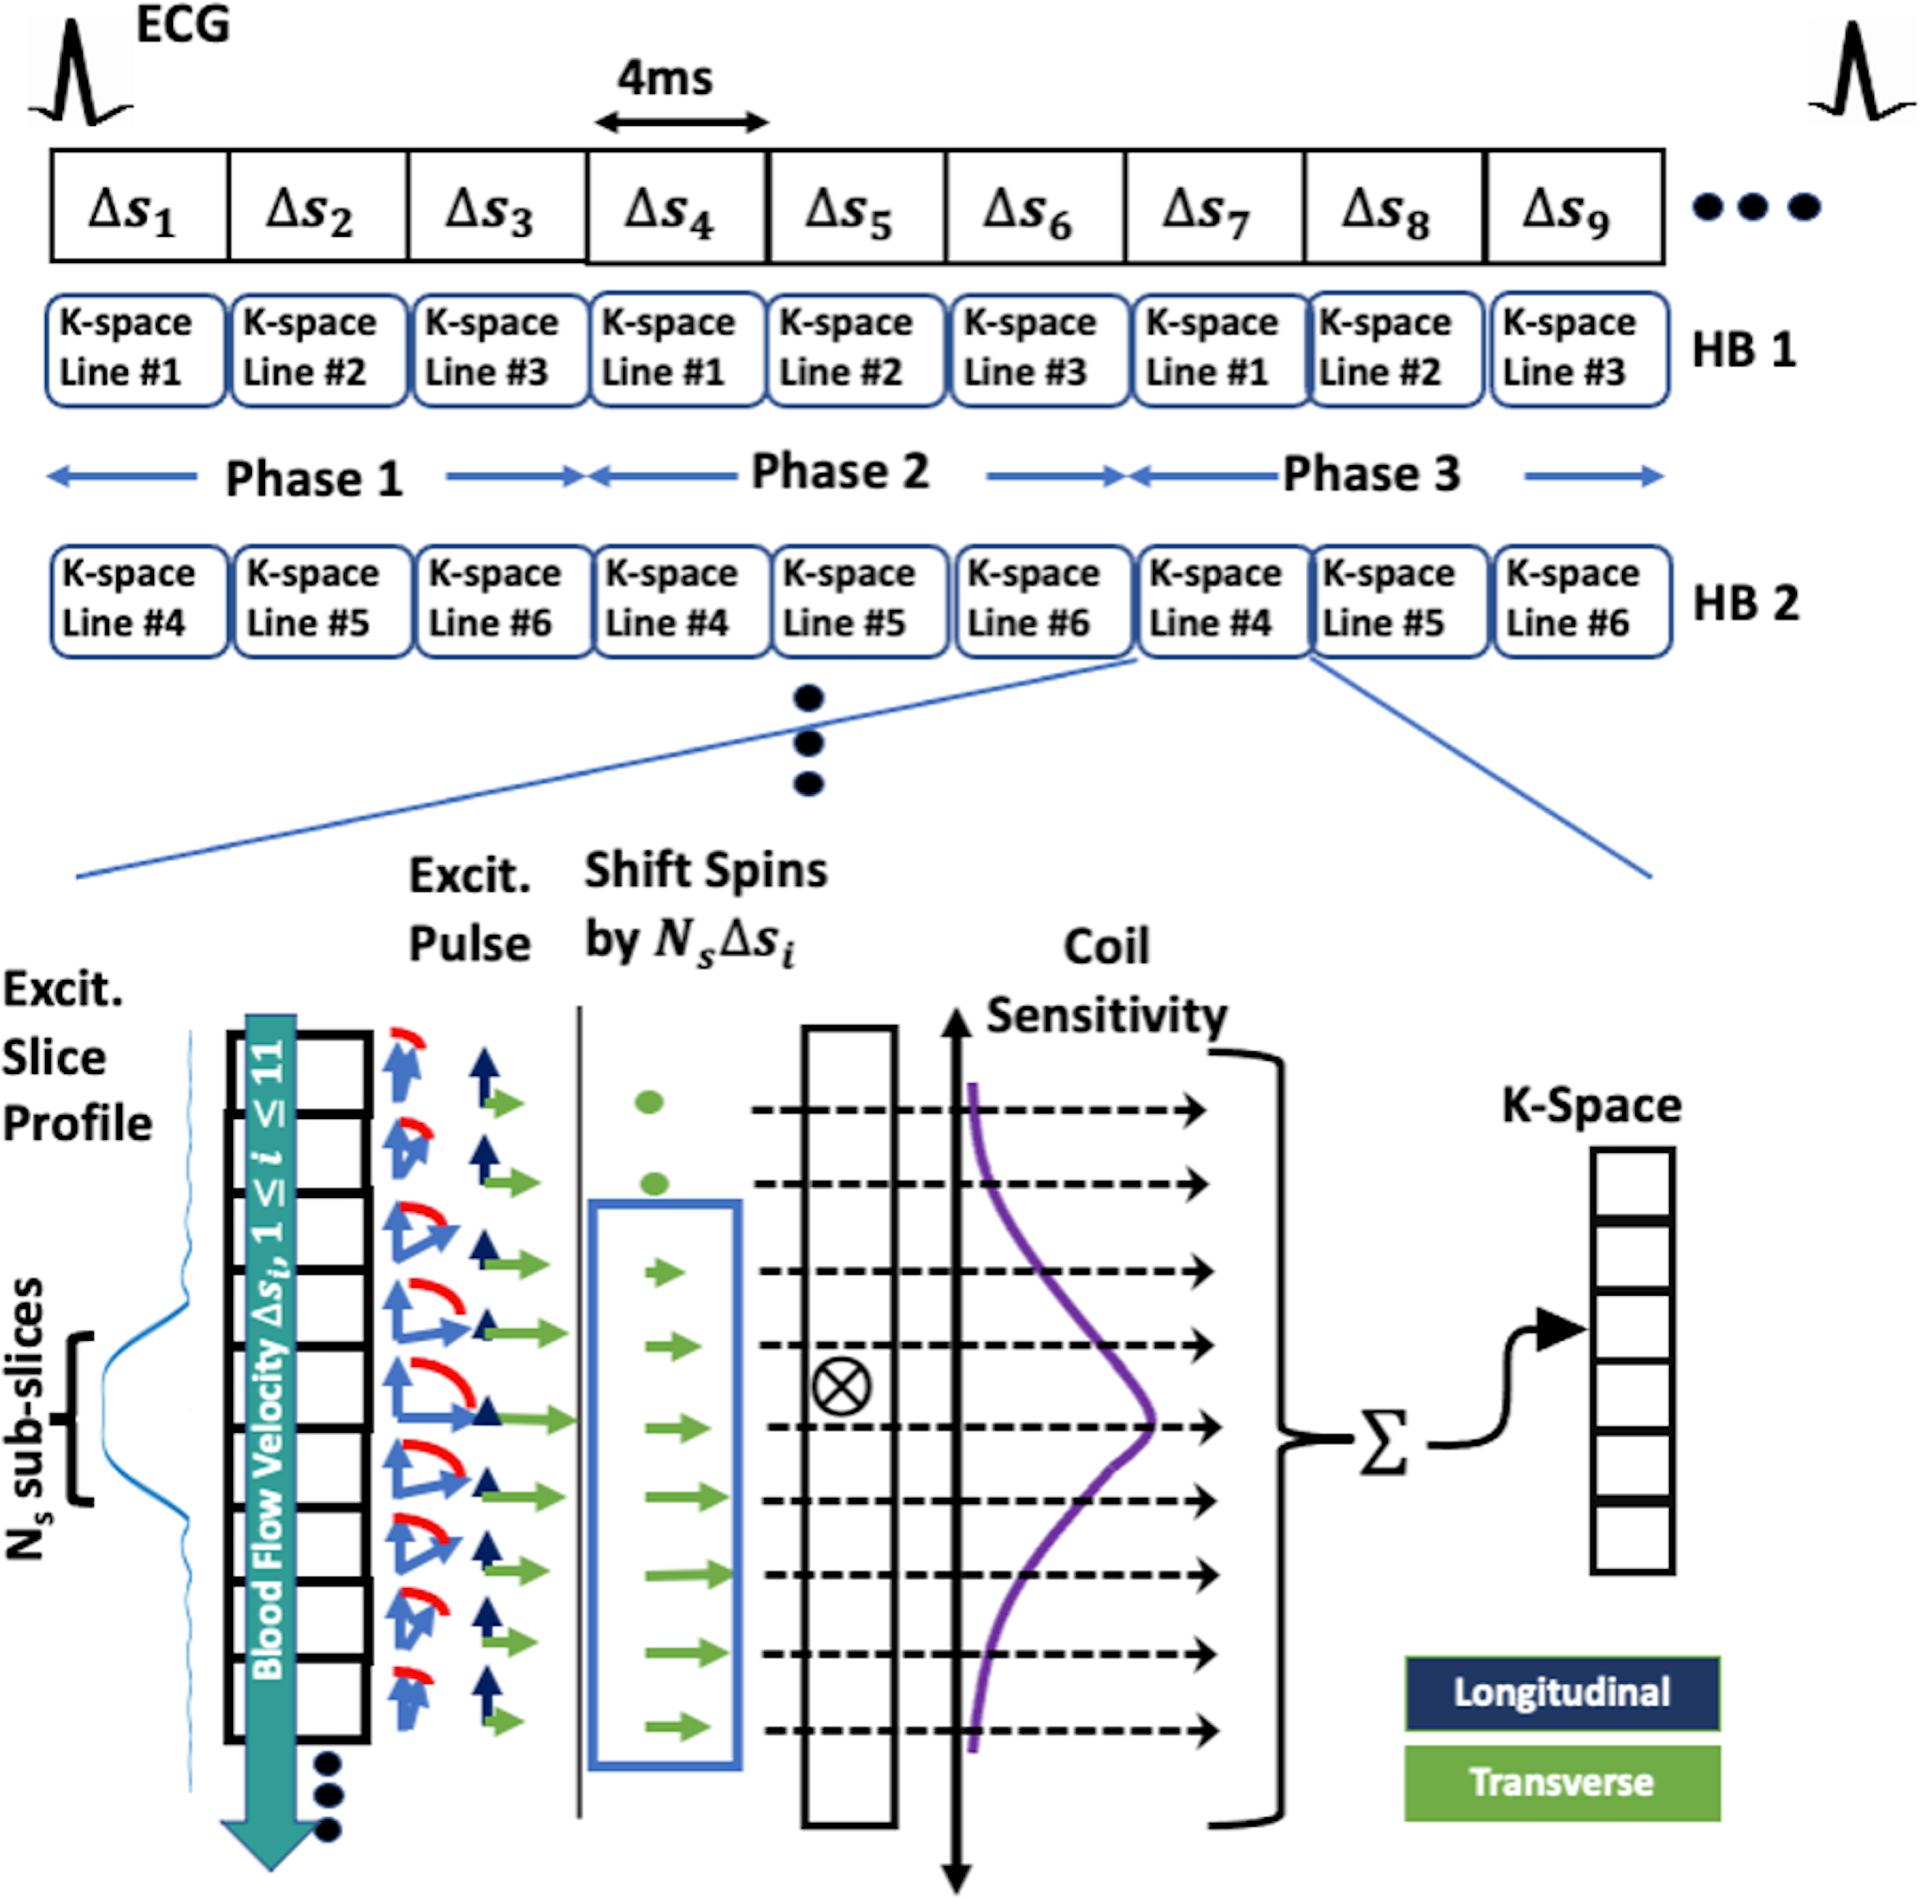
A visual narration describing how our Bloch simulations were carried out. The entire k-space-segmented cardiac cine acquisition was simulated along with the time-varying through-plane blood flow –indicated by the fractional spin-replacement rate for each TR (4ms), –and the time-varying B1 excitation (described in “METHODS: Bloch Simulation”). The pulsatile flow waveform used during the cardiac cycle is illustrated in Figure 3 and the B1 excitation for each repetition had a linear rad/TR phase ramp, as is standard in bSSFP acquisitions. The steps involved in simulating the acquisition of each k-space line is shown in the bottom of the figure. After each excitation, the spins are shifted downstream by , with being the excitation’s index, to simulate the through-plane blood flow. At mid TR, after the appropriate T2-decay, T1-recovery, and rotations from off-resonances and slice-encoding gradients, the spins’ transverse magnetizations were weighted by a spatial Gaussian coil-sensitivity function in a sum to fill the appropriate k-space element. The appropriate T2-decay, T1-recovery, remaining off-resonant rotating, and gradient refocusing were done before the start of the next excitation. The Gaussian weighting was included to mimic a reception coil’s spatial sensitivity, artificially removing some out of slice signal that’s further away from the slice, as in the clinical case when using localized phase-array coils. HB: heartbeat.
The physical effects included in this investigation were through-plane flow, an imperfect slice excitation-profile, and coil sensitivity. An array of equally spaced spin ensembles was arranged along the slice-select’s direction. The excitation profile’s full width at half maximum (FWHM) –the imaging slice– was divided into Ns subslices. The flow’s motion was modeled by a downstream shift of the ensembles by Δs Ns subslices per TR. This simulation had to include all measurable transverse magnetizations in their complex sum for the bulk signal. Therefore, estimating an appropriate number of downstream subslices, Nos, must consider the spins’ T2 relaxation. The transverse magnetization loses relevance beyond 3 T2 time constants after excitation, suggesting Nos = Δs Ns4T2/TR.
Parameters were set to have Ns = 20, TR = 4ms, and bloodlike relaxation properties of T1/T2 = 1000ms/150 ms. The number of upstream subslices was made equal to the downstream amount, having Ns + 2Nos = 6000 total subslices with the target slice positioned at the array’s center. The simulated spins were exposed to an 800μs sinc-functioned RF-pulse designed for a 6-mm slice-thickness, a 60° nominal flip-angle, a 3 time-bandwidth-product (TBW), and an incremental π rad/TR RF phase-ramp. The imperfect excitation profile was determined using a detailed Bloch simulation by dividing the sinc-pulse into TPRF = 120 timepoints. This excitation pulse was carried out on the array of spins, with each spin’s motion being calculated during each of the pulse’s TPRF timepoints.
The Bloch simulations investigated effects of a constant flowrate with ranging from 0 to 1, and pulsatile flow effects with the waveform displayed in Figure 3. For a six mm slice-thickness, corresponded to a 1500 mm/s velocity. This was chosen as our maximum flow velocity because it is amongst the fastest seen in the thoracic area24.
Figure 3.
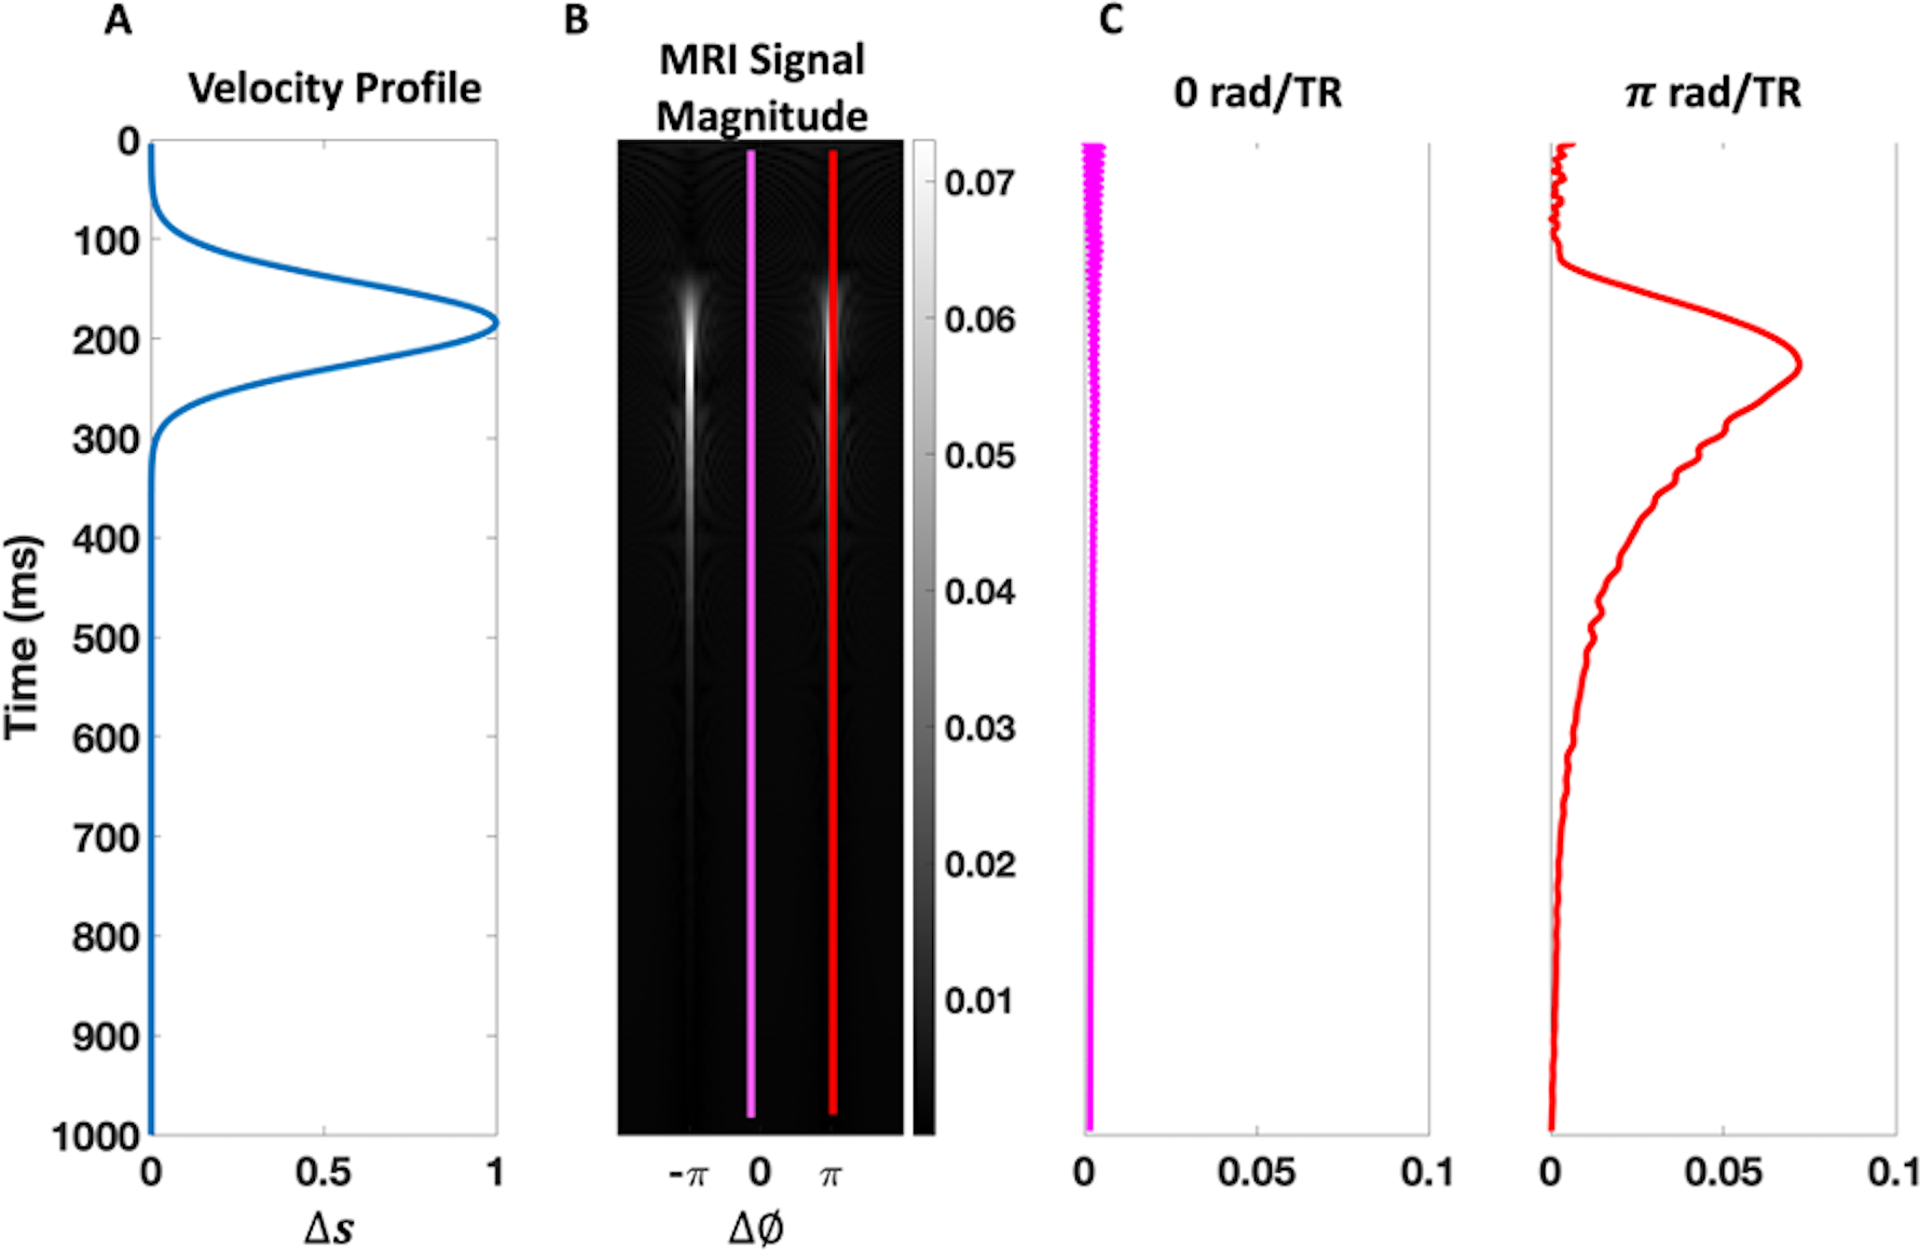
Pulsatile flow Bloch simulation results. (A) The simulated velocity profile is given in terms of the fractional spin-replacement rate, , as a function of time. (B) The simulated MRI signal magnitude for the range of off-resonances . (C) The simulated MRI signal magnitude for the isochromats with 0 and rad/TR off-resonance frequencies, indicated by the pink and red colors, respectively, are plotted on the right. Just as Markl et al discussed18, coherent signal enhancement is most pronounced for rad/TR isochromats, shortly after peak-systolic speeds.
To fill up the k-space along the slice-encoding/select direction, , an excitation was dedicated to each of the NSE k-space “lines” after NPrep equilibrium-preparation excitations. NPrep was arbitrarily chosen to be 300 for the stationary spin, and 1000 for the pulsatile case. This led to four total cycles (“heartbeats”) for preparation before an acquisition for the pulsatile-flow Bloch simulation.
The acquisitions were done at TE = TR/2. Each ensemble’s phase accumulation along the slice-encoding axis, , included the slice-encoding gradient lobe’s induced dephasing and the ensemble’s inherent off-resonance:
| (4) |
where , and are the Gyromagnetic ratio, the slice-encoding’s k-space coordinate, and the off-resonance phase accumulation by TE respectively. Each k-space element would be the complex sum of all spin-ensembles, weighted by a Gaussian receiver-sensitivity function25 that had a 10mm standard deviation. This sensitivity function was included to mimic the effects local phased-array receivers have on an image’s acquisition, where only transverse spins proximal to the coils make significant contributions to the k-space readouts. The rest of the would be completed with the slice-encode refocusing lobe to balance the gradients before the next excitation, remaining off-resonant rotation, and the remaining T2-decay and T1-recovery.
The Bloch simulation’s acquisition scheme worked with a temporal resolution defined as , with being the views per segment. For a given acquisition time, , the number of frames acquired was . Single experiments were done with one, eight, and twenty-four encoding steps for a theoretical proof of concept of the sequence.
When investigating pulsatile flow effects, it was important to make sure that there was no outflow aliasing corrupting the nominal slice’s signal. In order to achieve this, we slice-encoded for a large enough through-slice FOV such that outflow-induced aliasing would not be an issue. As such, we worked with twenty-four encoding steps because it has multiple factors to evenly segment the acquisition. Three simulated acquisitions were carried out with one, eight, and twenty-four VPS to investigate the pulsatility effects on the proposed sequence as the VPS was increased. All published simulation results were carried out for the π rad/TR isochromats.
Phantom Experiments
Flow-phantom measurements were performed on a 3.0 T scanner (Prisma; Siemens Medical Solutions, Erlangen, Germany) using a birdcage head-coil. bSSFP was performed with a 6-mm slice thickness, 330 × 196 mm2 FOV, 256 × 146 in plane samples, 977 Hz/pixel readout bandwidth, 3.61 ms TR, and a sixty-degree nominal flip angle. The scans used linear top-to-bottom k-space increments. A custom rotary pump pushed tap water through the tubing. This pump had a time-averaged constant velocity of approximately 36 cm/s, but because of the pump’s frequency, the fluid behavior was similar to rapid pulses. The FOV was positioned so that it would intersect perpendicularly with the tube’s ascending and descending directions. No gating was done in order to see the proposed sequence’s capability in limiting the zipper artifacts. To investigate slice-encoding’s effectiveness, images were acquired with twenty-three, fifteen, ten, five, and three slice-encoding steps and were compared with the standard 2D bSSFP image. This respectively left us with the following scan times: 12.1s, 7.9, 5.3, 2.6, and 1.6 seconds.
An additional scan was done with a faster pump in order to evaluate how the sequence performs for near-peak systolic velocities observable in patients. This pump’s velocity profile was less pulsatile than the custom rotary pump and it generated an approximate velocity of 140 cm/s. We compared the standard scan with five, ten, fifteen, and twenty slice-encoding steps. All other scan parameters were the same as the previous phantom’s scan.
Human Studies
Nineteen healthy volunteers were scanned on a 3T system (Prisma; Siemens Medical Solutions, Erlangen, German) using cardiac chest and spine coils. The healthy volunteers, whose ages ranged from 23–35 years, were asked to hold their breath for two TrueFISP cardiac-gated cine evaluations: one standard 2D bSSFP acquisition and the other being our proposed technique, using six slice-encoding steps. Horizontal long axis (HLA) and short axis (SA) views were selected as they have known vulnerabilities to outflowing signal in bSSFP imaging15,21. The imaging plane had a six-millimeter nominal slice thickness with a 256 × 184 in-plane acquisition matrix, 1.4 × 1.4 mm2 in plane resolution, fifty-degree flip angle, 977 Hz/pixel readout bandwidth, and TE/TR of 1.58/3.61 ms. With 2X GRAPPA, 6/8 partial-Fourier, and 16 views per segment, scans were achieved in under about a twenty-two second breath-hold for the slice-encoded acquisition and in about 3.66 seconds for the standard sequence. An additional standard scan with six averages, which shared the same duration as the slice-encoded experiment, was done on one volunteer to see what impact the averaging effect provided by the added slice-encoding steps had on the resulting image.
Statistical Analysis
Nineteen standard and slice-encoded cine pairs were randomly selected to have their quality assessed by an expert radiologist–who had more than eight years of experience–for two statistical evaluations. She first performed a rank comparison test, where she compared each pair in a blinded fashion to deem if one had a superior quality over the other, or if they simply showed “no visual difference.” In the second evaluation, she graded each individual cine’s quality on a scale from 1 to 5 with the following criteria: 1: poor image quality; flow artifact obscures cardiac structures and distant structures such as chest wall structures. 2: fair image quality; artifact from vessel flowing perpendicular to the plane of the image obscures cardiac structures adjacent to the vessel without extending to the chest wall. 3: mild obscuration of cardiac structures intimate and adjacent to the vessel flowing perpendicular to the image. 4: minimal obscuration of cardiac structures intimate to the vessel flowing perpendicular to the plane of the image. 5: no obscuration of cardiac structures by flow perpendicular to the plane of the image. These image-quality scores were used for a nonparametric-paired evaluation, a Mann-Whitney Test for independent samples, to answer if there was any statistical difference between the slice-encoded and the standard 2D bSSFP cines. The two-sided evaluation was done for α = 0.05 for significance.
RESULTS
Bloch-Simulations
Figure 3 shows pulsatile flow Bloch simulation’s results, using the plotted velocity-waveform. The results confirm Markl et al’s labeled “frequency offset-dependent outflow effects”, with the rad/TR isochromats contributing the most to the OOS signal15. This out of slice contribution and variable in-flow have signal-reception related consequences, as shown in Figure 4‘s Bloch simulated cine acquisition scheme. This figure displays the simulated signal of an array of spins with rad/TR off-resonance, using the velocity profile shown in Figure 3A. Figure 4A shows the transverse magnetization’s spatial profile at the simulation’s peak systolic velocity for the rad/TR spins, for space within and out of the intended imaging slice. The simulated slice-encoded acquisition results, for a single VPS, are shown in Figure 4B which displays the peak systolic frames for one, eight, and twenty-four slice-encoding steps. With one slice-encode (i.e., standard 2D imaging), the out-of-slice signal shown in Figure 4A are aliased into the imaging slice, corrupting the signal profile within the intended slice. Figure 4B’s in-slice profile becomes more similar to Figure 4A’s as the number of slice-encoding steps increases, because the out-of-slice contributions are better localized. Figure 4C displays the spatial profile at peak systolic velocity for a simulated acquisition with 24 slice-encodes for one, eight, and twenty-four VPS. The pulsatile spin inflow adds bulk signal variability for adjacent k-space lines, impacting the spins’ localization. With 24 VPS (single shot), the spins are smeared (or “zippered”) along the slice’s axis, impacting the in-slice signal. The intended slice’s profile becomes more similar to Figure 4A’s as the temporal resolution increases to a single VPS, because the amount through-slice zippering is heavily reduced.
Figure 4.
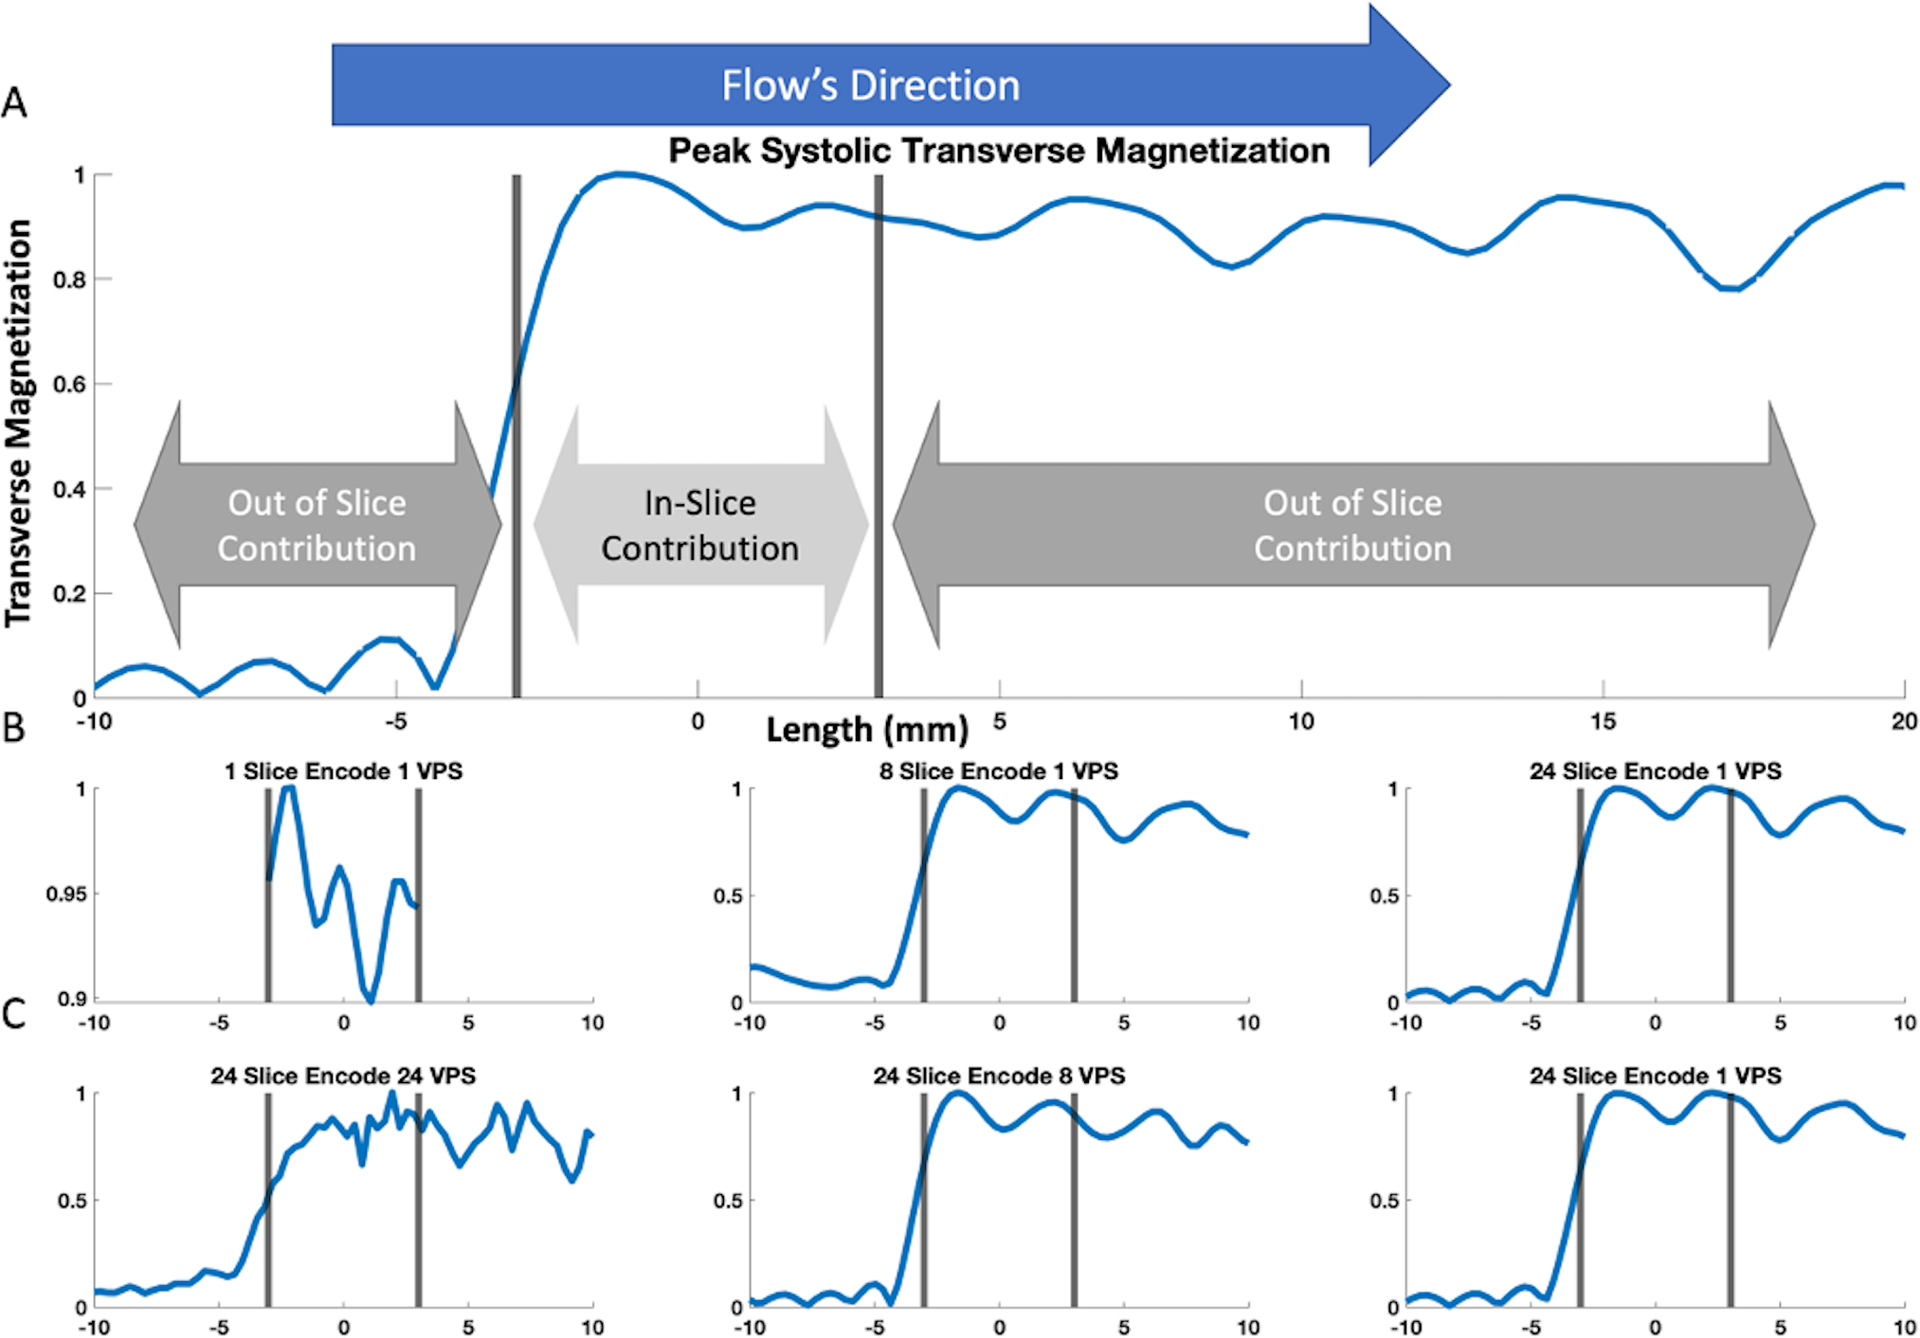
Bloch-simulated transverse signal magnitude of the pulsatile spin movement. The nominal slice is indicated by the grey bars. (A) shows the ground truth transverse magnetization’s spatial distribution at peak systole (see Figure 3). The figure is zoomed in to −10 to 20 mm from isocenter. There is minimal signal upstream of the slice, whereas downstream out-of-slice spins contribute substantial signal hundreds of mm distal from the nominal imaging slice. Parts (B) and (C) show the signal’s spatial distribution according to the simulated acquisition outlined in Figure 2 using various combinations of the number of slice-encodes and views-per-segment (VPS). Part (B) shows single VPS results with one, eight, and twenty-four slice-encoding steps. Notice how the transverse signal profile is more properly resolved with increasing encoding steps; whereas using one slice-encode (i.e., conventional bSSFP) resulted in an aliased and corrupted signal profile. The simulation results using eight and twenty-four slice encodes in this example generated within-imaging-slice signal profiles similar to the ground truth in A. Part (C) shows twenty-four slice-encoding results for one, eight, and twenty-four VPS. The time-varying velocity adds an additional signal sum variability between adjacently acquired k-space segments, resulting in a the “zipper” phenomenon discussed by Schar et al19. In this example, simulations with eight and one VPS can properly resolve the within-imaging-slice signal profile, while twenty-four VPS resulted in a corrupted in-slice signal profile.
Phantom Experiment
The custom rotary phantom results are displayed in Figure 5. Figure 5A compares the standard 2D bSSFP image to the three, five, ten, and twenty-three slice-encoded images. This motor’s noticeable pulsatility made the acquisition prone to substantial in-flow variability in the time between adjacent k-space readouts, causing visible zippers in the standard, three, and five slice-encoded experiments (green arrow). Another clinically common outflow artifact seen in the standard bSSFP scan is the spatial misregistration along the readout’s direction (orange arrow), which is expectedly reduced with increasing slice-encoding steps. By ten slice-encoding steps, both of the artifacts are barely noticeable in the target slice and are eliminated from the twenty-three slice-encoded experiment’s center slice (white arrows). To get a sense of the outflowing signal’s extent, selected slices from the twenty-three slice-encoded experiment are shown in Figure 5B, with the thirteenth being the center partition. The complex sum of all non-center slices (bottom right) properly showed all of the artifacts. In addition to seeing how the readout mis-projections are localized outside of the slice, Figure 5B shows that the sequence’s through-slice encoding scheme opens another avenue for the artifacts to “zipper” through.
Figure 5.
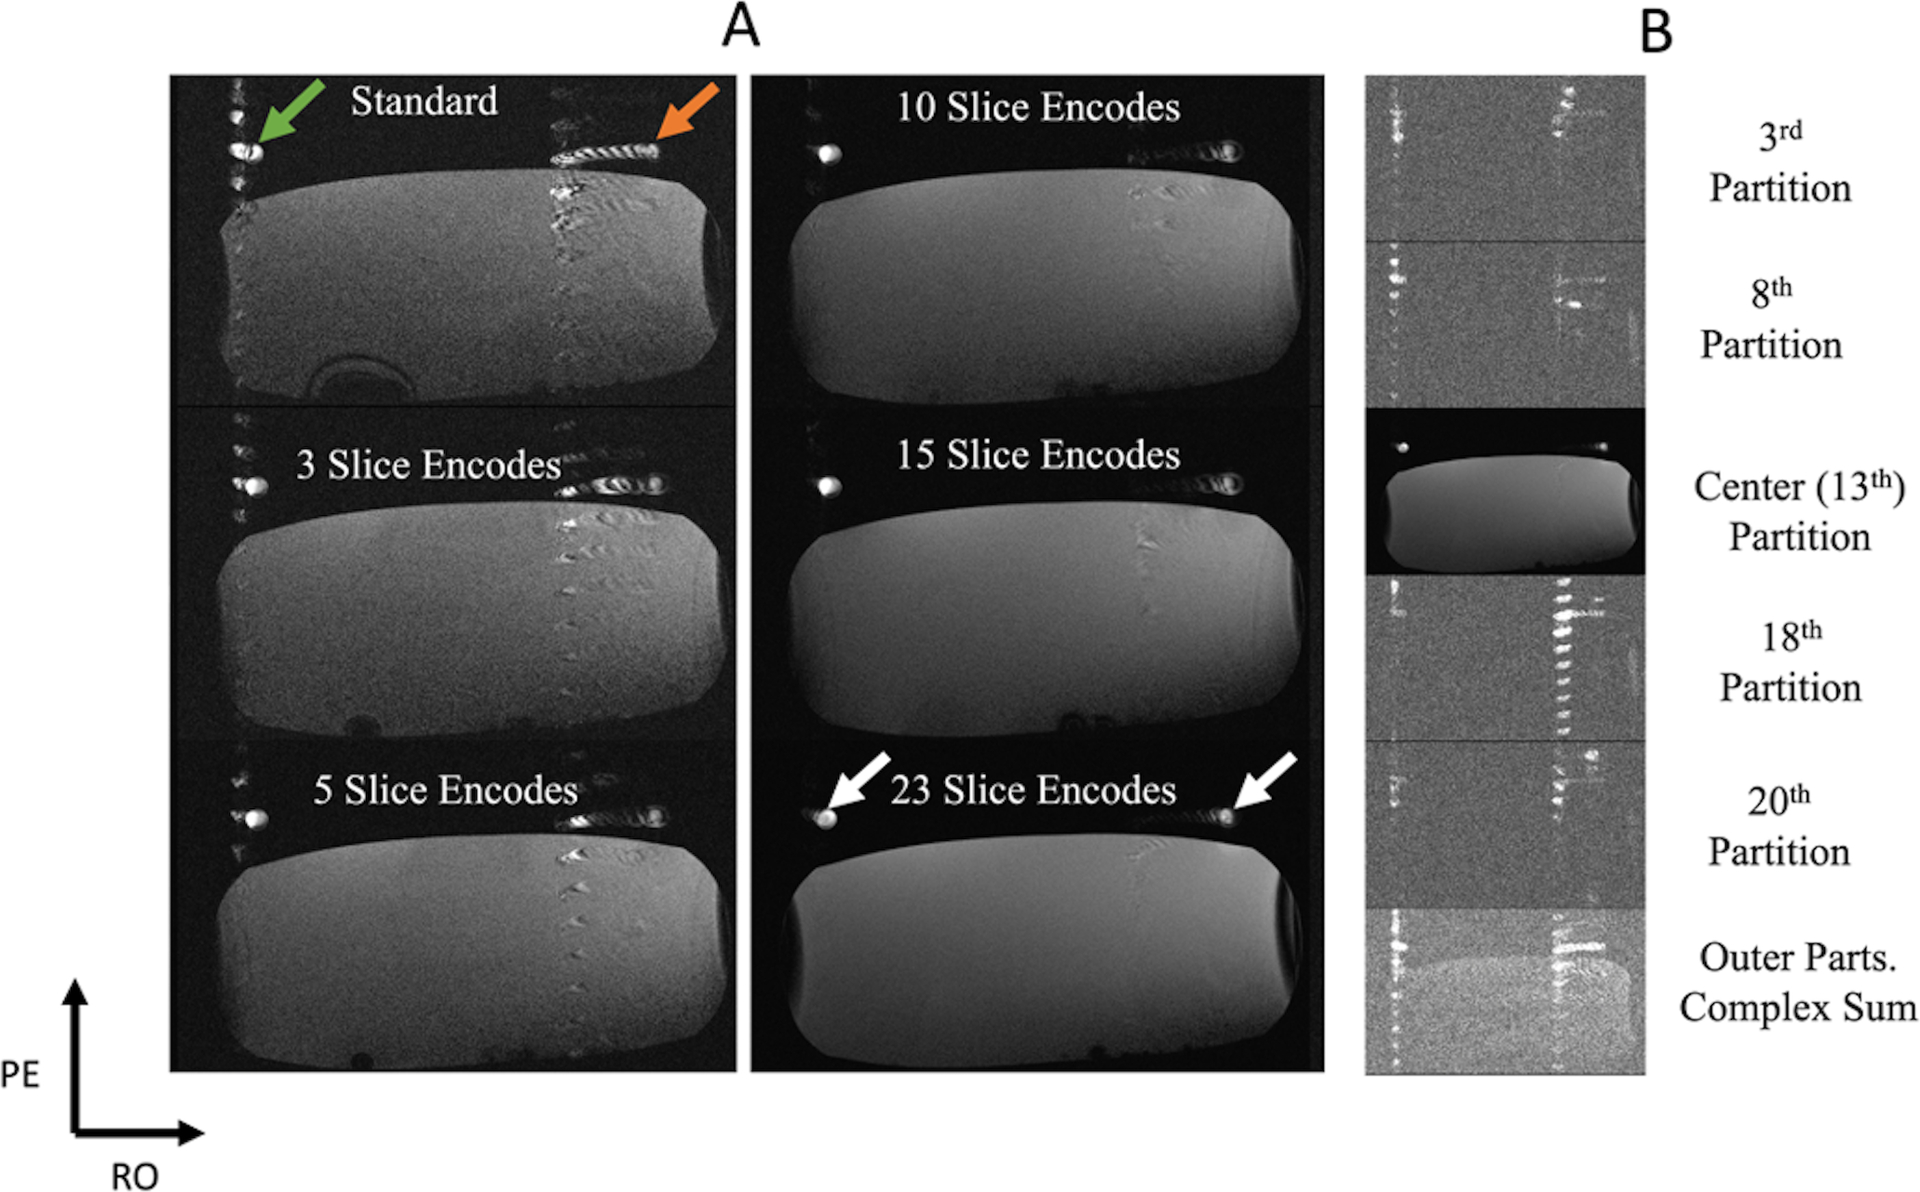
A pulsatile flow phantom experiment, with a speed that averaged at 36 cm/s. The two tube cross-sections are of the same hose, with one flowing into and the other flowing out of the plane. The stationary phantom was placed to help load the coil. (A) Results that compare the standard 2D bSSFP scan image to the center slice of the slice-encoding approach with three, five, ten, fifteen, and twenty-three encoding steps, respectively. The standard acquisition shows pulsatile zippers (green arrow) and a readout mis-projection (orange arrow). Both of these artifacts are reduced with increasing number of slice-encoding steps (white arrows). (B) Selected slices of the twenty-three-slice-encoding experiment. The bottom image is the complex sum of all signals from all non-center slices. It can be seen that the zipper is smeared along the through-slice axis and the mis-projection is localized in the non-center slices, limiting their extent in the center image.
Figure 6A displays flow phantom results with a faster flow velocity of 140cm/s. The readout mis-projection is the dominant artifact seen in these experiments (orange arrow), which is significantly reduced as the number of slice-encoding steps increases. Figure 6B displays images from selected outer partitions and the absolute value of all non-center partition’s sum from a scan with 20 slice-encoding steps.
Figure 6.
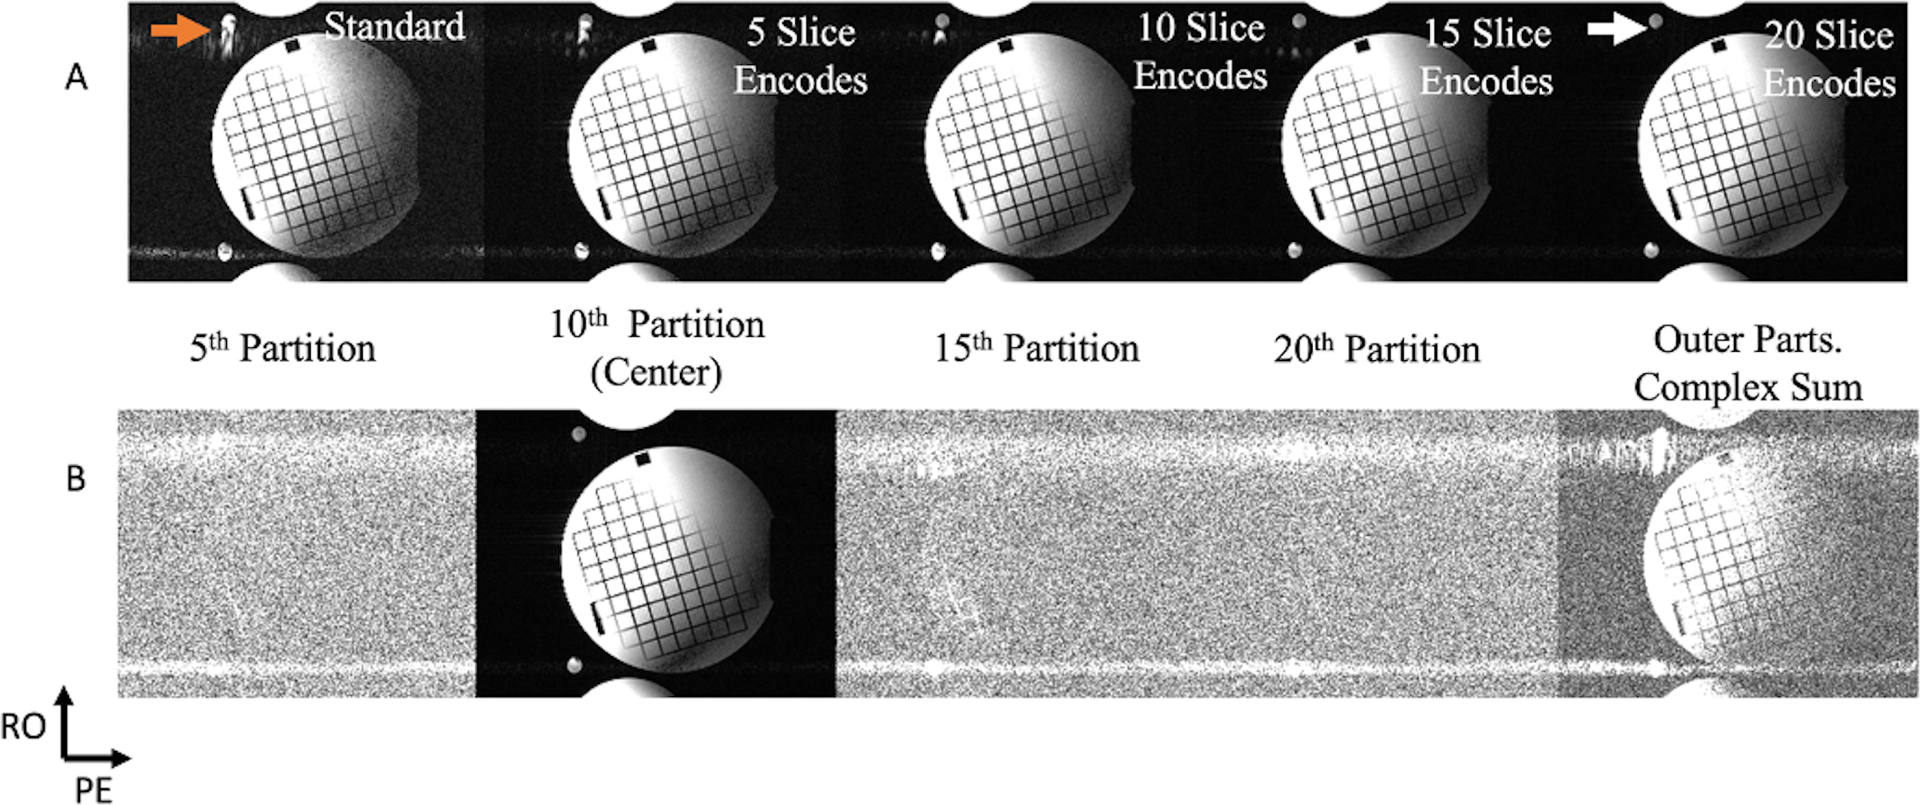
A phantom experiment was done to evaluate the sequence’s performance with constant flow, with its velocity running at a speed of approximately 140 cm/s. Just as in Figure 5‘s setup, the two tubes’ cross-sections are of the same hose, and the stationary phantom was used to load the coil. (A) A standard 2D bSSFP comparison with five, ten, fifteen, and twenty slice-encoding steps. The out of slice coherent sum mis-projected during the readout (orange arrow) is the main artifact seen in this experiment’s standard acquisition (with some minor pulsatile phase-encoded zippers), which is significantly reduced with increasing slice-encoding steps (white arrow). (B) Selected slices of the twenty slice-encoded experiment, with the right furthest image being the complex sum of all non-center slices. This complex sum image shows how a significant portion of the readout’s mis-projection was localized in the non-center slices, relieving that artifact from the center image.
In Vivo Experiments
Figure 7A displays three columns comparing slice-encoded (top) and standard (middle) peak-systolic images from three volunteers, each displaying a particular common outflow artifact that was reduced in the corresponding slice-encoded image. The third row displays the absolute value of the complex sum of all non-center slices. Each image-set was normalized and adjusted to the same level and window-width. The middle row shows the two commonly seen outflow-related artifacts in bSSFP imaging that Schar et al discussed: “out of plane coherence artifacts” (red arrow) and the “through-plane flow transient artifacts” (green arrows). These both hamper the blood-myocardium contrast and reduce myocardial visualization. The coherence artifacts contribute to a readout mis-projection or as signal pileups, as shown in columns II and III respectively. Column I’s standard image shows a heart’s SA view with a green arrow pointing to a zipper. The corresponding slice-encoded image has the zipper significantly reduced and it better demonstrates the endocardial border of the left ventricular septum. The third row shows that the zipper was mostly captured through the outer slices. Column II’s standard scan shows what appears to be some “false-anatomy”, indicated by the red arrow, which is properly eliminated in its slice-encoded scan. It is evident that this is false anatomy as this is preserved in the out of slice’s complex sum. Column III shows two severe outflow-related artifacts. The first, marked with a green arrow, is a misregistered signal between the aorta and the para-aortic fat, caused by the zipper. A red arrow points to an apparent wave-like, outflow-enhanced blurring centered within the right atrium, obscuring evaluation of the interatrial septum and tricuspid valve. These are complicated outflow artifacts, but their impacts are all substantially reduced in the slice-encoded image. The out of slice complex sum’s row shows how these artifacts are localized in the outer slices.
Figure 7.
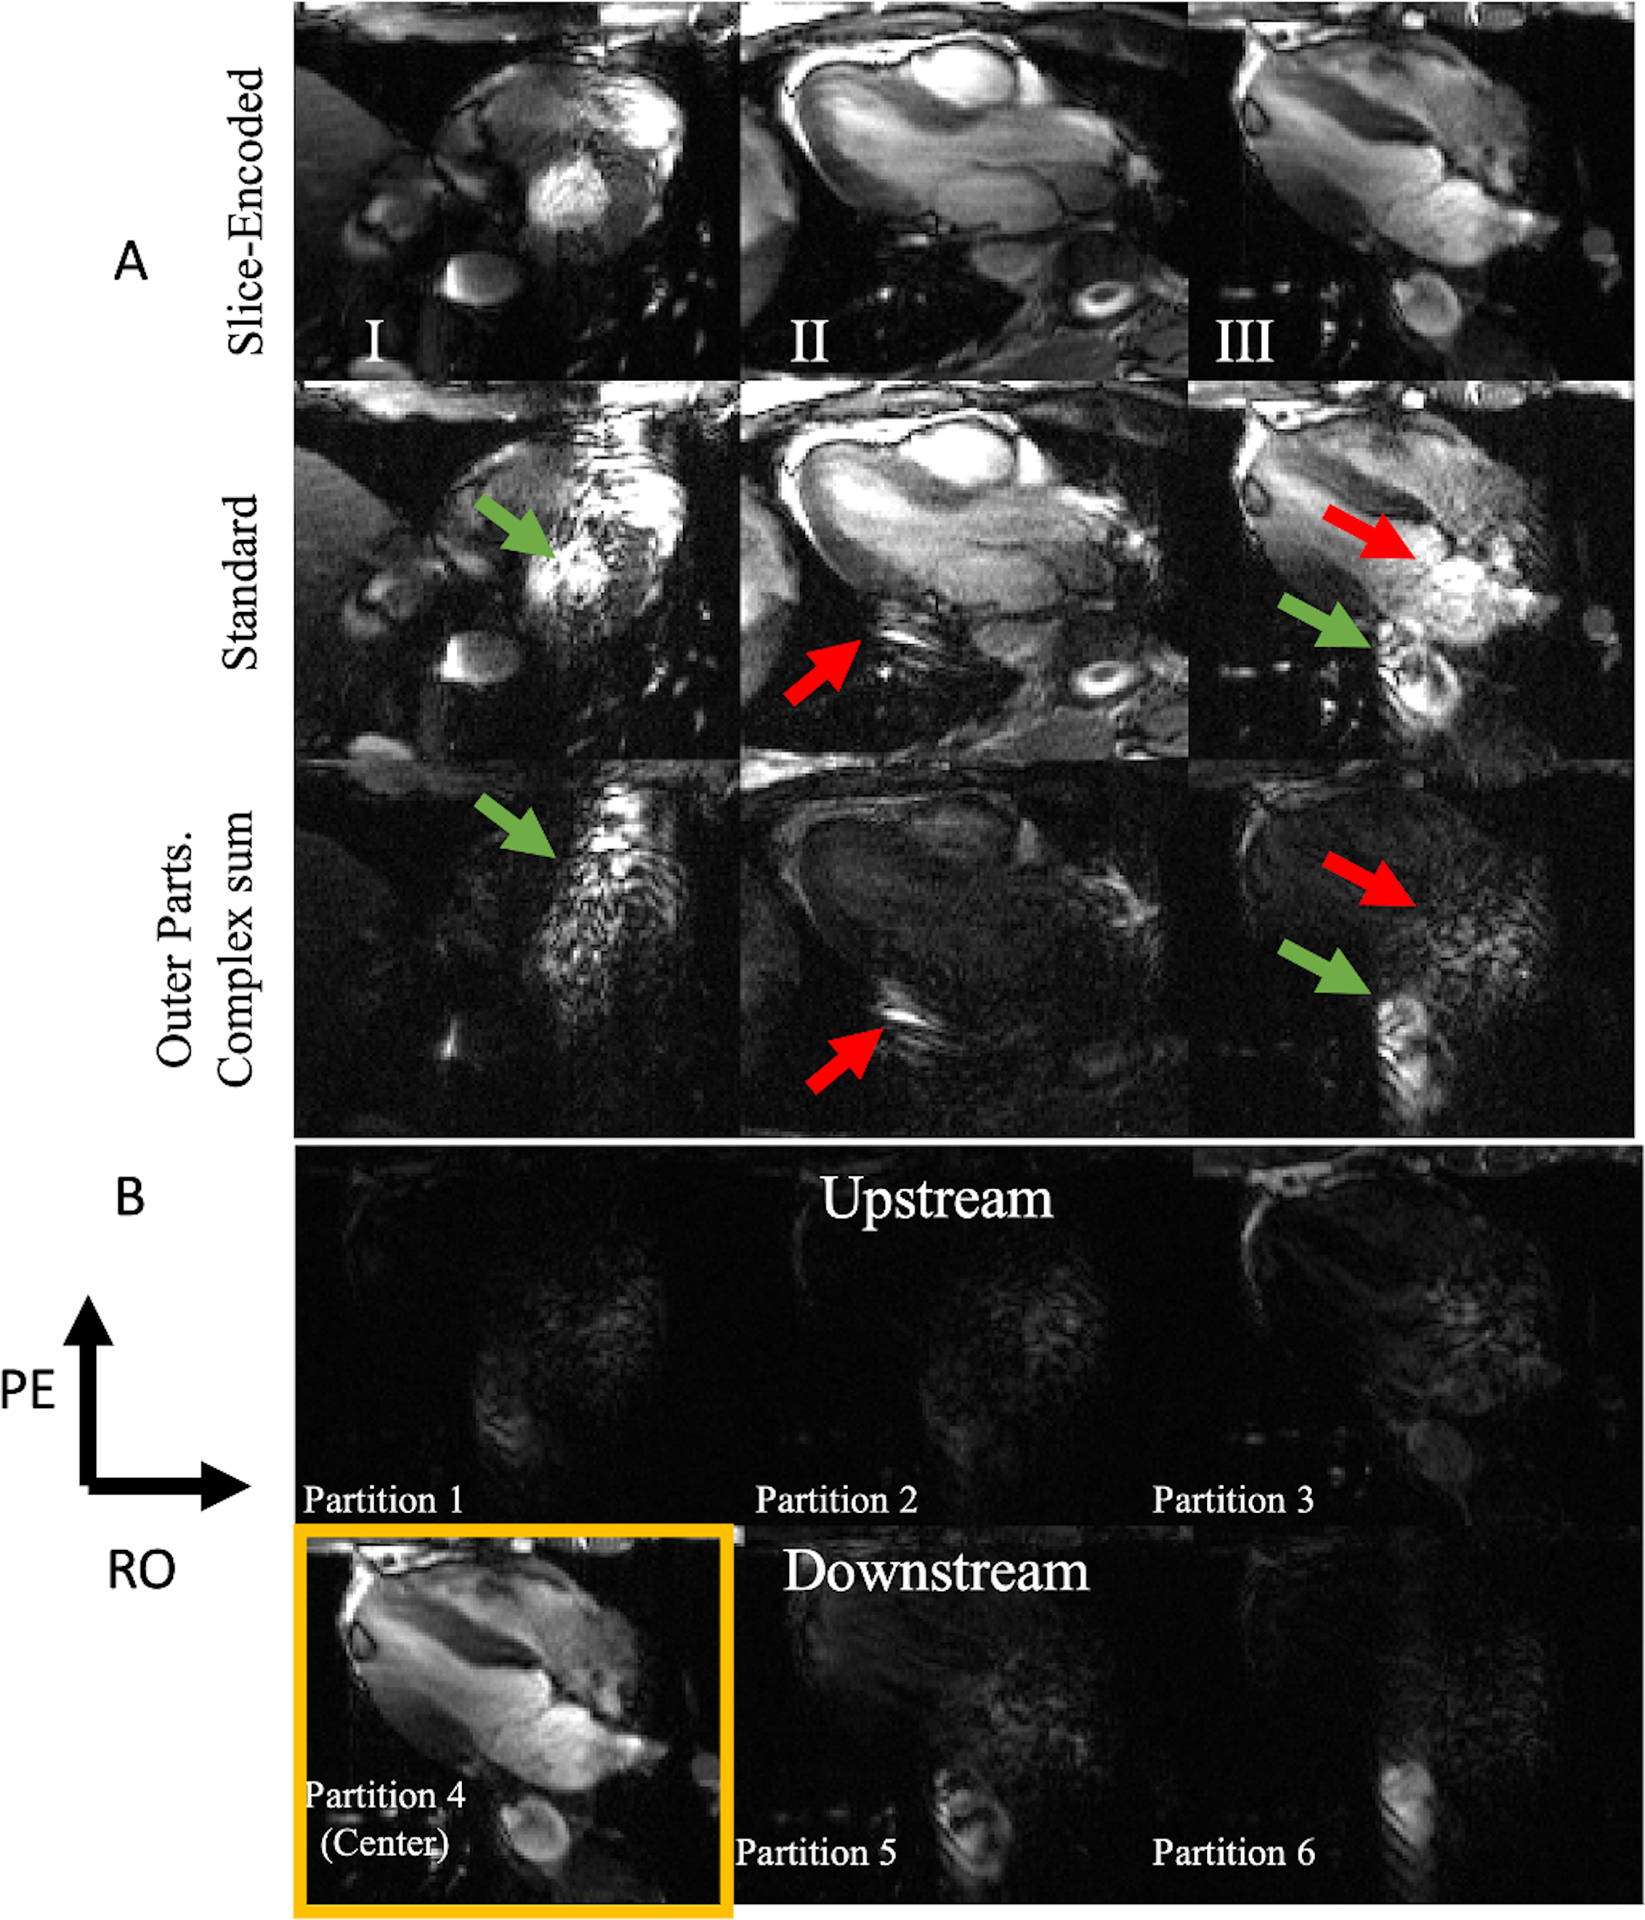
(A) Peak systolic image comparison between three six slice-encoded experiments (top) and their corresponding standard 2D bSSFP scan (middle). The bottom row of 7A is the image of the non-center slices’ complex sum. The slice-encoded image shows significant reduction in outflow artifact across short axis, vertical long axis, and horizontal long axis imaging. Green arrows point to Schar et al’s “through-plane flow transient artifacts” (“zippers”) and the red arrows point to the coherent sum outflow artifacts, resulting in readout mis-projections. (B) All of panel III’s image partitions. Partitions five and six capture the downstream slices. Notice how partitions five and six capture much of the standard acquisition’s artifacts. The movies for each of these standard and slice-encoded cines are included in the supplementary material.
Figure 7B shows the outer-slice’s images from Figure 7A’s third column. The fourth partition is the center, with the higher slices being downstream and the lower three being upstream. Some of the flow wraps around, however the upstream slices protect the center partition from the aliased signal. Most of the descending aorta’s corruption in the standard acquisition was captured in the two downstream slices and the corruption originally around the right atrium was mostly captured in the upstream slices.
To see how this technique performs in cine imaging, the previous example’s first eight of fifteen cardiac phases are displayed in Figure 8. The outflow artifacts are obviously cardiac-phase dependent, and only have moderate myocardial-wall definition after the fifth frame. On the contrary, the corresponding slice-encoded images show clear septal, lateral-wall, and left-ventricular apex definition with minor variations through each frame.
Figure 8.
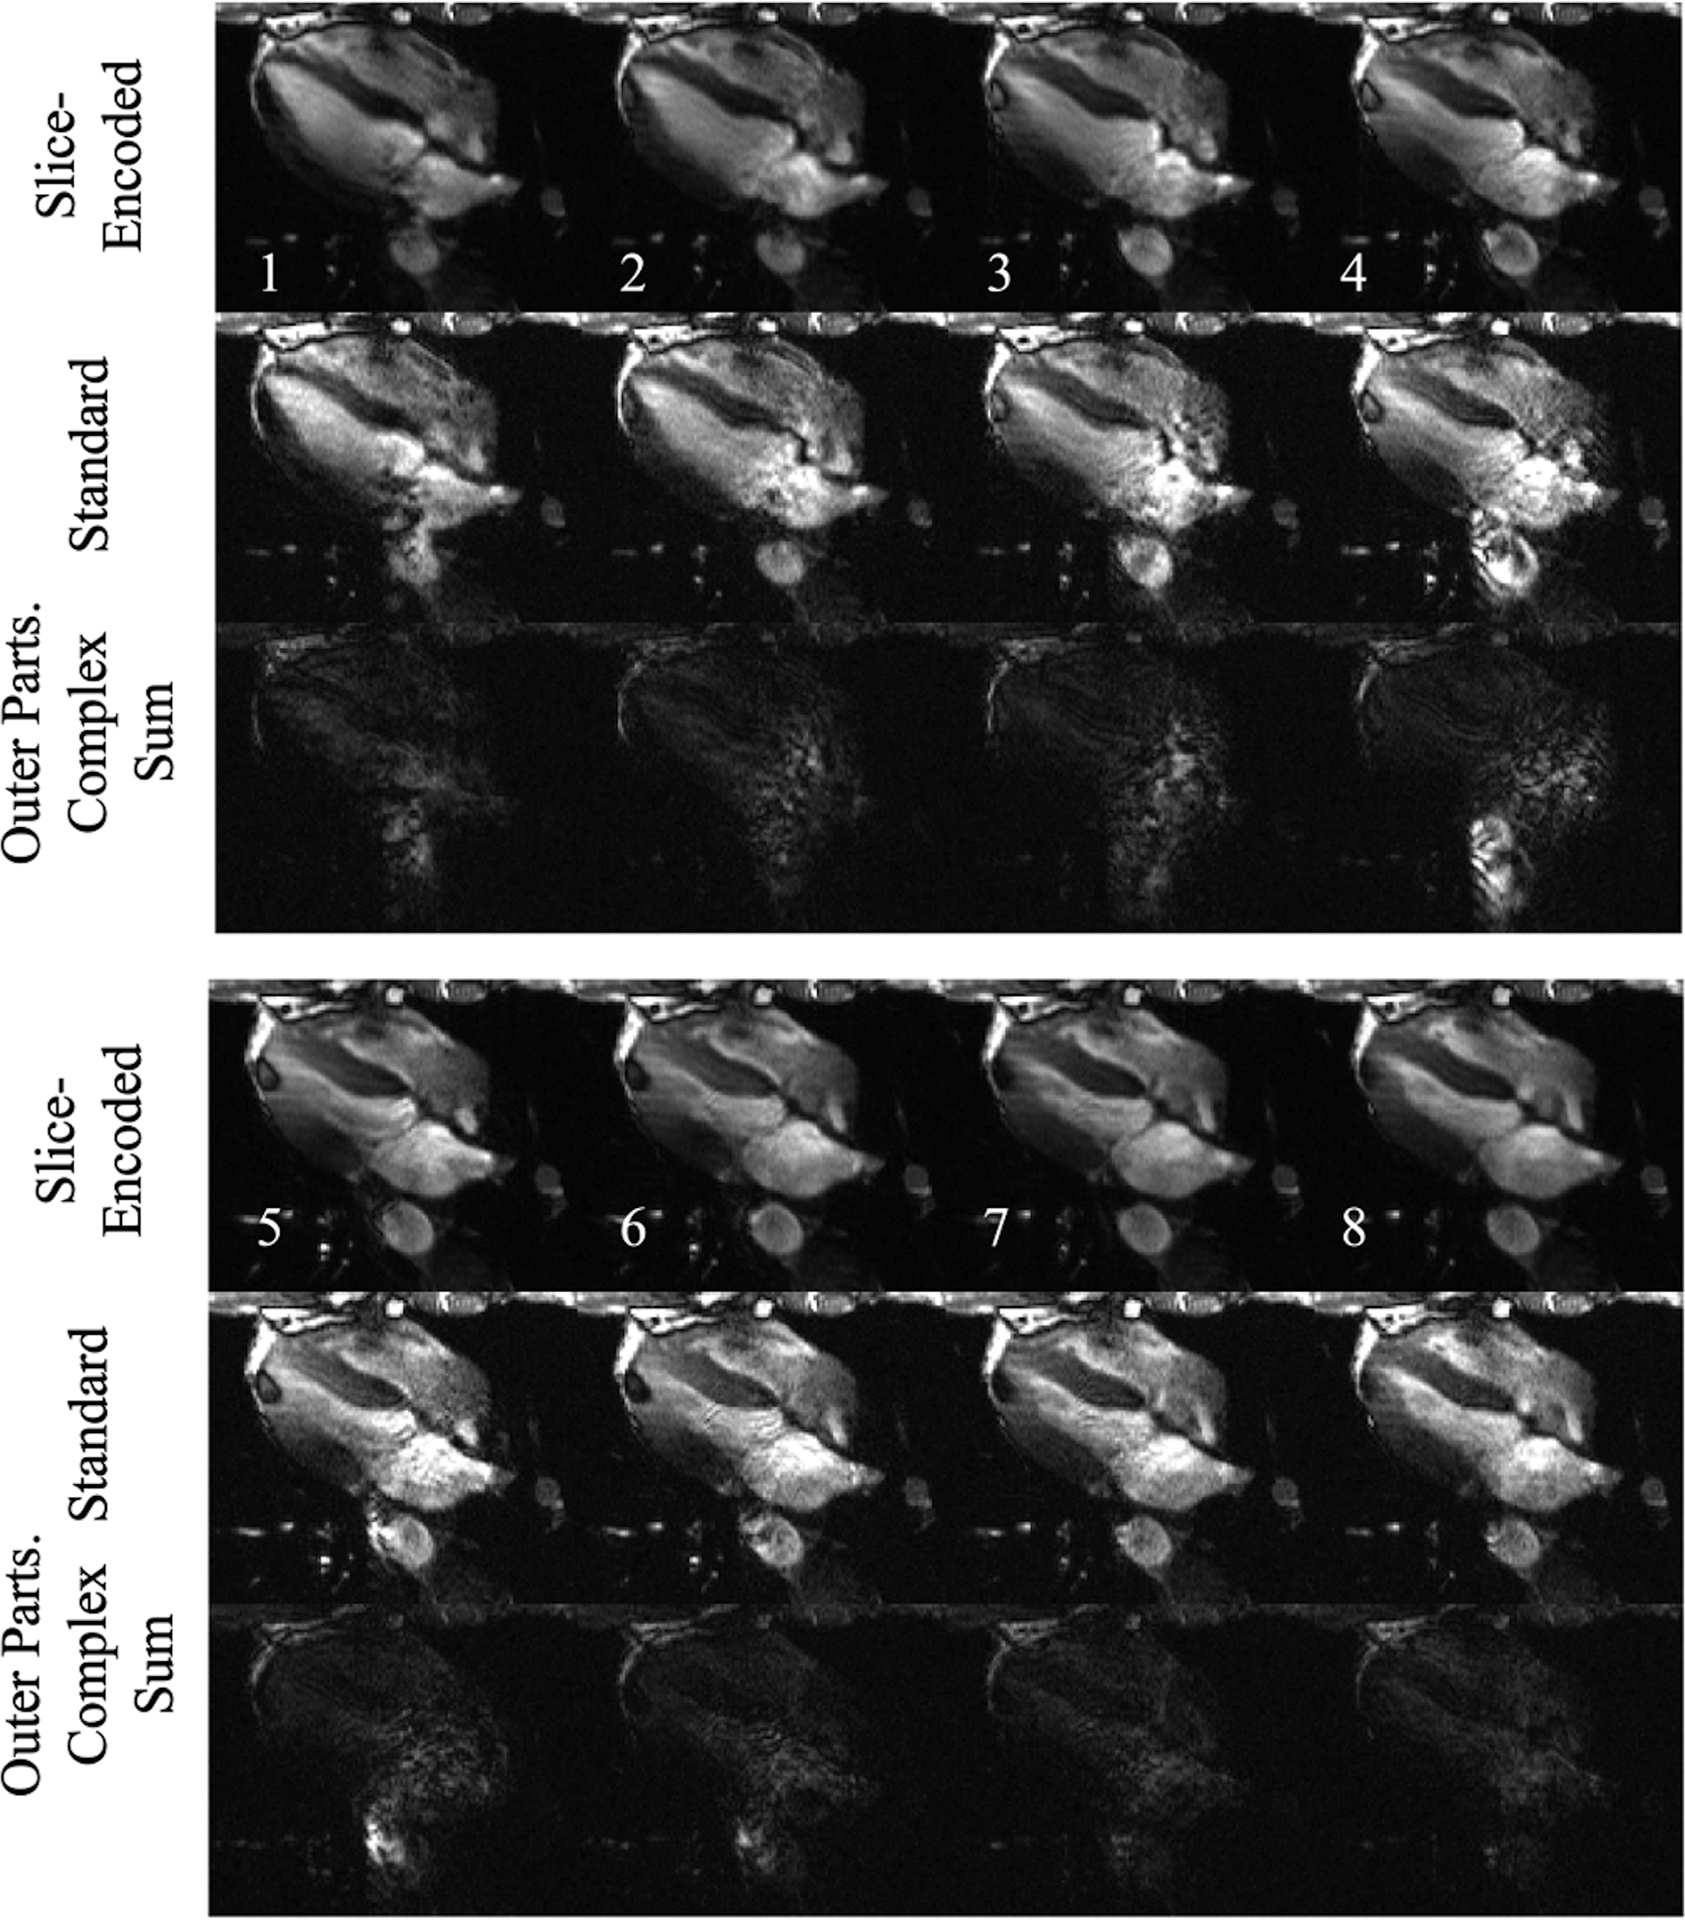
The first eight out of fifteen cardiac phases of Figure 7 III’s acquisition. The proposed sequence produces cine results with fewer outflow disturbance. Much of the standard acquisitions’ artifacts are captured in the outer partitions. The full cine for the standard and the slice-encoded methods are shown in the supplementary material.
The proposed technique with six slice-encoding steps was compared to the standard technique averaged six times in a comparison to see what impact the technique’s inherent averaging had on the outflowing signal’s presence in the resulting image. Figure 9 shows their comparison along with the standard technique, convincing that simple averaging does not reduce the flow artifacts.
Figure 9.
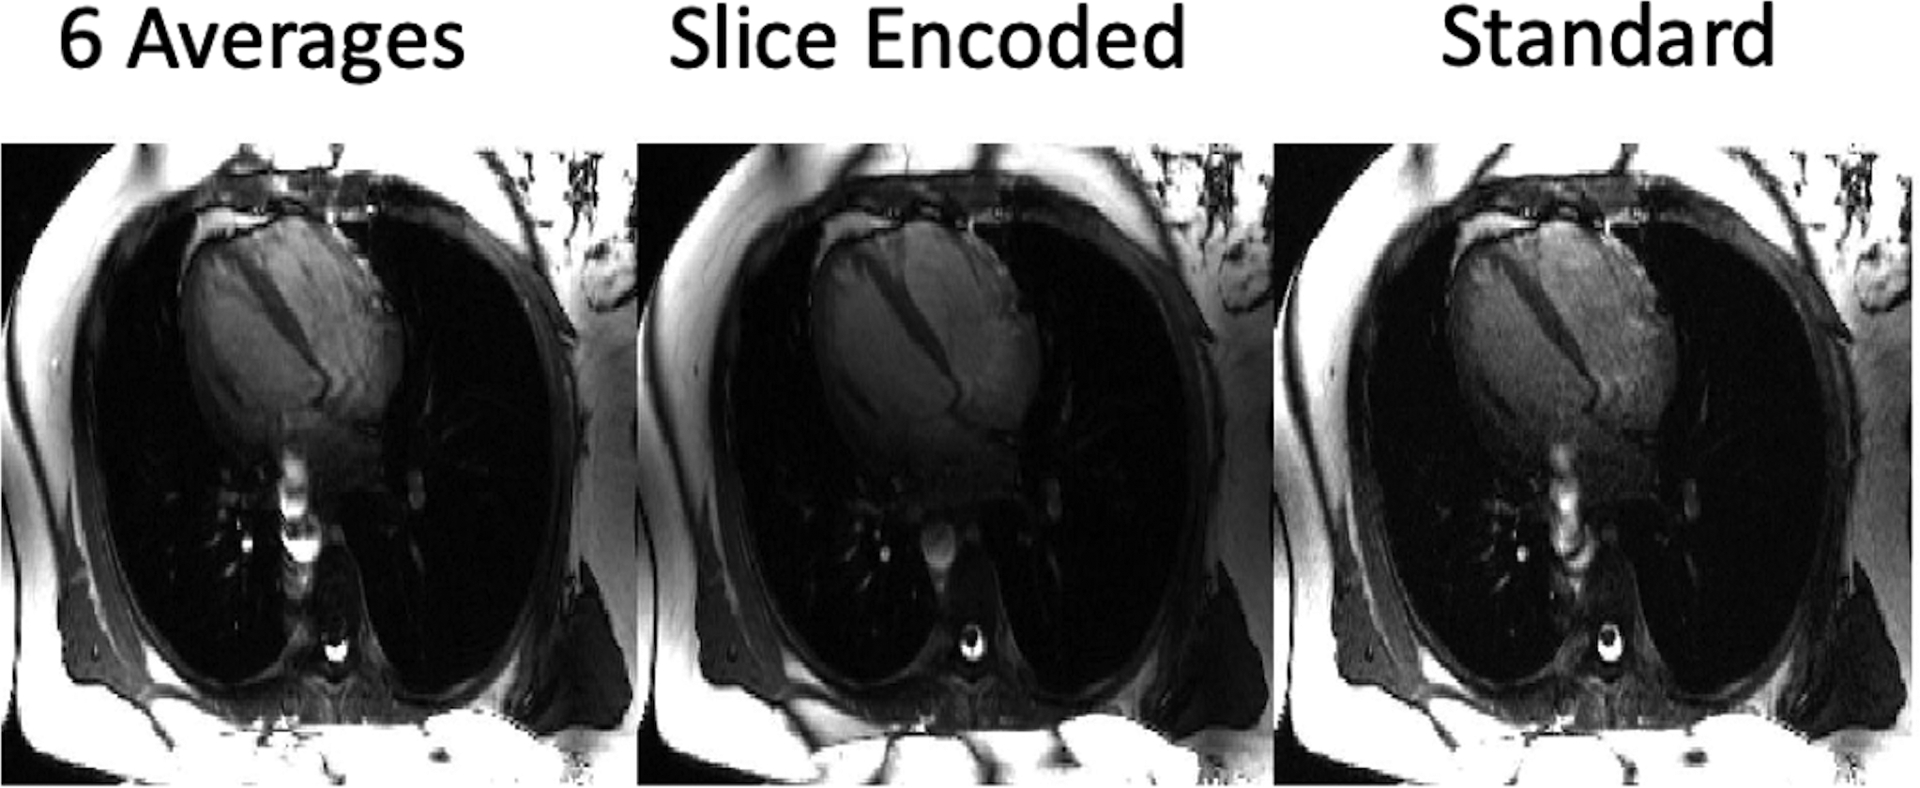
Comparisons between the standard acquisition with six averages, six slice-encoding steps, and the standard 2D bSSFP sequence. Minimal changes between the added averages and the standard technique shows that the feature of the slice-encoding sequence reducing the artifact’s extent is a result of the outflow’s localization instead of signal-averaging.
In addition, Supporting Information Videos S1–S10 show five standard and slice-encoded bSSFP cine pairs, with odd-numbered videos showing a standard 2D cine and the following even-labeled video showing the corresponding slice-encoded cine. These supporting videos include the cines whose images were displayed in Figures 7,8 and 9.
In Vivo Experiments: Statistical Analysis
The rank comparison test indicated that all of the slice-encoded images had quality superior to the standard method. Despite the prolonged breath-hold, we did not observe any added issues, most likely because we scanned middle-aged, healthy subjects.
The nonparametric test involved the quality-score distribution of the standard 2D bSSFP and of the slice-encoded cines, with a null hypothesis that the two cine populations had the same score distribution. The test came to a 0.01 significance, suggesting to reject the null hypothesis. The reassurance from the rank-comparison test made it clear that the slice-encoded images provided a superior image quality than the standard 2D bSSFP cines.
DISCUSSION
In this study, we sought to reduce flow artifacts in cardiac cine imaging by introducing slice-encoding steps in order to spatially localize the outflowing spins. As excited spins leave the slice, the signal profile no longer spans a 2D space, spreading over a 3D volume. Instead of having a planar data set we resolve up to an effective 3D FOV along the slice-select’s direction with the anticipated slice positioned at the center. This treatment is similar to a 3D acquisition, but without any change to the 2D excitation profile.
This technique was greatly inspired by Lu et al’s SEMAC sequence26 as well as Glover et al’s 3D z-Shim method27, which were proposed to resolve through-plane metal-induced field inhomogeneities. The SEMAC technique uses the slice-encoding technique to correctly encode 2D excitation slices that are distorted in the slice-select direction by metallic objects. In our case, the 2D excitation’s slice profile is not necessarily distorted; however, the same strategy is effective in reducing or eliminating image artifacts caused by OOS signal that persist throughout successive TR’s, such as from outflowing spins.
Our Bloch simulations established a theoretical basis of our proposed method effectively reducing much of the outflow-related artifacts by localizing the OOS spins, given a large enough encoding FOV. The phantom and the in vivo images show significant alleviation from the outflow-related artifacts.
The Bloch simulations showed that the sequence isn’t immune to what causes the “zippers”, however this artifact’s significance is reduced with increasing temporal resolution. Fortunately, temporal resolution isn’t the only avenue for reducing this artifact’s occurrence. Encoding through the slice’s axis allows the zipper-smearing to occur along that direction as well, reducing their extent on the center slice. This is evident with the in vivo scans of Figures 7, 8, and 9, all of whom had a 57.76 ms temporal resolution. Their OOS complex sum images show much of their zippers being localized in the outer slices.
Both, the Bloch simulations and the phantom experiments were done more for demonstrative purposes rather than for figuring proper scanning parameters. The Bloch simulations were done with an arbitrary pulsatile flow waveform and receiver coil sensitivity. The phantom experiments were done with tap water, whose T1 and T2 are much larger than blood’s. To get a sense of the difference, consider cerebral spinal fluid, which is predominantly water. It has a 3T longitudinal recovery time of over 4s28 and a T2 decay around 1.6s29, while adult blood has T1 and T2 estimated at around 1–2 seconds and 150 ms respectively30. Therefore, one cannot make any inferences on the number of slice-encoding steps needed to resolve much of the outflowing signal from the intended image in the in vivo studies from these experiments. However, these studies did provide a useful proof of concept free of any external or unwanted variables, including limited breath-hold duration, motion, and susceptibility issues.
Our in vivo results proved the proposed method to be of promising use. The SA acquisition’s zipper of Figure 7‘s column I disturbs much of the left ventricle and corrupts anatomical detail of the septum and right ventricular lumen. In a clinical sense, myocardial contraction, and therefore blood ejection is greatest at peak systole, and the heart’s SA view is often used for determining ejection fraction. Clear delineation of the endocardial and epicardial contours is critical for accurate volumetric and mass quantification. Artifacts like these would impose a barrier for such an evaluation, especially for young-adult subjects. Overall, the slice-encoded images benefit from improved visualization of the interatrial septum, tricuspid valve, descending aorta and para-aortic soft tissues.
An argument could be made in favor of 3D-bSSFP imaging with the same slice-thickness and number of slice-encoding steps as a means to resolve the outflowing signal from the slice of interest. However, 3D through-slice imaging is known to result in a reduced blood-myocardium contrast due to reduced fresh blood enhancement that 2D cardiac cine imaging typically relies on31,32. Another reason for the reduced blood-myocardium contrast in 3D cine bSSFP imaging is because blood-signal of various spin histories mixes in the acquisition33,34. Our technique preserves the blood-myocardium contrast of 2D cardiac cine imaging while removing the outflowing signal artifacts.
We chose to work with six encoding-steps in our in vivo experiments thanks to our Bloch simulations’ results (Figure 4). This choice was made knowing that our simulation took account for a 1500 mm/s peak systolic velocity that is typically seen in healthy young adults24 recruited in our study. If this were to be used in the clinical case, the number of necessary encoding steps would need to be adjusted based on the approximate flow velocity of each patient. If the flow velocity is expected to be substantially lower than 1500 mm/s, then reducing the number of slice-encoding steps would result in significant acquisition time savings.
Our results from Figure 9 indicate that no averaging effects are assisting the removal of outflow artifacts. However, all three of the experiments were done with a 57 ms temporal resolution, which provides ample opportunity for pulsatile through-plane flow transient artifacts. A standard 2D cine acquisition with six-times higher temporal resolution may reduce the extent of the transient artifacts, as indicated by Figure 4C, however will not be immune to the coherent out-of-slice sum projecting onto the image.
Regarding the three “ingredients” to outflow artifacts, the proposed sequence localizes the artifacts from the outflowing signal, thereby reducing the extent of readout mis-projections and signal pileups in the intended slice. The added slice-encodes provides an additional dimension for pulsatile-induced zippers to smear along, also reducing their extent in the intended image.
Using our proposed technique, scan time will be longer due to the slice-encoding steps. In this work, our goal was to demonstrate the technique using relatively conservative acceleration rates. Further developments to accelerate the scan are clearly warranted. Because this involves encoding in three directions, one could exploit a radial means of undersampling and spread the incoherence in the transform domain into three dimensions35. There has been work in a similar domain, using 3D radial bSSFP for whole heart coronary imaging36 that is compatible with our slice-encoded 2D method. This application of the undersampling technique is intriguing for two reasons - not only could this serve as a potential means of reducing the scan time, but it could do so with an expanded effective through-slice FOV, further minimizing aliasing effects.
CONCLUSION
We propose a slice-encoding technique for 2D bSSFP cardiac cine imaging to effectively reduce or eliminate several types of commonly seen flow-dependent artifacts. The types of flow-related artifacts are not seen on every clinical case at our center, but occur with enough frequency, particularly in younger patients, and at higher field imaging, to warrant development of a pulse sequence to correct for these artifacts. Therefore, our technique would be a useful supplemental technique for patients whose blood flow results in artifacts on standard cardiac cine images.
Supplementary Material
ACKNOWLEDGEMENTS
The authors would like to thank Brian Hargreaves for helpful discussions about SEMAC, and Naoki Kaneko for providing his flow phantom for study. The authors thank Viktor Sigalov, Reevea McCollins and Heather Wilbur for providing assistance in volunteer recruitment and study logistics.
Funding:
This project was supported in part by R01HL127153.
Footnotes
Supplementary List
Supporting Information Figure S1
Supporting Information Video S1 (Standard bSSFP)
Supporting Information Video S2 (SE bSSFP)
Supporting Information Video S3 (Standard bSSFP)
Supporting Information Video S4 (SE bSSFP)
Supporting Information Video S5 (Standard bSSFP)
Supporting Information Video S6 (SE bSSFP)
Supporting Information Video S7 (Standard bSSFP)
Supporting Information Video S8 (SE bSSFP)
Supporting Information Video S9 (Standard bSSFP)
Supporting Information Video S10 (SE bSSFP)
DATA AVAILABILITY STATEMENT
The code and the data used for this studies Bloch Simulations can be found in the following link which will be made public upon this manuscript’s publication:
https://github.com/faa5115/flow_bSSFP_Bloch_Simulations.git
Additional data available on request from the authors.
REFERENCES
- 1.Hawkes RC, Holland GN, Moore WS, Roebuck EJ, Worthington BS. Nuclear Magnetic Resonance (NMR) Tomography of the Normal Heart. Journal of Computed Assistant Tomography. 1981;5(1):605–612. [DOI] [PubMed] [Google Scholar]
- 2.Atkinson DJ, Edelman RR. Cineangiography of the Heart in a Single Breath Hold with Segmented TurboFLASH Sequence. Radiology. 1991;178(2):357–360. [DOI] [PubMed] [Google Scholar]
- 3.Barkhausen J, Ruehm SG, Goyen M, Buck T, Laub G, and Debatin JF. MR Evaluation of Ventricular Function: True Fast Imaging with Steady-State Precession versus Fast Low Angle-Shot Cine MR Imaging: Feasibility Study. Radiology. 2001;219(1):264–269. [DOI] [PubMed] [Google Scholar]
- 4.Plein S, Bloomer TN, Ridgway JP, Jones TR, Brainbridge GJ, and Sivananthan MU. Steady-State Free Precession Magnetic Resonanc Imaging of the Heart: Comparison with Segmented K-Space Gradient-Echo Imaging. Journal of Magnetic Resonance Imaging. 2001;14(3):230–236. [DOI] [PubMed] [Google Scholar]
- 5.Alfakih K, Plein S, Thiele H, Jones T, Ridgway JP, Sivananthan MU. Normal Human Left and Right Ventricular Dimensions for MRI as Assessed by Turbo Gradient Echo and Steady-State Free Precession Imaging Sequences. Journal of Magnetic Resonance Imaging. 2003;17 (3):323–329. [DOI] [PubMed] [Google Scholar]
- 6.Patz S Steady-State Free Precession: An Overview of Basic Concepts and Applications. Advanced Magnetic Resonance Imaging. 1989; 1:73–102. [Google Scholar]
- 7.Wehrli FW, Duerk JL, Hurst GC. Fast-Scan Magnetic Resonance-Principles and Applications. Journal of Magnetic Resonance Imaging. 1991;1 (3):284–284. [PubMed] [Google Scholar]
- 8.Haacke EM, Frahm J. A Guide to Understanding Key Aspects of Fast Gradient-Echo Imaging. Journal of Magnetic Resonance Imaging. 1991;1 (6):621–624. [DOI] [PubMed] [Google Scholar]
- 9.Haacke EM, Tkach JA. Fast MR Imaging: Techniques and Clinical Applications. American Journal of Radiology. 1990; 155 (5): 951–964. [DOI] [PubMed] [Google Scholar]
- 10.Scheffler K. A pictorial Description of Steady-States in Rapid Magnetic Resonance Imaging. Concepts in Magnetic Resonance. 1999; 11(5): 291–304. [Google Scholar]
- 11.Scheffler K, Hennig J. Is TrueFISP a Gradient-Echo or a Spin-Echo Sequence?. Magnetic Resonance in Medicine. 2003; 49(2): 395–397. [DOI] [PubMed] [Google Scholar]
- 12.Finn JP, Nael K, Deshpande V, Ratib O, and Laub G. Cardiac MR Imaging: State of the Technology. Radiology. 2006;241(2): 338–354. [DOI] [PubMed] [Google Scholar]
- 13.Francois CJ, Fieno DS, Shors SM, and Finn JP. Left Ventricular Mass: Manual and Automatic Segmentation of True FISP and FLASH Cine MR Images in Dogs and Pigs. Radiology. 2004; 230(2): 389–395. [DOI] [PubMed] [Google Scholar]
- 14.Shors SM, Carina WF, Francois CJ, Finn JP, and Fieno DS. Accurate Quantification of Right Ventricular Mass at MR Imaging by using Cine True Fast Imaging with Steady-State Precession: Study in Dogs. Radiology. 2004; 230(2):383–388. [DOI] [PubMed] [Google Scholar]
- 15.Markl M and Pelc NJ. On Flow Effects in Balanced Steady-State Free Precession Imaging: Pictorial Description, Parameter Dependence, and Clinicial Implications. Journal of Magnetic Resonance Imaging. 2004; 20(4): 697–705. [DOI] [PubMed] [Google Scholar]
- 16.Srinivasan S, Ennis DB. Optimal Flip Angle for High Contrast Balanced SSFP Cardiac Cine Imaging. Magnetic Resonance in Medicine. 2015; 73(3): 1095–1103. [DOI] [PubMed] [Google Scholar]
- 17.Storey P, Li W, Chen Q, and Edelman RR. Flow Artifacts in Steady-State Free Precession Cine Imaging. Magnetic Resonance in Medicine. 2004; 51(1): 115–122. [DOI] [PubMed] [Google Scholar]
- 18.Markl M, Alley M, Elkins C, and Pelc N. Flow Effects in Balanced Steady State Free Precession Imaging. Magnetic Resonance in Medicine. 2003; 50(5): 982–903. [DOI] [PubMed] [Google Scholar]
- 19.Schar M, Kozerke S, Fischer S, and Boesiger P. Cardiac SSFP Imaging at 3 Tesla. Magnetic Resonance in Medicine. 2004; 51 (4): 799–806. [DOI] [PubMed] [Google Scholar]
- 20.Deshpande VS, Shea SM, Li D. Artifact Reduction in True-FISP Imaging of the Coronary Arteries by Adjusting Imaging Frequency. Magnetic Resonance in Medicine. 49 (4): 803–809. [DOI] [PubMed] [Google Scholar]
- 21.Datta A, Cheng J, Hargreaves B, Baron C, and Nishimura D. Mitigation of. Near-Band Balanced Steady-State Free Precession Through-Plane Flow Artifacts Using. Partial Dephasing. Magnetic Resonance in Medicine. 79 (6): 2944–2953. [DOI] [PMC free article] [PubMed] [Google Scholar]
- 22.Bieri O, Markl M, and Scheffler K. Analysis and Compensation of Eddy Currents in Balanced SSFP. Magnetic Resonance in Medicine. 2005; 51(4): 129–137. [DOI] [PubMed] [Google Scholar]
- 23.Bieri O and Scheffler K. Flow Compensation in Balanced SSFP Sequences. Magnetic Resonance in Medicine. 2005; 54(4): 901–907. [DOI] [PubMed] [Google Scholar]
- 24.Ooij PV, Garcia J, Potters WV, Malaisrie SC, Collins JD, Carr JC, et al. Age-Related Changes in Aortic 3D Blood Flow Velocities and Wall Shear Stress: Implications for the Identification of Altered Hemodynamics in Patients with Aortic Valve Disease. Journal of magnetic Resonance Imaging. 2016; 43(5): 1239–1249. [DOI] [PMC free article] [PubMed] [Google Scholar]
- 25.Ma Y, Liu W, Tang X, and Gao J. Improved SENSE Imaging Using Accurate Coil Sensitivity Maps Generated by a Global Magnitude-Phase Fitting Method. Magnetic Resonance in Medicine. 2015; 74(1): 217–224. [DOI] [PubMed] [Google Scholar]
- 26.Lu W, Pauly KB, Gold GE, Pauly JM, and Hargreaves BA. SEMAC: Slice Encoding for Metal Artifact Correction in MRI. Magnetic Resonance in Medicine. 2009; 62(1): 66–76. [DOI] [PMC free article] [PubMed] [Google Scholar]
- 27.Glover GH. 3D z-Shim Method for Reduction of Susceptibility Effects in BOLD fMRI. Magnetic Resonance in Medicine. 1999; 42(2): 290–299. [DOI] [PubMed] [Google Scholar]
- 28.Lin C, Bernstein M, Huston J, and Fain S. Measurements of T1 Relaxation Times at 3.0T: Implications for Clinical MRA. Proceedings of the 9th Scientific Annual Meeting of the ISMRM. Glasgow, Scotland, 2001. (Abstract 1391). [Google Scholar]
- 29.Spijkerman JM, Petersen ET, Hendrikse J, Liujten P, and Zwanenburg JJ. T2 Mapping of Cerebrospinal Fluid: 3T Versus 7T. Magnetic Resonance Materials in Physics, Biology and Medicine. 2018; 31: 415–424. [DOI] [PMC free article] [PubMed] [Google Scholar]
- 30.Liu P, Chalak LF, Krishnamurthy LC, Mir I, Peng S, Huang H, Lu H. T1 and T2 Values of Human Neonatal Blood at 3 Tesla: Dependence on Hematocrit, Oxygenation, and Temperature. Magnetic Resonance in Medicine. 2016; 75(4): 1730–1735. [DOI] [PMC free article] [PubMed] [Google Scholar]
- 31.Nezafat R, Herzka D, Stehning C, Peters DC, Nehrke K, and Manning WJ. Inflow Quantification in Three-Dimensional Cardiovascular MR Imaging. Journal of Magnetic Resonance Imaging. 2008; 28(5): 1273–1279. [DOI] [PubMed] [Google Scholar]
- 32.Laub GA. Time-of-Flight Method of MR Angiography. Magnetic Resonance Imaging Clinics of North America. 1995; 3(3): 391–398. [PubMed] [Google Scholar]
- 33.Mascarenhas NB, Muthupillai R, Cheong B, Pereyra M, and Flamm SD. Fast 3D Cine Steady-State Free Precession Imaging with Sensitivity Encoding for Assessment of Left Ventricular Function in a Single Breath-Hold. American Journal of Roentgenology. 2006; 187(5): 1235–1239. [DOI] [PubMed] [Google Scholar]
- 34.Nehrke K, Bornert P, Bornert C, Stehning C. Flow-Related Problems in Whole Heart Cine Coronary MR Angiography. Proceedings of 14th Scientific Annual Meeting of the ISMRM. SEATTLE, 2006. (Abstract 2153). [Google Scholar]
- 35.Lustig M, Donoho D, and Pauly JM. Sparse MRI: The Application of Compressed Sensing for Rapid MR Imaging. Magnetic Resonance in Medicine. 2007; 58(6): 1182–1195. [DOI] [PubMed] [Google Scholar]
- 36.Stehning C, Bornert P, Nehrk K, Eggers H, and Dossel O. Fast Isotropic Volumetric Coronary MR Angiography Using Free-Brething 3D Radial Balanced FFE Acquisition. Magnetic Resonance in Medicine. 2004; 52(1): 197–203. [DOI] [PubMed] [Google Scholar]
Associated Data
This section collects any data citations, data availability statements, or supplementary materials included in this article.
Supplementary Materials
Data Availability Statement
The code and the data used for this studies Bloch Simulations can be found in the following link which will be made public upon this manuscript’s publication:
https://github.com/faa5115/flow_bSSFP_Bloch_Simulations.git
Additional data available on request from the authors.


