Abstract
Context
Metabolic disorders such as obesity represent a major health challenge. Obesity alone has reached epidemic proportions, with at least 2.8 million people worldwide dying annually from diseases caused by overweight or obesity. The brain–metabolic axis is central to maintain homeostasis under metabolic stress via an intricate signaling network of hormones. Protein interacting with C kinase 1 (PICK1) is important for the biogenesis of various secretory vesicles, and we have previously shown that PICK1-deficient mice have impaired secretion of insulin and growth hormone.
Objective
The aim was to investigate how global PICK1-deficient mice respond to high-fat diet (HFD) and assess its role in insulin secretion in diet-induced obesity.
Methods
We characterized the metabolic phenotype through assessment of body weight, composition, glucose tolerance, islet morphology insulin secretion in vivo, and glucose-stimulated insulin secretion ex vivo.
Results
PICK1-deficient mice displayed similar weight gain and body composition as wild-type (WT) mice following HFD. While HFD impaired glucose tolerance of WT mice, PICK1-deficient mice were resistant to further deterioration of their glucose tolerance compared with already glucose-impaired chow-fed PICK1-deficient mice. Surprisingly, mice with β-cell–specific knockdown of PICK1 showed impaired glucose tolerance both on chow and HFD similar to WT mice.
Conclusion
Our findings support the importance of PICK1 in overall hormone regulation. However, importantly, this effect is independent of the PICK1 expression in the β-cell, whereby global PICK1-deficient mice resist further deterioration of their glucose tolerance following diet-induced obesity.
Keywords: glucose tolerance, insulin secretion, insulin sensitivity, type 2 diabetes, PICK1, diet-induced obesity
Metabolic diseases such as obesity, type 2 diabetes, and metabolic syndrome constitute a major health challenge [1], and it is estimated that by 2030 58% of the global adult population will be overweight (body mass index 25-29.9 kg/m2) and 26% obese (body mass index ≥ 30 kg/m2) [2, 3]. The brain is central for maintaining energy homeostasis under metabolic stress via an intricate signaling network of hormones. Frequent or chronic stimulation of the hypothalamic–pituitary–adrenal axis and dysfunction of the endocrine stress system is believed to contribute to the increase in metabolic disorders [4].
Well-tuned biogenesis and maturation of hormone-containing dense-core vesicles is a prerequisite for efficient secretion from endocrine cells. The N-Bin/Amphiphysin/Rvs (BAR) domain protein PICK1 (Protein Interacting with C Kinase 1) has been identified to play an important role in facilitating budding of early secretory vesicles from the trans-Golgi network in pancreatic β-cells and growth hormone (GH)–producing cells of the pituitary [5, 6]. PICK1 forms a heterodimerization complex with islet cell autoantigen 69 kD (ICA69), a diabetes-associated autoantigen found in pancreatic islets that has a similar BAR domain [7]. Together they promote curvature and budding of immature secretory granules, while it is believed that PICK1 aids in maturation of immature secretory granules as a homodimer [5, 6, 8, 9].
The phenotype of PICK1-deficient mice is a result of secretory defect of multiple hormones and is accordingly complex and multifaceted [5, 6, 10]. The phenotype resembles both that of human GH deficiency and impaired glucose homeostasis. Similar to classical traits of GH deficiency, we have shown that PICK1-deficient mice display reduced somatic growth, increased body fat percent, and improved insulin sensitivity [5]. At the same time, PICK1-deficient mice exhibit decreased secretion of insulin and impaired glucose tolerance [5, 6]. The diabetes-like phenotype of PICK1-deficient mice most likely results from defects in biogenesis of insulin-containing granules. In accordance, a study showed that PICK1 deficiency restricted to pancreatic β-cells leads to impaired glucose tolerance, insulin deficiency, and hyperglycemia [10]. Moreover, 4 missense mutations identified in the BAR domain of PICK1 in a whole exome screening of Danish patients with diabetes were shown to reduce insulin content in cell cultures and primary rodent pancreatic β-cells, suggesting that the BAR domain is important for proper granule biogenesis [9].
Since finetuned hormonal regulation is required during metabolic challenges, we wanted to examine how PICK1-deficient mice respond when exposed to metabolic challenges such as diet-induced obesity and streptozotocin (STZ)-induced diabetes, which both lead to an increased demand for insulin. Furthermore, we wished to study the function of isolated islets using glucolipotoxic (GLT) conditions to resemble type 2 diabetes–associated β-cell failure.
Materials and Methods
Mouse Genetics, Breeding, and Housing
Mice with global PICK1 knockout (KO) were generated as previously described (referred to as PICK1-deficient mice) [11]. In brief, mice were backcrossed to C57BL/6 J mice (Janvier, Denmark) for 3 generations and then bred to homozygosity using littermates −/− and +/+ mice throughout the study. β-Cell–specific PICK1-KO mice were generated as follows: mice carrying a mutated PICK1 allele, flanked by LoxP sites, were crossed with RIP-Cre transgenic mice [12] from Jackson Laboratory (JAX stock #003573). The offspring, PICK1 loxp+//Cre+/−, were mated with PICK1 loxp+/+/Cre−/−, to produce breeders for the final breeding: PICK1 loxp+/+/Cre+/−, PICK1 loxp+/+/Cre−/−. The offspring produced from the final breeding were either control mice, PICK1 loxp+/+/Cre−/−, or pancreatic β-cell–specific PICK1-KO mice, PICK1 loxp+/+/Cre+/−. Males were used in the study. Mice were kept on a high-fat diet (HFD) (60.0% fat, 20.0% protein, 20.0% carbohydrate, D12492; Research Diets, New Brunswick, NJ, USA) or regular chow (5.3% fat, 22.0% protein, 50.8 carbohydrate, SAFE D30; Safe Diets, Rosenberg, Germany) from the age of 14 weeks and tap water ad libitum. All animals were maintained in accordance with institutional guidelines and experiments were approved by the Animal Experiments Inspectorate in Denmark.
Characterization of Metabolic Phenotype
Body weight (BW) was measured on a weekly basis, and body composition was measured in conscious animals by quantitative magnetic resonance imaging using EchoMRI 4-in-1 (Echo Medical Systems, Houston, TX) every second week. Measurement of insulin-like growth factor (IGF)-1, GH, prolactin, thyroid-stimulating hormone (TSH), and adrenocorticotropic hormone (ACTH) was carried out as described previously [5]. In brief, following an overnight fast the plasma level of IGF-1 was measured in blood collected from the orbital sinus using an ACTIVE Mouse/Ras IGF-1 RIA kit (Diagnostic Systems Laboratories, Inc.). The pituitary hormones were measured using enzyme-linked immunosorbent assays: GH (Millipore Cat# EZRMGH-45K, RRID:AB_2892711), prolactin (Calbiotech, Cat# PR063F-100, RRID:AB_2936217), ACTH (Calbiotech, Cat# AC018T, RRID:AB_2936218), and TSH (Phoenix Peptide, Cat# EK-310-01, RRID:AB_2936219). The oral glucose tolerance test (OGTT) was carried out in global PICK1-deficient mice and wild-type (WT) mice at 32 weeks of age having been on chow or HFD for 18 weeks. Mice with β-cell–specific KO and WT mice were 29 weeks of age and had been subjected to HFD feeding for 16 to 17 weeks. An OGTT was also carried out in global PICK1-deficient mice and WT mice treated with vehicle or STZ injections after 7 weeks. Overall, animals were fasted overnight for 16 to 18 hours with free access to water prior to the OGTT. Glucose (1.5 g/kg BW) was orally administered [13], and blood glucose levels were monitored in blood samples obtained from tail punctures using a handheld glucometer (Ascensia Contour Glucometer, Bayer) before and after glucose administration. At time points 0 and 15 minutes, blood was collected from the orbital sinus for measurement of plasma insulin levels using the Sensitive Insulin radioimmunoassay kit (Linco Research). Global PICK1-deficient mice at 31 weeks of age were used for the insulin tolerance test (ITT), while β-cell–specific KO mice were used at 33 weeks of age. Mice were fasted for 2 hours, and insulin was injected at a dose of 0.75 U/kg BW (Actrapid, Novo Nordisk, Denmark) [14]. Blood glucose levels were monitored as in the OGTT. The OGTT and ITT were carried out in the same animals, with at least 7 days between each intervention.
In Vivo STZ Model
STZ was purchased from Sigma (St. Louis, MO, USA). STZ was dissolved in cold sodium citrate buffer pH 4.5 and injected intraperitoneally for 5 consecutive days in a dose of 35 mg per kg BW. Once a week for 6 weeks, mice were fasted for 4 hours with access to water ad libitum for measuring for the fasting glucose level to monitor β-cell destruction. The OGTT was carried out after 7 weeks and BW was monitored for 25 weeks after injections.
Immunohistochemistry
Immunohistochemical analysis of pancreatic tissue was done as previously described [15]. Microscopy was performed on coverslipped slides using an Olympus BX-51 microscope. The relative area of immunoreactive cells was measured in 6 randomly selected islets per section (2 sections from each animal) in a blinded manner. All measurements were performed on images using Zen Black software.
Islet Isolation and Analysis
Pancreatic islets from 9-week-old animals were isolated by bile duct perfusion of the pancreas, and glucose-stimulated insulin secretion was measured as done previously [15]. In brief, isolated islets were cultured in RPMI 1640 supplemented with 10% fetal bovine serum and 0.1% penicillin and streptomycin at 37 °C with 5% CO2. For GLT conditions, culture medium was supplemented with or without endotoxin-free glucose and/or palmitate +/− oleate (both from Invitrogen) dissolved in 80% ethanol. Fatty acids were conjugated to bovine serum albumin for at least 4 hours at 37 °C in a molar ratio of 3:1 in culture medium prior to use, and the final concentrations were palmitate 400 µM; combination of fatty acids palmitate (200 µM) and oleate (200 µM), and glucose 30 mM. Culture medium supplemented with bovine serum albumin and ethanol was used as control for GLT conditions. Insulin content and secretion were measured using a mouse/rat insulin kit (Meso Scale Discovery Cat# K152BZC, RRID:AB_2784505), according to the manufacturer's instructions, and absorption was measured using a MESO plate reader. Twenty-five islets per mouse were used for the following experiments. Proinsulin content and secretion were measured using the high range mouse proinsulin enzyme-linked immunosorbent assay kit (Alpco Diagnostics Cat# 80-PINMS-E01, RRID:AB_2827652), as described in the manufacturer's protocol. Absorption was measured on an Omega POLARstar plate reader at 450 and 590 nm.
Relative mRNA levels from isolated islets were measured by quantitative real-time PCR (RT-qPCR). The total mRNA was purified from the islets using QIAzol lysis reagent (Qiagen) and TissueRuptor (Qiagen), as described in the manufacturer's protocol. cDNA was generated using first strand synthesis Superscript III reverse transcriptase (Invitrogen). RT-qPCR was performed on the Mx3000P (Stratagene) with Platinum SYBR Green qPCR supermix with ROX as reference dye (Invitrogen) and run according to the manufacturer's instructions with “hotstart” of 2 minutes at 95 °C, followed by 40 cycles of 10 seconds at 95 °C, followed by 60 seconds at 60 °C. After 40 cycles, a melt-curve was generated to visualize specificity of the product. Any products with visible contamination were excluded from data analysis. Primer sequences were obtained from [10]. Ins2 was used as reference and showed no difference from ins1 in cycle number (Ct) values. Primer efficiencies were validated prior to experiment through a dilution curve addressing the linear relationship between RNA dilution and Ct. The relative level of (pro)insulin mRNA was determined by the ΔΔCt method using β-actin as a reference gene. For each independent experiment, the Ct value for each well had a maximum cut-off of 40 cycles, samples were run in technical duplicates, and averaged Ct values were used for all calculations: Ins1: forward: TGGCTTCTTCTACACACCCAAGTC; reverse: ACTGATCCACAATGCCACGCTTCT; Ins2: forward: GTGGCTTCTTCTACACACCCATGT, reverse: GCACTGATCTACAATGCCACGCTT; β-actin: forward: CTCTTTTCCAGCCTTCCTTCTT, reverse: AGTAATCTCCTTCTGCATCCTGCT.
Hematoxylin and Eosin Staining and Morphologic Analysis of White Adipose Tissue
White adipose tissue (WAT) (epididymal and inguinal) was fixed in 4% paraformaldehyde overnight at 4 °C. Following dehydration in ethanol and xylene, tissue samples were embedded in paraffin. Tissue sections (3 μm thick) were deparaffinized, rehydrated, and stained using a standard Mayer's hematoxylin and eosin or Sirius Red staining protocol. Microscopy was performed on coverslipped slides using an Olympus BX-51 microscope and the Visiopharm Integrator System software program to analyze the images.
Western Blot Analysis
The skeletal extensor digitorium longus muscle was carefully dissected from mice at 45 weeks of age after 31 weeks on HFD and stimulated with insulin (500 µU/mL) for 30 minutes, before being lysed for Western blot analysis, as previously described [16]. The protein concentration in lysates from extensor digitorium longus muscles was determined using the BCA protein kit (Thermo Scientific) and Western blotting analysis was carried out as described previously [15]. The membranes were incubated with primary antibodies (1:1000) overnight at 4 °C. Antibodies to phosphor-glycogen synthase kinase-3β (GSK3β) (Ser9) (Cell Signaling Technology Cat# 9336, RRID:AB_331405), total GSK3β (Cell Signaling Technology Cat# 9315, RRID:AB_490890), phosphor-insulin receptor substrate 1 (IRS1) (Ser307) (Cell Signaling Technology Cat# 2381, RRID:AB_330342), phosphor-Akt (Ser473) (Cell Signaling Technology Cat# 9271, RRID:AB_329825), total Akt (Cell Signaling Technology Cat# 9272, RRID:AB_329827), and glyceraldehyde-3-phosphate dehydrogenase (Cell Signaling Technology Cat# 2118, RRID:AB_561053) were obtained from Cell Signaling, and antibody for total IRS1 (Innovative Research Cat# 44-816G, RRID:AB_1501247) was purchased from Invitrogen. Donkey antirabbit horseradish peroxidase (1:5000) was used as secondary antibody (Abcam Cat# ab205722, RRID:AB_2904602) incubated at room temperature for 1.5 hours or overnight at 4 °C.
Statistical Analysis
Statistical analysis was carried out using GraphPad Prism Statistical Software. Data were tested for normal distribution using either the D’Agostino–Pearson normality test or the Shapiro–Wilk normality test. The 2-tailed Student's t test or Mann–Whitney test were used for comparison between 2 groups while 2-way analysis of variance (ANOVA) followed by Sidak post hoc tests were used to compare among several groups.
Results
BW and Composition
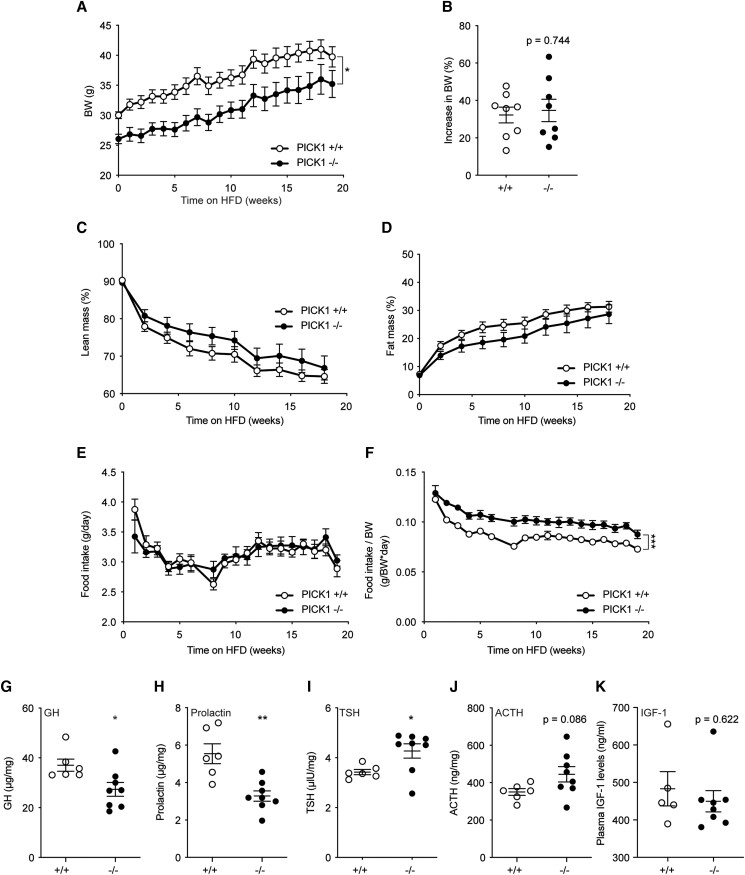
We have previously shown that chow-fed PICK1-deficient mice exhibit reduced BW and length likely due to defective GH secretion [5]. In accordance, male PICK1-deficient mice in this study had significantly lower BW (Fig. 1A) than WT mice, and this difference remained constant throughout 18 weeks on HFD during which WT and PICK1-deficient mice experienced a comparable weight gain (Fig. 1B). The absolute lean mass was significantly lower in PICK1-deficient mice s 1A [17]), but as expected from the decreased BW, calculation of percentage lean mass showed no difference (Fig. 1C). There was no difference in absolute or percentage of fat mass between PICK1-deficient and WT mice (Fig. 1D; Figure 1B [17]). Interestingly, the PICK1-deficient mice showed similar food intake patterns during HFD as WT mice (Fig. 1E), but relative to BW they had increased food intake (Fig. 1F). Female PICK1-deficient mice displayed similar phenotype as described for the males; however, no significant difference was observed in BW nor composition following 12 weeks on HFD, suggesting a more pronounced phenotype in male mice (Figure 1C-F [17]). The remaining studies were conducted on males only. We measured hormone content from pituitary extracts from PICK1-deficient mice following HFD. GH and prolactin levels were decreased similar to previous observations [5] (Fig. 1G and 1H), while TSH was increased and ACTH at the same level as WT mice (Fig. 1I and 1J), both of which were the same level as WT mice during chow diet [5]. Plasma levels of IGF-1 were similar to that of WT mice (Fig. 1K). Ghrelin-induced GH was similar between WT and PICK1-deficient (Figure 1G [17]).
Figure 1.
Total BW and composition of global PICK1-deficient mice on HFD. (A) BW following 18 weeks of HFD and (B) total increase in BW (%). (C, D) Lean and fat mass are shown as the percentage of BW over time, respectively. (E) Food intake over time and (F) relative food intake compared with BW. Data are shown as mean ± SEM (n ≥ 8). (G) GH, (H) prolactin, (I) TSH, and (J) ACTH levels, and (K) plasma IGF-1 from 45-week-old mice following HFD. Data are shown as dot plot with mean ± SEM (n ≥ 5). Statistical significance was determined using 2-way ANOVA with Sidak's multiple comparisons test or unpaired t test. *P < .05, **P < .01, ***P < .001.
Glucose Metabolism
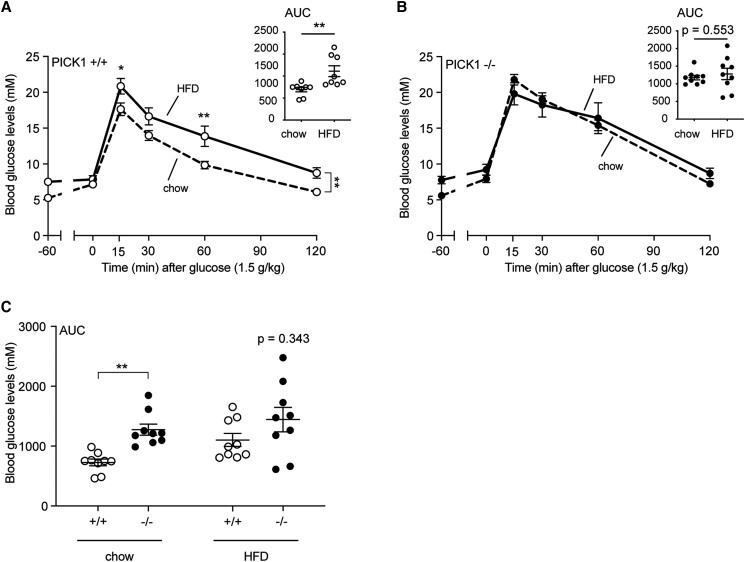
To characterize the impact of HFD on the glucose homeostasis, we performed an OGTT. Chow-fed PICK1-deficient mice displayed impaired plasma glucose clearance (Figure 2A [17]) compared with WT mice in accordance with previous observations [5, 6]. As expected, 18 weeks of HFD impaired glucose clearance of the WT mice as shown by the OGTT (Fig. 2A). Interestingly, PICK1-deficient mice showed no impairment in glucose clearance following HFD (Fig. 2B) compared with chow-fed PICK1-deficient mice. In accordance, the area under the curve (AUC) for the OGTT did not deteriorate further in the PICK1-deficient mice on the HFD, while the AUC for WT mice showed the expected difference between chow and HFD (Fig. 2A). Furthermore, no significant difference was observed between PICK1-deficient or WT mice following HFD during the OGTT (Fig. 2C; Figure 2B [17]).
Figure 2.
Glucose homeostasis following HFD in global PICK1-deficient mice. The OGTT was carried out in mice at age 32 weeks following 18 weeks on chow or HFD. The effect of HFD compared with chow on glucose levels with AUC of glucose excursions for the OGTT is shown for WT (A) and (B) global PICK1-deficient mice. (C) AUC from (A) and (B). Data are shown as dot plot with mean ± SEM (n ≥ 8). Statistical significance was determined using 2-way ANOVA with Sidak's multiple comparisons test or with unpaired t-test. *P < .05, **P < .01.
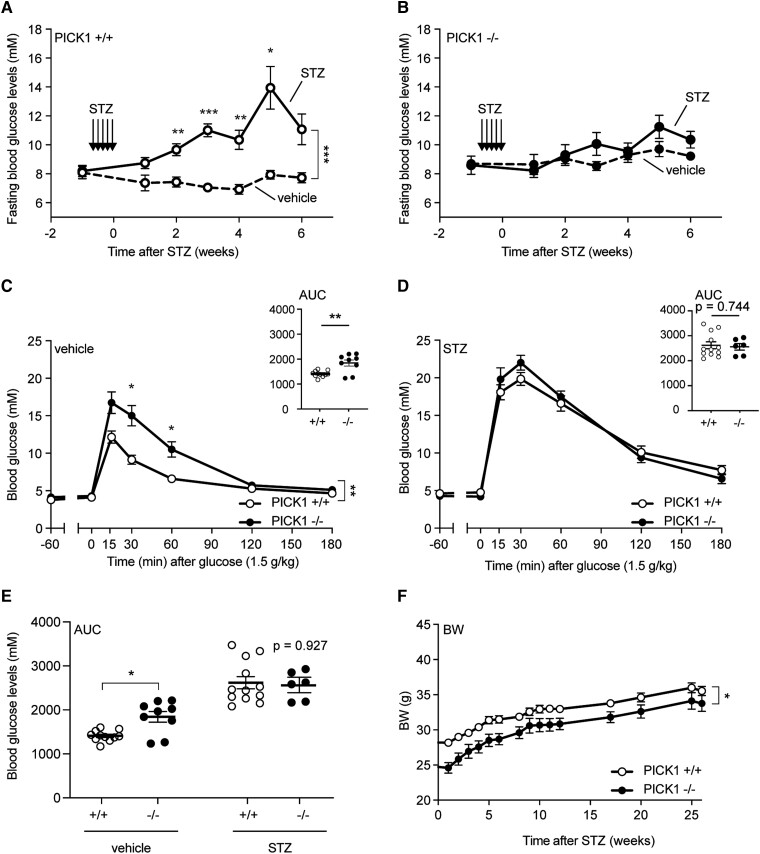
When we challenged the mice with multiple low doses of the diabetogenic compound STZ, a similar pattern was observed. This type of low-dose STZ treatment induces destruction of GLUT2-containing cells, such as pancreatic β-cells, leading to impaired glucose tolerance a few weeks after the initial treatment [18, 19]. The STZ-induced β-cell destruction in WT mice resulted in a significant increase in fasting blood (4 hours fasting) glucose levels after 2 to 6 weeks (Fig. 3A), whereas no change was observed in PICK1-deficient mice (Fig. 3B). We performed an OGTT after 7 weeks and PICK1-deficient mice displayed impaired glucose tolerance compared with WT mice under vehicle conditions (Fig. 3C and 3E); however, PICK1-deficient mice resisted further deterioration of glucose tolerance following STZ administration relative to WT mice, (Fig. 3D), as seen from the AUC conducted from the glucose excursions (Fig. 3E). STZ administration did not affect the weight gain of either WT or PICK1-deficient mice (Fig. 3F). These results suggest that the PICK1-deficient mice are not only resistant to further deterioration in their glucose tolerance from diet-induced obesity, but also to some extent STZ administration.
Figure 3.
Global PICK1-deficient mice resist further deterioration of their glucose tolerance following STZ administration. (A) WT mice and (B) PICK1-deficient mice were injected intraperitoneally with STZ for 5 consecutive days with 35 mg per kg BW and mice were fasted once a week to measure glucose levels (n ≥ 8). (C) The OGTT was carried out in fasted vehicle-treated PICK1-deficient and WT mice, while (D) the OGTT was carried out in fasted STZ-administered PICK1-deficient and WT mice. (E) AUC of glucose excursions from (C) and (D). (F) BW was determined on a weekly basis after STZ administration for 25 weeks. Data are shown with mean ± SEM. Statistical significance was determined using 2-way ANOVA with Sidak's multiple comparisons test. *P < .05, **P < .01, ***P < .001.
Insulin Secretion and Islet Morphology
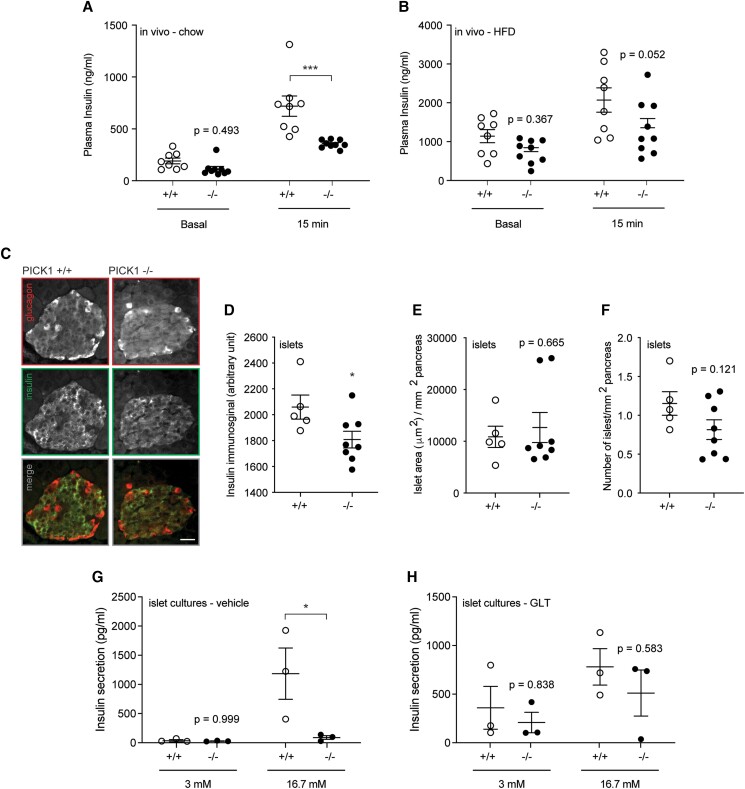
When fed a normal chow diet, isolated islets from PICK1-deficient mice displayed levels of proinsulin expression, content, and secretion similar to islets from WT mice (Figure 3A-C [17]). However, in vivo insulin secretion measured during glucose challenge showed strongly decreased insulin secretion in PICK1-deficient mice, as previously described [6] (Fig. 4A). In accordance with previous observations on glucose levels (Fig. 2C), following 18 weeks of HFD, insulin secretion was no longer significantly different from that of WT mice (Fig. 4B), suggesting that the pancreatic β-cells were able compensate with insulin secretion under hyperglycemic conditions. During chronic hyperglycemia, pancreatic β-cells are able to adapt by increasing in number and size to maintain normoglycemia [20]. To elucidate whether an increased β-cell mass is what enables PICK1-deficient mice to resist obesity- or STZ-induced deterioration of their glucose tolerance compared with WT mice, we performed immunohistochemical staining of pancreatic islets (Fig. 4C) and measured a reduced insulin immunosignal (Fig. 4D). We observed similar islet morphology in WT and PICK1-deficient mice (Fig. 4E and 4F), with no significant difference in the ratio of insulin- or glucagon-positive cells, respectively (Figure 3D-E [17]). Although not significant, we noticed a skewed size distribution of islets from PICK1-deficient mice, with fewer small islets (500-5000 μm2) to more large islets (>20 000 μm2) (Figure 3F [17]).
Figure 4.
Global PICK1-deficient mice display impaired insulin secretion during vehicle conditions, but not after HFD or GLT exposure. (A, B) During the OGTT, insulin was measured −60 (basal) minutes and 15 minutes for mice on chow or HFD (n ≥ 8). (C) Representative images of pancreatic tissue from WT and PICK1-deficient mice following HFD, immunostained for insulin (magenta) or glucagon (cyan). Scale bar = 100 μm. (D) Quantification of the insulin immunosignal (E) islet area and (F) number of islets (n ≥ 5). (G, H) Glucose-stimulated insulin secretion was conducted on islets isolated from PICK1-deficient and WT mice on chow diet and treated with vehicle or GLT conditions, respectively. Data shown as dot plot with mean ± SEM (n = 3). Statistical significance was determined using 2-way ANOVA with Sidak's multiple comparisons test or unpaired t test. *P < .05, ***P < .001.
β-Cells can also compensate for an increased demand for insulin by increasing their insulin secretion [21]. To investigate whether pancreatic β-cells were responsible for the observed phenotype, we performed ex vivo studies in isolated islets from WT and PICK1-deficient mice, and we investigated whether PICK1-deficient mice were able to resist further deterioration of their glucose tolerance by compensating through improved β-cell function. Glucolipotoxicity refers to the combined deleterious effects of elevated glucose and fatty acid levels, which induce β-cell dysfunction [22]. We used GLT conditions to mimic HFD, and measured glucose-stimulated insulin secretion after exposure to vehicle or GLT conditions, resembling chow and HFD, respectively. Under vehicle conditions, PICK1-deficient islets secreted significantly less insulin following high glucose stimulation (Fig. 4G), whereas there was no difference between insulin secretion of WT and PICK1-deficient islets following GLT conditions (Fig. 4H), resembling our findings from the in vivo chow and HFD studies (Fig. 4A and 4B).
β-Cell–Specific PICK1-KO
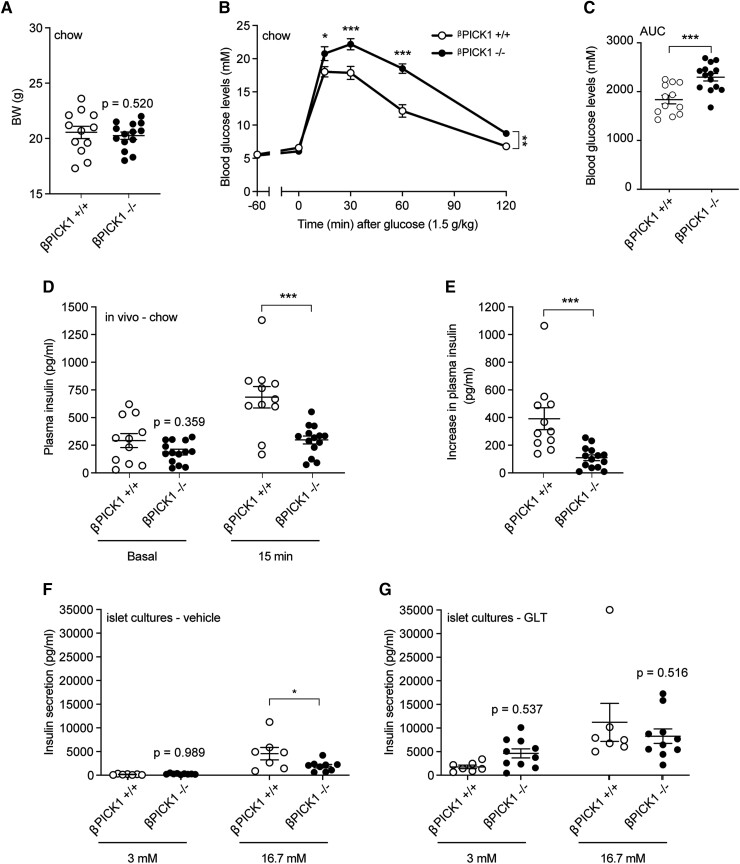
To probe a possible compensatory role of the pancreatic β-cells, we generated a β-cell–specific PICK1-KO mouse (referred to as βPICK1-KO from here on). Confinement of PICK1-deficiency to the β-cells resulted in a BW similar to WT mice when fed normal chow (Fig. 5A). Glucose tolerance and insulin secretion of βPICK1-KO mice, however, was strongly impaired (Fig. 5B-5E), similar to our previous findings from the global PICK1-deficient mice [5]. When we isolated islets and measured glucose-stimulated insulin secretion, islets from the βPICK1-KO mice had significantly lower insulin secretion demonstrating a direct effect of PICK1 on insulin granules in β-cells (Fig. 5F) in agreement with previous findings [10]. Following GLT challenge ex vivo, the βPICK1-KO islets seemed able to maintain their secretory capacity showing no significant change from WT islets (Fig. 5G). A similar pattern was observed when measuring content of both proinsulin and insulin (Figure 4A-B [17]).
Figure 5.
βPICK1-KO mice in vivo and ex vivo display decreased insulin secretion during normal conditions. βPICK1-KO and WT mice were kept on chow diet and (A) BW measured following 21 weeks (n ≥ 11). (B) OGTT was carried out in fasted mice and (C) during the OGTT insulin was measured −60 (basal) minutes and at 15 minutes. (D) The difference from (C) in plasma insulin from −60 minutes to 15 minutes. (E, F) Glucose-stimulated insulin secretion was conducted on islets isolated from βPICK1 KO and WT mice and treated with vehicle or GLT, respectively. Data are shown as dot plot with mean ± SEM (n ≥ 6). Statistical significance was determined using 2-way ANOVA with Sidak's multiple comparisons test or unpaired t test. *P < .05, ***P < .001.
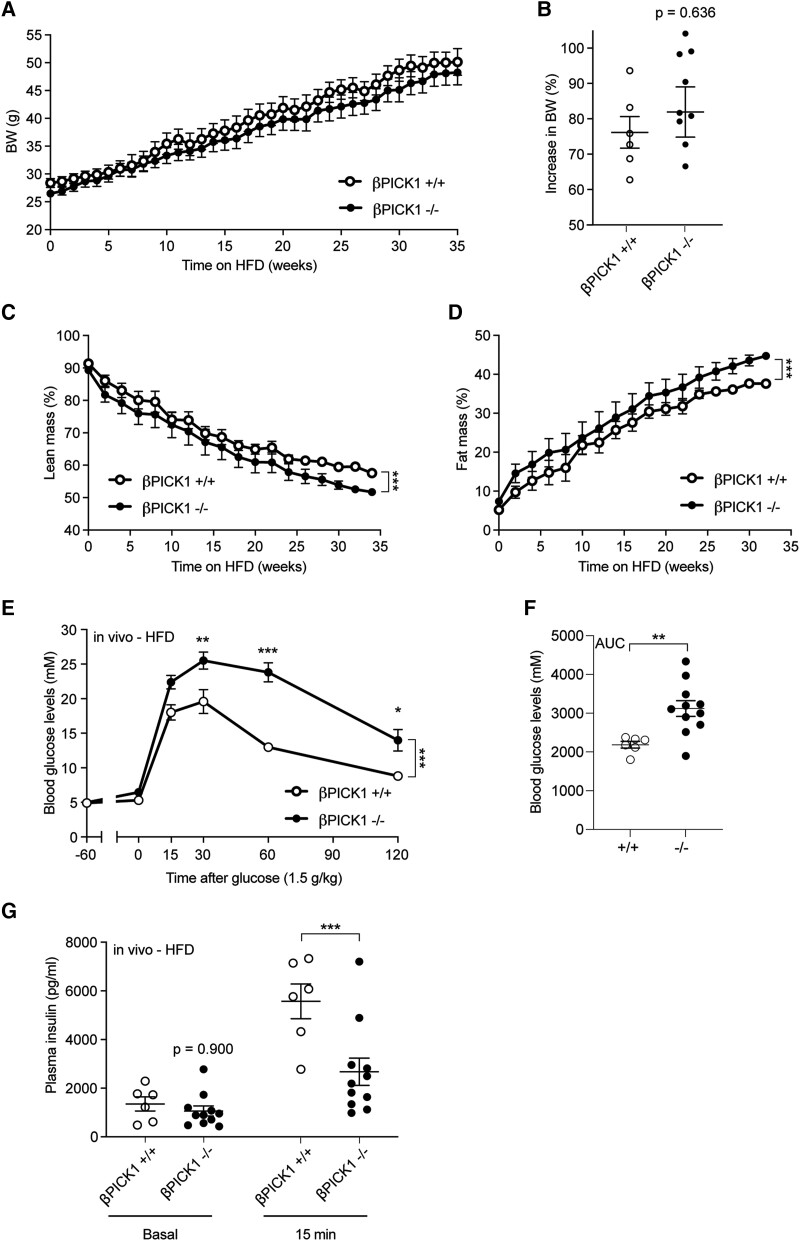
When challenged with HFD in vivo, βPICK1-KO mice displayed similar weight gain to WT mice (Fig. 6A and 6B), and a slightly different body composition throughout the diet intervention (Fig. 6C and 6D and Figure 5A-B [17]). Remarkably, glucose tolerance of βPICK1-KO mice was further impaired as opposed to the resistance observed for the global PICK1-deficient mice (Fig. 6E). Furthermore, unlike the global PICK1-deficient mice, glucose-induced insulin secretion of the βPICK1-KO mice remained significantly decreased when on HFD (Fig. 6F) compared with WT mice. Thus, the global PICK1-deficient mice were able to maintain their insulin secretion during HFD, reaching similar level of plasma insulin as WT mice (Fig. 4B). In contrast, the βPICK1-KO mice failed to increase plasma insulin to the same level as obtained in the WT mice (Fig. 6F), leading to impaired glucose tolerance. Together these findings suggest that resistance to HFD observed in the global PICK1-deficient mice is dependent on peripheral tissues rather than from improved islet function.
Figure 6.
βPICK1-KO mice show impaired insulin secretion during HFD. (A) BW of βPICK1-KO and WT mice following 35 weeks of HFD (n ≥ 6). (B) Total increase in BW (%) following 35 weeks on HFD (n ≥ 6). (C, D) Fat and lean mass are shown as the percentage of total BW. (E) The OGTT was carried out in fasted mice following HFD. (F) During OGTT insulin was measured −60 (basal) minutes and after 15 minutes. Data are shown as mean ± SEM. Statistical significance was determined using 2-way ANOVA with Sidak's multiple comparisons test. *P < .05, ***P < .001.
Adipose Tissue
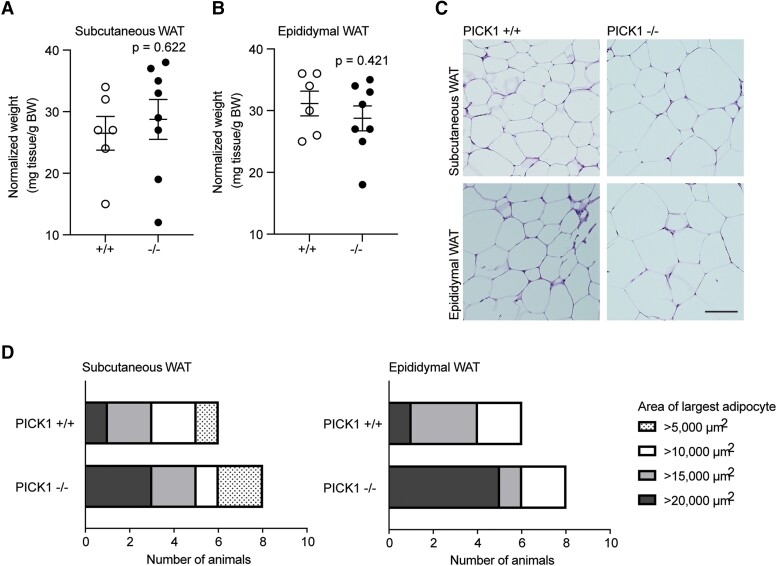
To address the putative protective effect observed in the global PICK1-deficient mice compared with the βPICK1-KO mice during metabolic stress conditions such as HFD, we next studied WAT. Fat-specific differences, such as in relation to insulin sensitivity, are well characterized [23, 24] and we examined selected depots of adipose tissue from the global PICK1-deficient mice. There was no difference between WT and PICK1-deficient mice in weight of the subcutaneous (inguinal) or epididymal WAT (Fig. 7A and 7B; Figure 6A-B [17]). Morphologically, the adipocytes of PICK1-deficient mice resembled those of WT mice (Fig. 7C), albeit they exhibited a skewed size distribution with a tendency toward a higher percentage of enlarged adipocytes of both subcutaneous and epididymal fat (Figure 6C-D [17]). Thus, when looking at the maximum adipocyte area from each animal, a larger fraction of PICK1-deficient mice reached maximum adipocyte areas of >20 000 µm2 compared with WT mice (Fig. 7D). We also assessed the level of fibrosis in the subcutaneous and epididymal WAT (Figure 6E [17]), as increased fibrosis is associated with metabolic stress and adipose tissue dysfunction [24, 25], but there was no difference between WT and PICK1-deficient mice (Figure 6F-G [17]).
Figure 7.
Global PICK1-deficient mice on HFD show an increase in the largest area of adipocytes. Adipose tissue was isolated from WT and PICK1-deficient mice following 18 weeks on HFD (n ≥ 6). (A) Relative weight of subcutaneous WAT (inguinal) and (B) epididymal (visceral) WAT compared with total BW. Statistical significance was determined with unpaired t-test. (C) Representative images of hematoxylin and eosin–stained subcutaneous and epidydimal adipose tissue section, scale bar = 100 μm. (D) The fraction of the largest adipocyte from subcutaneous and epididymal per mouse in μm2, respectively.
Insulin Signaling in Skeletal Muscle
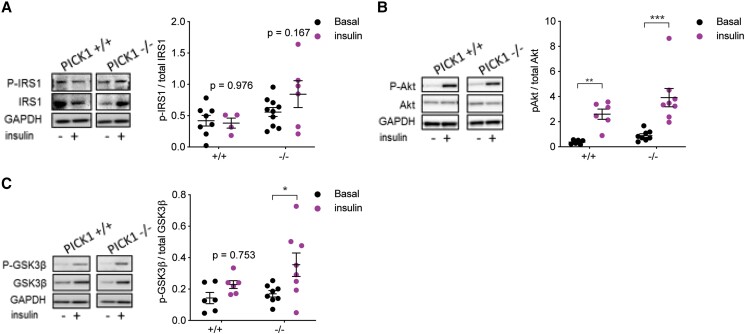
We have previously shown that chow-fed PICK1-deficient mice exhibit improved insulin sensitivity [5]. To further investigate the effect of HFD on insulin-sensitive tissue, and since skeletal muscle are essential for glucose homeostasis, we assessed the activity of proteins belonging to the insulin signaling pathway by Western blot analysis in the extensor digitorum longus muscle after insulin stimulation. There was no difference in the abundance of the phosphorylated IRS1 substrates in PICK1-deficient mice compared with the basal condition, and the same pattern was observed for WT mice (Fig. 8A and 8C). However, the PICK1-deficient mice displayed more prominent phosphorylation of the downstream proteins Akt and GSK3β during insulin stimulation compared with the basal condition (Fig. 8B and 8C). To address whether increased phosphorylation from the downstream signaling pathway in skeletal muscles in the PICK1-deficient mice could influence the overall glucose metabolism, we assessed the global insulin sensitivity by ITT following 17 weeks of HFD in PICK1-deficient mice (Figure 7 [17]). The PICK1-deficient mice show no change in glucose uptake compared with WT mice (Figure 7A [17]); however, comparing the blood glucose level relative to baseline at time point 0 hours showed a tendency for increased glucose uptake compared with WT mice (Figure 7B-C [17]), though not as prominent as observed in PICK1-deficient mice on chow diet [5].
Figure 8.
Global PICK1-deficient mice on HFD display increased activity in the insulin signaling pathway. Skeletal extensor digitorium longus muscles from WT and PICK1-deficient mice following 18 weeks on HFD were incubated under basal condition or stimulated with insulin for 30 minutes. (n ≥ 6). Western blotting analysis was performed for (A) phosphorylated IRS-1, (B) phosphorylated Akt, and (C) phosphorylated GSK3β. The phosphorylated level was normalized to total amount of unphosphorylated protein. Data are shown as dot plot with mean ± SEM. Statistical significance was determined using 2-way ANOVA with Sidak's multiple comparisons. *P < .05, **P < .01, ***P < .001.
Discussion
Insulin deficiency is a well-established phenotypical trait of global PICK1-deficient mice, associated with defect formation and maturation of insulin granules [5, 6]. In this study, we show that PICK1 deficiency restricted to pancreatic β-cells is sufficient to cause reduced insulin secretion both in vivo and ex vivo. These findings are in accordance with Li et al, showing that mice with conditional knockout of PICK1 in pancreatic β-cells are severely insulin deficient [10]. We further show that when challenging global, but not β-cell–specific PICK1-deficient, mice with HFD, this phenotypical trait of reduced insulin secretion is blunted, suggesting a resistance to metabolic deterioration typically observed by HFD. Challenge with HFD causes the islets to augment their insulin secretion by undergoing hypertrophy or hyperplasia, as also observed during pregnancy [20]. However, following HFD, the difference in β-cell mass observed in chow-fed PICK1-deficient mice [6] was blunted, suggesting that global PICK1-deficient mice are somehow able to improve or maintain the efficacy of their already existing β-cells. Interestingly, although we found that isolated islets from global PICK1-deficient and βPICK1-KO mice were capable of maintaining insulin secretion at the same level as WT following GLT conditions, only mice with global KO of PICK1 were able to resist further deterioration of their glucose tolerance during HFD. Though surprising, this suggests that other tissues or cells are important for glucose homeostasis and for protection against metabolic dysregulation.
Obesity is defined as abnormal or excessive accumulation of adipose tissue (World Health Organization fact sheet, https://www.who.int/news-room/fact-sheets/detail/obesity-and-overweight, October 2, 2022). Although PICK1 is not expressed in adipose tissue [6], PICK1 deficiency can exert effects indirectly through its function in tissues such as the brain and/or pancreas. There are well-characterized fat depot–specific differences of adipose tissue [23], suggesting that accumulation of visceral fat is associated with increased risk of developing metabolic disease and increased mortality, whereas subcutaneous fat is believed to be of minor importance [26, 27]. The function of adipose tissue is subject to intricate regulation by GH, IGF-1, and insulin [28, 29], and since PICK1-deficient mice are also characterized by deficiency in GH, other factors may play a role for glucose homeostasis. The GH receptor antagonist transgenic mouse, which has impaired GH action, is equally as susceptible to weight gain following HFD as WT mice, while being resistant to the associated harmful effects on their glucose homeostasis [30]. Furthermore, male GH receptor −/− mice maintain glucose levels compared with WT mice following HFD [31]. Hence, PICK1-deficient mice display several phenotypical characteristics similar to that of both the GH receptor antagonist and GH receptor −/− deficient mice [13, 14, 32, 33], in other words, increased body fat accumulation and improved insulin sensitivity on chow diet [5]; it is therefore likely that the way by which global PICK1-deficient mice resist HFD-induced dysmetabolism is via PICK1's effect on GH signaling.
GH-deficient mice display enhanced adipocyte size compared with WT mice, which has been shown to protect against the harmful effects associated with diet-induced obesity; thereby they resist glucose intolerance despite becoming obese [30]. Conversely, mice with overexpression of GH are insulin resistant with small adipocytes due to fibrotic accumulation that prevents adaptation to increased fat load [24]. Consequently, we looked at the size distribution of subcutaneous and visceral WAT; however, there was no statistical difference between WT and PICK1-deficient mice, although adipocytes of PICK1-deficient mice seemed to reach a larger maximum size than WT mice. This is in accordance with GH-deficient mice having enlarged adipocytes, presumably due to limited fibrotic constrain of adipocyte growth [34].
To investigate whether resistance to deterioration could be caused by other peripheral tissues, we looked at the skeletal muscles, as they are the major site for insulin-mediated glucose uptake [35]. Consequently, reduced insulin sensitivity in the skeletal muscles has a huge impact on hyperglycemia and insulin resistance. We have previously observed improved insulin sensitivity in chow-fed global PICK1-deficient mice [5], but it is less pronounced following HFD, though we observed higher activity in skeletal muscles stimulated with insulin. We detected increased phosphorylation in downstream targets such as Akt and GSK3β. Phosphorylated Akt promotes surface expression of glucose transporter 4 [36]. Furthermore, phosphorylated Akt inhibits activity of GSK3β by phosphorylation, leading to increased activity of glycogen synthase, a key regulator of glycogen synthesis in muscle tissue [37]. These findings suggest increased insulin sensitivity in the skeletal muscles, which could contribute to the overall resistance to HFD of PICK1-deficient mice.
While on chow diet, PICK1-deficient mice showed reduced pituitary GH, insulin and prolactin content, and plasma IGF-1 compared with WT mice [5]. However, when fed HFD, PICK1-deficient mice displayed a shift toward no change in plasma IGF-1 and increase in TSH content, while GH and insulin content remained reduced compared with WT mice. The trend toward changes in the hypothalamic–pituitary–adrenal axis in PICK1-deficient mice following a HFD may interfere with metabolic homeostasis. IGF-1 is central to several metabolic functions, and mice overexpressing IGF-1 display improved glucose tolerance and insulin sensitivity [38]. Thus, the change in IGF-1 could counterbalance the reduced GH content effect, such as on WAT distribution.
TSH secreted from the anterior pituitary stimulates the thyroid gland for secretion of thyroid hormones (T3 and T4), generating a negative feedback loop. Interestingly, thyroid hormones have been shown to metabolically regulate WAT and have orexigenic effects on appetite [39, 40]. Thus, the complexity of several hormones being reduced or dysregulated because of PICK1 deficiency is difficult to untangle, and there might be compensatory mechanisms across various tissues/cell types that can promote distinct molecular adaptations leading to the protective effects observed during diet-induced obesity. Though it is beyond the scope of this study, it would be of interest to study KO of PICK1 centrally and peripherally to understand the metabolic mechanisms, and how it comes into play during normal chow diet and during stressful conditions such as diet-induced obesity and STZ administration.
In summary, we investigated how PICK1-deficient mice respond to metabolic challenges associated with HFD. Interestingly, global PICK1-deficient mice seem to resist further deterioration of their glucose tolerance during HFD and STZ administration compared with WT mice. These surprising findings suggest that the glucose intolerance of chow-fed PICK1 deficiency in mice might be an advantage when the mice are challenged by diet-induced obesity. However, the ability to resist further impairment of glucose tolerance was not observed in βPICK1-KO mice, suggesting an important contribution from other tissues such as skeletal muscle or adipose tissue.
Acknowledgments
We thank Anette Bjerregaard for her technical assistance.
Abbreviations
- ANOVA
analysis of variance
- AUC
area under the curve
- BAR
Bin/amphiphysin/Rvs
- BW
body weight
- GH
growth hormone
- GLT
glucolipotoxic
- GSK3β
glycogen synthase kinase 3-β
- HFD
high-fat diet
- IGF
insulin-like growth factor
- IRS1
insulin receptor substrate 1
- ITT
insulin tolerance test
- KO
knockout
- OGTT
oral glucose tolerance test
- PICK1
protein interacting with C kinase 1
- RT-qPCR
quantitative real-time PCR
- STZ
streptozotocin
- TSH
thyroid-stimulating hormone
- WAT
white adipose tissue
- WT
wild type
Contributor Information
Marie Balslev Backe, Email: marie.balslev.backe@regionh.dk, Department of Biomedical Sciences, Faculty of Health and Medical Sciences, University of Copenhagen, 2200 Copenhagen, Denmark; Department of Clinical Epidemiology, Steno Diabetes Center Copenhagen, 2730 Herlev, Denmark.
Rita Chan Andersen, Molecular Neuropharmacology and Genetics Laboratory, Department of Neuroscience, Faculty of Health and Medical Sciences, University of Copenhagen, 2200 Copenhagen, Denmark.
Morten Jensen, Department of Biomedical Sciences, Faculty of Health and Medical Sciences, University of Copenhagen, 2200 Copenhagen, Denmark.
Chunyu Jin, Department of Biomedical Sciences, Faculty of Health and Medical Sciences, University of Copenhagen, 2200 Copenhagen, Denmark.
Cecilie Hundahl, Department of Biomedical Sciences, Faculty of Health and Medical Sciences, University of Copenhagen, 2200 Copenhagen, Denmark.
Oksana Dmytriyeva, Novo Nordisk Foundation Center for Basic Metabolic Research, Faculty of Health and Medical Sciences, University of Copenhagen, 2200 Copenhagen, Denmark.
Jonas T Treebak, Novo Nordisk Foundation Center for Basic Metabolic Research, Faculty of Health and Medical Sciences, University of Copenhagen, 2200 Copenhagen, Denmark.
Jakob Bondo Hansen, Novo Nordisk Foundation Center for Basic Metabolic Research, Faculty of Health and Medical Sciences, University of Copenhagen, 2200 Copenhagen, Denmark.
Zach Gerhart-Hines, Novo Nordisk Foundation Center for Basic Metabolic Research, Faculty of Health and Medical Sciences, University of Copenhagen, 2200 Copenhagen, Denmark.
Kenneth L Madsen, Molecular Neuropharmacology and Genetics Laboratory, Department of Neuroscience, Faculty of Health and Medical Sciences, University of Copenhagen, 2200 Copenhagen, Denmark.
Birgitte Holst, Email: holst@sund.ku.dk, Department of Biomedical Sciences, Faculty of Health and Medical Sciences, University of Copenhagen, 2200 Copenhagen, Denmark.
Funding
M.B.B., R.C.A., M.J., C.J., C.H., O.D., J.T.T., J.B.H., Z.G.H., K.L.M., and B.H. were supported by the Novo Nordisk Foundation Center for Basic Metabolic Research (CBMR). CBMR is an independent Research Center at the University of Copenhagen partially funded by an unrestricted donation from the Novo Nordisk Foundation (NNF18CC0034900).
Author Contributions
In vivo work was conducted by M.J., C.H., M.B.B., and C.J., while ex vivo work was performed by M.B.B., R.C.A., O.D., J.T.T., and J.B.H. Cellular experiments were conducted by M.B.B. and R.C.A. Data analyses were accomplished by M.B.B., R.C.A., C.J., M.J., K.L.M., J.T.T., and B.H. Design of experiments was performed by M.B.B., R.C.A., C.J., M.J., C.H., J.B.H., Z.G., K.L.M., and B.H. The manuscript was written by M.B.B., R.C.A., and B.H. All authors read and approved the final version of the manuscript.
Disclosures
The author reports no conflicts of interest in this work.
Data Availability
Original data generated and analyzed during this study are included in this published article or in the data repositories listed in the references.
References
- 1. Noubiap JJ, Nansseu JR, Lontchi-Yimagou E, et al. Global, regional, and country estimates of metabolic syndrome burden in children and adolescents in 2020: a systematic review and modelling analysis. Lancet Child Adolesc Health. 2022;6(3):158‐170. [DOI] [PubMed] [Google Scholar]
- 2. Kelly T, Yang W, Chen CS, Reynolds K, He J. Global burden of obesity in 2005 and projections to 2030. Int J Obes (Lond). 2008;32(9):1431‐1437. [DOI] [PubMed] [Google Scholar]
- 3. World Obesity Federation . World Obesity Atlas. March 2022. https://www.worldobesity.org/resources/resource-library/world-obesity-atlas-2022
- 4. Lustig RH, Collier D, Kassotis C, et al. Obesity I: overview and molecular and biochemical mechanisms. Biochem Pharmacol. 2022;199:115012. [DOI] [PMC free article] [PubMed] [Google Scholar]
- 5. Holst B, Madsen KL, Jansen AM, et al. PICK1 Deficiency impairs secretory vesicle biogenesis and leads to growth retardation and decreased glucose tolerance. PLoS Biol. 2013;11(4):e1001542. [DOI] [PMC free article] [PubMed] [Google Scholar]
- 6. Cao M, Mao Z, Kam C, et al. PICK1 and ICA69 control insulin granule trafficking and their deficiencies lead to impaired glucose tolerance. PLoS Biol. 2013;11(4):e1001541. [DOI] [PMC free article] [PubMed] [Google Scholar]
- 7. Cao M, Xu J, Shen C, Kam C, Huganir RL, Xia J. PICK1-ICA69 heteromeric BAR domain complex regulates synaptic targeting and surface expression of AMPA receptors. J Neurosci. 2007;27(47):12945‐12956. [DOI] [PMC free article] [PubMed] [Google Scholar]
- 8. Herlo R, Lund VK, Lycas MD, et al. An amphipathic Helix directs cellular membrane curvature sensing and function of the BAR domain protein PICK1. Cell Rep. 2018;23(7):2056‐2069. [DOI] [PubMed] [Google Scholar]
- 9. Andersen RC, Schmidt JH, Rombach J, et al. Coding variants identified in patients with diabetes alter PICK1 BAR domain function in insulin granule biogenesis. J Clin Invest. 2022;132(5):e144904. [DOI] [PMC free article] [PubMed] [Google Scholar]
- 10. Li J, Mao Z, Huang J, Xia J. PICK1 Is essential for insulin production and the maintenance of glucose homeostasis. Mol Biol Cell. 2018;29(5):587‐596. [DOI] [PMC free article] [PubMed] [Google Scholar]
- 11. Gardner SM, Takamiya K, Xia J, et al. Calcium-permeable AMPA receptor plasticity is mediated by subunit-specific interactions with PICK1 and NSF. Neuron. 2005;45(6):903‐915. [DOI] [PubMed] [Google Scholar]
- 12. Postic C, Shiota M, Niswender KD, et al. Dual roles for glucokinase in glucose homeostasis as determined by liver and pancreatic beta cell-specific gene knock-outs using Cre recombinase. J Biol Chem. 1999;274(1):305‐315. [DOI] [PubMed] [Google Scholar]
- 13. Dominici FP, Hauck S, Argentino DP, Bartke A, Turyn D. Increased insulin sensitivity and upregulation of insulin receptor, insulin receptor substrate (IRS)-1 and IRS-2 in liver of Ames dwarf mice. J Endocrinol. 2002;173(1):81‐94. [DOI] [PubMed] [Google Scholar]
- 14. Yakar S, Setser J, Zhao H, et al. Inhibition of growth hormone action improves insulin sensitivity in liver IGF-1-deficient mice. J Clin Invest. 2004;113(1):96‐105. [DOI] [PMC free article] [PubMed] [Google Scholar]
- 15. Backe MB, Jin C, Andreone L, et al. The lysine demethylase KDM5B regulates islet function and glucose homeostasis. J Diabetes Res. 2019;2019:5451038. [DOI] [PMC free article] [PubMed] [Google Scholar]
- 16. Treebak JT, Birk JB, Hansen BF, Olsen GS, Wojtaszewski JF. A-769662 activates AMPK beta1-containing complexes but induces glucose uptake through a PI3-kinase-dependent pathway in mouse skeletal muscle. Am J Physiol Cell Physiol. 2009;297(4):C1041‐C1052. [DOI] [PubMed] [Google Scholar]
- 17. Backe MB, Andersen RC, Jensen M, et al. Supplementary data for: PICK1-deficient mice maintain their glucose tolerance during diet-induced obesity. Mendeley Data, v1. Deposited April 4, 2023. [DOI] [PMC free article] [PubMed]
- 18. Leiter EH. Multiple low-dose streptozotocin-induced hyperglycemia and insulitis in C57BL mice: influence of inbred background, sex, and thymus. Proc Natl Acad Sci U S A. 1982;79(2):630‐634. [DOI] [PMC free article] [PubMed] [Google Scholar]
- 19. Hansen JB, Tonnesen MF, Madsen AN, et al. Divalent metal transporter 1 regulates iron-mediated ROS and pancreatic beta cell fate in response to cytokines. Cell Metab. 2012;16(4):449‐461. [DOI] [PubMed] [Google Scholar]
- 20. Weir GC, Bonner-Weir S. Islet beta cell mass in diabetes and how it relates to function, birth, and death. Ann N Y Acad Sci. 2013;1281(1):92‐105. [DOI] [PMC free article] [PubMed] [Google Scholar]
- 21. Ashcroft FM, Rorsman P. Diabetes mellitus and the beta cell: the last ten years. Cell. 2012;148(6):1160‐1171. [DOI] [PMC free article] [PubMed] [Google Scholar]
- 22. Hansen JB, Dos Santos LRB, Liu Y, et al. Glucolipotoxic conditions induce beta-cell iron import, cytosolic ROS formation and apoptosis. J Mol Endocrinol. 2018;61(2):69‐77. [DOI] [PubMed] [Google Scholar]
- 23. Tchkonia T, Thomou T, Zhu Y, et al. Mechanisms and metabolic implications of regional differences among fat depots. Cell Metab. 2013;17(5):644‐656. [DOI] [PMC free article] [PubMed] [Google Scholar]
- 24. Householder LA, Comisford R, Duran-Ortiz S, et al. Increased fibrosis: A novel means by which GH influences white adipose tissue function. Growth Horm IGF Res. 2018;39:45‐53. [DOI] [PMC free article] [PubMed] [Google Scholar]
- 25. Sun K, Tordjman J, Clement K, Scherer PE. Fibrosis and adipose tissue dysfunction. Cell Metab. 2013;18(4):470‐477. [DOI] [PMC free article] [PubMed] [Google Scholar]
- 26. Kwon H, Kim D, Kim JS. Body fat distribution and the risk of incident metabolic syndrome: A longitudinal cohort study. Sci Rep. 2017;7(1):10955. [DOI] [PMC free article] [PubMed] [Google Scholar]
- 27. Koh HE, van Vliet S, Pietka TA, et al. Subcutaneous adipose tissue metabolic function and insulin sensitivity in people with obesity. Diabetes. 2021;70(10):2225‐2236. [DOI] [PMC free article] [PubMed] [Google Scholar]
- 28. Berryman DE, List EO, Sackmann-Sala L, Lubbers E, Munn R, Kopchick JJ. Growth hormone and adipose tissue: beyond the adipocyte. Growth Horm IGF Res. 2011;21(3):113‐123. [DOI] [PMC free article] [PubMed] [Google Scholar]
- 29. Hjortebjerg R, Berryman DE, Comisford R, et al. Insulin, IGF-1, and GH receptors are altered in an adipose tissue depot-specific manner in male mice with modified GH action. Endocrinology. 2017;158(5):1406‐1418. [DOI] [PMC free article] [PubMed] [Google Scholar]
- 30. Yang T, Householder LA, Lubbers ER, et al. Growth hormone receptor antagonist transgenic mice are protected from hyperinsulinemia and glucose intolerance despite obesity when placed on a HF diet. Endocrinology. 2015;156(2):555‐564. [DOI] [PMC free article] [PubMed] [Google Scholar]
- 31. Berryman DE, List EO, Kohn DT, Coschigano KT, Seeley RJ, Kopchick JJ. Effect of growth hormone on susceptibility to diet-induced obesity. Endocrinology. 2006;147(6):2801‐2808. [DOI] [PubMed] [Google Scholar]
- 32. Sornson MW, Wu W, Dasen JS, et al. Pituitary lineage determination by the prophet of pit-1 homeodomain factor defective in Ames dwarfism. Nature. 1996;384(6607):327‐333. [DOI] [PubMed] [Google Scholar]
- 33. Winzell MS, Ahren B. The high-fat diet-fed mouse: a model for studying mechanisms and treatment of impaired glucose tolerance and type 2 diabetes. Diabetes. 2004;53(Suppl 3):S215‐S219. [DOI] [PubMed] [Google Scholar]
- 34. List EO, Berryman DE, Buchman M, et al. GH Knockout mice have increased subcutaneous adipose tissue with decreased fibrosis and enhanced insulin sensitivity. Endocrinology. 2019;160(7):1743‐1756. [DOI] [PMC free article] [PubMed] [Google Scholar]
- 35. DeFronzo RA, Tripathy D. Skeletal muscle insulin resistance is the primary defect in type 2 diabetes. Diabetes Care. 2009;32(Suppl 2):S157‐S163. [DOI] [PMC free article] [PubMed] [Google Scholar]
- 36. Jaldin-Fincati JR, Pavarotti M, Frendo-Cumbo S, Bilan PJ, Klip A. Update on GLUT4 vesicle traffic: a cornerstone of insulin action. Trends Endocrinol Metab. 2017;28(8):597‐611. [DOI] [PubMed] [Google Scholar]
- 37. Sylow L, Tokarz VL, Richter EA, Klip A. The many actions of insulin in skeletal muscle, the paramount tissue determining glycemia. Cell Metab. 2021;33(4):758‐780. [DOI] [PubMed] [Google Scholar]
- 38. Hong H, Cui ZZ, Zhu L, et al. Central IGF1 improves glucose tolerance and insulin sensitivity in mice. Nutr Diabetes. 2017;7(12):2. [DOI] [PMC free article] [PubMed] [Google Scholar]
- 39. Brent GA. Mechanisms of thyroid hormone action. J Clin Invest. 2012;122(9):3035‐3043. [DOI] [PMC free article] [PubMed] [Google Scholar]
- 40. Mullur R, Liu YY, Brent GA. Thyroid hormone regulation of metabolism. Physiol Rev. 2014;94(2):355‐382. [DOI] [PMC free article] [PubMed] [Google Scholar]
Associated Data
This section collects any data citations, data availability statements, or supplementary materials included in this article.
Data Availability Statement
Original data generated and analyzed during this study are included in this published article or in the data repositories listed in the references.


