

Abstract
Motivation:
Today, we know the function of only a small fraction of all known protein sequences identified. This problem is even more salient in bacteria as human-centric studies are prioritized in the field and there is much to uncover in the bacterial genetic repertoire. Conventional approaches to bacterial gene annotation are especially inadequate for annotating previously unseen proteins in novel species since there are no proteins with similar sequence in the existing databases. Thus, we need alternative representations of proteins. Recently, there has been an uptick in interest in adopting natural language processing methods to solve challenging bioinformatics tasks; in particular using transformer-based language models to represent proteins has proven successful in tackling various challenges. However, there are still limited applications of such representations in bacteria.
Results:
We developed SAP, a novel synteny-aware gene function prediction tool based on protein embeddings, to annotate bacterial species. SAP distinguishes itself from existing methods for annotating bacteria in two ways: (i) it uses embedding vectors extracted from state-of-the-art protein language models and (ii) it incorporates conserved synteny across the entire bacterial kingdom using a novel operon-based approach proposed in our work. SAP outperformed conventional annotation methods on a range of representative bacteria, for various gene prediction tasks including distant homolog detection where the sequence similarity between training and test proteins was 40% at its lowest. SAP also achieved annotation coverage on par with conventional structure-based predictors in a real-life application on Enterococcus genes of unknown function.
1. Introduction
Proteins are the fundamental functioning units of all living life: ranging from providing structural support, and catalyzing reactions to regulating processes. Despite their importance, we know the function of only a small fraction of all the proteins identified. With the increasing amount of genetic data available due to development of next generation high-throughput sequencing technologies, there is an even greater need to uncover the function of biological sequences. It is very costly to determine gene function experimentally and manually annotate proteins; hence many people resort to computational approaches instead. Unfortunately, our understanding of protein function has not been able to keep up with the advances in DNA sequencing technology.
The Gene Ontology (GO) knowledgebase, was developed to describe the function of biological sequences for both practical uses as well as computational applications (Ashburner et al., 2000). The ontology itself is a hierarchical representation of protein function in three categories: Biological Process Ontology (BPO), Molecular Function Ontology (MFO) and Cellular Component Ontology (CCO). Thus, understanding protein function becomes a computational task: to figure out which of these GO terms can be assigned to a protein sequence.
Conventional approaches to predicting protein function rely on sequence homology; it is assumed that proteins with similar sequences should also have similar functions. Initial methods employed sequence search tools such as BLAST or DIAMOND to query a database of known protein sequences and their functions (Altschul et al., 1990; Buchfink et al., 2021). The major downside is that these methods are limited by their databases; there could be annotation errors, and it is often difficult to determine a proper threshold to transfer protein function, resulting in low sensitivity and specificity (Zhou et al., 2019).
The increased amount of data available has allowed researchers to explore data-driven, machine learning techniques. Initial work in function prediction used features derived from the sequence of interest in supervised machine learning models such as neural networks (NNs) and support vector machines (SVMs), or k-nearest neighbor (knn) algorithms (Jensen et al., 2003; Törönen et al., 2018). For instance, FFPred, one of the most popular methods, uses features such as the amino acid composition, localization information, molecular weight, charge etc. as input to predict gene function (Lobley et al., 2007).
More recently, deep learning gained increased attention in the field of gene function prediction. A promising line of work emerged when researchers started to employ ideas from natural language processing (NLP), in particular the use of word embeddings and language models, to protein function prediction by developing protein language models (pLM) (Heinzinger et al., 2019; Elnaggar et al., 2020; Rives et al., 2021). Analogous to the earlier models based on features calculated from sequence data, word embeddings construct feature vectors of protein sequences. These feature vectors can then be used as input to various machine learning models to predict GO terms. Contextualized word embeddings have already been demonstrated to be successful for predicting GO terms as well as the structure and localization prediction, and refining protein family clusters (Elnaggar et al., 2020; Littmann et al., 2021a; van den Bent et al., 2021; Weißenow et al., 2022).
Despite the evident progress and the growing interest in using deep learning for function prediction, the field is still dominated by human-centric studies, or developments focusing on model species (Odrzywolek et al., 2022). The Critical Assessment of Functional Annotation (CAFA), established to evaluate the state-of-the-art in function prediction, has separate tracks for eukaryotic and prokaryotic species, and their prokaryotic track is heavily biased towards one model organism: E. coli (Zhou et al., 2019). Their benchmarks have also revealed that performance in the prokaryotic track is consistently worse than the eukaryotic counterpart. We presume that we have much to uncover in the bacterial generic repertoire by not only discovering novel genes but also developing new techniques to advance gene function prediction in bacterial genomes. Compared to eukaryotes and the human genome in particular, remote homology detection, i.e. predicting gene function in the absence of known proteins with sequence homology, is a larger issue in the bacterial kingdom due to genetic diversity.
By definition, predicting gene function is the same problem regardless of the organism. However, there are certain characteristics unique to bacterial genomes. An example of a such trait that plays a central role in our work is the idea of an operon, where a group of genes is co-localized on the same strand within the same contig, and this particular collection of genes as well as their order are preserved since they function in the same metabolic pathway, and they are co-regulated and co-transcribed. These conserved neighborhoods of genes, if they are used properly, can provide valuable information to infer the function of constituent genes. We hypothesize that contribution from conserved synteny is orthogonal to both the amino-acid sequence and the embeddings-based representation of a gene, especially in the biological process GO category which includes pathways, and it is the ontology least correlated with the protein sequence.
In this work, we develop SAP, a novel synteny-aware approach to bacterial gene function prediction based on protein embeddings. SAP has two notable features that, to our knowledge, render it unique among the existing tools for annotating bacteria: (i) it uses embedding vectors extracted from state-of-the-art protein language models and (ii) it incorporates conserved synteny across the entire bacterial kingdom by making use of the bacterial operon database we built based on a purely computational, bottom-up approach.
We designed two different experiments to evaluate SAP: the first experiment is based on the SwissProt database and makes use of experimentally determined ground truth labels to make robust, quantitative assessments. Whereas in the second experiment, we used a set of unlabeled Enterococcus genes and we compared SAP’s performance qualitatively against conventional bacterial genome annotation tools. We demonstrate that conserved synteny and protein embeddings both provide useful information for predicting the protein function; SAP outperforms conventional sequence-based bacterial genome annotation pipelines and its performance is on par with structure-based approaches.
2. Materials and methods
2.1. SwissProt data set
To build the experiments, we retrieved all the manually reviewed entries from the SwissProt Database (release 2021-04, retrieval date 10 November 2021) (The UniProt Consortium, 2018), which was filtered down to include proteins of sequence length [40,1000] and with at least one experimental GO annotation. We selected the evidence codes: EXP, IDA, IPI, IMP, IGI, IEP, HTP, HDA, HMP, HGI, HEP, IBA, IBD, IKR, IRD, IC, TAS. To reduce the redundancy, we clustered the proteins using CD-HIT (Li and Godzik, 2006) at 95% sequence similarity. The final dataset comprised 107,818 proteins in total.
To evaluate the performance of our method on bacterial gene function prediction, we created five separate train/test splits for the most represented bacterial organisms in our final dataset. For each organism, we created five additional training sets (subset of the largest training set) where the sequence similarity (calculated using BLASTp (Altschul et al., 1990)) of test proteins was at most 40%, 50%, 60%, 70% and 80% to the training proteins. In the end, we have 30 train/test splits. Table 1 shows the number of proteins in each train/test set pair we generated as subsets from the SwissProt dataset.
Table 1.
Total number of proteins in the train/test set pairs generated from the SwissProt dataset to evaluate function prediction tools on bacterial organisms. For each organism, the test set remains constant whereas the training set is restricted according to the maximum sequence similarity allowed.
| Organism name | Test set size | Training set size |
|||||
|---|---|---|---|---|---|---|---|
| 40 | 50 | 60 | 70 | 80 | Full | ||
| Escherichia coli (ET) | 3454 | 87014 | 96471 | 100445 | 102262 | 103229 | 104377 |
| Mycobacterium tuberculosis (MT) | 1666 | 95367 | 102531 | 105158 | 105917 | 106114 | 106152 |
| Bacillus subtilis (BS) | 1636 | 93363 | 101112 | 104325 | 105609 | 106015 | 106182 |
| Pseudomonas aeruginosa (PA) | 1014 | 94679 | 101338 | 104644 | 106186 | 106680 | 106804 |
| Salmonella typhimurium (ST) | 774 | 100928 | 104164 | 105384 | 105980 | 106340 | 107044 |
2.2. Unlabeled Enterococcus gene data set
While the SwissProt database is made up of protein sequences labeled with the ground truth, our final experiment was performed on a set of 4380 genes with no experimental annotations, extracted from four different Enterococcus species (E. moraviensis, E. hirae, E. gilvus, E. columbae), representing four Enterococcus clades present (Lebreton et al., 2017) (see Supplementary Table S1 for the assembly statistics and genome metadata). These genes were selected because they were labeled as hypothetical protein by prokka (v 1.14.6) (Seemann, 2014), i.e. they could not be annotated with the most commonly used bacterial gene annotation pipeline.
2.3. Building a bacterial operon database
In this work, we opted for a bottom-up, computational approach to build the most comprehensive bacterial operon database possible. We start at level of the gene, and move up within the constraints of our operon model to obtain a collection of bacterial operons of varying lengths, and sizes.
First, we downloaded the entire Genome Taxonomy Database (GTDB Release 202, retrieved on 31/03/2022) (Parks et al., 2021), which is a collection of all the bacterial representative genomes. The database contained 258,406 genomes in total, 45,555 of which were representative assemblies. We extracted all the protein sequences from the standardized annotations GTDB provides for these representative assemblies, and clustered them using CD-HIT (Li and Godzik, 2006) at 95% sequence identity with default parameters. CD-HIT output was filtered to keep only the clusters that contained at least 10 genes. This step resulted in 372,308 clusters of bacterial genes in total.
Next, we formed the initial operon database by grouping together clusters if at least one of the cluster members is located on the same contig and same strand within 2000 bp distance (subdiagram A. in Fig. 1). This yielded 1,488,249 such non-singleton candidate operons. As a final step, we iterated over the operons to either remove those with an intergenic distance larger than 300 bp, or split into multiple operons if possible (subdiagram B. in Fig. 1). We chose to restrict the intergenic distance within operons to 300 bp. The threshold values used when building our operon database, such as the maximum operon length in bp, number of genes in an operon, and maximum intergenic distance allowed, were determined based on our general expectations from a bacterial operon as well as experimentally determined operons collected in ODB (version 4) (Okuda and Yoshizawa, 2010).
Fig. 1:
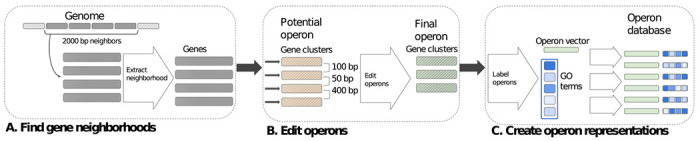
Schematic diagram of our operon building algorithm: striped rectangles are amino-acid sequences, and solid-filled rectangles are numerical embedding vectors. A. 2000 bp-long gene neighborhoods are extracted from all genomes, gray-filled, striped rectangles are genes represented by amino-acid sequences. B. We replace the genes with the clusters they belong to and their amino-acid sequences with those of the representative gene of each cluster (orange striped rectangles); hence forming a set of potential operons. Then, we iterate over the potential operons and edit them to ensure all the intergenic distances are below 300 bp (ex. the bottom orange gene cluster is removed). C. Once the final operon structures are determined, we extract numerical embedding vectors for all clusters and we create a new representation for each operon out of these vectors: this representation consists of the average embedding vector and a set of GO terms, paired with their corresponding frequency among the clusters that make up the operon (blue rectangles, different shades mean GO terms are found in different frequencies). The final operon database is a collection of such representative embedding vectors and GO term frequency vectors.
We downloaded both the known and conserved operon databases from ODB on 31/03/2022. We identified operons belonging to E. coli and B. subtillis, as (i) these two organisms form the basis of a large part of the experiments in this work, (ii) we could easily cross-reference the protein IDs in ODB to the locus tags in the respective genome assemblies and (iii) they are two of the most well-represented organisms in ODB. The conserved operon database contained 8235 unique operons in total, and we used this database to extract descriptive statistics and common patterns found across several operons conserved among bacterial organisms. The known operon database, on the other hand, was used to model features of operons within a genome, such as an operon length in bp and the intergenic distance between two adjacent genes in an operon. At the end of this procedure, our operon database consists of 406,293 unique non-singleton operons, and the largest operon is 25 genes long.
To summarize each operon, we extracted the protein embedding vectors for the representative protein sequence of clusters found in that operon, and we took the average of these embeddings (subdiagram C. in Fig. 1). Here, we used ESM-1b, a transformer-based protein language model developed by Rives et al., 2021, to extract the embeddings.
Then, we labeled the operons by assigning GO terms, if possible. Since there are no experimental annotations for the proteins that form the basis of our operon database, we labeled the operons based on sequence similarity. We used BLASTp (Altschul et al., 1990) to calculate pairwise sequence similarity to the entire dataset we have made for evaluating SAP, i.e. the non-redundant SwissProt database with experimentally determined GO terms (all 107,818 entries). We transferred GO terms found in significant hits using the frequency of each GO term among these hits as the predicted scores. In this step, a significant hit has an e-value less than 1e-6 and a bitscore greater than 50. With this approach, we could assign at least one GO term to 295,446 of the clusters (out of 372,308), which in turn yield 388,377 non-singleton operons (out of 406,293) annotated with at least one GO term.
In order to be consistent with our experimental set-up based on the SwissProt database, we restricted our operon database for the low-similarity experiments as well. We followed the same procedure as we did to generate subsets of the SwissProt training sets: we used BLAST to calculate the pairwise sequence identity of each query point to the protein clusters that form our main operon database. We removed clusters if they were more than 40%, 50%, 60%, 70%, 80% and 95% similar to at least one of the query points in the test set. Since this operation altered the content of operons (unless they were removed completely), we re-calculated the intergenic distance for the remaining clusters and we split the operons where the intergenic distance exceeded our threshold, 300 bp. This final step is exactly the same as we did when we created the main operon database (subdiagrams B and C. in Fig. 1).
2.4. Baseline gene function prediction methods
As the first baseline for gene function prediction, we picked a BLAST (v. 2.12.0) (Altschul et al., 1990) and an HMM-based approach. For the BLAST baseline, we transferred GO terms from significant BLAST hits (e-value < 1e-3) of a query protein with a predicted score of the maximum sequence identity. As an alternative, we also tried the GO term frequency-based approach suggested by (van den Bent et al., 2021) and (Zhou et al., 2019), but we found the maximum sequence identity to perform better in our experiments. We used the same training set for both the BLAST queries and the nearest neighbor predictors.
Our second baseline is an HMM-based approach. We ran HMMER (Eddy, 2011) against the Pfam database and we applied the frequency-based approach instead, i.e. we transferred GO terms from all significant hmm hits (e-value < 1e-3) to the query protein, using the frequency of a GO term (number of instances a term was observed among the significant hits) as the predicted score. To compare Pfam outputs quantitatively with the rest of the methods, we used the mapping tables provided by GO consortium to obtain GO terms corresponding to each Pfam ID (Ashburner et al., 2000). Since the Pfam database is independent of the train/test pairs we generated for our experiments, we report the same numerical results for all pairs.
2.5. Nearest neighbor predictor based on protein embeddings
For the nearest neighbor predictor, we chose the ProtT5-XL-U50 (T5 in short) (Elnaggar et al., 2020) and ESM-1b (ESM in short) (Rives et al., 2021) protein language models to represent protein sequences. To extract amino-acid level embedding vectors, we used bio_embeddings (v 0.2.2) (v 0.2.2) (Dallago et al., 2021) with default settings. Then, we obtained protein-level embeddings (1024 dimensional vectors for T5 and 1280 for ESM) by taking the average over individual aminoacid embeddings to obtain embedding representation vectors. Since in our preliminary experiments, we found that the embeddings extracted from the ESM model performed better, we use only the ESM model throughout this work as well.
The nearest neighbor predictor (named knn throughout this work) was designed in a similar manner to goPredSim (Littmann et al., 2021b). For each query protein, we find its nearest neighbors in the training set based on the similarity of their embedding vectors. The nearest neighbors of a query protein are defined as those with similarity larger than the threshold, which we calculate separately for each query as the xth percentile among all pairwise similarity values, where x parameter is set to 99 percentile. We transfer GO terms from the nearest neighbors with a score equal to their cosine similarity to the query point. As the final prediction, we keep only the maximum score for each GO term transferred from the nearest neighbors. Throughout this work, we use cosine similarity to determine the similarity between any two embedding vectors and .
| (1) |
where and are both real-valued vectors, represents the dot product between and , and is the Euclidean norm of vector , where i = 1, 2.
2.6. SAP: Synteny-aware function prediction using protein embeddings
Our novel function prediction tool SAP uses protein embeddings to represent amino-acid sequences and exploits conserved synteny among bacterial operons for function prediction. SAP consists of two main components: (i) assigning operons to a query point from the pre-computed bacterial operon database (subdiagram A. in 2) and (ii) transferring GO terms from the operons to the query point (subdiagram B. in Fig. 2).
Fig. 2:

Overview of SAP algorithm: predicting GO terms of a query protein. A. SAP assigns an operon (or multiple operons) to the query protein (red filled rectangle on the left) represented using embeddings from ESM-1b LM, based on cosine similarity. Consistent with Fig. 1, green rectangles show operons paired with the corresponding GO term frequencies (blue rectangles). In this example, three operons that passed the threshold are assigned to the query, and their GO term frequencies are weighed down by multiplying with the cosine similarity. B. All GO terms from the assigned operons are transferred to the query, where the final predicted score of a GO term is the maximum of all the multiplied values for the term.
For each query point, we identify the most suitable operons in our database following the same procedure as we did for the nearest neighbor predictors based on protein embeddings. In short, we calculate the pairwise cosine similarity between the query point and the average embedding vectors representing operons in the database. We assign an operon to the query point if the pairwise similarity between the operon embeddings and the query embeddings is greater than a threshold, where the threshold is calculated for each query point as the 99th percentile among all pairwise similarity values. In our current implementation, we do not have any restrictions on operons assigned to a query point: given that the most suitable operons are picked among the same set of operons used to calculate the threshold, at least one operon is assigned to each query point.
For all such operons assigned to the query point, we also retrieve the GO term frequencies. We transfer all the GO terms found in the assigned operons using the frequency of the terms multiplied by the cosine similarity of the query point to the operon as the predicted score. For each GO term. the predicted score is the maximum of these values. As the final step, we normalize the predicted scores separately within three GO classes. In this work, SAP uses the operon database we created according to the procedure described in subsection 2.3 and illustrated in Fig. 1. Fig. 2 shows an overview of the SAP algorithm excluding the final step where the predicted scores are normalized.
In addition to using SAP on its own as we propose, we also tested running SAP using only the operon database (titled SAP-operon), i.e. we removed all singleton entries from the database and relied only on those that were at least two genes long. Evaluating SAP-operon along with SAP and knn, it is possible to assess the contribution of using our operon database on SAP’s performance.
2.7. Annotation of unlabeled Enterococcus genes
For the unlabeled Enterococcus genes experiment, we evaluated four different approaches in bacterial gene annotation: (i) using the prokka annotation pipeline (v. 1.14.6) (Seemann, 2014), which runs multiple sequence homology-based function prediction tools under the hood (ii) running HMMER (v 3.3.2) (Eddy, 2011) against the Pfam database (release 32.0) (Paysan-Lafosse et al., 2023), (iii) running eggNOG mapper (v 2.1.10) (Huerta-Cepas et al., 2018; Cantalapiedra et al., 2021) and (iv) running Phyre2 web-server (v 2.0) (Kelley et al., 2015), a structure-based function prediction tool. All tools were run using the default parameter settings; for both HMMER and eggNOG mapper, a significant hit is defined as those with an evalue less than 1e-3, while for Phyre2, a significant hit has a confidence value greater than 95%.
2.8. Evaluation
In our experiments on the SwissProt dataset, we evaluate 6 methods in total: two baselines (BLAST and Pfam), a nearest neighbor predictor based on protein embeddings extracted using the ESM-1b model (knn), SAP and its variant SAP-operon, where only the operon component of SAP is retained, and DeepGOPlus. As a final step, we propagated the predicted GO term scores based on the GO hierarchy because DeepGOPlus by default propagates the predicted scores. We followed the same procedure as described by Kulmanov and Hoehndorf (Kulmanov and Hoehndorf, 2019); for each GO term, we assigned the highest predicted score among all its children. This additional post-processing step was implemented only in our SwissProt experiments so as to compare SAP’s performance to DeepGOPlus, and not in the Enterococcus experiments.
We evaluated these predictors using the maximum F1-score (Fmax), minimum semantic distance (Smin) as described in (Radivojac et al., 2013), consistent with the CAFA challenges. We also report the coverage, the number of test proteins annotated with at least one GO term at the threshold which maximizes the F1-score.
In the unlabeled Enterococcus genes experiments, we compare different approaches to annotation based on their coverage, i.e. number of genes annotated. In this case, a gene is annotated if a meaningful functional label was assigned, hence, genes labeled with the function “domain of unknown function (DUF)” and “hypothetical protein” are not counted as annotated.
3. Results and discussion
3.1. The universal bacterial operon database
We demonstrate the validity of our bottom-up, purely computational approach to building a database of bacterial operons by comparing it to known, experimentally determined operons found in ODB. The underlying hypothesis in constructing our own database was that given enough data, it is possible to model the landscape of bacterial operons accurately enough to improve the bacterial function prediction.
ODB was among the sources we utilized when designing our operon prediction pipeline, in particular, their conserved operon database. The conserved operon database from ODB is essentially an expansion on their known operons where the additional operons were determined from orthologous genes found in multiple genomes that are located consecutively on the same strand of the contig. Our goal in designing our operon prediction pipeline was to achieve an end product similar to the conserved ODB database, but more extensive - representing a broader range of diversity within the bacterial kingdom - and more up-to-date.
Since the conserved ODB was the final product goal of our operon prediction pipeline, our operon database is, on an aggregate level, quantitatively similar to it. Fig 3 shows the distribution of the number of genes in an operon. We emphasize that our operon database was not derived from ODB but was built from scratch; we used the CDS of representative bacterial genome assemblies in the GTDB database as the starting point, and we predicted putative operons based on known heuristics, whereas ODB is a curated list of experimentally determined operons obtained from the literature.
Fig. 3:

The procedure we propose for building a representative operon database predicts operons that are quantitatively similar to the experimentally determined operons found in the conserved ODB. The distribution of the number of genes in a predicted operon (operon length) in our database (subplot B.) is in agreement with the experimentally determined operons in the conserved ODB (subplot A.). Only non-singleton operons are shown.
In addition to being in agreement with known operons at a high level, with our approach, we can predict existing bacterial operons accurately either partially or completely. We extracted known operons from ODB which contained E. coli and B. subtillis since these are not only one of the two most well-studied bacterial organisms in the SwissProt database, but we can identify and cross-reference their genes with the operon entries on ODB because ODB maintains the gene locus tags from the SwissProt database for these organisms. However, for the remainder of the organisms in our operon database, it was not feasible to cross-reference the genes on ODB in a reliable manner.
We found 2845 operons on ODB that contains at least one E. coli gene, 1071 of which are non-singleton. In our operon database, we predict 15968 operons with at least one E. coli gene, where 15618 of the predictions are non-singleton. 13610 of our non-singleton operons (87% of non-singleton E. coli operons) partially or fully overlap with the known non-singleton operons, i.e. they share at least one gene in common. Our operon database is inherently redundant where a single experimentally known operon from ODB would often be split into multiple predicted operons since we do not attempt to merge the partial operons.
While it is not feasible to cross-check each individual operon in our database, here we picked a few of the predictions showcasing the accuracy of our prediction at different values in Table 3 below. On the right-hand-side of Table 3 we listed the known operon IDs, names and definitions from ODB, consistent with their nomenclature. And the left-hand-side of Table 3 contains the operon ID and the relevant metadata extracted from our operon database. Our operon database is accompanied by extensive taxonomic metadata from the GTDB database, hence it is a valuable tool to explore the bacterial operon landscape. We can observe which species and lineages an operon is found in (species column in Table 3). In addition, our operon database can capture the wider context of an operon. The relBEF toxin-antitoxin system (bottom row in Table 3) is one example of such case where we observed that the individual functional unit of the operon, consisting of genes b1562, b1563 and b1564, is often found in multiple entries in our database. Some of these entries were larger than the operon itself, and they contained two IS3 family transposase genes located upstream of the actual operon itself. Thus, with our operon database it is possible to extract and analyze the surrounding genomic structures of an operon.
Table 3.
Our predicted operon database can reproduce experimentally known operons in E. coli. Three example operons from our operon database and the corresponding experimental operons from ODB are shown
| Our operon database | ODB | |||||
|---|---|---|---|---|---|---|
|
| ||||||
| Operon ID | Species | E.coli gene | Annotation | Operon ID | Name | Definition |
| 62671 | Escherichia , Shigella, Citrobacter | b4460 | L-arabinose transport system permease protein AraH | KO03244 | araFGH | High-affinity L-arabinose transport |
| b1900 | Arabinose import ATP-binding protein AraG (EC 7.5.2.12) | |||||
| 62674 | Escherichia , Shigella, Bacillus | b1901 | L-arabinose-binding periplasmic protein (ABP) | KO03228 | flhAB | Flagellar biosynthesis |
| b1879 | Flagellar biosynthetic protein FlhB | |||||
| b1880 | Flagellar biosynthesis protein FlhA | |||||
| 62755 | Citrobacter, Enterobacter, Klebsiella, Leclercia, Escherichia, | - | IS3 family transposase | - | - | |
| - | IS3 family transposase | - | - | |||
| b1562 | Toxic protein HokD | KO03197 | relBEF | toxin-antitoxin system | ||
| b1563 | mRNA interferase toxin RelE | |||||
| b1564 | Antitoxin RelB | |||||
In the interest of creating the most comprehensive collection of bacterial operons and conserved gene context, we used genomic data with no experimental annotations. In the absence of ground truth, we assigned function to our operons by transferring GO terms from similar protein sequences in the SwissProt database, using medium-level strict thresholds on both the pairwise identity and significance.
We aim to achieve a middle ground between minimizing false positives and retaining as many annotations as possible when transferring GO terms to the operons. However, this approach could potentially yield a training set that is too sparsely annotated to be for predicting gene function. In our full SwissProt dataset experiments, we have 388,377 non-singleton operons (out of 406,293) that are annotated with at least one GO term. Consistent with findings in the literature, when sequence homology is used as the basis for transferring annotation, GO terms in the MFO category are more likely to be transferred. In previous studies, it has been shown that, unlike BPO and CCO, MFO can be modeled using the primary sequence or, features derived from it (Zhou et al., 2019). We presume this aspect of the GO database affects our findings as well because we also report that the number of operons annotated with at least one GO term is the largest for the MFO category even though the total number of MFO terms available in the SwissProt dataset is significantly smaller than that of BPO (Table 2).
Table 2.
Annotation statistics and information content (IC) of operons in our operon database. GO terms in MFO category are more likely to be transferred when using sequence homology for annotation transfer.
| Annotation statistic | BPO | MFO | CCO |
|---|---|---|---|
| # of annotated operons | 268,773 | 311,424 | 268,359 |
| Range of # of GO terms | [1, 41] | [1, 17] | [1, 20] |
| Average # of GO terms per gene in an annotated operon | 0.556 | 0.543 | 0.456 |
| Average IC of GO terms in an annotated operon | 10.73 | 8.786 | 6.022 |
| Average IC of GO terms per gone in an annotated operon | 3.345 | 2.711 | 1.762 |
| Total # of GO terms in the SwissProt database | 16281 | 6308 | 2565 |
3.2. SAP achieves the highest Fmax across multiple bacteria in the SwissProt database
To assess the performance of SAP, we first observe the prediction results in the full SwissProt dataset. The train/test pairs we have generated here for this experiment represent the ideal scenario where the task is to annotate a new assembly of a known species; it is likely that we have experimental annotations for genes that belong to different species, but are still closely related to the new assembly.
Among several protein language models published in the literature, we tested some of the most recent models based on a transformer architecture, ProtT5-XL-U50 and ESM-1b, as well as the LSTM-based SeqVec (Littmann et al., 2021b; Rives et al., 2021; Heinzinger et al., 2019) in the preliminary stage of our work. As suggested by Littmann et al. we extracted the protein embeddings from the pre-trained language models to represent the proteins, and consequently, we used pairwise similarity in the embedding space to transfer GO terms within a simplified knn framework. This pared-down method for transferring the GO terms has allowed us to gauge which language model performs the best on bacteria initially, and thus would be better suited to form the basis of our proposed method in the subsequent steps of our work. We found the ProtT5-XL-U50 and ESM-1b models to yield better results than SeqVec in general, ESM-1b being the top performer consistently (not shown in the current manuscript). Heinzinger et al. also reported that embeddings from transformer-based models are superior to those from LSTM-based models for unsupervised annotation transfer. In the end, the final implementation of knn predictor in our work differs from that of Littmann et al.’s in the choice of language model we use, and the knn model parameter we adjust to define the neighbors.
In parallel with recent studies, here in our work we also observe that embeddings provide a better representation of protein sequence compared to the amino-acid sequence itself (BLAST baseline) as well as HMM profiles (Pfam baseline) to transfer GO terms accurately in terms of the Fmax score. This finding is valid across different bacteria, and in three GO categories with a few exceptions as we report in Table 4 (Smin and prediction coverage are reported in Supplementary Tables S2 and S3, respectively). Except for the Salmonella data set (ST|), SAP consistently achieved the highest Fmax; the operon information used in conjunction with the embeddings-based representation of proteins is the top-performing model.
Table 4.
SAP achieves the highest Fmax scores across all bacteria for all three GO categories on the full SwissProt experiment set, except for S. typhimurium where DeepGOPlus performs in BPO and MFO. Fmax scores on the full SwissProt experiment set are tabulated in three parts for separate GO categories, BPO, MFO and CCO respectively, and each column is a different bacteria found in our SwissProt experiments
| Method | EC | MT | BS | PA | ST |
|---|---|---|---|---|---|
| Biological process | |||||
|
| |||||
| BLAST | 0.570 | 0.543 | 0.639 | 0.683 | 0.852 |
| Pfam | 0.610 | 0.513 | 0.582 | 0.579 | 0.579 |
| knn | 0.646 | 0.636 | 0.828 | 0.797 | 0.880 |
| SAP-operon | 0.872 | 0.837 | 0.915 | 0.928 | 0.903 |
| SAP | 0.876 | 0.838 | 0.915 | 0.929 | 0.902 |
| DeepGOPlus | 0.648 | 0.669 | 0.857 | 0.824 | 0.928 |
|
| |||||
| Molecular function | |||||
|
| |||||
| BLAST | 0.613 | 0.593 | 0.625 | 0.699 | 0.814 |
| Pfam | 0.650 | 0.549 | 0.571 | 0.534 | 0.559 |
| knn | 0.675 | 0.723 | 0.814 | 0.854 | 0.837 |
| SAP-operon | 0.880 | 0.869 | 0.893 | 0.938 | 0.878 |
| SAP | 0.885 | 0.869 | 0.893 | 0.938 | 0.877 |
| DeepGOPlus | 0.686 | 0.755 | 0.841 | 0.883 | 0.911 |
|
| |||||
| Cellular component | |||||
|
| |||||
| BLAST | 0.569 | 0.397 | 0.638 | 0.700 | 0.871 |
| Pfam | 0.625 | 0.541 | 0.608 | 0.560 | 0.616 |
| knn | 0.731 | 0.500 | 0.898 | 0.900 | 0.917 |
| SAP-operon | 0.920 | 0.847 | 0.943 | 0.945 | 0.918 |
| SAP | 0.922 | 0.847 | 0.943 | 0.945 | 0.917 |
| DeepGOPlus | 0.745 | 0.567 | 0.885 | 0.887 | 0.936 |
Among the three GO categories, the differences in prediction performance are the most pronounced in BPO and MFO. We expect to achieve the largest gains in prediction accuracy for BPO using SAP, also, the conventional BLAST method still appears to be a strong contender in MFO in the most recent CAFA challenge, thereby rendering this category crucial to investigate in detail as well (Zhou et al., 2019). We presume this is because different protein functions within this category can be identified based on changes in the aminoacid sequence; results from the CAFA challenges have shown that auxiliary features derived from the aminoacid sequence, or the sequence itself are the best predictor in MFO (Jiang et al., 2016). Thus, hereafter, we will focus on these two categories in this text to assess prediction performance.
3.3. Embeddings and synteny improve remote homolog annotation
Our main motivation in developing SAP was to annotate new, previously unseen proteins found in novel bacterial species, or known but less-studied organisms. In both cases, gene function prediction becomes especially challenging because there are no proteins with similar amino-acid sequences in the existing sequence databases, and it is not possible to transfer annotations based on primary sequence similarity. To emulate gene function prediction in such low homology instances, we have designed additional experiments where the train/test pairs were generated by stratifying the full SwissProt dataset based on the maximum sequence similarity allowed between protein sequences in the training and the test set. To be consistent with the new design, and avoid any information leak, we also modified our operon database to remove clusters homologous to any test sequence and rebuild the database from scratch for each pair.
We have experimented with 5 incremental levels of sequence similarity: 40%, 50%, 60%, 70%, and 80%. Thus, there are 6 different train/test pairs (including the full version) generated independently for 5 bacteria as subsets from the SwissProt database. Essentially, the experiments where the training sequences are less than 40% similar to any test protein are the most challenging ones in this work. To summarize the prediction performance, we report the average Fmax values and standard deviation across all five of the bacteria in our SwissProt experiments, we do not observe any significant differences between the five.
To start with, we demonstrate that embeddings-based methods far outperform both of the conventional predictors, BLAST and Pfam, in all of SwissProt experiments. In terms of the average Fmax, SAP is the top-performing method and the difference in prediction performance is more salient as the sequence similarity between the test and the training sequences (as well as the clusters in the operon database) increases. Fig. 4 displays the Fmax values in BPO averaged over bacteria for different experiments where moving from left to right, maximum shared homology between the train/test sequences increases (except for the Pfam baseline which uses a separate training set of its own, hence all bars for Pfam are identical).
Fig. 4:

SAP outperforms the conventional approaches to function prediction in five different bacteria, across varying levels of prediction difficulties. We report the average Fmax values in BPO over 5 bacteria in our experimental setup, and the error bars show the corresponding standard deviation of each method, across five species. Note that bar plots for the Pfam baseline are identical for all 6 experiment sets because Pfam uses a different training set, independent of our experimental design.
For all GO categories, we observed that the knn predictor, despite being trivial in its design, performed better than the BLAST baseline in terms of several metrics (See Supplementary material for Fmax, Smin, prediction coverage and average ROCAUC scores). Even in MFO, where BLAST was known to be difficult to beat, we found that ESM-1b embeddings provide a far superior representation of protein sequences.
In addition, the results from our SwissProt experiments reveal two contrasting trends in the performance of baseline BLAST and the embeddings-based methods: BLAST shows a surprisingly consistent performance over different levels of shared homology between the training and test sets. This trend holds for not only the average Fmax in the remaining two ontologies, but also for each bacteria individually (see Supplementary Fig.s S1 and S2 for Fmax values in GO categories MFO and CCO, respectively). This could be interpreted in two ways: either BLAST is exceptionally robust to changes in homology levels, and/or using embeddings representation of proteins, we can exploit the information contained in the training sequences more effectively to infer the function of test sequences. We assert that this is a particularly compelling idea that warrants further investigation in future work.
3.4. Highest annotation coverage for knn models
Following on from studying the predictive performance of each method in terms of their maximum F1-score (Fmax), here we investigate their coverage at the prediction threshold at which they reach this maximum. Again, we capture the expected performance by taking the average over all the bacteria in our SwissProt experiments and report these average values along with the corresponding standard deviation to assess the robustness.
Although SAP emerged as the all-around top-performing method when precision/recall is considered, its prediction coverage is less than that of embeddings-based knn model in a large fraction of our experiments. Table 5 shows the average in % of test sequences predicted, and the standard deviation of coverage values are displayed in parentheses (see Supplementary Table S4 for the results on MFO and CCO). Furthermore, knn appears to be robust in this aspect, since the standard deviation across different bacteria is considerably low in the remote homology experiments, and it decreases significantly as the train/test sequences share higher sequence homology to yield the lowest deviation in coverage among all the methods in the full SwissProt dataset.
Table 5.
In the absence of ground truth, prediction coverage of SAP is lower than knn models. We study the coverage values as averaged over 5 bacterial organisms for BPO, we also report the standard deviation in parentheses.
| Method | 40 | 50 | 60 | 70 | 80 | Full |
|---|---|---|---|---|---|---|
| Biological process | ||||||
|
| ||||||
| BLAST | 71.16% (3.30%) | 70.19% (5.82%) | 70.21% (5.00%) | 71.76% (5.62%) | 72.02% (4.49%) | 73.62% (7.99%) |
| Pfam | 78.55% (4.77%) | 78.55% (4.77%) | 78.55% (4.77%) | 78.55% (4.77%) | 78.55% (4.77%) | 78.55% (4.77%) |
| knn (T5) | 85.71% (4.99%) | 88.23% (6.43%) | 90.09% (3.74%) | 89.03% (4.80%) | 89.93% (4.49%) | 91.18% (3.92%) |
| knn | 85.33% (4.07%) | 91.58% (6.72%) | 93.23% (3.52%) | 92.40% (4.24%) | 92.76% (3.78%) | 93.06% (3.41%) |
| SAP-operon | 85.48% (3.18%) | 87.36% (1.05%) | 87.93% (3.90%) | 89.94% (4.43%) | 91.41% (0.83%) | 89.66% (3.74%) |
| SAP | 84.04% (1.82%) | 87.93% (0.92%) | 88.11% (3.89%) | 89.17% (3.59%) | 91.73% (0.91%) | 89.69% (3.77%) |
| DeepGOPlus | 95.62% (1.56%) | 94.48% (3.45%) | 93.84% (4.99%) | 94.44% (3.16%) | 90.25% (6.16%) | 91.76% (5.73%) |
Coverage of baseline BLAST, on the other hand, is on par with the knn models in some cases, in contrast to Pfam, the second baseline model in our experiments, Here, both Pfam and SAP suffer from the same issue; both methods are based on a sparsely labeled training set. In order to compare the descriptive, textual Pfam output, we used the mapping tables provided by the GO consortium to obtain the GO terms associated with predicted Pfam IDs. Similar to our operon labeling procedure, mapping Pfam Ids to GO terms introduces an additional step into the prediction pipeline which, in essence, dilutes the final predictions because both steps are extremely conservative in labeling training instances.
In addition, as the train/test homology decreases, we observe that the standard deviation of coverage also decreases for only SAP. This also supports the hypothesis that our conservative operon labeling procedure has put SAP at a disadvantage where because its training set is sparsely labeled; the number of GO terms available for SAP to transfer is significantly smaller than other methods, and this difference becomes more pronounced when the training set is restricted to have low homology to the test set. Since the Pfam method uses a different training set for predictions, it is not possible to compare the change in the coverage across different train/test pairs to SAP.
3.5. SAP performs on par with conventional structure-based tools in remote homolog annotation of Enterococcus species
SAP has been developed with the main goal of annotating unseen proteins in novel bacterial species, in particular those associated with antimicrobial resistance, virulence, and toxicity. We presume that making use of known bacterial operons and conserved syntenic regions in bacterial genomes would be especially beneficial for such remote homology annotation tasks. Hence, we investigate SAP’s performance on a set of proteins of unknown function found in four genomes, each of which was identified as different Enterococcus species spanning the diversity of the genus (see Supplementary Table S1 for assembly statistics, as well as the GenBank accesion IDs).
In total, prokka failed to annotate 4380 genes. Next, we ran the baselines BLAST and HMM search against the Pfam database, and these two provided annotations for an additional 767 and 2512 proteins, respectively. Overall, we obtained meaningful functional labels (i.e. a significant hit with label that is not a DUF or hypothetical protein) using sequence-based annotation tools for 2535 proteins out of the initial 4380. As a final step, we ran Phyre2, a structure-based predictor, on the remaining unannotated genes, we got high-confidence predictions (confidence level greater than 95%) for 267 more of the proteins. Thus, combining both sequence-based and structure-based conventional predictors, 2802 proteins (out of 4380) were annotated successfully.
To compare, we ran our method, SAP out of the box, keeping the parameters and the operon database unchanged. We could label all 4380 genes with an operon in our database, meaning that, while these genes. Although we had operon labels for all the genes, SAP assigned GO terms to 2841 of them. The conventional annotation pipeline had failed to annotate 657 of these genes. However, we also note that SAP could not transfer any GO term to 618 of the genes the conventional approach assigned a function. Thus, SAP, achieves annotation coverage on par with conventional pipelines, even those that utilize the protein structure at a fraction of the computation cost and time, in terms of the total number of proteins it could assign a function. However, it is not possible to do a direct comparison here since the set of proteins successfully annotated by the two approaches differ in their content, albeit overlap largely: 2184 proteins in total were annotated by both.
4. Conclusion
In this work, we proposed SAP, a novel synteny-aware function prediction tool based on protein embeddings, to annotate bacterial species. SAP is distinguished from the existing tools for annotating bacteria in two ways: (i) it uses embedding vectors extracted from state-of-the-art protein language models and (ii) it incorporates conserved synteny across the entire bacterial kingdom by making use of the bacterial operon database we built based on a purely computational, bottom-up approach.
Researchers in the field of bacterial genomics regularly make use of synteny as part of their genome annotation pipeline, albeit manually. In an attempt to formulate this practice computationally, we designed a computational, unbiased approach to predict bacterial operons and conserved synteny. To our knowledge, SAP is the only bacterial gene function prediction tool with these two features. While there have been several successful applications of protein language models on eukaryotes, they are very rarely used in bacterial organisms. Hence, our work is among the first to propose combining these two ideas to improve gene function prediction, especially for remote homology detection where we designed a systematic, rigorous experimental framework to evaluate function predictors based on the SwissProt database.
We used embedding vectors exclusively in our method as we were motivated by the recent work showing significant improvements in function prediction by replacing features derived from amino-acid sequences with embedding vectors extracted from protein language models, Consequently, we show that protein embeddings, even if they are used in an unsupervised model, surpass the conventional sequence homology-based tools on different bacteria, and different levels of difficulty in prediction in our SwissProt experiments (Fig. 4).
We demonstrated that conserved synteny and protein embeddings both provide useful information for predicting the protein function, the information is orthogonal to one another in the sense that they complement each other. Using operons alone, the prediction performance significantly deteriorates (not shown here) and we consistently achieved the best performance when operons were used in conjunction with the nearest neighbors within the SAP framework. Compared to a post-prediction ensemble, extending the operon database to include gene clusters not only eliminates additional steps in the prediction pipeline, but also yields overall more accurate predictions.
The biggest limitation of SAP is the lack of experimentally annotated bacterial operons. In the absence of ground truth, we opted for computational alternatives to assign functions to operons in our database, hence we are restricted by the scope and content of the existing databases. To minimize the false positive operon labels, we adopt a conservative approach which in turn resulted in a sparsely annotated training set, significantly lowering the prediction coverage of SAP 5. The most straightforward way to alleviate this problem would be to routinely pick unlabeled operons from our database to perform experiments and identify their functions. Each time an operon is labeled successfully based on experimental results, additional operons can be labeled more liberally using the new experimental evidence. We expect this iterative approach to rapidly increase the number of labeled operons available in the database.
In addition, our operon database, at its current state, is overly general; it represents conserved synteny across the entire bacterial kingdom. In this work, we developed an all-purpose bacterial gene annotation tool and hence we deliberately designed our operon database to be inclusive and to cover as many conserved syntenic regions as possible. Thus, we removed structural patterns associated with rare traits in bacteria. For niche applications, in particular, when investigating a specific biological pathway or, variants of a known operon unique to certain bacterial species, should be expanded. Future work on our database will be to develop new modules and extensions to both expand our operon database and build additional, external databases, if desired.
Here, we used a systematic, unbiased experimental design to evaluate our novel method, SAP, although we did not investigate the effect of different parameter settings on the prediction performance of our models. In the current implementation of SAP, we opt for a moderately conservative approach to labeling operon functions so as to circumvent the need to put any restrictions when assigning an operon to a query point. Within the scope of this work, this allowed SAP to outperform its competitors, however, as we develop our operon database into a well-annotated representative one, it will be necessary to filter and refine operon assignments to query points. Currently, we are developing experiments where we can tune our model parameters, and evaluate the final models using cross-validation on both the SwissProt dataset and the operon database without any information leak. Once parameter tuning is possible, the unsupervised nearest-neighbor approach can also be replaced with a more complex, supervised model, such as an MLP, or a deep neural network to further improve the prediction accuracy. These additions will be particularly useful for applications where SAP is used to annotate low quality genome assemblies, with fragmented genes.
Supplementary Material
Acknowledgements
We thank Stavros Makrodimitris for providing valuable insight, and engaging in fruitful discussions at the inception of this work; Tamim Abdelaal for giving compelling feedback.
Funding
This project has been funded with Federal funds from the National Institute of Allergy and Infectious Diseases, National Institutes of Health, Department of Health and Human Services,under Grant Number U19AI110818 to the Broad Institute (A.LM. and A.M.E.)
Footnotes
Supplementary information: Supplementary data are available at Bioinformatics online.
Conflict of Interest: none declared.
Availability:
References
- Altschul S. F. et al. (1990). Basic local alignment search tool. Journal of molecular biology, 215(3), 403–410. [DOI] [PubMed] [Google Scholar]
- Ashburner M. et al. (2000). Gene ontology: tool for the unification of biology. Nature genetics, 25(1), 25–29. [DOI] [PMC free article] [PubMed] [Google Scholar]
- Buchfink B. et al. (2021). Sensitive protein alignments at tree-of-life scale using diamond. Nature methods, 18(4), 366–368. [DOI] [PMC free article] [PubMed] [Google Scholar]
- Cantalapiedra C. P. et al. (2021). eggNOG-mapper v2: Functional Annotation, Orthology Assignments, and Domain Prediction at the Metagenomic Scale. Molecular Biology and Evolution, 38(12), 5825–5829. [DOI] [PMC free article] [PubMed] [Google Scholar]
- Dallago C. et al. (2021). Learned embeddings from deep learning to visualize and predict protein sets. Current Protocols, 1(5), e113. [DOI] [PubMed] [Google Scholar]
- Eddy S. R. (2011). Accelerated profile hmm searches. PLoS computational biology, 7(10), e1002195. [DOI] [PMC free article] [PubMed] [Google Scholar]
- Elnaggar A. et al. (2020). ProtTrans: Towards Cracking the Language of Life’s Code Through Self-Supervised Deep Learning and High Performance Computing.
- Heinzinger M. et al. (2019). Modeling aspects of the language of life through transfer-learning protein sequences. BMC Bioinformatics, 20(1), 723. [DOI] [PMC free article] [PubMed] [Google Scholar]
- Heinzinger M. et al. (2022). Contrastive learning on protein embeddings enlightens midnight zone. NAR Genomics and Bioinformatics, 4(2). lqac043. [DOI] [PMC free article] [PubMed] [Google Scholar]
- Huerta-Cepas J. et al. (2018). eggNOG 5.0: a hierarchical, functionally and phylogenetically annotated orthology resource based on 5090 organisms and 2502 viruses. Nucleic Acids Research, 47(D1), D309–D314. [DOI] [PMC free article] [PubMed] [Google Scholar]
- Jensen L. J. et al. (2003). Prediction of human protein function according to Gene Ontology categories. Bioinformatics, 19(5), 635–642. [DOI] [PubMed] [Google Scholar]
- Jiang Y. et al. (2016). An expanded evaluation of protein function prediction methods shows an improvement in accuracy. Genome Biology, 17(1), 184. [DOI] [PMC free article] [PubMed] [Google Scholar]
- Kelley L. A. et al. (2015). The phyre2 web portal for protein modeling, prediction and analysis. Nature protocols, 10(6), 845–858. [DOI] [PMC free article] [PubMed] [Google Scholar]
- Kulmanov M. and Hoehndorf R. (2019). DeepGOPlus: improved protein function prediction from sequence. Bioinformatics, 36(2), 422–429. [DOI] [PMC free article] [PubMed] [Google Scholar]
- Lebreton F. et al. (2017). Tracing the enterococci from paleozoic origins to the hospital. Cell, 169(5), 849–861. [DOI] [PMC free article] [PubMed] [Google Scholar]
- Li W. and Godzik A. (2006). Cd-hit: a fast program for clustering and comparing large sets of protein or nucleotide sequences. Bioinformatics, 22(13), 1658–1659. [DOI] [PubMed] [Google Scholar]
- Littmann M. et al. (2021a). Clustering funfams using sequence embeddings improves ec purity. Bioinformatics, 37(20), 3449–3455. [DOI] [PMC free article] [PubMed] [Google Scholar]
- Littmann M. et al. (2021b). Embeddings from deep learning transfer go annotations beyond homology. Scientific reports, 11(1), 1–14. [DOI] [PMC free article] [PubMed] [Google Scholar]
- Lobley A. et al. (2007). Inferring function using patterns of native disorder in proteins. PLOS Computational Biology, 3(8), 1–13. [DOI] [PMC free article] [PubMed] [Google Scholar]
- Odrzywolek K. et al. (2022). Deep embeddings to comprehend and visualize microbiome protein space. Scientific Reports, 12(1), 1–15. [DOI] [PMC free article] [PubMed] [Google Scholar]
- Okuda S. and Yoshizawa A. C. (2010). Odb: a database for operon organizations, 2011 update. Nucleic acids research, 39(suppl_1), D552–D555. [DOI] [PMC free article] [PubMed] [Google Scholar]
- Parks D. H. et al. (2021). Gtdb: an ongoing census of bacterial and archaeal diversity through a phylogenetically consistent, rank normalized and complete genome-based taxonomy. Nucleic Acids Research, 50(D1), D785–D794. [DOI] [PMC free article] [PubMed] [Google Scholar]
- Paysan-Lafosse T. et al. (2023). Interpro in 2022. Nucleic Acids Research, 51(D1), D418–D427. [DOI] [PMC free article] [PubMed] [Google Scholar]
- Radivojac P. et al. (2013). A large-scale evaluation of computational protein function prediction. Nature Methods, 10(3), 221–227. [DOI] [PMC free article] [PubMed] [Google Scholar]
- Rives A. et al. (2021). Biological structure and function emerge from scaling unsupervised learning to 250 million protein sequences. Proceedings of the National Academy of Sciences, 118(15), e2016239118. [DOI] [PMC free article] [PubMed] [Google Scholar]
- Seemann T. (2014). Prokka: rapid prokaryotic genome annotation. Bioinformatics, 30(14), 2068–2069. [DOI] [PubMed] [Google Scholar]
- The UniProt Consortium (2018). UniProt: a worldwide hub of protein knowledge. Nucleic Acids Research, 47(D1), D506–D515. [DOI] [PMC free article] [PubMed] [Google Scholar]
- Törönen P. et al. (2018). PANNZER2: a rapid functional annotation web server. Nucleic Acids Research, 46(W1), W84–W88. [DOI] [PMC free article] [PubMed] [Google Scholar]
- vandenBent I. et al. (2021). The power of universal contextualized protein embeddings in cross-species protein function prediction. Evolutionary Bioinformatics, 17. [DOI] [PMC free article] [PubMed] [Google Scholar]
- WeiBenow K. et al. (2022). Protein language-model embeddings for fast, accurate, and alignment-free protein structure prediction. Structure. [DOI] [PubMed] [Google Scholar]
- Zhou N. et al. (2019). The CAFA challenge reports improved protein function prediction and new functional annotations for hundreds of genes through experimental screens. Genome Biology, 20(1), 244. [DOI] [PMC free article] [PubMed] [Google Scholar]
Associated Data
This section collects any data citations, data availability statements, or supplementary materials included in this article.