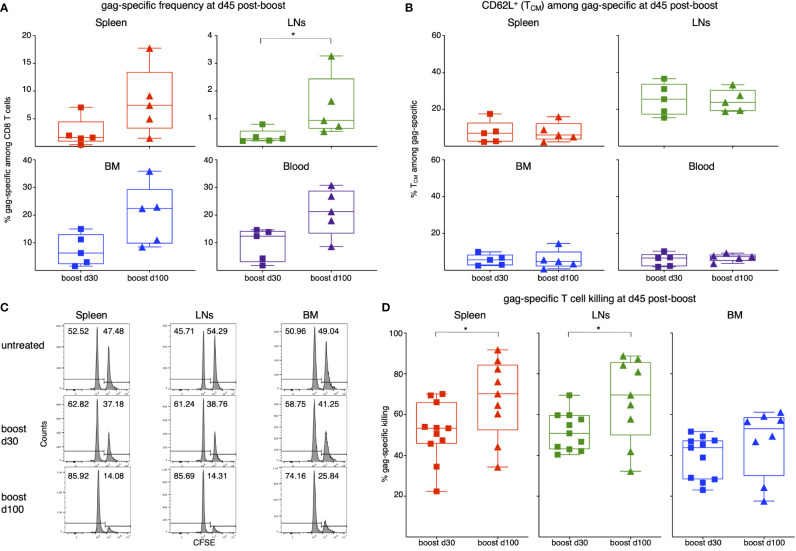
In the published article, there was an error in Figure 5 , panel A as published. The mistake was to show a statistically significant difference in the spleen, as indicated by an asterisk in panel A, top left. The correct panel A doesn’t show a statistically significant difference in the spleen, but only in the LNs, in agreement with the text of the result section, as in the sentence “There was a trend of higher gag-specific frequency when boost was performed at d100 post-prime as compared to boost at d30 in all organs, that reached statistical significance in LNs ( Figure 5A ).” The corrected Figure 5 and its caption appear below.
Figure 5.
Analysis of gag-specific CD8 T cell frequency, TCM-phenotype and in vivo killing activity at d45 post-boost. Female BALB/c mice were primed as in Figure 1 at d0. One set of primed mice was boosted with MVA-gag at d30 post-prime, and another at d100 post-prime. For each set, analysis was performed at d45 post-boost. (A, B). Frequency of gag-specific CD8 T cells (A) and percentage of TCM among gag-specific CD8 T cells (B) in spleen, LNs, BM and blood of primed/boosted mice. (C, D). Primed/boosted and untreated control mice were injected i.v. with a 1:1 mixture of gag-pulsed CFSEhigh cells and unpulsed CFSElow syngeneic spleen cells (approximately 10x10^6 cells each). After 3 hours, the percentages of CFSEhigh and CFSElow cells were measured in spleen, LNs and BM, and the percentage of gag-specific killing was determined. Examples of CFSE histograms (C) and summary of results (D). (A, B) summarize results of 5 independent prime/boost experiments with a total of 60 mice, including control untreated mice (note that at each time point, 3 untreated mice were examined as a control; results were similar to those of untreated control mice shown in Figures 2A, B). Each symbol represents a pool of 3 mice. (C, D) summarize results of 4 independent prime/boost experiments with a total of 36 mice, including control untreated mice (see example in panel C). In (C), numbers represent percentages of cells in the indicated regions. In (D), each symbol represents a single mouse. Statistical analysis was performed by either Student t test, after checking that distribution was normal by Shapiro-Wilk test, or Mann-Whitney test. Statistically significant differences are indicated (*P ≤ 0.05).
The authors apologize for this error and state that this does not change the scientific conclusions of the article in any way. The original article has been updated.
Publisher’s note
All claims expressed in this article are solely those of the authors and do not necessarily represent those of their affiliated organizations, or those of the publisher, the editors and the reviewers. Any product that may be evaluated in this article, or claim that may be made by its manufacturer, is not guaranteed or endorsed by the publisher.


