

Abstract
Inhibition of the tumour suppressive function of p53 (encoded by TP53) is paramount for cancer development in humans. However, p53 remains unmutated in the majority of cases of glioblastoma (GBM)—the most common and deadly adult brain malignancy1,2. Thus, how p53-mediated tumour suppression is countered in TP53 wild-type (TP53WT) GBM is unknown. Here we describe a GBM-specific epigenetic mechanism in which the chromatin regulator bromodomain-containing protein 8 (BRD8) maintains H2AZ occupancy at p53 target loci through the EP400 histone acetyltransferase complex. This mechanism causes a repressive chromatin state that prevents transactivation by p53 and sustains proliferation. Notably, targeting the bromodomain of BRD8 displaces H2AZ, enhances chromatin accessibility and engages p53 transactivation. This in turn enforces cell cycle arrest and tumour suppression in TP53WT GBM. In line with these findings, BRD8 is highly expressed with H2AZ in proliferating single cells of patient-derived GBM, and is inversely correlated with CDKN1A, a canonical p53 target that encodes p21 (refs. 3,4). This work identifies BRD8 as a selective epigenetic vulnerability for a malignancy for which treatment has not improved for decades. Moreover, targeting the bromodomain of BRD8 may be a promising therapeutic strategy for patients with TP53WT GBM.
Patients with GBM have a median survival of 12–14 months and a 5-year survival of less than 5% because of the lack of effective treatments5–7. Cancer cells need to exploit ways to counter the tumour suppressor function of p53, for example, by mutating TP53 or by amplifying MDM2 to degrade p53 (refs. 8–12). However, compared with other cancers, de novo GBM has a low genetic alteration burden13,14. TP53 mutations are infrequent, and amplification of MDM2 is found in only 7–11% of GBM cases1,2,15. Thus, it is unclear how TP53WT GBM—which constitute the majority of cases—circumvent p53-mediated tumour suppression to promote malignancy.
BRD8 maintains TP53WT GBM
Analysis of genomic profiling data for tumors from 452 patients with GBM in cBioPortal,indicated that 71% of cases were TP53WT GBM1,2,15–17, and these were as aggressive as those with TP53 mutations (TP53Mut) (Extended Data Fig. 1a,b). TP53 mutations (n = 943) in patients with GBM from cBioPortal and the published literature tended to occur in the DNA-binding domain18 (Extended Data Fig. 1c and Supplementary Table 1). We verified the TP53 status in human GBM cell lines, in patient-derived xenografts and in primary cells (Supplementary Fig. 1 and data not shown). Whereas expression of the p53 target gene CDKN1A was compromised in TP53Mut GBM, CDKN1A was also significantly repressed in TP53WT GBM, which indicated that p53 function was severely restrained (Extended Data Fig. 1d,e). Notably, these TP53WT GBM samples responded appropriately to p53 activation with the MDM2 antagonist Nutlin-3a, whereas GBM cells with TP53 hotspot mutations failed to respond to Nutlin-3a treatment, which indicated that p53 was functional in TP53WT GBM cells (Extended Data Fig. 1f,g). These findings suggest that p53 function is compromised in GBM, even when p53 is not mutated.
Given that the well-characterized genetic mechanisms of inactivating p53 were clearly not playing a part in TP53WT GBM, we reasoned that there were epigenetic means of counteracting p53. Therefore, we performed domain-focused CRISPR screening using a library containing 1,390 single guide RNAs (sgRNAs) targeting 196 human chromatin regulatory domains covering the major epigenetic writers, readers and erasers to identify GBM-specific vulnerabilities linked to p53 (refs. 19,20) (Extended Data Fig. 1h). The human cell lines screened included 4 TP53WT and 4 TP53Mut GBM lines, and 25 cell lines from other cancers with varying TP53 status (Supplementary Table 2). We ranked vulnerabilities by both the degree of GBM specificity and p53 dependency. The bromodomain of BRD8 scored as the top candidate, which was in contrast to genome-wide CRISPR screens that typically use sgRNAs that target the 5′ end of genes (Fig. 1a and Extended Data Fig. 1i). The less selective GBM vulnerabilities, such as BRD2, ATRX, ZMYND8, EHMT1 and EHMT2, were either previously implicated in glioma21,22 or also essential to some other cancers. Given the specific essentiality of BRD8 in TP53WT GBM and its potency as a therapeutic target, we chose to investigate this protein in this context. We further validated the following: (1) BRD8 depletion with individual sgRNAs specifically inhibited the survival of TP53WT GBM but not TP53Mut GBM or non-GBM cancers (Extended Data Fig. 2a–c); (2) sgRNAs targeting BRD8 introns had no effect (Extended Data Fig. 2d); (3) short hairpin RNAs (shRNAs) targeting BRD8 phenocopied the sgRNAs (Extended Data Fig. 2e); (4) CRISPR-resistant BRD8 cDNAs fully rescued growth inhibition caused by BRD8-specific sgRNAs (Extended Data Fig. 2f–i).
Fig. 1 |. Domain-focused CRISPR screens identify BRD8 as a p53-dependent vulnerability.

a, Heatmap of the log2(fold change) of sgRNA abundance in the indicated panel of cancer cell lines ranked by GBM-dependent and p53-dependent potency. b, Kaplan–Meier plot of mice that had been orthotopically transplanted with U87WT cells expressing the sgRNAs sgNeg or sgBRD8 into the brains of recipient mice. P value was calculated by log-rank (Mantel–Cox) test. c, Cellular competition-based GFP dropout assays of sgNeg, sgCDK1, sgBRD8–1 and sgBRD8–2 in control (Ctrl) or p53-depleted (sgTP53–1, sgTP53–2, sgTP53–3 or sgTP53–4) A382WT cells. A GFP reporter is linked to sgRNA expression, and the percentage of independent replicates (normalized to P0, n = 3 biologically independent samples) is shown as the mean ± s.d. at the indicated time points. P0 refers to day 3 after infection. d, GSEA plots of the upregulated gene signature after BRD8 depletion (sgBRD8 up) and p53 induction by doxycycline (P53OE up) in p53-overexpressing (P53OE) and BRD8-depleted A382WT cells (sgBRD8) compared with controls (Ctrl or sgNeg), respectively. Two biological replicates were analysed for each sample. NES, normalized enrichment score. e, Density plots showing BRD8, p53, H3K4me3 and H3K27ac enrichment surrounding the summit of high-confidence BRD8 peaks in A382WT cells, ranked by BRD8 peak intensity. f, Venn diagram showing integrated RNA-seq and ChIP-seq analysis of significantly upregulated genes after BRD8 depletion (sgBRD8 up) and p53 induction (P53OE up). g, GFP dropout assays of sgNeg, sgCDK1 and sgBRD8–2 in control (Ctrl) or p21-depleted (sgCDKN1A-2 or sgCDKN1A-3) A382WT cells. Plotted is the mean ± s.d. at the indicated time points (normalized to P0, n = 3 biologically independent samples). P values were calculated using two-tailed unpaired Student’s t-tests. h, CDKN1A expression in TCGA Firehouse GBM samples divided into three subgroups on the basis of TP53 status and BRD8 expression level. P values were calculated using two-tailed unpaired Student’s t-tests.
BRD8 depletion impaired cell survival of TP53WT GBM but not TP53Mut GBM derived from patient samples. However, it had no significant effect in non-malignant neural stem cells derived from human brain (Extended Data Fig. 2j). This finding was corroborated in cells from TP53WT and TP53Null glioma mouse models as well as in NIH3T3 controls (Supplementary Fig. 2a–c). By establishing an AkaLuc-based23 noninvasive imaging system coupled with orthotopic transplantation into the brain, we demonstrated that BRD8 was essential for the growth of human TP53WT GBM in vivo and that BRD8 depletion significantly prolonged the survival of mice bearing TP53WT but not TP53Mut GBM (Fig. 1b, Extended Data Fig. 2k–m and Supplementary Fig. 2d). These findings demonstrate that BRD8 is essential to TP53WT GBM growth and development.
Targeting BRD8 engages p53 activity
To test whether targeting BRD8 activates the p53 network globally at the transcriptional level, we performed RNA sequencing (RNA-seq) profiling. BRD8 loss induced p53-mediated cell cycle arrest and senescence pathways (Extended Data Fig. 3a–f and Supplementary Fig. 3), but not apoptosis (Extended Data Fig. 3g–i), in TP53WT GBM cells at early stages, which differs from the colon cancer context24. By contrast, BRD8 depletion did not affect cell cycle genes in the non-sensitive U118R213Q and U251R273H cell lines (Extended Data Fig. 3j). To further confirm that BRD8 function depended on p53, we depleted p53. p53 deficiency rescued the compromised proliferation, altered expression of cell cycle genes and senescence caused by BRD8 loss in A382WT GBM cells (Fig. 1c and Extended Data Fig. 3k–n). These findings demonstrate that BRD8 depletion induces p53 activity in TP53WT GBM.
BRD8 directly binds p53 targets
To explore how BRD8 restrains p53 function, we first checked whether BRD8 regulates p53 or its critical negative regulator MDM2. BRD8 did not directly regulate p53 expression or MDM2-mediated degradation of p53, although MDM2 was upregulated by p53 at day 5 after BRD8 loss (Supplementary Fig. 4). In line with this result, BRD8 and MDM2 regulated p53 in distinct ways (Extended Data Fig. 4a,b), and targeting both BRD8 and MDM2 synergistically impaired the proliferation of TP53WT GBM (Extended Data Fig. 4c,d).
Transcriptome profiling after p53 induction using a doxycycline-inducible p53 system revealed that BRD8 depletion and p53 induction exhibited a correlation in global transcription profiles (Fig. 1d and Extended Data Fig. 4e–g). Moreover, as an epigenetic regulator, BRD8 co-localized with p53 in the nucleus (Extended Data Fig. 4h). To determine whether BRD8 binds to p53 target loci across the genome, we performed chromatin immunoprecipitation assays followed by DNA sequencing (ChIP-seq). Although BRD8 with Flag tags at either the amino or carboxy terminus were both functional (Extended Data Fig. 4i,j), we chose to use C-terminally Flag-tagged BRD8 in ChIP-seq experiments. ChIP-seq profiling showed that about 7.0% of BRD8 peaks and 13% of p53 peaks localized to promoters, with the remainder being at distal locations that probably include enhancers, which were represented by the active chromatin marks histone H3 lysine 4 trimethylation (H3K4me3) and H3 lysine 27 acetylation (H3K27ac) (Extended Data Fig. 4k,l). De novo motif analysis of p53-bound regions identified the p53 consensus DNA-binding sequence, namely, two decanucleotides of RRRCWWGYYY (where R represents A or G, W represents A or T, and Y represents C or T), which were typically separated by a zero spacer25 (Extended Data Fig. 4m). In total, 596 genes were occupied by both BRD8 and p53, a large number of which overlapped with promoters or enhancers (Fig. 1e and Extended Data Fig. 4n). We validated a subset of genes bound by BRD8 and p53 using chromatin immunoprecipitation coupled with quantitative PCR (ChIP–qPCR) (Extended Data Fig. 4o). Given the role of p53 in transcriptional activation and our finding that p53-bound targets were positively enriched after p53 induction, we focused on upregulated genes (Extended Data Fig. 4p). Integrated RNA-seq and ChIP-seq analyses identified several targets that were directly and reciprocally regulated by BRD8 and p53 (Fig. 1f), including the canonical p53 target CDKN1A (which encodes p21)3,4 (Supplementary Fig. 5a,b and Extended Data Figs. 3l,m and 4o). To assess the function of the direct BRD8 and p53 reciprocally regulated target CDKN1A, we performed rescue experiments. Depletion of the CDKN1A-encoded protein p21 significantly rescued the growth arrest caused by BRD8 deficiency (Fig. 1g and Extended Data Fig. 4q,r). Notably, we observed high-level BRD8 expression coupled with restrained transcription of CDKN1A in patients with TP53WT GBM. The repressive effect of high BRD8 expression on CDKN1A was comparable with that caused by TP53 mutation, but this was not the case in human specimens of low-grade glioma (LGG) (Fig. 1h, Extended Data Fig. 4s,t and Supplementary Fig. 5c,d). These findings reveal an overlapping regulatory network reciprocally controlled by BRD8 and p53 that is vital for GBM proliferation. Moreover, CDKN1A is implicated as a key p53 target gene that is repressed by BRD8 in TP53WT GBM.
BRD8 overrides p53 through EP400
To further investigate how BRD8 regulates targets of p53, we conducted immunoprecipitation–mass spectrometry (IP–MS) experiments. The data showed that BRD8 predominantly associated with components of the EP400 chromatin remodelling complex26,27. Notably, BRD8 did not associate with SRCAP—an important paralogue of EP400 (ref. 28)—even though EP400 and SRCAP were expressed at comparable levels in GBM cells (Fig. 2a and Extended Data Fig. 5a–e). Having confirmed the interaction between BRD8 and EP400 subunits, we performed GFP dropout assays. Depletion of BRD8, MRGBP, EP400, ING3, GAS41, TIP60, ACT6LA, RUVBL1, RUVBL2, TRRAP and DMAP1 substantially inhibited GBM proliferation (Fig. 2b, top). To interrogate the functional relationship between components of the EP400 complex and p53, we depleted individual subunits in p53-deficient GBM cells. Loss of p53 efficiently rescued the growth arrest caused by depletion of BRD8, EP400, MRGBP, ING3 and GAS41, but not the other components (Fig. 2b, bottom; compare red and green shading). These experiments identified the specific EP400 components that induced proliferation through repression of the p53-dependent network. Notably, only BRD8 and MRGBP could be fully and mostly rescued by p53 deficiency, respectively. Consistent with these findings, global transcriptional profiling revealed that BRD8 depletion correlated most significantly with MRGBP loss (Extended Data Fig. 5f), and that p53 induction correlated most with BRD8 depletion (Extended Data Fig. 5g). The above findings indicate that BRD8 functions through the EP400 chromatin remodelling complex, and that BRD8 is the most specific subunit for overcoming p53-mediated transcriptional programmes (Extended Data Fig. 5h).
Fig. 2 |. BRD8 controls the p53 network by regulating H2AZ occupancy.

a, Scatter plot depicting the enrichment fold-change of immunoprecipitated proteins using Flag-tagged BRD8 compared to empty vector control in MS assays. b, GFP dropout assays of sgNeg (a negative control), sgCDK1 (a positive control) and two or three independent sgRNAs targeting 17 individual subunits of the EP400 complex in parental (p53WT) or p53-deficient (p53KO) A382 cells. Plotted is the mean ± s.d. of GFP-positive percentages from independent cells (normalized to P0, n = 3 biologically independent samples) at the indicated time points. c, Venn diagram showing overlapping genes located near high-confidence peaks among H2AZ, BRD8 and p53 in A382WT cells. d, Scatter plot depicting enrichment of GO analysis of gene sets with false discovery rate (FDR) of <0.05 using the 544 co-targets of H2AZ, BRD8 and p53 in c. e, Metaprofile of BRD8, p53 and H2AZ occupancy comparing BRD8 and p53 overlapping (OL) peaks with overall peaks (All). f, Metaprofile comparing H2AZ occupancy surrounding the summit of H2AZ peaks in A382WT cells transduced with sgBRD8 relative to sgNeg. H2AZ binding intensity is shown as sequencing depth normalized tag count. g, Venn diagram of overlapping upregulated genes after BRD8 depletion (sgBRD8 up) and p53 activation (p53OE up) (left), and GSEA plot of sgRNA-mediated depletion of H2AZ (sgH2AZ) compared with sgNeg in A382WT cells using the gene signature generated from the left Venn diagram. h, GFP dropout assays of sgNeg, sgCDK1 and sgH2AZ-1 in control (Ctrl) or two p53-deficient (sgTP53–3 and sgTP53–4) A382WT cells. Plotted is the mean ± s.d. at the indicated time points (normalized to P0, n = 3 biologically independent samples). P values were calculated using two-tailed unpaired Student’s t-tests.
BRD8 retains H2AZ at p53 target loci
Given that the EP400 complex can deposit the histone variant H2AZ (encoded by H2AFZ) into the genome29, we asked whether BRD8 functioned through H2AZ. ChIP-seq of H2AZ revealed that about 27.9% of H2AZ-bound regions were located at promoters (Extended Data Fig. 6a), which is consistent with previous findings30–32. H2AZ also occupied a number of promoters and enhancers together with BRD8 and p53, as represented by H3K4me3 and/or H3K27ac levels (Extended Data Fig. 6b). Gene Ontology (GO) analysis of the 544 annotated common targets of BRD8, p53 and H2AZ revealed that the most significantly enriched pathways were related to the cell cycle, which highlighted the crucial role of BRD8 and H2AZ in the control of the p53-modulated proliferative network (Fig. 2c,d). Notably, BRD8, p53 and H2AZ exhibited strong binding confidence on BRD8 and p53 overlapped peaks compared with their overall peaks (Fig. 2e). Furthermore, BRD8 depletion led to a substantial loss of H2AZ occupancy at p53 target loci, with a concurrent increase in p53 binding, but had no observable effects on H3K27ac, H3K4me3, H3.3 or H3K18ac levels (Fig. 2f and Extended Data Fig. 6c–h). These findings highlight the crucial role of BRD8 in driving H2AZ occupancy at p53 targets, which in turn prevents transactivation by p53 in GBM. The data also reveal that targeting BRD8 leads to an epigenetic switch that displaces H2AZ and allows p53 engagement.
H2AZ maintains GBM by inhibiting p53
To further assess whether H2AZ functionally recapitulates BRD8 in GBM cells, we targeted H2AFZ and observed a significant inhibition of cell proliferation (Extended Data Fig. 7a,b). Moreover, depletion of H2AZ recapitulated BRD8-deficiency-induced phenotypes, including differential expression of cell-cycle-related genes and permanent growth arrest and senescence (Extended Data Fig. 7c,d). Transcriptome profiling following H2AZ depletion and gene set enrichment analysis (GSEA) demonstrated the marked global transcriptional association between BRD8 and H2AZ (Extended Data Fig. 7e). Upregulated common targets of BRD8 loss and p53 induction were also significantly positively enriched following H2AZ depletion (Fig. 2g), which indicated that this triad of proteins work together to modulate transcriptional output.
To test whether H2AZ function is also dependent on p53, we performed dropout assays. TP53WT GBM cells were more sensitive to H2AZ depletion compared with TP53Mut GBM cells, which demonstrated the p53-biased dependency of H2AZ. By contrast, as a core protein of the EP400 complex, EP400 was essential in all the tested cells regardless of p53 status, which is consistent with the CRISPR screen results (Fig. 1a and Extended Data Fig. 7f). Notably, p53 deficiency fully rescued growth arrest, cellular senescence and dysregulated downstream targets caused by H2AZ loss (Fig. 2h and Extended Data Fig. 7g,h). In addition, depletion of CDKN1A, one of the key reciprocally regulated targets of both H2AZ and BRD8 in the p53-regulated network, also significantly rescued growth inhibition caused by H2AZ inactivation (Extended Data Fig. 7i). Collectively, the above findings demonstrate that disruption of H2AZ recapitulates the p53-dependent phenotypes induced by BRD8 depletion, which highlights an overlapping network controlled by BRD8, H2AZ and p53 that is vital to TP53WT GBM.
The bromodomain of BRD8 binds H2AZ
We identified the bromodomain of BRD8 as the most selective dependency of TP53WT GBM by using gene editing screens to target 52 bromodomains within 39 human proteins that contain this module (Extended Data Fig. 8a). Anexon-tiling CRISPR screen used tofunctionally scan the entire protein also revealed that the bromodomain was the most important module within BRD8 in TP53WT GBM (Fig. 3a). To interrogate the role of the bromodomain in BRD8-mediated proliferation, we performed rescue experiments with BRD8 in which the bromodomain was deleted (Extended Data Fig. 8b). Deletion of the bromodomain did not impair nuclear localization of BRD8 (Extended Data Fig. 8c), yet bromodomain-deleted BRD8 failed torescue the growth arrest caused by BRD8 depletion. These results indicate that the bromodomain is crucial for the function of BRD8 (Fig. 3b).
Fig. 3 |. The bromodomain of BRD8 interacts with H2AZ to repress p53 targets.

a, Exon scanning of BRD8 in A382WT cells, with the x axis showing BRD8 codons (NP0006687) along the entire protein with annotation of the conserved domain and the y axis showing the log2(fold change) of each sgRNA. b, GFP dropout assays of sgNeg, sgCDK1, sgBRD8–1 and sgBRD8–2 in A382WT cells expressing Ctrl, CR-2-C3F or BDdel-C3F. A GFP reporter is linked to sgRNA expression. Plotted is the average percentage (normalized to P0, n = 3 biologically independent samples, the mean ± s.d.) at the indicated time points. P0 refers to day 3 after infection. P values were calculated using two-tailed unpaired Student’s t-tests. c, Schematic of the in vitro pull-down assays using recombinant GST-tagged BRD8 proteins and H2AZ peptides. d, In vitro pull-downs and western blots showing interactions of the bromodomain of BRD8 (top) and full-length of BRD8 (bottom) with H2AZ and H2AZac. Data shown represent two independent results. e,f, Meta plots showing chromatin accessibility after depleting BRD8 (e) or H2AZ (f) on BRD8-associated and p53-associated regions. g–i, Schematic of dual luciferase assay using CDKN1A promoter-driven firefly luciferase (g) in H2AZ wild-type (Control) (h) and H2AZ knockout (H2AZKO) (i) A382KO (p53-deficient) cells. Cells were transfected with the CDKN1A promoter-driven firefly construct, together with the indicated cDNAs. Luciferase activity was measured 48 h after transfection and Renilla luciferase activity was used as an internal control for normalization. Plotted is the mean ± s.d. (n = 4 biologically independent samples). P values were calculated using two-tailed unpaired Student’s t-tests. j, Schematic of BRD8 binding to H2AZ using its BD to enforce a compact chromatin state to repress the accessibility of p53 to its cell cycle targets. Targeting the BRD8 BD releases H2AZ and restores p53 tumour suppressive function by establishing more accessible chromatin for p53-mediated transactivation of its targets.
As bromodomains have been reported as readers of acetylated lysine residues on histones33, we proposed that BRD8 might interact with acetylated H2AZ (H2AZac) through its bromodomain. To that end, we performed in situ proximity ligation assays and immunoprecipitation followed by western blotting. We observed potential interactions of H2AZ and H2AZac with BRD8 but not with bromodomain-deleted BRD8 (Extended Data Fig. 9a–c). Totest whether the bromodomain of BRD8 can directly bind to H2AZ, we purified recombinant glutathione-S-transferase (GST) fusion full-length BRD8 and a series of bromodomains with flanking regions of BRD8 of various lengths (Extended Data Fig. 9d–f). Note that as the bromodomain protein lacking an additional sequence could not be efficiently expressed (Extended Data Fig. 9d, lane 7), full-length BRD8 and the bromodomain protein BD270–GST were used for subsequent experiments. In vitro pull-down assays revealed that both full-length BRD8 and the bromodomain could bind to unacetylated H2AZ (H2AZ) (Fig. 3c,d and Extended Data Fig. 9g). Acetylation of H2AZ (H2AZac) substantially decreased its binding affinity for BRD8 and the bromodomain, which suggests that there is a recognition preference of this module of BRD8. These findings reveal that the bromodomain is essential for BRD8 function and that this module directly interacts with H2AZ.
BRD8 blocks the binding of p53 to chromatin
To further investigate the mechanism by which BRD8 interacts with H2AZ to suppress the transactivation of p53 targets, we performed assays for transposase-accessible chromatin with sequencing (ATAC-seq). Depletion of BRD8 and H2AZ largely increased chromatin accessibility at BRD8 and p53-associated genomic loci at day 3 (Fig. 3e,f), such as the CDKN1A promoter region (Extended Data Fig. 9h–k), which was in line with observed increases in p53 engagement and CDKN1A upregulation (Extended Data Figs. 3c,d and 6f–h). Given that CDKN1A is a direct target of the BRD8–H2AZ–p53 regulatory axis, we wanted to test whether the bromodomain of BRD8 can use H2AZ to directly suppress p53-mediated transcription. To that end, we performed dual luciferase assays using a CDKN1A promoter-driven reporter in p53-deficient A382WT (A382KO) cells (Fig. 3g). This revealed that the bromodomain is essential for BRD8 to repress p53-mediated transactivation (Fig. 3h), and H2AZ deficiency abrogated the inhibitory function of BRD8 on p53 (Fig. 3i). Taken together, the bromodomain of BRD8 is essential for H2AZ occupancy at promoters of p53-modulated genes to repress their transcription. Moreover, targeting BRD8 induces an epigenetic switch that engages p53-mediated cell cycle arrest (Fig. 3j).
Next we examined whether p53 activation is involved in the transactivation of p53 targets triggered by changes in the chromatin state following BRD8 loss. We assessed p21 expression and p53 modifications at different time points, and the results showed that p21 levels were induced early—before p53 was further increased and activated through post-translational modifications (Extended Data Fig. 9l). This finding suggested that p21 was induced by basal levels of p53 after releasing BRD8-mediated confinement at p53 target loci. This is in accordance with data showing that intrinsic p53 is functional and sufficient for tumour suppression, yet repressed by unclear mechanisms34,35. Of note, we did not observe either significantly increased K120 acetylation or apoptosis following BRD8 knockdown at early stages (Extended Data Figs. 9m and 3g–i). However, TIP60, a MYST family member that acetylates p53 at K120 and triggers apoptosis36,37, was present in the EP400 complex (Fig. 2a and Extended Data Fig. 5a–c). Because BRD8 does not interact with p53, or with enzymes that modify it except for TIP60 (Supplementary Table 3), the increased p53 modifications seemed to be a by-product of cell cycle arrest caused by BRD8 knockdown. The increase in p53 post-translational modifications known to activate p53 could also be a consequence of mild DNA damage triggered by BRD8 loss. This is because BRD8 is a component of the EP400 complex and the EP400 complex has a vital roles in maintaining genome integrity and the DNA damage response38,39, although the effect of BRD8 loss on DNA damage was not as severe as for EP400 downregulation; EP400 downregulation impaired proliferation in all types of cells (Fig. 1a, Extended Data Fig. 7f and Supplementary Fig. 6a,b). In support of this concept, ATM and H2AX deficiency only slightly rescued proliferation following BRD8 loss (Supplementary Fig. 6c–h), whereas p53 and p21 deficiency substantially rescued proliferation (Fig. 1c,g). These findings indicate that targeting the BRD8 bromodomain restores the tumour suppressive function of basal levels of intrinsic p53 in TP53WT GBM.
BRD8 and H2AZ are both expressed in GBM cells
To investigate the expression of BRD8 and H2AZ in patient-derived GBM samples, we first performed immunohistochemistry on glioma tumour microarrays (TMAs) (n = 560) and individual patient-derived tissues (n = 17) from multiple sources. Expression of BRD8 and H2AZ were quantified by both percentage and intensity of positivity (Supplementary Table 4). BRD8 was ubiquitously expressed in most brain tumour cells, with GBM exhibiting significantly higher levels of BRD8 compared with LGG (Supplementary Fig. 7). Notably, BRD8 was also expressed in most cells in normal brain, lymph, spleen and tonsil tissues, and was expressed in some cells of normal liver and lung tissues (Extended Data Fig. 10a and Supplementary Fig. 7). These results are in accordance with human proteome data of healthy tissues40 (Extended Data Fig. 10b). The percentage of cells strongly expressing BRD8 was significantly increased in GBM tissue samples from North well Health (n = 15) compared with normal brain (n = 21; P = 7.78 × 10⁻⁷), spleen (n = 3; P = 1.34 × 10⁻¹²), tonsil(n = 5; P = 9.51 × 10⁻¹⁴), lung(n = 2; P = 3.25 × 10⁻¹⁵) and liver (n = 2; P = 2.07 × 10⁻¹⁷). Similar results were obtained with GBM tissue samples from Stanford (n = 371) and the Mayo Clinic (n = 60) when compared with the normal tissue samples (Fig. 4a, left, and Supplementary Table 4). Regarding H2AZ, it was expressed in the majority of GBM tumour cells but less intensely than BRD8, with even weaker expression in normal tissues (Fig. 4a, right, Extended Data Fig. 10a and Supplementary Fig. 7). The percentage of H2AZ-positive cells was markedly greater in GBM specimens from Northwell Health (n = 15) compared with normal brain (n = 21; P = 2.47 × 10⁻⁴), spleen (n = 3; P = 4.29 × 10⁻⁷), tonsil (n = 5; P = 1.08 × 10⁻⁹), lung (n = 2; P = 7.81 × 10⁻¹³) and liver (n = 2; P = 3.29 × 10⁻¹⁴). Similar results were observed in GBM tissue samples from Stanford (n = 360) and the Mayo Clinic (n = 60) when compared with the normal tissue samples (Supplementary Table 4).
Fig. 4 |. BRD8 and H2AZ are highly expressed in proliferating GBM cells that have compromised p53 target expression.
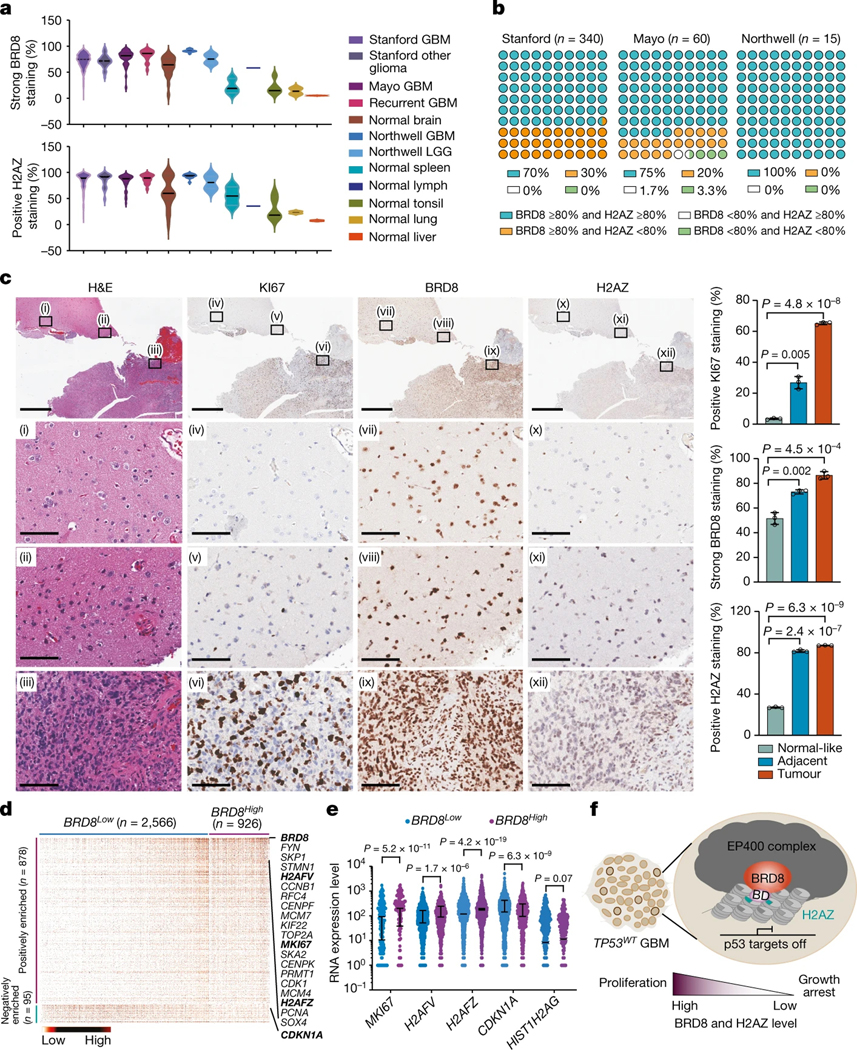
a, Violin plots depicting the percentage of strong staining for BRD8 (top) and positive staining for H2AZ (bottom) in glioma and normal tissue samples from Stanford University (Stanford), the Mayo Clinic (Mayo) and Northwell Health (Northwell). b, Percentage dot plot showing expression of both BRD8 and H2AZ in GBM tissues from the three different sources. c, Left, H&E and immunohistochemical staining for KI67, BRD8 and H2AZ in GBM specimens from patients (TDPG1439 TP53WT). The top shows-low magnification views, with the boxed regions enlarged below to show representative normal-like ((i), (iv), (vii), (x)), low-grade ((ii), (v), (viii), (xi)) and highly proliferative ((iii), (vi), (ix), (xii)) zones. Scale bars, 100 μm (bottom 3 rows) or 2 mm (top row). Right, The percentage scores of cells expressing KI67, H2AZ and BRD8 are from three different areas within each phenotypic category. Plotted is the mean ± s.d. P values were calculated using two-tailed unpaired Student’s t-tests. d, Heatmap displaying single-cell analyses of significantly differentially expressed proliferation-related genes (ranked by P value) comparing BRD8Low (not expressed; n = 2,566) and BRD8High (expressed; n = 926) subgroups. Each column represents a profiled single cell isolated from patients with GBM. Key genes are highlighted in bold. e, Comparison of MKI67, H2AFV, H2AFZ and CDKN1A gene expression between BRD8Low and BRD8High subgroups in single GBM cells. HIST1H2AG served as a control. P values were calculated using two-tailed unpaired Student’s t-tests. f, Schematic depicting the role of BRD8 in TP53WT GBM. BRD8 drives the EP400 complex as a barrier to restrain p53 targets by sequestering H2AZ and enforcing a compact chromatin state through its bromodomain (BD). High-level expression of BRD8 and H2AZ promotes cellular proliferation, whereas low expression triggers growth arrest in TP53WT GBM cells. Highlighted within the tumour mass are proliferating GBM cells.
We next examined the expression of both BRD8 and H2AZ across GBM specimens. More than 70% of all GBM specimens analysed contained >80% of cells that were positive for both BRD8 and H2AZ in TMAs (from Stanford and the Mayo Clinic) and in individual GBM specimens (from Northwell Health) (Fig. 4b). BRD8 and H2AZ were also highly expressed in proliferating GBM cells, along the pseudopalisading regions, which contained the most proliferating tumour cells positive for KI67 (encoded by MKI67) (Extended Data Fig. 10c). Both KI67 and BRD8 were absent in necrotic cells surrounded by pseudopalisades, whereas H2AZ was highly expressed in necrotic cells, which suggests that H2AZ has multifaceted functions in different cellular processes. Moreover, BRD8 and H2AZ levels were significantly increased in KI67-positive aggressive tumour tissues compared with normal-like or adjacent areas (Fig. 4c and Extended Data Fig. 10d–f).
Next we analysed single-cell RNA-seq (scRNA-seq) data of 3,589 single cells isolated from tumour tissue of patients with GBM41. We generated a signature with 1,711 proliferation-related genes from the Molecular Signature Database v.6.2 (MSigDB), excluding cells expressing fewer than 100 genes of this signature. A set of 3,492 single cells passed this quality control step, which were then divided into BRD8Low and BRD8High subgroups (Supplementary Table 5). H2AFZ, H2AFV and MKI67 were significantly enriched in BRD8High GBM cells, whereas CDKN1A was significantly enriched in BRD8Low GBM cells (Fig. 4d,e). This finding was reproduced with a separate dataset of 92 GBM samples (Extended Data Fig. 10g–i). Taken together, the above analyses are consistent with an oncogenic role of BRD8 and H2AZ in maintaining the proliferation of human TP53WT GBM (Fig. 4f).
Discussion
As guardian of the genome, p53 is one of the most frequently dampened tumour suppressors in nearly all human cancers. Consequently, restoration of the function of p53 is of great therapeutic value, as has been supported by animal studies in which reactivation of TP53WT leads to efficient tumour regression42,43. Here we identified BRD8 as an epigenetic vulnerability for TP53WT GBM, which to our knowledge has not been previously associated with this brain malignancy. Our findings demonstrated that BRD8 bypasses p53 tumour suppressive activity by enforcing a compact chromatin conformation to restrain the accessibility of p53 to its targets. This is achieved through the bromodomain of BRD8 sequestering H2AZ, an H2A variant that has been linked to transcriptional repression and heterochromatin formation30,31,44–46. As such, targeting the bromodomain of BRD8 releases H2AZ, remodels chromatin structure and restores transactivation of cell cycle regulators by intrinsically functional p53. Notably, BRD8 was the most specific component of the large EP400 complex that it works with in overcoming p53-dependentproliferative control. Moreover, this study identified the bromodomain of BRD8 among the entire set of bromodomains encoded by the human genome as the most promising selective target for TP53WT GBM. This motif has been proven druggable through the use of bromodomain inhibitors in human cancers47,48. In addition, the fact that BRD8 regulates p53 through a distinct mechanism from MDM2 suggests that there may be synergistic effects of targeting both BRD8 and MDM2 to overcome reversible cell cycle arrest and the severe toxicity to normal cells that is caused by MDM2 inhibition49. Taken together, this study revealed that TP53WT GBM is sensitive to BRD8 depletion, which provides an encouraging way to awaken the sleeping guardian p53 in the majority of GBM cases.
Online content
Any methods, additional references, Nature Portfolio reporting summaries, source data, extended data, supplementary information, acknowledgements, peer review information; details of author contributions and competing interests; and statements of data and code availability are available at https://doi.org/10.1038/s41586-022-05551-x.
Methods
Cell culture
A382, A172, U87, U343, LN464, U118, U251 and U373 (GBM cell lines), A549 (non-small-cell lung cancer cell line), RH30, RD, CTR and RH4 (rhabdomyosarcoma cell lines), and HEK293T cells were cultured in DMEM supplemented with 10% FBS. NCI-H526, NCI-H211, NCI-H524.2, DMS114, NCI-H446 and NCI-H82 (small-cell lung cancer cells lines), MOLM-13, NOMO-1, HEL and K562, SET-2 (leukaemia cells lines), AsPC-1, CFPAC-1, SUIT-2, BxPC-3, MIAPaca-2 and PANC-1 (pancreatic ductal adenocarcinoma cells lines) cells were cultured in RPMI supplemented with 10% FBS. NCI-H1048 (small-cell lung cancer) was cultured in DMEM/F-12 supplemented with 0.005 mg ml−1 insulin, 0.01 mg ml−1 transferrin, 30 nM sodium selenite, 10 nM hydrocortisone, 10 nM β-oestradiol, 4.5 mM L-glutamine and 5% FBS. SK-Hep1 and HEPG2 (hepatocellular carcinoma cell lines) cells were cultured in EMEM supplemented with 10% FBS. Mouse NIH3T3 cells were cultured in DMEM with 10% bovine calf serum. Mouse QX1539 and QE1589 (glioma cell lines) cells were cultured in neurobasal medium supplemented with EGF (20 ng ml−1), FGF2 (20 ng ml−1) and B27 (1×). All media were supplemented with penicillin and streptomycin. Cells were cultured at 37 °C with 5% CO2, and were periodically tested and shown to be mycoplasma negative. All cell lines were subjected to short tandem repeat testing and their identity was confirmed.
Patient and xenograft glioma samples
MN03 and MN06 GBM cells were isolated from patient specimen tissue provided by Northwell Health. In brief, at the time of surgery, tumour tissues were cut into small pieces, delivered in tubes containing DMEM/F-12 medium on ice and processed within several hours after surgery. Several hundred milligrams of tissue was thoroughly minced using a scalpel, washed twice with antibiotics in a 15 ml tube and enzymatically digested using 5 ml 0.05% trypsin-EDTA at room temperature under rotation for 15 min or longer, if necessary. Samples were then diluted with 2 volumes of DMEM/F-12 medium and filtered to remove undigested material using a 40-μm cell strainer, followed by two washes with DMEM/F-12 medium. The cell pellet was resuspended in 5 ml DMEM/F-12, slowly transferred onto a cushion of 5 ml of Lympholyte-M and spun at 1,200g for 20 min at room temperature. The interface layer containing nucleated cells was transferred into a 15 ml tube and washed 3 times with 10 ml DMEM/F-12. The final cells were either cryopreserved in Recovery Cell freezing medium or cultured in 1:1 neurobasal-A/DMEM/F-12 medium supplemented with HEPES (10 μM ml−1), MEM sodium pyruvate (1×), MEM non-essential amino acids (1×), GlutaMAX-1 (1×), B27 (1×), EGF (20 ng ml−1), FGF2 (20 ng ml−1), PDGF-AA (10 ng ml−1), PDGF-BB (10 ng ml−1) and heparin (2 μg ml−1). G108, G46, G6, G12, G117 and G123 GBM cells—which were cultured in KnockOut DME/F-12 basal medium supplemented with StemPro NSC SFM, EGF (20 ng ml−1), FGF (20 ng ml−1) and GlutaMAX-1 (1×)—and G59 GBM cells—which were cultured in DMEM supplemented with 10% FBS—were obtained from the Mayo Clinic through a material transfer agreement. Tumour stage was defined according to the American Joint Committee on Cancer and International Union against Cancer classification system. All procedures were approved by the institutional ethics committee and all enrolled participants provided written informed consent.
Mouse models
All animal procedures and studies were approved by the Cold Spring Harbor Laboratory Animal Care and Use Committee according to the Association for Assessment and Accreditation of Laboratory Animal Care guidelines.
Plasmid construction
All Cas9-expressing cell lines used in this study were derived through lentiviral transduction with a 5′-Flag-tagged human-codon optimized Cas9 expression vector (EFS-Cas9-P2A-Puro, Addgene, 108110). Individual sgRNAs were cloned into lentiviral expression vectors with an optimized sgRNA scaffold backbone: either LRG2.1 (U6-sgRNA-GFP, Addgene, 108098) or LRNeo2.1 for targeting human genes, or LRG (Addgene, 65656) for targeting mouse genes. The LRNeo2.1 vector was derived from LRG2.1 by replacing the original GFP with a neomycin-resistance (Neo) cassette using the In-Fusion cloning method. In brief, for each individual sgRNA construct, two reverse complimentary sgRNA oligonucleotides with added backbone sequences were annealed and phosphorylated with T4 PNK, followed by ligation into BsmB1-digested LRG2.1, LRNeo2.1 or LRG vector using T4 DNA ligase. To improve transcription efficiency driven by the U6 promoter, an additional 5′ G nucleotide was added to all sgRNA sequences that did not already have a 5′ G nucleotide. The retroviral MSCV-miR30-PGK-NeoR-IRES-GFP (LMN) vector50 was used for knockdown experiments. In brief, individual shRNA DNA fragments with 5′ XhoI and 3′ EcoRI restriction sites were amplified from templates and cloned into the LMN vector. Sequences of all sgRNAs and shRNAs used for this study are provided in Supplementary Table 6. The LentiV_Neo vector (Addgene, 108101) was used to express cDNAs for rescue experiments. Wild-type BRD8 cDNA was amplified from the U87WT cell line using Phusion Flash High-Fidelity PCR master mix. A 3×-Flag tag was added to either the N or C terminus of BRD8 cDNA. CRISPR-resistant synonymous mutant and bromodomain-deleted cDNAs of BRD8 as indicated were amplified from wild-type cDNA and cloned into the LentiV_Neo vector using the In-Fusion cloning system. For the Flag-tagged IP–MS and ChIP-seq experiments, wild-type BRD8 cDNA was cloned into a pHAGE-puro vector (a gift from Z. Huang, Wuhan University, China) containing a 3× C-terminal Flag tag. For the inducible expression of p53, a pCW-p53 vector was constructed by replacing the original Cas9 in a pCW-Cas9 vector (Addgene, 50661) with TP53 cDNA amplified from the U87 cell line. TP53 cDNA was also cloned into the pHAGE-puro vector for dual luciferase reporter assays. The LV_AkaLuc vector used for brain orthotopic transplantation was constructed using synthesized firefly luciferase mutant protein AkaLuc (GenBank, LC320664.1) purchased from Genscript. A schematic of the final construct (PGK-Aka-Strawberry-Puro) is shown in Extended Data Fig. 2k, top, which includes the following key elements: PGK, phosphoglycerate kinase 1 promoter; Puro, puromycin resistance gene; EF1, EF1α promoter; AkaLuc, Aka luciferase; T2A, a 2A self-cleaving peptide; mStrawberry, a basic red fluorescent protein. The Stbl3 bacteria strain was used for the transformation of all constructs (Supplementary Table 7).
Construction of the sgRNA libraries
The human chromatin remodelling domain-focused sgRNA library was designed on the basis of conserved domain annotation information retrieved from the NCBI database. Five to six independent sgRNAs per domain region were designed to target 196 chromatin-regulating domains. All sgRNAs were generated using the same design principle as previously reported, and sgRNAs predicted to have a high off-target effect were excluded51. For the exon-tiling sgRNA library, all the sgRNAs were designed as previously described52. The library contains all the specific sgRNAs that target the coding exons of all the isoforms of human BRD8 in the NCBI database. Off-target score was assessed for each sgRNA with up to three mismatches. Both positive and negative controls and gene-targeting sgRNAs were synthesized in duplicate or triplicate in a pooled format on an array platform (Twist Bioscience) and then PCR cloned into the Bsmb1-digested LRG2.1 vector using a Gibson Assembly kit (NEB, E2611). To ensure the representation and identity of each individual sgRNA in the pooled lentiviral plasmids, deep-sequencing analyses were performed on a MiSeq instrument (Illumina) and were shown to verify that 100% of the designed sgRNAs had been cloned into the LRG2.1 vector and the abundance of >95% of the sgRNA constructs was within fivefold of the mean (data not shown). All sgRNAs in these two libraries, including positive and negative controls, are shown in Supplementary Table 6.
Virus transduction
Lentivirus was produced in HEK293T cells by transfecting lentiviral plasmids with helper packaging plasmids (pVSVG and psPAX2 (Addgene, 12260)) using polyethylenimine (PEI 25000) transfection reagent. HEK293T cells were seeded 1 day before transfection at about 80% confluency. For transfection in 10 cm dishes, 10 μg of plasmid DNA, 5 μg of pVSVG, 7.5 μg of psPAX2 and 30 μl of 1 mg ml−1 PEI were mixed for each plate and added to HEK293T cells. Retrovirus was produced in Plat-E cells by transfecting retroviral plasmids with pVSVG plus Eco helper plasmids at a ratio of 10:1:1.5. For both transfections, a fresh medium change was performed 6–8 h after transfection, and virus-containing supernatant was collected and pooled at 24, 48, 72 and 96 h after transfection. For infection, target cells were mixed with virus plus 8 μg ml−1 polybrene, followed by centrifugation at 1,500 r.p.m. for 30 min at room temperature. Medium was changed 24 h after infection. GFP was detected using a Guava Easycyte HT instrument (Millipore) 48 h after infection. Antibiotics (1 μg ml−1 puromycin and/or 1 mg ml−1 G418) were added 48 h after infection when needed.
Pooled CRISPR negative-selection screening
Domain-focused CRISPR screens were performed in a panel of cell lines covering several cancer types. Cas9 was stably expressed in these cells through the transduction of the LentiV_Cas9_puro vector (Addgene, 108110). Lentivirus of the pooled sgRNA library targeting chromatin-modifying domains was produced as described above. To ensure transduction of a single sgRNA per cell, the multiplicity of infection was set to <0.3. To maintain the representation of sgRNAs during the screening steps, the number of cells was kept 1,000 times greater than the sgRNA number in the library. Cells were collected at initial (day 3 after infection) and final (14 doubling times after infection) time points. Genomic DNA was extracted using QIAamp DNA mini kits (Qiagen) according to the manufacturer’s instructions. Sequencing libraries were constructed as previously described20. In brief, to quantify sgRNA abundance of the initial and final time points, the sgRNA cassette was amplified by PCR from corresponding genomic DNA using Phusion Flash High-Fidelity PCR master mix (F548L), followed by end-repair with T4 DNA polymerase (NEB, M0203L), DNA polymerase I, large (Klenow) fragment (NEB, M0210L) and T4 polynucleotide kinase (NEB, M0201L). A 3′ A-overhang with Klenow fragment (3′–5′ exo-) (NEB, M0212L) was next added to the ends of blunted DNA fragments. The DNA fragments were then ligated with diversity-increased custom barcodes using a Quick ligation kit (NEB, M2200L) and PCR-amplified with Illumina paired-end sequencing adaptors. The final barcoded libraries were quantified using a Bioanalyzer Agilent High Sensitivity DNA kit (Agilent, 5067–4626), pooled together in equal molar ratios and analysed by paired-end sequencing using a MiSeq Reagent kit v.3 (Illumina). The sequence data were de-multiplexed and trimmed to contain only the sgRNA cassettes and subsequently mapped to the reference sgRNA library without allowing any mismatches as previously described19. Individual sgRNAs with fewer than 50 read counts at the initial time points were discarded. The total read counts of the remaining sgRNAs were normalized to each sample. Average log2(fold change) values in the abundance of all sgRNAs targeting a given domain were calculated, as previously described20. GBM-specific dependency was determined by subtracting the average of log2(fold change) in GBM cell lines from the average in non-GBM cell lines after removal of pan-essential domains; similarly, p53-specific dependency was determined by subtracting the average of log2(fold change) in TP53WT GBM cell lines. The exon-tiling CRISPR screening was performed in A382WT cells following the same procedures as described above. The chromatin-remodelling CRISPR screening and exon-tiling data are provided in Supplementary Table 2.
Competition-based cell-proliferation assay
Parental or Cas9-expressing human cancer cell lines were infected with shRNA or sgRNAs linked to a GFP reporter (LRG2.1T, Addgene, 108098), respectively. The percentage of GFP-positive cells was measured every 3–4 days from day 3 after infection (initial time point) using a Guava EasyCyte HT instrument (Millipore), with each percentage of GFP over a time course being normalized to the initial percentage of GFP (30–70%). The average percentage of GFP-positive cells of two to three independent sgRNAs was used to calculate sgRNA-positive cell populations.
Flow cytometry
A382 cells infected with lentiviral LRG2.1T control sgNeg or BRD8-specific sgRNAs (sgBRD8–1 and sgBRD8–2) were collected 3–10 days after infection. Cell cycle profiles were assessed using propidium iodide staining following the manufacturer’s protocol. In brief, 1 × 10⁶ cells per sample were fixed with ice-cold ethanol, washed with cold 1× PBS and resuspended in 0.5 ml of FxCycle PI/RNase staining solution (Thermo Fisher Scientific). After incubation for 15–30 min at room temperature (protected from light), samples were subjected to flow cytometry using 488 nm excitation on a BD LSR Dual Fortessa Cell Analyzer platform. Data were analysed using FlowJo (Becton Dickinson). Note that fixed cells were stored at 4 °C until all samples were ready and processed together.
Western blotting
Cells were resuspended in RIPA cell lysis buffer with protease inhibitor cocktail (Sigma-Aldrich), incubated for 30 min on ice and centrifuged at 13,000g for 15 min. The supernatants were collected, quantified using a BCA Protein Assay kit (Thermo Fisher Scientific) and then mixed with 2× Laemmli sample buffer (Bio-Rad) containing 5% 2-mercaptoethanol and boiled for 5 min at 95 °C. The whole cell extracts were loaded onto SDS–PAGE gels, followed by transfer of proteins to nitrocellulose membranes. Membranes were blocked with 5% nonfat milk in TBST, incubated with indicated primary antibodies in 5% nonfat milk at 4 °C overnight and washed 3 times with TBST before incubation with HRP-conjugated secondary antibody for 1 h at room temperature. SuperSignal West Dura Extended Duration substrate (Thermo Fisher Scientific) was used for detection. The raw gel data are provided in Supplementary Fig. 8.
IP–MS analysis
For IP–MS experiments, 100 × 106 A382WT GBM cells stably expressing pHAGE-puro or pHAGE-BRD8-C3×FLAG were resuspended in 5 ml cell lysis buffer (10 mM Tris-HCl pH 8.0, 420 mM NaCl and 0.1% NP-40), supplemented with protease inhibitor cocktail. After 5 cycles of freeze–thaw steps (dry ice/ethanol and water bath at 37 °C), cells were treated with 125 units of benzonase nuclease (Sigma) for 20 min at 4 °C with rotation. Cellular debris was removed by centrifuging at 13,000 r.p.m. for 30 min at 4 °C, followed by the addition of 3 volumes of no-salt cell lysis buffer. Anti-Flag M2 affinity agarose gel (100 μl; Sigma) was added to the cell lysates and rotated for 3 h at 4 °C. Beads were spun down at 3,000 r.p.m. for 30 s, washed 5 times with low-salt cell lysis buffer (10 mM Tris-HCl pH 8.0, 150 mM NaCl and 0.1% NP-40), resuspended in 100 μl low-salt cell lysis buffer with 0.5 mg ml−1 3×Flag peptide and then rotated for 2 h at 4 °C. The aqueous phase was collected and precipitated using trichloroacetic acid (TCA), washed once with 10% TCA and twice with ice-cold acetone and subjected to MS analysis. MS and data analyses were performed at the Taplin Mass Spectrometry Facility at Harvard University (Supplementary Table 3). For IP experiments, 20 × 106 A382WT GBM cells stably expressing pHAGE-puro or pHAGE-BRD8-C3×FLAG were lysed in 1 ml lysis buffer (10 mM Tris-HCl pH 8.0, 150 mM NaCl, 1% NP-40 and 5% glycerol), supplemented with protease inhibitor cocktail and incubated on ice for 30 min. After treatment with micrococcal nuclease and centrifugation to remove debris at 13,000g, 50 μl of whole cell lysates were saved for input samples, and the rest of the lysates were mixed with 100 μl anti-Flag M2 magnetic beads (Sigma) followed by rotation overnight at 4 °C. The magnetic beads were collected using a magnetic separator and washed with lysis buffer six or more times. Immunoprecipitated proteins were then eluted by boiling with 2× SDS sample buffer, and samples were subjected to western blot analyses to detect various proteins as indicated.
RNA-seq library preparation
Total RNA from GBM cells was extracted using TRIzoI (Thermo Fisher Scientific). In brief, 1–5 × 10⁶ cells were resuspended in 1 ml TRIzoI, incubated for 5 min at room temperature, followed by the addition of chloroform and incubating for 5 min at room temperature. The aqueous phase was collected after spinning at 13,000g for 15 min at 4 °C. RNA was pelleted by adding 500 μl isopropanol and centrifuging at 13,000g for 15 min at 4 °C. After washing with 75% ethanol, RNA was dissolved in RNase-free water. A total of 1 μg of RNA from each sample was used for RNA-seq library preparation using TruSeq Stranded mRNA Library Prep kits (Illumina) according to the manufacturer’s protocol. In brief, polyA RNA was selected using RNA purification beads and fragmented enzymatically. The first strands of cDNAs were synthesized using Super Script II reverse transcriptase, and the second strands were synthesized using master mix. Double-stranded cDNA was then 3′-adenylated, ligated with index adaptors and PCR-amplified. The final RNA-seq library was quantified using Bioanalyzer Agilent DNA 1000 chips, pooled with distinctly barcoded libraries and analysed by single-end 76-bp sequencing using an Illumina NextSeq platform.
RNA-seq data analysis
Raw sequencing reads were mapped to the reference human genome (hg19) using TopHat2 (ref. 53). Differentially expressed genes were analysed using Cufflinks54 by masking structural RNAs55. The genes with reads per kilobase per million (RPKM) of more than 0.5 in the control were considered as expressed and used in subsequent analyses. The fold-change in RPKM was calculated from biological replicates of control (empty vector or sgNeg) and experimental samples (cDNA overexpression vector or two independent sgRNAs targeting one indicated gene). GSEA was performed following the instructions using all available signatures in the MSigDB (v.62)56 or the custom signatures from this study. For the custom gene signatures, genes that had an average fold-change of more than 1.5 after BRD8 depletion by two independent sgRNAs (sgBRD8–1 and sgBRD8–2) and an average fold-change more than 4 after doxycycline-induced p53 overexpression were used for defining the correlation between BRD8 and p53, the correlation between BRD8 and other components of the EP400 complex, and the correlation between p53 and components of EP400 complex. The bulk RNA-seq dataset with a total of 166 human GBM participants was downloaded from The Cancer Genome Atlas (TCGA) database, with 49 having TP53 mutations (TP53Mut). The remaining 117 TP53WT GBM specimens were ranked by BRD8 expression level, and the top and bottom 30% samples were then assigned as TP53WTBRD8High (n = 35) and TP53WTBRD8Low (n = 35) subgroups, respectively. The expression level of CDKN1A was compared within TP53Mut, TP53WTBRD8Low and TP53WTBRD8High groups. The bulk RNA-seq datasets for LGG samples were obtained from TCGA Firehose (n = 286) and PanCancer Atlas (n = 515) studies, with samples assigned into TP53Mut, TP53WTBRD8Low and TP53WTBRD8High groups using the same strategy as for the GBM samples. The single-cell sequencing data for GBM cells isolated from patients was downloaded from the Gene Expression Omnibus (GEO) database. A list containing a total of 1,711 proliferation-related genes, including H2AFZ, H2AFV, MKI67, BRD8 and CDKN1A, was generated by combining annotated signatures from the MSigDB. A total of 1,701 genes were found in dataset GSE84465. By filtering out cells that expressed fewer than 100 of the 1,701 genes, 3,492 out of 3,589 cells were used for further analysis. Overall, 926 cells expressing BRD8 were assigned as the BRD8High group, whereas the rest of the 2,566 cells were assigned as the BRD8Low group. By comparing gene expression levels between the BRD8Low and BRD8High groups, 878 genes were positively clustered into the BRD8High group, whereas 95 were negatively enriched in the BRD8Low group. For dataset GSE121720, 1,601 out of the 1,701 genes were matched and used for subsequent analysis. All 92 samples were ranked by BRD8 expression level, and the top and bottom 25% samples were assigned as the BRD8High and BRD8Low groups, respectively. Expression levels of the 1,601 genes were compared between the BRD8High and BRD8Low groups, and 609 genes were positively associated with BRD8 level, whereas 169 negatively associated with BRD8 level.
qPCR with reverse transcription
Total RNA for each sample was extracted using TRIzoI (Thermo Fisher Scientific). In brief, 1–5 × 10⁶ cells were lysed in 1 ml TRIzoI for 5 min at room temperature, followed by incubating with chloroform for 5 min at room temperature. The aqueous phase was collected after centrifuging at 13,000 r.p.m. for 15 min at 4 °C. RNA was precipitated using 500 μl isopropanol, the pellet was washed with 75% ethanol and then dissolved in RNase-free water. RNA (1–5 μg) from each sample was treated with DNaseI and reverse-transcribed into cDNA using Super-Script III (Thermo Fisher Scientific) according to the manufacture’s protocol. PCR with reverse transcription was performed using Applied Biosystems Power SYBR Green master mix (Thermo Fisher Scientific) on an ABI 7900HT Fast System Real-time PCR machine. All the plotted gene expression data are normalized to GAPDH.
ChIP-seq and ChIP–qPCR
For the ChIP-seq experiments, cells were collected, crosslinked with 1% formaldehyde for 12 min at room temperature and quenched with 0.125 Mglycine for 10 minatroomtemperature. After one washwith PBS, 5 × 10⁶ cells were resuspended in 1 ml cell lysis buffer (10 mM Tris-HCl pH 8.0, 10 mM NaCl, 0.2% NP-40 and protease inhibitor) and incubated for 10 min on ice. Nuclei were collected by centrifugation at 4,200 r.p.m. for 30 s, lysed in 500 μl nuclei lysis buffer (50 mM Tris-HCl pH 8.0, 10 mM EDTA, 1% SDS and protease inhibitor) for 15 min on ice and sonicated using a Bioruptor (Diagenode) for 15 min at 4 °C with the following settings: low intensity, on/off for 30 s, for 15 cycles. The sonicated chromatin was centrifuged at 13,000 r.p.m. for 15 min at 4 °C. A total of 50 μl of the supernatant was stored at 4 °C as input chromatin DNA. The rest of the supernatant was diluted with 3.5 ml IP dilution buffer (20 mM Tris-HCl pH 8.0, 2 mM EDTA, 150 mM NaCl, 1% Triton X-100 and 0.01% SDS), incubated with the indicated antibody for 2–4 h at 4 °C and then rotated together with 30 μl of Protein A or G magnetic beads at 4 °C overnight. The following day, beads were washed once with IP wash buffer I (20 mM Tris-HCl pH 8.0, 2 mM EDTA, 50 mM NaCl, 1% Triton X-100 and 0.1% SDS), twice with high-salt buffer (20 mM Tris-HCl pH 8.0, 2 mM EDTA, 500 mM NaCl, 1% Triton X-100 and 0.01% SDS), once with IP wash buffer II (10 mM Tris-HCl pH 8.0, 1 mM EDTA, 250 mM LiCl, 1% NP-40 and 1% sodium deoxycholate) and twice with TE buffer (50 mM Tris-HCl pH 8.0, and 10 mM EDTA). Immunoprecipitated chromatin (ChIP DNA) was eluted in 200 μl elution buffer (50 mM Tris-HCl pH 8.0, 10 mM EDTA and 1% SDS) by incubation at 65 °C for 15 min. Input DNA was brought up to a final volume of 200 μl with TE buffer and then reverse-crosslinked together with ChIP DNA using 12 μl of 5 M NaCl and 1 μg ml−1 RNase A in a 65 °C water bath overnight, followed by treatment with 4 μg ml−1 proteinase K at 42 °C for 2 h and purification using a MinElute PCR purification kit (Qiagen). Note that 100 × 106 A382 GBM cells stably expressing 3×Flag-tagged BRD8 using either the pHAGE-BRD8-C3×Flag vector or inducibly expressing Flag-tagged p53 using the pCW-p53 vector were used for BRD8 and p53 ChIP-seq experiments, respectively. Five million parental cells or control cells infected with sgNeg or BRD8-deficient cells infected with sgBRD8–2 were used for each of the histone ChIP-seq assays. Final chromatin DNA was eluted in 60 μl H2O. For ChIP–qPCR experiments, 20 × 106 of the aforementioned cells (4 reactions) were used for BRD8 and p53 immunoprecipitation, and 5 × 10⁶ cells were used for histone immunoprecipitation. Generally, chromatin DNA was prepared following the same procedure as for ChIP-seq experiments, except that in addition to saving input samples as positive controls, the sonicated chromatin supernatant was divided into two equal parts: one for a particular antibody, the other for normal IgG to serve as a negative control. For each sample, input, ChIP DNA and IgG were used for qPCR to determine enrichment of indicated genes. Primer sequences used for ChIP–qPCR are provided in Supplementary Table 6.
ChIP-seq library construction
ChIP-seq libraries were constructed using a TruSeq ChIP Sample prep kit (Illumina) following the manufacturer’s instruction. In brief, 50 μl of ChIP DNA was end-repaired, 3′-adenyl tailed, and then ligated with different index adaptors. The adaptor-ligated DNA was size selected (250–300 bp) using agarose gel electrophoresis, followed by PCR amplification. The amplified DNA was purified with AMPure XP beads (Beckman Coulter). The quality of the ChIP-seq libraries was checked using a Bioanalyzer with high-sensitivity DNA chips (Agilent). ChIP-seq libraries were pooled and sequenced using an Illumina NextSeq platform with single-end reads of 76 bases.
ChIP-seq data analysis
The raw sequencing reads were mapped onto the reference human genome hg19 using Bowtie2 (ref. 57). Peak calling was conducted using MACS2 software with 5% false discovery rate (FDR) cut-off values for narrow peak or broad peak options for BRD8, p53 and histones58. ChIP-seq tracks were generated using the UCSC genome browser59. Heatmap density plot and metagene plots were generated using ±5 kb around each centre of BRD8 and H2AZ peaks. For transcription factor binding motif analysis of 500 bp around the centre of p53-binding regions, the MEME web tool was used. GO analyses of annotated regions were performed using the website tool http://geneontology.org. The GO database used was released in July 2019, and GO terms that contained more than 50 total genes were used for analyses. A FDR value of <0.05 was considered significant.
ATAC-seq library construction
Atotalof5 × 105cellswerecollectedandwashedwithice-coldPBS,followed by suspending in 500 μl cold lysis buffer (10 mM Tris-HCl pH 7.4, 10 mM NaCl, 3 mM MgCl2, 0.1% NP40 or IGEPAL CA-630 and 0.1% Tween-20). Lysed cells (50 μl) were transferred to a PCR tube and subjected to tagmentation using 25 μl TD buffer, 22.5 μl H2O and 2.5 μl transposase at 37 °C for 30 min. Tagmented chromatin was purified using MinElute kits and eluted in 20 μl H2O, followed by amplification using 2× KAPA HiFi HotStart Readymix (72 °C for 5 min, 98 °C for 3 min, 12 cycles of 98 °C for 20 s, 65 °C for 15 s, and 72 °C for 60 s, hold at 4 °C.). Amplified libraries were purified using MinElute columns and quantified with a Bioanalyzer using high-sensitivity DNA chips (Agilent). ATAC-seq libraries were pooled and sequenced using an Illumina NextSeq platform with paired-end reads of 50 bases.
ATAC-seq data analysis
The raw sequencing reads were evaluated using Fastq and mapped onto the reference human genome hg19 using Bowtie2 (ref. 57). Peak calling was conducted using MACS2 software with 5% FDR cut-off values for narrow peak or broad peak options for open chromatin regions58. ATAC-seq tracks were visualized using the UCSC genome browser59. Metagene plots were generated using ±5 kb around each centre of BRD8-associated and p53-associated peaks.
Microscopy and imaging
Cells were grown on Nunc Lab-Tek chamber slides (Thermo Fisher Scientific, 177402) until 80% confluency, washed with PBS and fixed with 4% paraformaldehyde (PFA; freshly made in PBS) for 20 min at room temperature. After 3 washes with PBS, cells were permeabilized with ice-cold 0.5% TritonX-100 in PBS for 5 min on ice, followed by incubation with freshly made 1% BSA in PBS with 3% goat serum for 1 h at room temperature. A BRD8 antibody (Abcam, Ab17969, 1:200) or a p53 antibody (Santa Cruz Biotechnology, SC-126, 1:100) was added and incubated overnight at 4 °C. After 3 washes with PBS, the secondary antibodies Alexa Fluor 633 goat anti-rabbit IgG (H+L) (1:1,000) and Alexa Fluor 488 goat anti-mouse IgG (H+L) (1:1,000) were incubated for 1 h at room temperature. Slides were counterstained with DAPI (10 mg ml−1 stock, 1:10,000, diluted in PBS) for 15 min at room temperature, washed once with PBS, mounted with coverslips using a minimal volume of the EverBrite Mounting Medium (Biotium) and stored in the dark at 4 °C. Fluorescence was detected using a Zeiss confocal microscope with a ×20 objective and analysed using Volocity software.
MTT assay
To assess p53 activity, cells were seeded onto 12-well plates, followed by treatment with either DMSO or Nutlin-3a (5 μg ml−1). After 3 days of incubation, cells were grown in fresh medium with MTT solution for 4 h at 37 °C, followed by solubilization in 200 μl DMSO. The absorbance of the final purple formazan solution was detected using a microplate reader (BioTek) at a wavelength 540 nm. For CRISPR-mediated depletion experiments, cells were infected with the sgRNAs sgNeg, sgCDK1, sgBRD8–1 or sgBRD8–2) for human cells, or with sgNeg2, sgRpa3, sgBrd8–1 or sgBrd8–2 for mouse cells using GFP-expressing LRG2.1T or LRG vector, respectively. The percentage of GFP-positive cells was assessed using Guava (Millipore) 3 days after transfection to ensure over a 90% infection efficiency had been achieved. Three to four doubling times after transfection, cell concentrations were evaluated using MTT treatment as described above. Triplicate wells were prepared for each sample.
SA-β-gal assay
Cas9-expressing GBM cells were infected with lentiviral sgRNAs as described above and plated in 6-well tissue culture dishes. At 6 or 10 days after infection, cells were washed with PBS, fixed with 0.5% glutaraldehyde solution (in PBS) for 15 min at room temperature, washed twice with PBS and MgCl2(pH 6.0), followed by addition of SA-β-gal staining solution and incubation for several hours to overnight at 37 °C as previously described60. Dishes were then washed 3 times with ddH2O and stored in the dark at 4 °C. SA-β-gal stock (40×) was prepared by dissolving 40 mg SA-β-gal (Sigma) in N,N-dimethylformamide (Sigma). KC solution (20×) was made by adding 0.82 g K3[Fe(CN)6] and 1.05 g K4Fe(CN)63H2O in 25 ml PBS. SA-β-gal staining solution was freshly prepared by diluting SA-β-gal and KC to 1× in PBS and MgCl2 buffer after usage. Images were taken using a Zeiss microscope.
Proximity ligation assay
The Duolink PLA fluorescence assays were performed according to the manufacturer’s protocol. In brief, cells were plated onto Nunc Lab-Tek chamber slides (Thermo Fisher Scientific, 177402) at 80% confluency. After 2 washes with PBS to remove residual medium, slides were fixed with 4% PFA (made fresh in PBS) for 20 min at room temperature and permeabilized with cold 0.5% TritonX-100 in PBS for 5 min on ice, then followed by a series of incubations: with blocking solution for 1 h at 37 °C, with primary antibody solution at the optimal dilution using the antibody diluent for overnight, with the Plus and Minus PLA probes diluted in the antibody diluent for 1 h, with ligation solution (1 μl ligase in 39 μl ligation buffer) for 30 min, and with amplification solution (0.5 μl polymerase in 39.5 μl amplification buffer) for 2 h. All incubations were performed in a humidity chamber at 37 °C, and two 5 min washes with 1× wash buffer A at room temperature was carried out in between each incubation. Slides were then washed twice for 10 min with 1× wash buffer B at room temperature, followed by one wash for 1 min with 0.01× wash buffer B at room temperature. Slides were mounted with coverslips using a minimal volume of the In Situ mounting medium plus DAPI and stored in the dark at 4 °C. Fluorescence was detected using a Zeiss confocal microscope with a ×20 objective and images were analysed using Volocity software.
Dual luciferase reporter assay
The genomic DNA sequence, including both upstream and downstream of the transcription start site, of CDKN1A (CDKN1A Pro; about 5 kb) was synthesized (GenScript) and cloned into pGL4.21 firefly plasmid digested with XhoI and HindIII. A total of 200 ng CDKN1A Pro-pGL4.21 plasmid and 20 ng pGL4.74 Renilla control plasmid, along with 200 ng of plasmid expressing p53, BRD8 or bromodomain-truncated BRD8 were transfected into U251 cells in a 96-well plate using PEI reagent. After 48 h, cells were lysed and measured by sequentially adding the Luciferase Assay reagent II for quantifying the firefly luminescence and Stop & Glo Reagent for Renilla luminescence according to the manufacturer’s instructions. Firefly luciferase activity was normalized to the activity of the internal control Renilla luciferase.
Recombinant protein purification and pull-down assay
Full-length BRD8 and a panel of bromodomains of BRD8 were cloned into a pGEX4T1 vector and fused with GST. BL21 cells transformed with these plasmids were inoculated in 5 ml LB medium supplemented with 100 μg ml−1 ampicillin and shaken overnight at 37 °C. Overnight cultures were expanded into 500 ml LB medium and grown at 37 °C until the OD600 reached about 0.6. Then the culture was induced with 0.5 mM isopropyl-β-d-thiogalactopyranoside (Roche, 10724815) and further grown for 4 h at 30 °C. Cells were spun down and resuspended in BC500 buffer (20 mM Tris-HCl pH 8.0, 500 mM KCl, 20% glycerol and 0.5 mM EDTA) with 2 mg ml−1 lysozyme (Sigma L6876), 1 mM DTT, 0.5 mM PMSF and protease inhibitor cocktail. The cell suspension was sonicated on ice, and after centrifugation, the cell lysate was incubated with 500 μl glutathione agarose beads at 4 °C overnight. After several washes with BC500 buffer and one wash with PBS, 20% glycerol, 1% NP-40 and 0.5 mM PMSF, glutathione agarose beads were collected and GST fusion recombinant proteins were eluted with 700 μl fresh reduced glutathione solution. Eluted recombinant proteins were further purified using an AKTA protein purification system. H2AZ or H2AZac peptides were dissolved in 50 mM Tris-HCl pH 7.5. A total of 20 μl of recombinant GST fusion proteins and 10 μl of 50 μM H2AZ or H2AZac peptides were incubated with 30 μl streptavidin beads overnight at 4 °C. After several washes with wash buffer (25 mM Tris-HCl pH 7.5, 75 mM KCl, 0.1% NP40, 0.1 mM EDTA, 5 mM MgCl2, 10% glycerol and 1 mM DTT), the pulled down proteins were eluted from streptavidin beads by adding 2× SDS loading dye and subjected to SDS–PAGE for detecting GST signals (Thermo Fisher Scientific, MA4–004, 1:10,000).
Immunohistochemistry
The human glioma TMAs used in this study were TA550, TA551, TA552 and TA-415 from Stanford University, and Sarkaria-TMA2B_Slide025 from The Mayo Clinic, including multiple normal tissues from diverse organs, such as brain, spleen, liver, lung, lymph and tonsil. The formalin-fixed paraffin-embedded slides of brain cancer tissues were obtained from Northwell Health, with 15 out of 18 being GBM specimens. The TMAs or GBM tissue slides were counterstained with haematoxylin and eosin (H&E), and analysed for expression using anti-BRD8 antibody (Atlas Antibodies, HPA001841, 1:100) or anti-H2AZ antibody (Abcam, Ab150402, 1:200). The H&E slides were used for morphological evaluation by H.V. Six tumour specimens from Northwell Health exhibiting typical GBM morphology were further analysed using an anti-KI67 antibody. Four of these specimens exhibited normal-like or less aggressive adjacent brain tissue with some infiltrating tumour cells. For the assessment of expression, both positivity and intensity of staining were scored using Aperio ImageScope software (Leica Biosystems), as well as manually by H.V. The intensity of staining was scored on a four-point scale as follows: 0, negative; 1, weak; 2, moderate; 3, strong. The percentage of each intensity category for BRD8, H2AZ and KI67 expression was also obtained from Image Scope software. The most viable tumour cell population was preferentially chosen for analysis, and at least three random regions were evaluated for calculating the average score, thereby avoiding cores of poor quality. Inter-observer disagreement cases were re-reviewed to reach a conclusive judgment. Images were analysed and processed using ImageScope software. All patients with GBM enrolled in the study from Northwell Health and the Mayo Clinic were documented as IDH1 wild-type GBM. All the patient specimens from Northwell Health (as depicted in Supplementary Table 4) were obtained under approval by the Institutional Review Board of North Shore University Hospital. All the GBM patient-derived xenograft cell lines were obtained from the Mayo Clinic through a material transfer agreement. For work being performed at Cold Spring Harbor Laboratory (CSHL), approval was issued by CSHL’s Institutional Review Board for the work being done on site. All patient material was de-identified, and researchers at CSHL cannot ascertain the identity of any participants.
Orthotopic brain transplantation
U87, A382 and U251 cells were firstly transduced with the lentiviral Cas9-expressing plasmid that provided blasticidin-resistance (LentiV-Cas9-Blast), followed by transduction with an Aka luciferase-expressing lentiviral plasmid (PGK-Aka-Strawberry-Puro) with puromycin resistance. Following blasticidin (10 μg ml−1) and puromycin (1 μg ml−1) selection, cells were infected with the lentiviral LRNeo2.1T vector targeting BRD8 (sgBRD8–2) or the negative control (sgNeg) and selected with G418 (1 mg ml−1) for 5 days. NOD SCID mice ( Jackson Laboratory, 005557, INSG) were ordered at 6 weeks of age, and injected when the animals were 8 weeks old. The brain coordinates used in this study were as follows: anterior–posterior, 0.5 mm; medial–lateral, 2.5 mm; and dorsal–ventral, 3 mm. In total, 1 × 10⁴ of U87 cells or 2 × 10⁵ of A382 and U251 cells suspended in 3 μl DMEM were used for each orthotopic injection. For detection of tumour progression, 100 μl of 30 mM substrate AkaLumine-HCl (Aobious, AOB9983) was injected per mouse intraperitoneally for imaging using an IVIS Spectrum system (Caliper Life Sciences). The 30 mM AkaLumine-HCl stock was prepared by dissolving 50 mg AkaLumine-HCl in 4.9 ml saline and storing aliquots at −80 °C. Images were analysed using IVIS Living Image software. All mice were regularly monitored and determined to be healthy at the beginning of each experiment, and anaesthetized animals were perfused with 4% PFA when they became moribund, according to guidelines from the Association for Assessment and Accreditation of Laboratory Animal Care and the Institutional Animal Care and Use Committee. The mouse brains were then fixed in 10% formalin after perfusion. All animal procedures were conducted in accordance with the Institutional Animal Care and Use Committee (number 18–15-12–1) at CSHL, in which animals should be euthanized based on the following criteria: more than 15% of weight loss; external tumours are more than 2 cm in size; rare movement for food and water; severe respiratory distress; or abdominal pain. All source data are provided in Supplementary Table 8.
Statistics and reproducibility
Statistical significance was evaluated using P values from unpaired two-tailed Student t-tests. Data are presented as the mean ± s.d. Significance was set to a P value of <0.05. Overall survival rates were calculated using the Kaplan–Meier method, and significance was determined using a log-rank test. All the micrographs shown are representatives from three independently conducted experiments, with similar results obtained.
Reporting summary
Further information on research design is available in the Nature Portfolio Reporting Summary linked to this article.
Data availability
The ChIP-seq and RNA-seq data generated in this study is available at the GEO database (https://www.ncbi.nlm.nih.gov/geo/) with accession number GSE158551. The RNA-seq data of GBM cells isolated from patient specimens are from datasets GSE84465 and GSE121720 in the GEO database.
Extended Data
Extended Data Fig. 1 |. TP53 status in GBM and CRISPR screens in diverse cell types.

a, Pie charts showing frequency of TP53 mutation in cBioPortal GBM patient cohorts. b, Kaplan-Meier survival curve showing overall survival after first diagnosis of GBM patients with or without TP53 mutation. P value was calculated by Log-rank (Mantel-Cox) test. c, Systematic statistics of p53 mutations across all p53 codons, with the x-axis showing p53 codons with annotation of conserved domains across the protein shown below, and the y-axis showing the frequency of mutation at each codon. TP53 mutation data was compiled from the TCGA database and previous publications. d and e, RT-qPCR showing CDKN1A expression in the GBM cell lines used for CRISPR screens (d) and the primary patient-derived xenograft GBM cells used for validation (e), as compared with non-malignant human brain-derived neural stem cells (BNSC). Plotted is the relative expression level normalized to GAPDH as the mean ± s.d. (n = 3 biologically independent samples). f and g, MTT-based proliferation assays in the indicated GBM cell lines (f), primary patient cells and xenograft cells (g). Cells were treated with the MDM2 inhibitor Nutlin-3a, and were subjected to MTT assays after three population doublings (normalized to DMSO, n = 3 biologically independent samples). P values were calculated using two-tailed unpaired Student’s t-tests. h, Work flow of CRISPR screens. i, Comparison of domain-focused CRISPR screen in this study with genome-wide CRISPR screen data from the DepMap (https://depmap.org/portal/) using the same cell lines across diverse cancer types.
Extended Data Fig. 2 |. Validation of BRD8 as a p53-dependent vulnerability in GBM.

a, Summary of the sgRNAs used in this study targeting BRD8 exons encoding the bromodomain (sgBRD8–1 and sgBRD8–2) or introns (sgIntron-1 and sgIntron2) flanking the exons encoding the bromodomain. b, Western blots showing BRD8 depletion by two independent sgRNAs in the indicated cells. Data shown represents two independent results. sgNeg is a negative control. HSC70 serves as loading control. c, Cellular competition-based GFP dropout assays of individual sgRNAs targeting BRD8 and MDM2 along with sgNeg and a positive control sgRNA targeting the replication protein CDK1 (sgCDK1). Plotted is the percentage of independent GFP positive cells (normalized to P0, n = 3 biologically independent samples) at the indicated time points. P0 refers to day 3 after infection. d, Western blot showing BRD8 levels after targeting its introns by two independent sgRNAs (sgIntron-1 and sgIntron-2) (top) and GFP dropout assays along with sgNeg and sgCDK1 in A382WT cells (bottom). Plotted is the mean ± s.d. (normalized to P0, n = 3 biologically independent samples). e, Western blots showing BRD8 knockdown in A382WT cells transduced with two individual shRNAs targeting BRD8 (shBRD8–1 and shBRD8–2) (top) and GFP dropout assays in A382WT with shRluc as a negative control and shRPA3 as a positive control (bottom). Plotted is the mean ± s.d. (normalized to P0, n = 3 biologically independent samples). f, Design of CRISPR-resistant BRD8 cDNAs against sgBRD8–1 (BRD8 CR-1) or sgBRD8–2 (BRD8 CR-2). g, Western blots showing overexpression of CRISPR-resistant BRD8 cDNAs (BRD8 CR-1 and BRD8 CR-2) in the two indicated TP53WT GBM cells with empty vector as control (Ctrl). h and i, GFP dropout assays of sgNeg, sgCDK1, sgBRD8–1 and sgBRD8–2 in indicated TP53WT GBM cells expressing Ctrl or CRISPR-resistant BRD8 cDNAs (BRD8 CR-1 or BRD8 CR-2). Plotted is the mean ± s.d. (normalized to P0, n = 3 biologically independent samples). j, MTT-based proliferation assays in primary GBM patient cells, xenograft cells, and immortalized brain-derived neural stem cells (BNSC). Plotted is the mean ± s.d. (normalized to sgNeg, n = 3 biologically independent samples). P values were calculated using two-tailed unpaired Student’s t-tests. k, The top panel depicts the Aka luciferase-expressing construct used in orthotopic brain transplantation assays for noninvasive imaging in vivo. Bottom left: in vitro validation of luciferase activity in cultured cells using D-luc or AkaLuc-HCL substrates in empty control (Ctrl), Fluc-expressing (Fluc), and AkaLuc-expressing (AkaLuc) cells. Bottom right: Bioluminescence imaging of NOD SCID mice that had orthotopic brain transplantation of AkaLuc-expressing U87WT cells transduced with sgNeg or sgBRD8–2 (see correlating Kaplan-Meier survival plot, Fig. 1b). l and m, Kaplan-Meier survival plot of recipient mice that had been orthotopically transplanted with A382WT (l) or U251R273H (m) GBM cells expressing sgNeg or sgBRD8 into the brains of recipient mice. P value was calculated by Log-rank (Mantel-Cox) test.
Extended Data Fig. 3 |. BRD8 depletion activates p53-dependent cell cycle arrest and senescence in GBM.

a, Volcano plot of differentially expressed genes after BRD8 depletion. Fold change was calculated by averaging fold changes of two independent sgRNAs of BRD8 compared with sgNeg. Each sgRNA has two biological replicates. b, GSEA analysis showing significantly enriched p53-related proliferation and aging signatures after BRD8 depletion. c and d, RT-qPCR assay of proliferation-related genes after BRD8 depletion in A382WT (c) and patient-derived primary GBM cells (d). Plotted is the mean ± s.d. (n = 3 biologically independent samples). P values were calculated using two-tailed unpaired Student’s t-tests. e, Propidium Iodide (PI) staining and flow cytometry assays of A382WT cells after BRD8 loss (n = 3 biologically independent samples). f, SA-β-gal assay in A382WT cells. Data shown represents three independent results. Scale bar, 50 μm. g, GSEA plot of apoptosis signature after BRD8 depletion in A382WT cells. h, Annexin V staining and flow cytometry assay in A382WT cells. Plotted is the mean ± s.d. (n = 3 biologically independent samples). P values were calculated using two-tailed unpaired Student’s t-tests. i, RT-qPCR assay of apoptosis-related genes after BRD8 loss in A382WT cells. Plotted is the mean ± s.d. (n = 3 biologically independent samples). P values were calculated using two-tailed unpaired Student’s t-tests. j, RT-qPCR assay of CDKN1A expression in sgNeg or sgBRD8–2 expressing U251R273H and U118R213Q cells. Plotted is the mean ± s.d. (n = 3 biologically independent samples). P values were calculated using two-tailed unpaired Student’s t-tests. k, Western blot validating p53 knockdown by four different sgRNAs targeting TP53 in A382WT cells. Data shown represents three independent results. l, Western blot showing depletion efficiency of BRD8 and induction of p53 and p21 in Ctrl or p53-deficient A382WT cells. Data shown represents three independent results. HSC70 serves as a loading control. m, RT-qPCR assays of indicated cell cycle and senescence-related genes after transduction of sgNeg or sgBRD8–1 and sgBRD8–2 in Ctrl and p53-deficient A382WT cells. Plotted is the mean ± s.d. (n = 3 biologically independent samples). P values were calculated using two-tailed unpaired Student’s t-tests. n, SA-β-gal assays in Ctrl or p53-deficient A382WT cells after BRD8 loss. Data shown represents three independent results. Scale bar, 100 μM.
Extended Data Fig. 4 |. BRD8 reciprocally regulates transcription of p53 targets at a distinct level from MDM2.

a and b, GFP dropout assays of depleting BRD8 (sgBRD8–1 and sgBRD8–2) in Ctrl or MDM2 overexpression (MDM2OE) A382WT cells (a), and of depleting MDM2 (sgMDM2–1 and sgMDM2–2) in Ctrl or BRD8 overexpression (BRD8OE) A382WT cells (b). Plotted is the mean ± s.d. (n = 3 biologically independent samples). c and d, MTT assay of BRD8 depletion using sgBRD8–2 and targeting MDM2 using sgMDM2–2 (c) or the MDM2 inhibitor Nutlin-3a (d) separately or in combination in A382WT GBM cells. Plotted is the mean ± s.d. (n = 3 biologically independent samples). P values were calculated using two-tailed unpaired Student’s t-tests. e, Schematic of doxycycline-induced Flag-tagged p53 expression under the control of the tight TRE element (top), with validation of p53 induction by western blot assays (bottom). HSC70 serves as loading control. f, Volcano plot depicting genes that were significantly upregulated and downregulated greater than 1.5-fold after pP53 induction in A382WT cells. g, GSEA plots of p53 targets and GBM plasticity signatures after p53 induction (P53OE) in A382WT cells. h, Confocal microscopy in A382WT cells. Data shown represents three independent results. Scale bar, 25 μm. i, Western blot of BRD8 in empty vector control (Ctrl) and CRISPR-resistant N or C terminal Flag-tagged BRD8 (CR-2-N3F and CR-2-C3F)-expressing A382WT cells. j, GFP dropout assays of indicated sgRNAs in empty vector control (Ctrl), CR-2-N3F, and CR-2-C3F-expressing A382WT cells. Plotted is the mean ± s.d. (n = 3 biologically independent samples). k and l, Pie charts showing distribution of high-confidence peaks of BRD8 (k) and p53 (l) in A382WT cells. m, De novo binding motif of p53 derived from p53 ChIP-seq. E-value (expectancy value) represents the enrichment of the motif around the center of the peak binding regions using the binomial test. n, Venn diagram depicting overlapped genes located near high-confidence peaks of BRD8 and p53. o, Validation of BRD8 and p53 occupancy in a panel of common target loci using ChIP-qPCR. Plotted is data from two biological replicates. p, GSEA plot of p53-ChIPseq-targets signature derived from p53 ChIPseq after p53 induction (P53OE) in A382WT cells. q, Western blot showing depletion efficiency of p21 in A382WT cells. r, SA-β-gal assays of Ctrl or p21-deficient A382WT cells transduced with sgNeg or sgBRD8–2. Data shown represents three independent results. Scale bar, 50 μm. s and t, Pie charts depicting p53 mutation rate in low grade glioma (LGG) from TCGA Firehose Legacy (s), and CDKN1A expression in three subgroups divided based on TP53 status and BRD8 expression level in LGG (t). P values were calculated using two-tailed unpaired Student’s t-tests.
Extended Data Fig. 5 |. BRD8 is a subunit of the EP400 complex in GBM.

a, Western blot and silver staining of proteins immunoprecipitated by anti-Flag antibody in Flag-tagged BRD8-overexpressing or empty vector control (Ctrl) A382WT cells. Data shown represents three independent results. b, Summary of peptides detected by IP-MS in Flag-tagged BRD8 or Ctrl immunoprecipitates for 17 subunits of the EP400 complex. c, IP and western blots showing validation of core subunits of the EP400 complex in BRD8 immunoprecipitates. Data shown represents two independent results. HSC70 serves as loading control. d, Summary of specific and shared components of the EP400 and SRCAP complexes. Proteins pulled down by BRD8 are shown in dark blue text. e, RT-qPCR showing expression levels of EP400 and SRCAP in A382WT GBM cells. Plotted represents three biological replicates. f, Summary of GSEA analysis using P53OE up signature (genes significantly upregulated after p53 induction by doxycycline) after individual depletion of multiple components of the EP400 complex. Two independent sgRNAs were used for targeting each individual subunit, and sgNeg was used as control. g, Summary of GSEA analysis upon depletion of indicated components of the EP400 complex using the sgBRD8 up signature (genes significantly upregulated after BRD8 depletion by two independent sgRNAs and each sgRNA has two biological replicates. h, Schematic of the EP400 complex that occupies p53 target loci in GBM, with BRD8 being the most specific regulator.
Extended Data Fig. 6 |. BRD8 reprograms the p53 network through H2AZ.

a, Pie chart showing distribution of high-confidence peaks for H2AZ in A382WT cells. TTS, transcription termination sites. b, Density plots depicting H2AZ, BRD8, p53, H3K4me3, and H3K27ac enrichment surrounding the summit of high-confidence H2AZ peaks in A382WT cells, ranked by H2AZ peak intensity. c and d, Metaprofile comparing H3K4me3 (c) and H3K27ac (d) occupancy surrounding the summit of H3K4me3 and H3K27ac peaks, respectively, in A382WT cells transduced with sgRNA targeting BRD8 relative to negative control, sgNeg. The binding intensity is shown as sequencing depth normalized tag count. e, Gene tracks of BRD8 and p53, H2AZ, H3K4me3, and H3K27ac ChIP-seq occupancy after BRD8 depletion at co-targeted loci. f–h, ChIP-qPCR validation of occupancy of indicated proteins at the CDKN1A locus after BRD8 loss in A382WT cells (f), and two patient-derived primary GBM cells (g and h). Plotted represents the mean ± s.d. (n = 4 biologically independent samples). P values were calculated using two-tailed unpaired Student’s t-tests.
Extended Data Fig. 7 |. H2AZ phenocopies BRD8 in maintaining GBM proliferation.

a, Western blot showing depletion efficiency of H2AZ using two independent sgRNAs (sgH2AZ-1 and sgH2AZ-2) compared to a negative control (sgNeg). HSC70 serves as loading control. b, GFP dropout assays of sgNeg, sgCDK1 (a positive control), and sgH2AZ-1 and sgH2AZ-2 in A382WT cells. Plotted is the mean ± s.d. (n = 3 biologically independent samples). c, RT-qPCR assays of the indicated cell cycle and senescence-related genes after transduction of sgNeg, sgBRD8–1 and sgBRD8–2, or sgH2AZ-1 and sgH2AZ-2 in A382WT cells. Plotted is the mean ± s.d. (n = 3 biologically independent samples). P values were calculated using two-tailed unpaired Student’s t-tests. d, SA-β-gal assays of A382WT cells transduced with sgNeg, sgBRD8–2, or sgH2AZ-2. Scale bar, 50 μm. Data shown represents three independent results. e, GSEA plots after H2AZ depletion in A382WT cells using the upregulated (left) and the downregulated (right) gene signatures generated from RNA-seq profiling after BRD8 loss. f, GFP dropout assays of sgNeg, sgCDK1, sgRNAs targeting EP400 and H2AZ in the indicated cell lines. Plotted is the mean ± s.d. (n = 3 biologically independent samples). g, SA-β-gal assays in Ctrl or p53-deficient A382WT cells transduced with sgNeg, sgBRD8–2, or sgH2AZ-2. Data shown represents three independent results. Scale bar, 50 μm. h, RT-qPCR assays of indicated cell cycle and senescence-related genes after transduction of sgNeg, sgBRD8–2, or sgH2AZ-2 in Ctrl and p53-deficient A382WT cells. Plotted is the mean ± s.d. (n = 3 biologically independent samples). P values were calculated using two-tailed unpaired Student’s t-tests. i, GFP dropout assays of sgNeg, sgCDK1, and sgH2AZ-1 in Ctrl or two p21-deficient cells. Plotted is the mean ± s.d. (n = 3 biologically independent samples). P values were calculated using two-tailed unpaired Student’s t-tests.
Extended Data Fig. 8 |. The bromodomain of BRD8 is selectively essential in GBM.

a, Heat map showing CRISPR screen results for the entire family of bromodomain-containing proteins (classified into eight subgroups) in the indicated cancer types. b, Construction of the CRISPR resistant BRD8 cDNA against sgBRD8–2 tagged with 3XFlag (CR-2-C3F) and the bromodomain-deleted BRD8 cDNA tagged with 3XFlag (BDdel-C3F) (left). Expression is validated using western blot in A382WT cells (right). Data shown represents two independent results. HSC70 is a loading control. c, Confocal microscopy showing nuclear localization of both wild type (BRD8-C3F) and bromodomain deleted BRD8 (BDdel-C3F). Scale bar, 50 μm. Data shown represents three independent results.
Extended Data Fig. 9 |. The bromodomain of BRD8 sequesters H2AZ to restrain chromatin accessibility of intrinsic p53 to its targets.

a, Design of Proximity Ligation Assay (PLA) for detecting in situ proximal interactions between BRD8 and H2AZ. b, PLA showing interactions between BRD8 and H2AZ or H2AZac (acetylated H2AZ), using mouse Flag-M2 antibody against Flag-tagged BRD8 and rabbit antibody against H2AZ or H2AZac. Data shown represents three independent results. c, Immunoprecipitation followed by western blotting to detect interactions between H2AZ or H2AZac, and Flag-tagged wild type BRD8 (BRD8-C3F) or bromodomain deleted BRD8 (BDdel-C3F) in A382WT cells, respectively. Data shown represents two independent results. d, Construction (left) and expression (right) of recombinant GST fusion BRD8 proteins. e and f, Western blot and Coomassie blue staining of purified recombinant GST fusion BRD8 proteins. g, In vitro pulldowns and western blots showing interaction of the BD of BRD8 (Upper) and full length of BRD8 (Lower) with H2AZ and H2AZac. Data shown represents three independent results. h, Gene tracks depicting occupancy of BRD8, p53, H2AZ, H3K27ac, H3K4me3 and chromatin accessibility by ATAC-seq in control (sgNeg), BRD8- or H2AZ-depleted A383WT GBM cells. i–k, RT-qPCR assays validating enhanced chromatin accessibility at the CDKN1A promoter region after depletion of BRD8 (sgBRD8) and H2AZ (sgH2AZ) compared with control (sgNeg) in A382WT GBM (i) and two patient-derived primary GBM cells MN03WT ( j) and MN06WT(k). Plotted is the mean ± s.d. (n = 3 biologically independent samples). P values were calculated using two-tailed unpaired Student’s t-tests. l and m, Western blot showing expression of indicated proteins at different timepoints following BRD8 knockdown (l) and multiple modifications of p53 at day 5 (m) in A382WT GBM cells. Data shown represents three independent results.
Extended Data Fig. 10 |. BRD8 and H2AZ are highly expressed in KI67-positive cells of GBM patients.
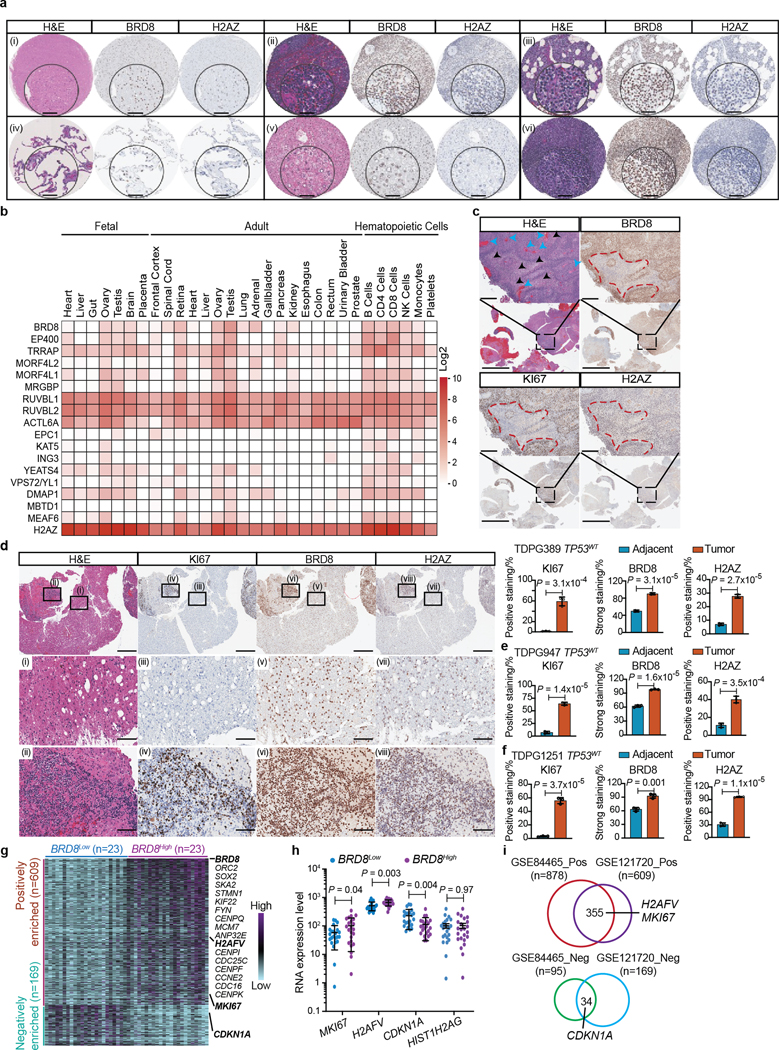
a, H&E and IHC staining for BRD8 and H2AZ in normal human tissues, including brain (I), spleen (ii), lymph (iii), lung (iv), liver (v), and tonsil (vi). Scale bar, 50 μm. b, Protein expression levels of the EP400 components across diverse foetal tissues, adult tissues, and hematopoietic cells. Heat map represents log2 value of raw data compiled from the human proteome. c, IHC staining showing expression of BRD8, H2AZ, and the proliferation marker KI67. The bottom panels show an overview at low magnification (scale bar, 5 mm), while the top panels are higher magnification views (scale bar, 400 μm) showing typical features of GBM, including pseudopalisades (along red-dashed lines, highly proliferating cells with strong staining of BRD8, H2AZ, and KI67), necrosis (black arrowheads), vascularity/neoangiogenesis (blue arrowheads), and high nuclear atypia. d, H&E and IHC staining for KI67, BRD8, and H2AZ using the representative GBM patient specimen with adjacent lower grade ((i), (iii), (v), (vii)) and highly aggressive regions ((ii), (iv), (vi), (viii)). The upper panels show low magnification (scale bar, 1mm), and two enlarged fields (scale bar, 100 μm) with adjacent lower grade and high-grade phenotypes shown below. The percentage scores are from three different areas for each phenotypic category. Plotted is mean ± s.d. P values were calculated using two-tailed unpaired Student’s t-tests. e and f, Plotted is mean ± s.d. for the percentage scores of KI67, H2AZ, and BRD8 from three different areas within each phenotypic category in patient specimens TDPG947 TP53WT(e) and TDPG1251 TP53WT(f). P values were calculated using two-tailed unpaired Student’s t-tests. g, Heatmap depicting expression of proliferation-related genes (ranked by p value) in BRD8Low and BRD8High GBM cells (columns). h, Comparison of MKI67, H2AFV, CDKN1A gene expression between BRD8Low and BRD8High subgroups in GBM cells. HIST1H2AG gene serves as a control. i, Overlap of positively (Pos) or negatively (Neg) associated proliferation-related genes with BRD8 expression levels in datasets GSE84465 and GSE121720, respectively.
Supplementary Material
Acknowledgements
We thank H. Zheng at Weill Cornell Medical College for the mouse glioma cell lines and human brain-derived human stem cells; J. Sarkaria, A. C. M. Tuma and Z. Hu at Mayo Clinic for GBM patient-derived xenograft models; A. Schorn at CSHL for the original dual luciferase reporter plasmids; P. Filippakopoulos at the University of Oxford for helpful discussions on the bromodomain of BRD8; and members of the Mills and Vakoc laboratories for helpful discussions and suggestions over the course of this study. A.A.M. was supported by the National Cancer Institute of the National Institutes of Health under award number R01CA190997 and P30CA045508 and the Office Of The Director, National Institutes Of Health of the National Institutes of Health under award number R21OD018332. A.A.M. was also supported through the Darlene Carbone Brain Tumor Foundation, the Bradley Zankel Foundation, the Edward Davis Foundation, and the Cold Spring Harbor Laboratory-Northwell Health Affiliation. C.R.V. was supported by National Institutes of Health grant NCI R01 CA174793, NCI 5P01CA013106-Project 4, and the Cold Spring Harbor Laboratory and Northwell Health Affiliation. O.K. was supported by a Deutsche Forschungsgemeinschaft research fellowship (KL 3228/1-1). The content is solely the responsibility of the authors and does not necessarily represent the official views of the National Institutes of Health.
Footnotes
Competing interests C.R.V. has received consulting fees from Flare Therapeutics, Roivant Sciences and C4 Therapeutics, has served on the advisory boards of KSQ Therapeutics, Syros Pharmaceuticals and Treeline Biosciences, has received research funding from Boehringer–Ingelheim and Treeline Biosciences, and owns a stock option from Treeline Biosciences.
Additional information
Supplementary information The online version contains supplementary material available at https://doi.org/10.1038/s41586-022-05551-x.
Peer review information Nature thanks the anonymous reviewers for their contribution to the peer review of this work.
Reprints and permissions information is available at http://www.nature.com/reprints.
References
- 1.Brennan CW et al. The somatic genomic landscape of glioblastoma. Cell 155, 462–477 (2013). [DOI] [PMC free article] [PubMed] [Google Scholar]
- 2.Cancer Genome Atlas Research Network. Comprehensive genomic characterization defines human glioblastoma genes and core pathways. Nature 455, 1061–1068 (2008). [DOI] [PMC free article] [PubMed] [Google Scholar]
- 3.el-Deiry WS et al. WAF1, a potential mediator of p53 tumor suppression. Cell 75, 817–825 (1993). [DOI] [PubMed] [Google Scholar]
- 4.Xiong Y. et al. p21 is a universal inhibitor of cyclin kinases. Nature 366, 701–704 (1993). [DOI] [PubMed] [Google Scholar]
- 5.Thakkar JP et al. Epidemiologic and molecular prognostic review of glioblastoma. Cancer Epidemiol. Biomarkers Prev 23, 1985–1996 (2014). [DOI] [PMC free article] [PubMed] [Google Scholar]
- 6.Ostrom QT et al. CBTRUS statistical report: primary brain and central nervous system tumors diagnosed in the United States in 2008–2012. Neuro Oncol. 17, iv1–iv62 (2015). [DOI] [PMC free article] [PubMed] [Google Scholar]
- 7.Wilson TA, Karajannis MA & Harter DH Glioblastoma multiforme: state of the art and future therapeutics. Surg. Neurol. Int 5, 64 (2014). [DOI] [PMC free article] [PubMed] [Google Scholar]
- 8.Haupt Y, Maya R, Kazaz A. & Oren M. Mdm2 promotes the rapid degradation of p53. Nature 387, 296–299 (1997). [DOI] [PubMed] [Google Scholar]
- 9.Kubbutat MH, Jones SN & Vousden KH Regulation of p53 stability by Mdm2. Nature 387, 299–303 (1997). [DOI] [PubMed] [Google Scholar]
- 10.Binh MB et al. MDM2 and CDK4 immunostainings are useful adjuncts in diagnosing well-differentiated and dedifferentiated liposarcoma subtypes: a comparative analysis of 559 soft tissue neoplasms with genetic data. Am. J. Surg. Pathol 29, 1340–1347 (2005). [DOI] [PubMed] [Google Scholar]
- 11.Brosh R. & Rotter V. When mutants gain new powers: news from the mutant p53 field. Nat. Rev. Cancer 9, 701–713 (2009). [DOI] [PubMed] [Google Scholar]
- 12.Junttila MR & Evan GI p53—a Jack of all trades but master of none. Nat. Rev. Cancer 9, 821–829 (2009). [DOI] [PubMed] [Google Scholar]
- 13.Bailey MH et al. Comprehensive characterization of cancer driver genes and mutations. Cell 174, 1034–1035 (2018). [DOI] [PMC free article] [PubMed] [Google Scholar]
- 14.Alexandrov LB et al. Signatures of mutational processes in human cancer. Nature 500, 415–421 (2013). [DOI] [PMC free article] [PubMed] [Google Scholar]
- 15.Verhaak RG et al. Integrated genomic analysis identifies clinically relevant subtypes of glioblastoma characterized by abnormalities in PDGFRA, IDH1, EGFR, and NF1. Cancer Cell 17, 98–110 (2010). [DOI] [PMC free article] [PubMed] [Google Scholar]
- 16.Zhao J. et al. Immune and genomic correlates of response to anti-PD-1 immunotherapy in glioblastoma. Nat. Med 25, 462–469 (2019). [DOI] [PMC free article] [PubMed] [Google Scholar]
- 17.Liu J. et al. An integrated TCGA pan-cancer clinical data resource to drive high-quality survival outcome analytics. Cell 173, 400–416.e11 (2018). [DOI] [PMC free article] [PubMed] [Google Scholar]
- 18.Leroy B, Anderson M. & Soussi T. TP53 mutations in human cancer: database reassessment and prospects for the next decade. Hum. Mutat 35, 672–688 (2014). [DOI] [PubMed] [Google Scholar]
- 19.Shi J. et al. Discovery of cancer drug targets by CRISPR–Cas9 screening of protein domains. Nat. Biotechnol 33, 661–667 (2015). [DOI] [PMC free article] [PubMed] [Google Scholar]
- 20.Lu B. et al. A transcription factor addiction in leukemia imposed by the MLL promoter sequence. Cancer Cell 34, 970–981.e8 (2018). [DOI] [PMC free article] [PubMed] [Google Scholar]
- 21.Pastori C. et al. BET bromodomain proteins are required for glioblastoma cell proliferation. Epigenetics 9, 611–620 (2014). [DOI] [PMC free article] [PubMed] [Google Scholar]
- 22.Haase S. et al. Mutant ATRX: uncovering a new therapeutic target for glioma. Expert Opin. Ther. Targets 22, 599–613 (2018). [DOI] [PMC free article] [PubMed] [Google Scholar]
- 23.Iwano S. et al. Single-cell bioluminescence imaging of deep tissue in freely moving animals. Science 359, 935–939 (2018). [DOI] [PubMed] [Google Scholar]
- 24.Lashgari A, Fauteux M, Marechal A. & Gaudreau L. Cellular depletion of BRD8 causes p53-dependent apoptosis and induces a DNA damage response in non-stressed cells. Sci. Rep 8, 14089 (2018). [DOI] [PMC free article] [PubMed] [Google Scholar]
- 25.Wei CL et al. A global map of p53 transcription-factor binding sites in the human genome. Cell 124, 207–219 (2006). [DOI] [PubMed] [Google Scholar]
- 26.Doyon Y, Selleck W, Lane WS, Tan S. & Cote J. Structural and functional conservation of the NuA4 histone acetyltransferase complex from yeast to humans. Mol. Cell. Biol 24, 1884–1896 (2004). [DOI] [PMC free article] [PubMed] [Google Scholar]
- 27.Mizuguchi G. et al. ATP-driven exchange of histone H2AZ variant catalyzed by SWR1 chromatin remodeling complex. Science 303, 343–348 (2004). [DOI] [PubMed] [Google Scholar]
- 28.Ruhl DD et al. Purification of a human SRCAP complex that remodels chromatin by incorporating the histone variant H2A.Z into nucleosomes. Biochemistry 45, 5671–5677 (2006). [DOI] [PubMed] [Google Scholar]
- 29.Pradhan SK et al. EP400 deposits H3.3 into promoters and enhancers during gene activation. Mol. Cell 61, 27–38 (2016). [DOI] [PMC free article] [PubMed] [Google Scholar]
- 30.Raisner RM et al. Histone variant H2A.Z marks the 5′ ends of both active and inactive genes in euchromatin. Cell 123, 233–248 (2005). [DOI] [PMC free article] [PubMed] [Google Scholar]
- 31.Zhang H, Roberts DN & Cairns BR Genome-wide dynamics of Htz1, a histone H2A variant that poises repressed/basal promoters for activation through histone loss. Cell 123, 219–231 (2005). [DOI] [PMC free article] [PubMed] [Google Scholar]
- 32.Guillemette B. et al. Variant histone H2A.Z is globally localized to the promoters of inactive yeast genes and regulates nucleosome positioning. PLoS Biol. 3, e384 (2005). [DOI] [PMC free article] [PubMed] [Google Scholar]
- 33.Filippakopoulos P. et al. Histone recognition and large-scale structural analysis of the human bromodomain family. Cell 149, 214–231 (2012). [DOI] [PMC free article] [PubMed] [Google Scholar]
- 34.Kon N. et al. Robust p53 stabilization is dispensable for its activation and tumor suppressor function. Cancer Res. 81, 935–944 (2021). [DOI] [PMC free article] [PubMed] [Google Scholar]
- 35.Espinosa JM & Emerson BM Transcriptional regulation by p53 through intrinsic DNA/chromatin binding and site-directed cofactor recruitment. Mol. Cell 8, 57–69 (2001). [DOI] [PubMed] [Google Scholar]
- 36.Sykes SM et al. Acetylation of the p53 DNA-binding domain regulates apoptosis induction. Mol. Cell 24, 841–851 (2006). [DOI] [PMC free article] [PubMed] [Google Scholar]
- 37.Tang Y, Luo J, Zhang W. & Gu W. Tip60-dependent acetylation of p53 modulates the decision between cell-cycle arrest and apoptosis. Mol. Cell 24, 827–839 (2006). [DOI] [PubMed] [Google Scholar]
- 38.Xu Y. et al. The p400 ATPase regulates nucleosome stability and chromatin ubiquitination during DNA repair. J. Cell Biol 191, 31–43 (2010). [DOI] [PMC free article] [PubMed] [Google Scholar]
- 39.Courilleau C. et al. The chromatin remodeler p400 ATPase facilitates Rad51-mediated repair of DNA double-strand breaks. J. Cell Biol 199, 1067–1081 (2012). [DOI] [PMC free article] [PubMed] [Google Scholar]
- 40.Kim MS et al. A draft map of the human proteome. Nature 509, 575–581 (2014). [DOI] [PMC free article] [PubMed] [Google Scholar]
- 41.Darmanis S. et al. Single-cell RNA-seq analysis of infiltrating neoplastic cells at the migrating front of human glioblastoma. Cell Rep. 21, 1399–1410 (2017). [DOI] [PMC free article] [PubMed] [Google Scholar]
- 42.Ventura A. et al. Restoration of p53 function leads to tumour regression in vivo. Nature 445, 661–665 (2007). [DOI] [PubMed] [Google Scholar]
- 43.Xue W. et al. Senescence and tumour clearance is triggered by p53 restoration in murine liver carcinomas. Nature 445, 656–660 (2007). [DOI] [PMC free article] [PubMed] [Google Scholar]
- 44.Fan JY, Rangasamy D, Luger K. & Tremethick DJ H2A.Z alters the nucleosome surface to promote HP1α-mediated chromatin fiber folding. Mol. Cell 16, 655–661 (2004). [DOI] [PubMed] [Google Scholar]
- 45.Greaves IK, Rangasamy D, Ridgway P. & Tremethick DJ H2A.Z contributes to the unique 3D structure of the centromere. Proc. Natl Acad. Sci. USA 104, 525–530 (2007). [DOI] [PMC free article] [PubMed] [Google Scholar]
- 46.Rangasamy D, Berven L, Ridgway P. & Tremethick DJ Pericentric heterochromatin becomes enriched with H2A.Z during early mammalian development. EMBO J. 22, 1599–1607 (2003). [DOI] [PMC free article] [PubMed] [Google Scholar]
- 47.Faivre EJ et al. Selective inhibition of the BD2 bromodomain of BET proteins in prostate cancer. Nature 578, 306–310 (2020). [DOI] [PubMed] [Google Scholar]
- 48.Gilan O. et al. Selective targeting of BD1 and BD2 of the BET proteins in cancer and immunoinflammation. Science 368, 387–394 (2020). [DOI] [PMC free article] [PubMed] [Google Scholar]
- 49.Huang B, Deo D, Xia M. & Vassilev LT Pharmacologic p53 activation blocks cell cycle progression but fails to induce senescence in epithelial cancer cells. Mol. Cancer Res 7, 1497–1509 (2009). [DOI] [PubMed] [Google Scholar]
- 50.Zuber J. et al. RNAi screen identifies Brd4 as a therapeutic target in acute myeloid leukaemia. Nature 478, 524–528 (2011). [DOI] [PMC free article] [PubMed] [Google Scholar]
- 51.Hsu PD et al. DNA targeting specificity of RNA-guided Cas9 nucleases. Nat. Biotechnol 31, 827–832 (2013). [DOI] [PMC free article] [PubMed] [Google Scholar]
- 52.Chou HC et al. The human origin recognition complex is essential for pre-RC assembly, mitosis, and maintenance of nuclear structure. Elife 10.7554/eLife.61797 (2021). [DOI] [PMC free article] [PubMed] [Google Scholar]
- 53.Kim D. et al. TopHat2: accurate alignment of transcriptomes in the presence of insertions, deletions and gene fusions. Genome Biol. 14, R36 (2013). [DOI] [PMC free article] [PubMed] [Google Scholar]
- 54.Trapnell C. et al. Differential analysis of gene regulation at transcript resolution with RNA-seq. Nat. Biotechnol 31, 46–53 (2013). [DOI] [PMC free article] [PubMed] [Google Scholar]
- 55.Roe JS et al. Enhancer reprogramming promotes pancreatic cancer metastasis. Cell 170, 875–888.e20 (2017). [DOI] [PMC free article] [PubMed] [Google Scholar]
- 56.Subramanian A. et al. Gene set enrichment analysis: a knowledge-based approach for interpreting genome-wide expression profiles. Proc. Natl Acad. Sci. USA 102, 15545–15550 (2005). [DOI] [PMC free article] [PubMed] [Google Scholar]
- 57.Langmead B. & Salzberg SL Fast gapped-read alignment with Bowtie 2. Nat. Methods 9, 357–359 (2012). [DOI] [PMC free article] [PubMed] [Google Scholar]
- 58.Feng J, Liu T, Qin B, Zhang Y. & Liu XS Identifying ChIP-seq enrichment using MACS. Nat. Protoc 7, 1728–1740 (2012). [DOI] [PMC free article] [PubMed] [Google Scholar]
- 59.Kent WJ et al. The human genome browser at UCSC. Genome Res. 12, 996–1006 (2002). [DOI] [PMC free article] [PubMed] [Google Scholar]
- 60.Bagchi A. et al. CHD5 is a tumor suppressor at human 1p36. Cell 128, 459–475 (2007). [DOI] [PubMed] [Google Scholar]
Associated Data
This section collects any data citations, data availability statements, or supplementary materials included in this article.
Supplementary Materials
Data Availability Statement
The ChIP-seq and RNA-seq data generated in this study is available at the GEO database (https://www.ncbi.nlm.nih.gov/geo/) with accession number GSE158551. The RNA-seq data of GBM cells isolated from patient specimens are from datasets GSE84465 and GSE121720 in the GEO database.