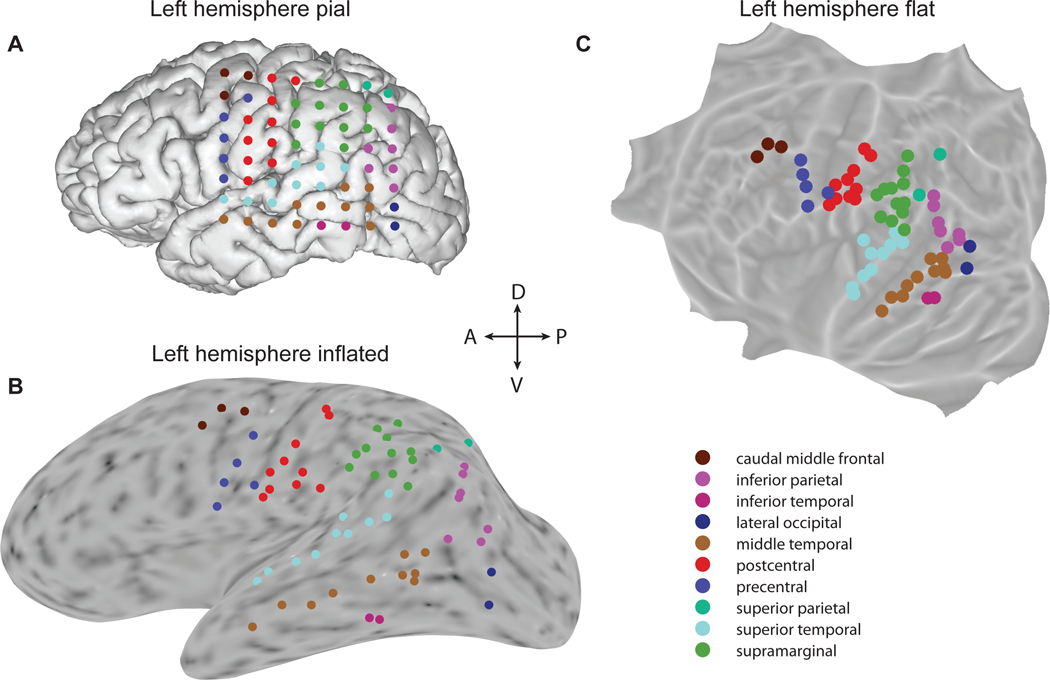
Figure 5.
Brain depiction and electrode visualization
ECoG electrodes are color-coded according to the anatomical label that corresponds to their location. Electrodes are shown on (A) the original pial surface of the participant’s brain, where the grid structure may be best appreciated, (B) the inflated cortical surface and (C) the flattened cortical surface (in this case based on the projection onto the fsaverage brain). The inflated and flattened surfaces are colored according to surface curvature calculated in FreeSurfer, where darker gray indicates the sulci, and lighter gray indicates gyri. The best choice of representation (pial, inflated or flat) depends on the coverage of electrodes as well as which areas are to be compared.

