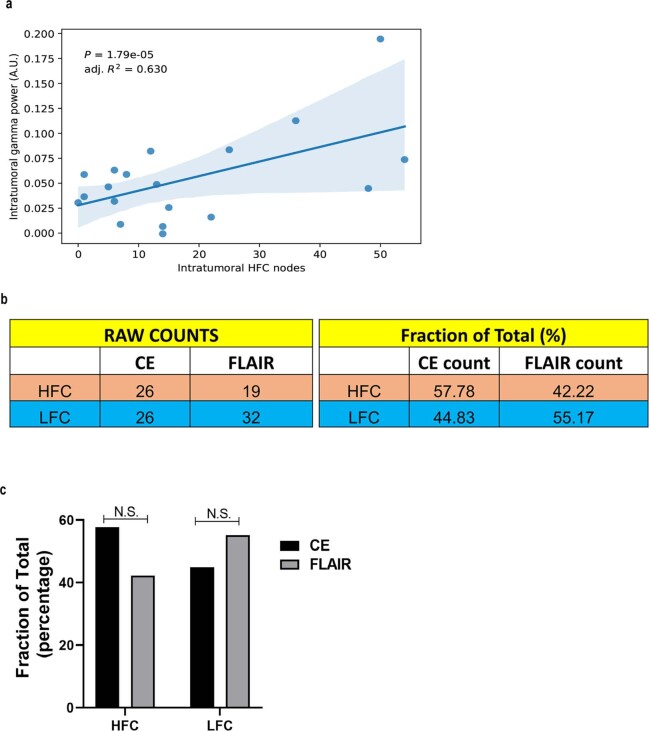
Extended Data Fig. 4. Gamma power and tumour-intrinsic connectivity imaging correlations.
a, Linear regression statistics illustrating that gamma power (a measure of neuronal activity) correlates with number of intratumoural high functional connectivity voxels in glioblastoma (n = 18 patients; P = 0.00002). Shaded area represents the 95% confidence interval predicted by the linear regression model. b, Sampling of functionally connected intratumoural regions using MEG was performed exclusively in participants with dominant hemisphere glioblastoma at the point of initial diagnosis. Site-directed tissue biopsies from HFC and LFC regions were taken as determined by MRI. Table illustrates site-specific sampling of each annotated specimen as it relates to contrast enhancing (CE) region and FLAIR tumour. Site-specific samples were acquired without regard for whether they originated from enhancing or FLAIR regions. c, While samples were not acquired based on whether they originated from contrast enhancing or FLAIR regions, the stereotactic coordinates of each sample were acquired. While 57.78% of HFC samples originated from contrast enhancing regions, this did not reach statistical significance. P = 0.1923 two-sided chi square, P = 0.235 two-sided Fisher’s exact test. P value determined by two-sided linear regression analysis (a). NS, not significant.

