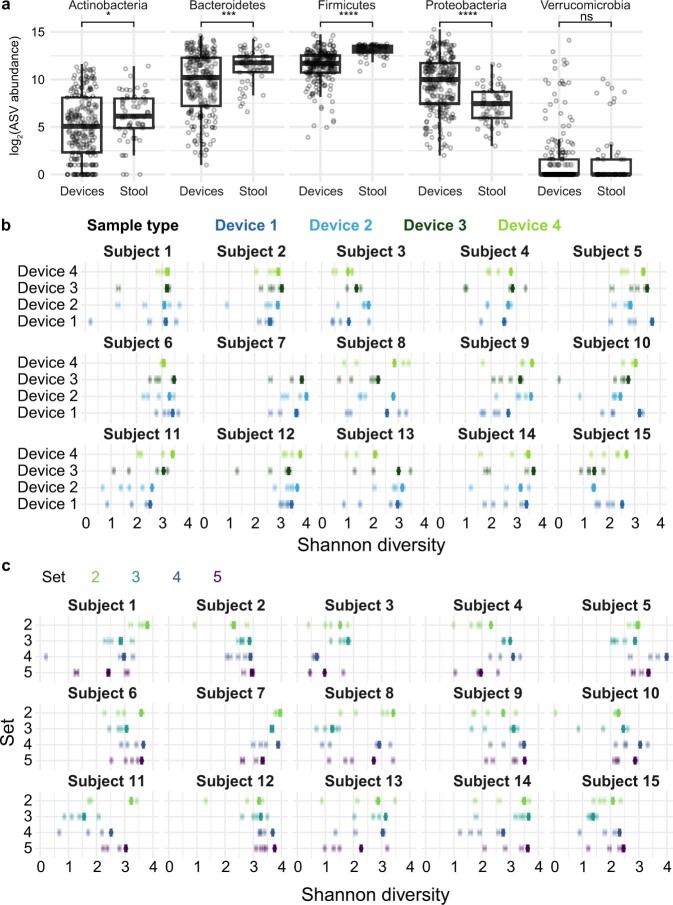
Extended Data Fig. 3. Diversity in phylum abundances and alpha and gamma diversity implicate a temporally and spatially heterogeneous intestinal tract.
a) Summed log2(read count) at the phylum level are shown for each sample by location. P-values from left to right: 0.57, 0.0035, 2.4 × 10⁻¹⁵, 5.7 × 10⁻⁷, and 0.83. ASVs that did not have read count ≥3 in 5% of samples were ignored. Boxplots show the median and 1st and 3rd quartiles. Each dot represents a sample (n = 210 and 58 for devices and stool, respectively). ns: not significant, *: P ≤ 0.05, **: P ≤ 0.01, ***: P ≤ 0.001, ****: P ≤ 0.0001, Bonferroni-corrected two-sided Wilcoxon rank-sum test. b, c) The Shannon diversity of individual devices (n = 210 devices; alpha diversity, lighter points) was generally lower than that collectively of all devices from a single set (gamma diversity, bold points), indicating high spatial variation. Each subject (#1–#15) is shown separately. To ensure equal read depths for accurate comparisons, all intestinal samples were rarefied to the minimum sequencing depth of any device from that subject. Mean values and 95% confidence intervals for alpha and gamma diversity estimates were obtained by repeating the rarefaction procedure 1000 times.

