Abstract
Photochemistry is a fundamental process of planetary atmospheres that regulates the atmospheric composition and stability1. However, no unambiguous photochemical products have been detected in exoplanet atmospheres so far. Recent observations from the JWST Transiting Exoplanet Community Early Release Science Program2,3 found a spectral absorption feature at 4.05 μm arising from sulfur dioxide (SO2) in the atmosphere of WASP-39b. WASP-39b is a 1.27-Jupiter-radii, Saturn-mass (0.28 MJ) gas giant exoplanet orbiting a Sun-like star with an equilibrium temperature of around 1,100 K (ref. 4). The most plausible way of generating SO2 in such an atmosphere is through photochemical processes5,6. Here we show that the SO2 distribution computed by a suite of photochemical models robustly explains the 4.05-μm spectral feature identified by JWST transmission observations7 with NIRSpec PRISM (2.7σ)8 and G395H (4.5σ)9. SO2 is produced by successive oxidation of sulfur radicals freed when hydrogen sulfide (H2S) is destroyed. The sensitivity of the SO2 feature to the enrichment of the atmosphere by heavy elements (metallicity) suggests that it can be used as a tracer of atmospheric properties, with WASP-39b exhibiting an inferred metallicity of about 10× solar. We further point out that SO2 also shows observable features at ultraviolet and thermal infrared wavelengths not available from the existing observations.
Subject terms: Exoplanets, Atmospheric chemistry, Giant planets
Observations from the JWST show the presence of a spectral absorption feature at 4.05 μm arising from SO2 in the atmosphere of the gas giant exoplanet WASP-39b, which is produced by photochemical processes and verified by numerical models.
Main
JWST observed WASP-39b as part of its Transiting Exoplanet Community Early Release Science Program (ERS Program 1366), with the goal of explaining its atmospheric composition2,3. Data from the NIRSpec PRISM and G395H instrument modes showed a distinct absorption feature between 4.0 μm and 4.2 μm, peaking at around 4.05 μm, that atmospheric radiative–convective–thermochemical equilibrium models could not explain with metallicity and C/O values typically assumed of gas giant planets (1–100× solar and 0.3–0.9, respectively8,9). After excluding instrument systematics and stellar variability, a thorough search for gases has shown SO2 as a promising candidate with the best-fit absorption feature (see Methods), although ad hoc spectra with injected SO2 were used in the analysis.
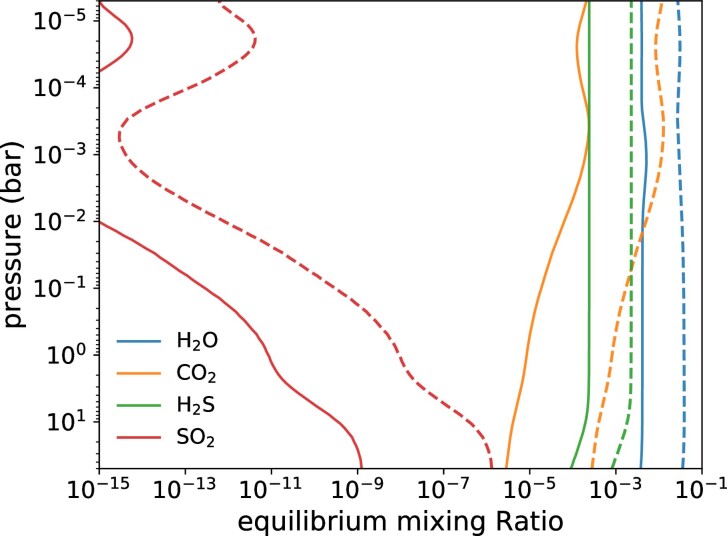
Sulfur shares some chemical similarities with oxygen but uniquely forms various compounds with a wide range of oxidation states (−2 to +6 (ref. 10)). Although SO2 is ubiquitously outgassed and associated with volcanism on terrestrial worlds (for example, Earth, Venus and Jupiter’s satellite Io), the source of SO2 is fundamentally different on gas giants. Under thermochemical equilibrium, sulfur chiefly exists in the reduced form, such that H2S is the primary sulfur reservoir in a hydrogen/helium-dominated gas giant11–14. At the temperature of WASP-39b, the equilibrium mixing ratio of SO2 in the observable part of the atmosphere is less than about 10−12 for 10× solar metallicity and less than about 10−9 for even 100× solar metallicity (see Extended Data Fig. 1). This equilibrium abundance of SO2 is several orders of magnitude smaller than the values needed to produce the spectral feature observed by JWST (volume mixing ratios (VMRs) of 10−6–10−5)8,9. By contrast, under ultraviolet (UV) irradiation, SO2 can be oxidized from H2S as a photochemical product. H and OH radicals, generated by photolysis processes, are key to liberating SH radicals and atomic S from H2S and subsequently oxidizing them to SO and SO2. Although previous photochemical modelling studies have shown that substantial SO2 can be produced in hydrogen-rich exoplanet atmospheres in this way5,6,13,15,16, the extent to which such a model could reproduce the current WASP-39b observations remained unverified.
Extended Data Fig. 1. Chemical equilibrium abundances in the atmosphere of WASP-39b.
VMR profiles of H2O (blue), CO2 (orange), H2S (green) and SO2 (red), as computed by FastChem (ref. 38) based on the morning terminator temperature profile, are given for 10× (solid lines) and 100× (dashed lines) solar metallicity.
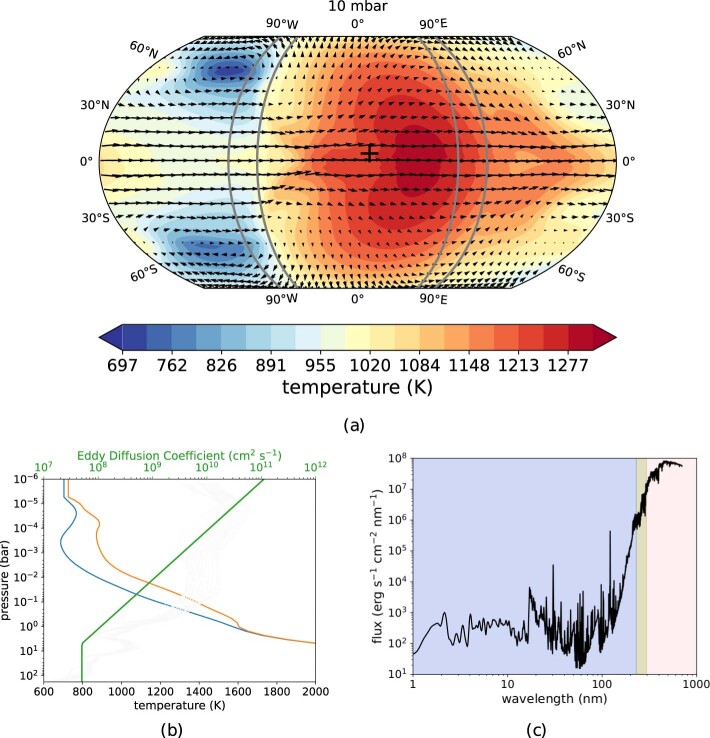
We have performed several independent, cloud-free 1D photochemical model calculations of WASP-39b using the ARGO, ATMO, KINETICS and VULCAN codes (see Methods for model details). All models included sulfur kinetic chemical networks and were run using the same vertical temperature–pressure profiles of the morning and evening terminators adopted from a 3D WASP-39b atmospheric simulation with the Exo-FMS general circulation model (GCM)17 (see Extended Data Fig. 2). The nominal models assumed a metallicity of 10× solar (ref. 18) with a solar C/O ratio of 0.55, whereas we explored the sensitivity to atmospheric properties.
Extended Data Fig. 2. The temperature–wind map of the WASP-39b Exo-FMS GCM and input for 1D photochemical models.
a, The colour scale represents temperature across the planet and arrows denote the wind direction and magnitude at 10 mbar. The ±10° longitudinal regions with respect to the morning and evening terminators are indicated with solid grey lines. The ‘+’ symbol denotes the sub-stellar point. b, 1D temperature–pressure profiles adopted from the morning and evening terminators averaging all latitudes and ±10° longitudes (regions enclosed by grey lines in a) and the Kzz profile (equation (2) and held constant below the 5-bar level) overlaying the root-mean-squared vertical wind multiplied by 0.1 scale height from the GCM (grey). The temperatures are kept isothermal from those at the top boundary of the GCM around 5 × 10⁻⁵ bar when extending to lower pressures (about 10−8 bar) for photochemical models. c, Input WASP-39 stellar flux at the surface of the star. The pink-shaded region indicates the optical wavelength range at which the stellar spectrum is directly measured, whereas the blue-shaded and green-shaded regions are those constructed from the Sun and HD 203244, respectively.
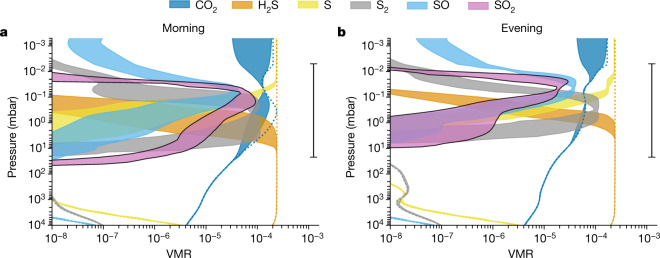
The peak mixing ratios of the main sulfur species produced by the different photochemical models are largely consistent with each other to within an order of magnitude, as shown in Fig. 1. The SO2 mixing ratio profiles are highly variable with altitude and strongly peaked at 0.01–1 mbar with a value of 10–100 ppm. SO2 (along with CO2) is more favoured at the cooler morning terminator, at which H2S is less stable against reaction with atomic H at depth (with SO2 abundance peak of 50–90 ppm at the morning terminator and 15–30 ppm at the evening terminator). Although the peak SO2 abundance from the photochemical models is greater than that estimated from fitting to the PRISM and G395H data, which assumed vertically constant mixing ratios of about 1–10 ppm and about 2.5–4.6 ppm, respectively, the column-integrated number densities above 10 mbar are highly consistent (see Methods). Our models indicate that S, S2 and SO, which are precursors of SO2, also reach high abundances in the upper atmosphere above the pressure level at which H2S is destroyed. Nevertheless, they are not expected to manifest observable spectral features in the PRISM/G395H wavelength range.
Fig. 1. Simulated vertical distribution of sulfur species and CO2.
a,b, The colour-shaded areas indicate the span (enclosed by the maximum and minimum values) of VMRs of CO2 (blue), SO2 (pink with black borders) and other key sulfur species (H2S, orange; S, yellow; S2, grey; SO, light blue) computed by an ensemble of photochemical models (ARGO, ATMO, KINETICS and VULCAN) for the morning (a) and evening (b) terminators. The thermochemical equilibrium VMRs are indicated by the dotted lines, with SO2 not within the x-axis range owing to its very low abundance in thermochemical equilibrium. The range bar on the right represents the main pressure ranges of the atmosphere investigated by JWST NIRSpec spectroscopy. Photochemistry produces SO2 and other sulfur species above the 1-mbar level with abundances several orders of magnitude greater than those predicted by thermochemical equilibrium.
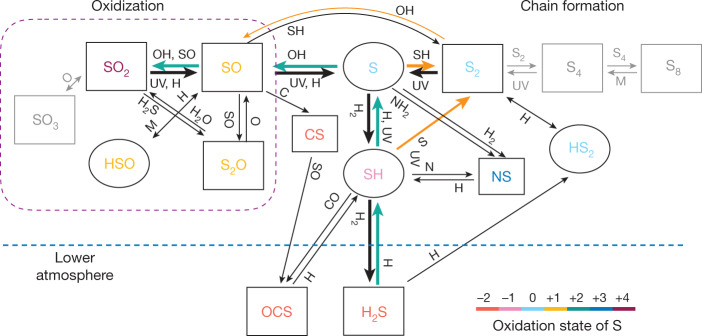
The important pathways of sulfur kinetics in the atmosphere of WASP-39b from our models are summarized in Fig. 2. The photochemical production paths of SO2 from H2S around the SO2 peak are as follows:
| 1 |
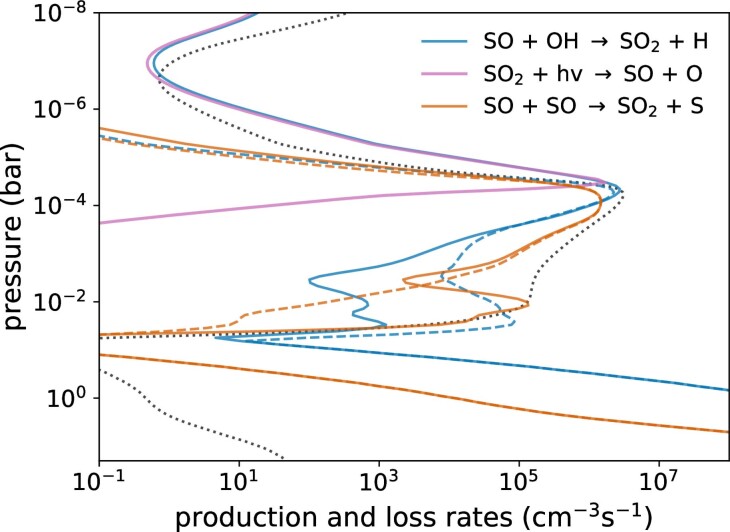
Water photolysis in equation (1) is an important source of atomic H that initiates the pathway. The last step of oxidizing SO into SO2 is generally the rate-limiting step. The oxidization of SO and photolysis of SO2 account for the main sources and sinks of SO2, which lead to altitude-varying distribution that peaks around 0.1 mbar (see Extended Data Fig. 4). At high pressures with less available OH, reactions involving S2 become important in oxidizing S (see Methods). The growth of elemental sulfur allotropes beyond S2 effectively stops for temperatures higher than approximately 750 K (refs. 5,6).
Fig. 2. A simplified schematic of the chemical pathways of sulfur species.
H2S, which is the stable sulfur-bearing molecule at thermochemical equilibrium in an H2 atmosphere, readily reacts with atomic H to form SH radicals and, subsequently, atomic S in the photochemical region (above about 0.1 mbar). Reaction of S with photochemically generated OH then produces SO, which is further oxidized to SO2. The thick arrows denote efficient reactions and M denotes any third body. Inefficient reactions and inactive paths in the temperature regime of WASP-39b are greyed out. The cyan arrows mark the main path from H2S to SO2, whereas the orange arrows mark the paths that are important at higher pressures. Sulfur species are colour-coded by the oxidation states of S. Rectangles indicate stable molecules, whereas ovals indicate free radicals.
Extended Data Fig. 4. The main source and sink profiles of SO2 in our WASP-39b model.
The reaction rates of the main sources and sinks of SO2 in the VULCAN morning-terminator model for WASP-39b. The dashed lines of the same colour are the corresponding reverse reactions and the dotted black line indicates the distribution profile (arbitrarily scaled) of SO2.
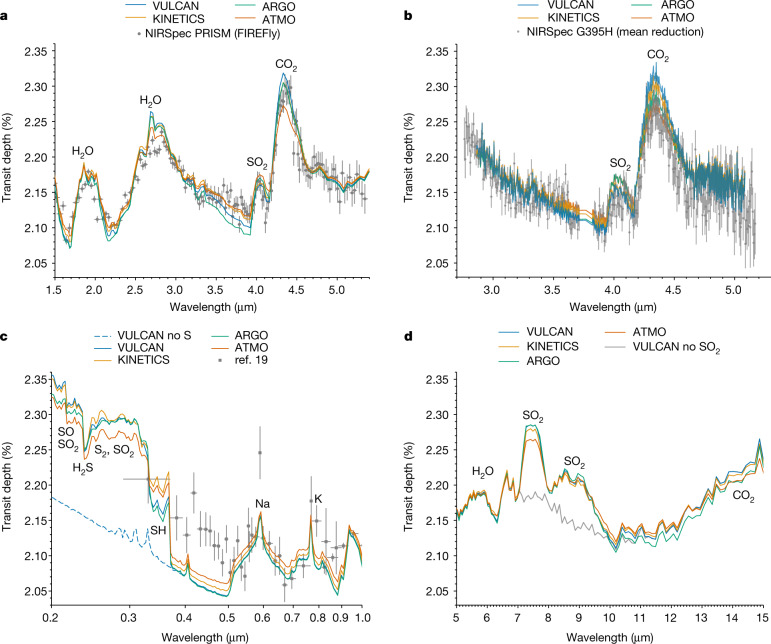
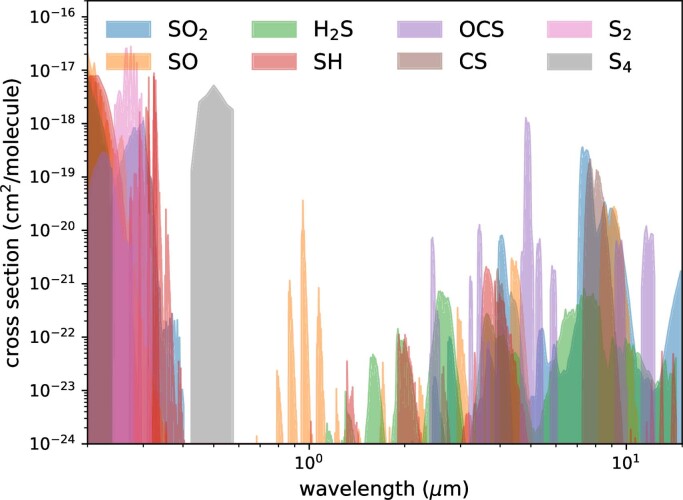
Figure 3 shows the morning/evening averaged transmission spectra resulting from the different photochemical models. All models are able to reproduce the strength and shape of the 4.05-μm SO2 feature seen in the NIRSpec PRISM and G395H modes. The scatter in the model spectra is on par with the uncertainties of the data and is attributed to the spread in the vertical VMR structure of SO2 and CO2 produced by each model (Fig. 1). Also shown in Fig. 3 are the predicted spectra in the MIRI LRS wavelength range (5–12 μm), which exhibit prominent SO2 features around 7.5 μm and 8.8 μm, as well as an upward slope redward of 12 μm owing to CO2. Furthermore, our models predict a strong UV (0.2–0.38 μm) transmission signal from the presence of S species: H2S, S2, SO2 and SH produce a sharp opacity gradient shortward of 0.38 μm (Extended Data Fig. 7), at which the room-temperature UV cross-sections are used except those at 800 K for SH. The discrepancy between the models and previous HST STIS and VLT/FORS2 observations19 (see Fig. 3) within 0.38–0.5 μm could potentially be because of enhanced UV opacities at high temperatures and/or aerosol particles. Further characterization of the sulfur species spectral features in the UV is promising with the scheduled HST/UVIS observation (Program 17162, principal investigators: Z. Rustamkulov and D. Sing).
Fig. 3. Terminator-averaged theoretical transmission spectra.
We show the transmission spectra averaged over the morning and evening terminators generated from 1D photochemical model results. a, Comparison with the NIRSpec PRISM FIREFly reduction8. b, Comparison with the NIRSpec G395H weighted-mean reduction9. c, Comparison with the current HST and VLT/FORS2 optical wavelength data19,37. The models show pronounced features at UV wavelengths owing to sulfur species compared with the model without S-bearing species (dashed blue line). d, Predicted spectra across the MIRI LRS wavelength range, with SO2 removed from the VULCAN output shown in grey to indicate its contribution. All of the spectral data show 1σ error bars and the standard deviations averaged (unweighted) over all reductions are shown for the NIRSpec G395H data.
Extended Data Fig. 7. The opacities of several sulfur species.
Opacities of several sulfur species at 1,000 K and 1 mbar, except that those in the UV and of OCS are at room temperature. The opacities in the infrared are binned down to R ≈ 1,000 for clarity.
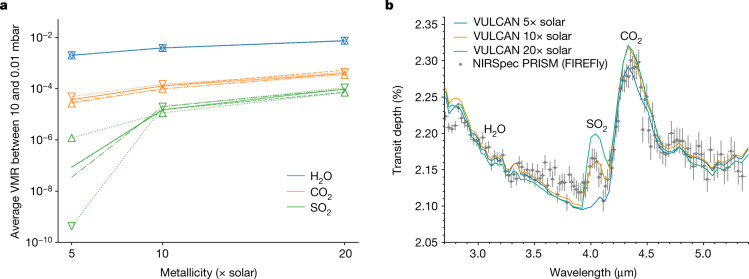
SO2 has recently been suggested as a promising tracer of metallicity in giant exoplanet atmospheres16. To test this and show trends in atmospheric properties, we have conducted sensitivity analysis on metallicity as well as temperature and vertical mixing using VULCAN (see Methods for details and further tests on C/O and stellar UV flux). Figure 4a summarizes these results for SO2, along with H2O and CO2, which are more commonly used as proxies for atmospheric metallicity13,20–22. Overall, the average abundance of SO2 in the pressure region relevant for such observation is not strongly sensitive to temperature or vertical mixing once SO2 has reached observable ppm levels and is mildly sensitive to C/O (see Extended Data Fig. 5). By contrast, SO2 shows either a similar or a stronger dependence on metallicity compared with H2O and CO2. This sensitivity to metallicity can be understood from the net reaction (equation (1)), in which it takes one molecule of H2S and two molecules of H2O to make one SO2. Although SO2 can be further oxidized into SO3, which requires extra oxygen, SO3 is rarely produced to an observable level in a H2-dominated atmosphere. Therefore, SO2 can be an ideal tracer of heavy-element enrichment for giant planets, with given constraints on the temperature and stellar far-ultraviolet (FUV) flux. The applicability of SO2 as a tracer of metallicity is further shown in Fig. 4b, in which the increase in the SO2 feature amplitude between 5× and 20× solar metallicity is much greater than that of CO2 and H2O. As such, retrieval analyses seeking to evaluate the atmospheric metallicity of warm giant exoplanets can substantially benefit from both CO2 and SO2 measurements.
Fig. 4. The metallicity trends and synthetic spectra with varying metallicity.
a, The averaged VMR of H2O, CO2 and SO2 in the atmosphere between 10 and 0.01 mbar examined by transmission spectroscopy as a function of atmospheric metallicity. The nominal model is shown by solid lines, whereas the eddy diffusion coefficient (Kzz) scaled by 0.1 and 10 are shown by dashed and dashed-dotted lines, respectively. The models with the whole temperature increased and decreased by 50 K are indicated by the upward-facing and downward-facing triangles connected by dotted lines, respectively. b, The morning and evening terminator-averaged theoretical transmission spectra with different metallicities (relative to solar value) compared with the NIRSpec observation. The error bars show 1σ standard deviations.
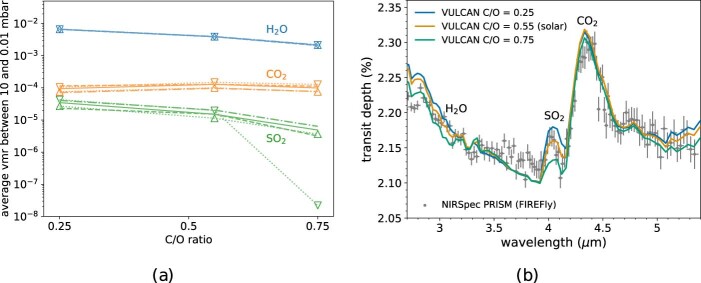
Extended Data Fig. 5. The C/O trends and synthetic spectra.
Same as Fig. 4 but as a function of C/O ratio at 10× solar metallicity. a, The averaged VMR of H2O, CO2 and SO2 between 10 and 0.01 mbar as a function of C/O ratio, in which the solar C/O is 0.55. The nominal model is shown by solid lines, whereas the eddy diffusion coefficient (Kzz) scaled by 0.1 and 10 are shown by dashed and dashed-dotted lines, respectively. The models for which the whole temperature increased and decreased by 50 K are indicated by the upward-facing and downward-facing triangles connected by dotted lines, respectively. b, The morning and evening terminator-averaged theoretical transmission spectra with different C/O ratios compared with the NIRSpec PRISM observation. The error bars show 1σ standard deviations.
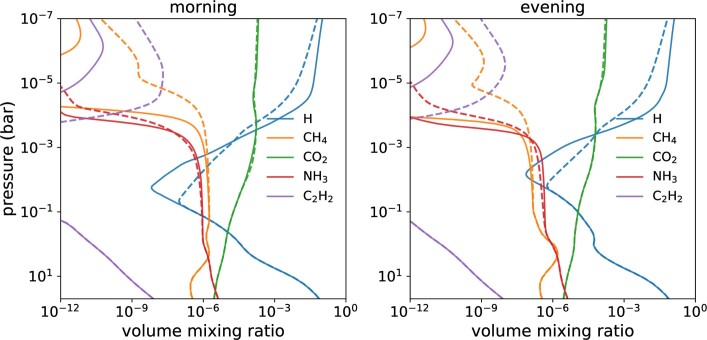
Our results demonstrate the importance of considering photochemistry—and sulfur chemistry in particular—in warm exoplanet atmospheres when interpreting exoplanet atmospheric observations. Exoplanet photochemistry has been investigated using numerical models since the detection of an atmosphere on a transiting exoplanet23,24, followed by a diverse set of subsequent studies explaining the interplay of carbon, oxygen, nitrogen, hydrogen and sulfur (see, for example, ref. 25 for a review). It has been further pointed out that sulfur can affect other nonsulfur species, such as atomic H, CH4 and NH3 (refs. 6,15; also see Extended Data Fig. 6). Temperature trends in the photochemical production of sulfur species (Extended Data Fig. 10) in exoplanet atmospheres are potentially observable with features in the UV and infrared (Fig. 3 and Extended Data Fig. 7). At temperatures higher than that of WASP-39b, SH and SO may become relatively more abundant than SO2 (refs. 6,13,15). Observing these compositional variations with temperature in H2-dominated atmospheres, modulated by the atmospheric metallicity, could substantially improve our understanding of high-temperature chemical networks and atmospheric properties. The observational effort should also be complemented by a more accurate determination of key chemical reaction rate constants and UV cross-sections at the relevant temperatures (for example, refs. 26,27), as well as photochemical modelling development beyond 1D that includes horizontal transport (for example, refs. 28–30).
Extended Data Fig. 6. The impact of sulfur on other nonsulfur species.
VMR profiles of some species in our WASP-39b model that exhibit differences from VULCAN including sulfur kinetics (solid lines) and without sulfur kinetics (dashed lines).
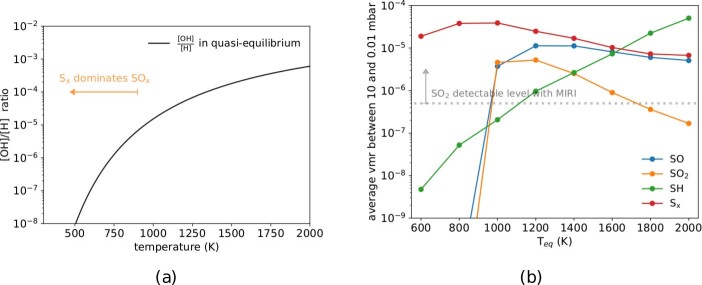
Extended Data Fig. 10. The OH to H ratio and the temperature trends for sulfur molecules produced by photochemistry.
a, as a proxy of OH to H ratio at 10× solar metallicity, in which and are the forward and backward rate constants of H2O + H → OH + H2, respectively. When OH becomes scarce relative to H as temperature decreases, the chain-forming path (does not require OH) is favoured over the oxidization path (requires OH). b, The average VMR between 10 and 0.01 mbar as a function of planetary equilibrium temperature with temperature profiles adopted from ref. 39 (see text for the setup). The dotted grey line marks approximately the required SO2 concentration to be detectable with WASP-39b parameters. Sx denotes the allotropes S2 and S8 and SOx denotes the oxidized species SO and SO2.
The accessibility of sulfur species in exoplanet atmospheres through the aid of photochemistry allows for a new window into planet-formation processes, whereas in the Solar System gas giants, the temperature is sufficiently low that sulfur is condensed out as either H2S clouds or together with NH3 as ammonium hydrosulfide (NH4SH) clouds31, making it more difficult to observe. Sulfur has been detected in protoplanetary disks32, in which it may be primarily in refractory form33, making it a reference element showing the metallicity contributions of accreted solid and gas34–36. Such efforts for warm giant exoplanets are now a possibility thanks to the observability of photochemically produced SO2. Thus, the detection of SO2 offers valuable insights into further atmospheric characterization and planet formation.
Methods
4.05-μm feature
A list of gas species that have been compared with the 4.05-μm absorption feature in the transit observation of WASP-39b can be found in ref. 8. In particular, species with absorption features at similar wavelengths but are ruled out include H2S, HCN, HBr, PH3, SiO and SiO2. H2S and HCN absorb shortward of the feature at 4.05 μm, whereas SiO2 absorbs longward of that, and HBr, SiO and PH3 have wider absorption bands than the observed feature. Chemically, SiO and SiO2 are also expected to rain out at the temperature of WASP-39b and the solar elemental abundances have little bromine (Br/H ≈ 4 × 10⁻¹⁰). Ultimately, the injection tests of SO2 provide 2.7σ detection with NIRSpec PRISM (ref. 8) and 4.8σ with G395H (ref. 9).
The temperature–pressure and eddy diffusion coefficient profiles derived from the Exo-FMS GCM
To provide inputs to the 1D photochemical models, a cloud-free WASP-39b GCM was run using the Exo-FMS GCM17. We computed the transmission spectra derived from our photochemical model results using gCMCRT (ref. 40) and the ExoAmes high-temperature SO2 line list41. System parameters were taken from ref. 7. We assume a 10× solar metallicity atmosphere in thermochemical equilibrium and use two-stream, correlated-k radiative transfer without optical and UV wavelength absorbers such as TiO, VO and Fe, which are assumed to have rained out from the atmosphere given the atmospheric temperatures of WASP-39b. The assumption about thermochemical equilibrium in radiative-transfer calculations will be discussed in the next section.
Although the temperatures of WASP-39b cross several condensation curves of sulfide clouds, such as Na2S and ZnS, the gas composition is not expected to be markedly affected. The elemental abundances of Na and Zn are less abundant than S (Na/S ≈ 0.13, Zn/S ≈ 0.0029), which would at most reduce approximately 20% of the total sulfur, similar to how oxygen is being sequestered in silicates and metals42. Furthermore, this full condensation is unlikely because sulfide condensates generally have high surface energies43,44 that inhibit efficient nucleation, consistent with the detection of gaseous sodium on WASP-39b (ref. 8).
The radius of WASP-39b is inflated notably and we assume an internal temperature of 358 K, taken from the relationship between irradiated flux and internal temperature found in ref. 45. Extended Data Fig. 2a shows the latitude–longitude map of the temperature at a pressure level of 10 mbar. The input to the photochemical models are the temperature–pressure profiles at the morning and evening limbs (Extended Data Fig. 2), which we compute by taking the average of the profiles over all latitudes and ±10° (as estimated from the opening-angle calculations from ref. 46) of the morning (western) and evening (eastern) terminators (that is, the region between the grey curves in Extended Data Fig. 2a. The cooler morning terminator as a result of the horizontal heat transport facilitated by the global circulation can be seen in the figure.
Vertical mixing in 1D chemical models is commonly parameterized by eddy diffusion. For exoplanets, the eddy diffusion coefficient (Kzz) is in general a useful but loosely constrained parameter. For the 1D photochemical models used in this work, we assume that Kzz follows an inverse square-root dependence with pressure in the stratosphere (for example, ref. 29) as
| 2 |
and held constant below the 5-bar level in the convective zone. The eddy diffusion profile generally fits the root-mean-squared vertical wind multiplied by 0.1 scale height as the characteristic length scale from the GCM. The resulting Kzz profile is presented in Extended Data Fig. 2.
Radiative feedback of disequilibrium composition
The temperature profiles adopted from the GCM assume chemical equilibrium abundances. To evaluate the radiative feedback from disequilibrium chemical abundances, we first performed self-consistent 1D calculations, coupling the radiative-transfer and photochemical-kinetics models using HELIOS (ref. 47) and VULCAN (ref. 6), for which the opacity sources in HELIOS include H2O, CH4, CO, CO2, NH3, HCN, C2H2, SH, H2S, SO2, Na, K, H−, CIA H2–H2 and H2–He (see references in ref. 47). Yet we found negligible differences between the temperature profile computed from equilibrium abundances and that from disequilibrium abundances. This is probably because water, as the predominant infrared opacity source, remains unaffected by disequilibrium processes. Meanwhile, a few opacities are missing in our radiative-transfer calculation. In particular, the opacity of SO2 (ref. 48) does not extend into the visible and UV wavelength range. Previous works13,49 indicated that SH and S2 have strong absorption in the UV–visible and can potentially affect the thermal structure. To quantify the radiative effect of these sulfur species, we calculated the shortwave heating rate with
| 3 |
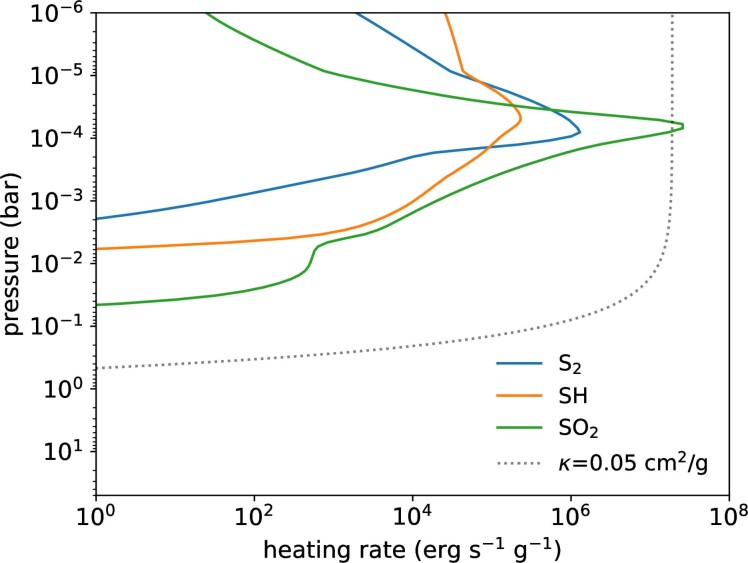
in which cP is the specific heat capacity of the air, F is the stellar flux associated with the direct beam and Δmi and Δmair are the column mass of species i and air of an atmospheric layer, respectively. Extended Data Fig. 3 illustrates the shortwave heating owing to SH, S2 and SO2. Our estimate shows that SO2 contributed the most in our WASP-39b model, rather than SH and S2 being the main shortwave absorbers for atmospheres with solar-like metallicity13,49. The peak of heating owing to SO2 is comparable with a grey opacity of 0.05 cm2 g−1 over 220–800 nm and could potentially raise the temperatures around 0.1 mbar (the visible grey opacity for the irradiation of WASP-39b irradiation is about 0.005 cm2 g−1 (ref. 50)). Nevertheless, this heating effect does not change our main conclusions about photochemically forming SO2 on WASP-39b. As long as temperatures do not fall below roughly 750 K, at which sulfur allotrope formation starts to take over, SO2 is not too sensitive to temperature increases up to 100 K.
Extended Data Fig. 3. Shortwave radiative heating of sulfur species.
Radiative heating rates (erg s−1 g−1) of SO2, SH and H2S to demonstrate their potential impact on the temperature structure. Heating owing to a vertically constant grey opacity of 0.05 cm2 g−1 is shown for comparison. All heating rates are integrated over 220–800 nm.
The stellar spectrum of WASP-39
We require the high-energy spectral energy distribution (SED) of the WASP-39 host star as input to drive our set of photochemical models. However, as an inactive mid G-type star (Teff = 5,485 ± 50 K; ref. 51) at a distance of 215 pc (Gaia DR3), WASP-39 is too faint for high-S/N UV spectroscopy with HST. To approximate the stellar radiation incident on WASP-39b, we created a custom stellar SED that combines direct spectroscopy of WASP-39 in the optical (with HST/STIS G430L and G750L modes; GO 12473, principal investigator: D. Sing) with representative spectra from analogous stars at shorter wavelengths.
Our approach to estimating the UV stellar SED was based on two factors: (1) in the near-ultraviolet (NUV; 2,300–2,950 Å), in which the flux is dominated by the photosphere, we chose a proxy with a similar spectral type to WASP-39 and (2) in the extreme ultraviolet (XUV) and FUV (1–2,300 Å), in which the stellar flux is dominated by chromospheric, transition region and coronal emission lines, we chose a proxy star with similar chromospheric activity indicators and used spectral type as a secondary consideration. In the NUV, we used HST/STIS E230M spectra of HD 203244, a relatively active (Ca II log() = −4.4 (ref. 52)), nearby (that is, unreddened, d = 20.8 pc; Gaia DR2), G5 V star (Teff = 5,480 K (ref. 53)) from the STARCat archive54. Although HD 203244 is a suitable proxy at photospheric wavelengths, WASP-39 is a relatively old (about 7 Gyr) star with low chromospheric activity (log() = −4.97 ± 0.06) and a long rotation period (Prot = 42.1 ± 2.6 days; ref. 51), suggesting substantially lower high-energy flux than HD 203244. Therefore, we elected to use a lower-activity G-type star, the Sun, at wavelengths shorter than 2,300 Å. The Sun has high-quality archival data available across the UV and X-rays and similar chromospheric activity to WASP-39 (the average solar Ca II log() value is −4.902 ± 0.063 and ranges from approximately −4.8 to −5.0 from solar maximum to solar minimum55,56). With the components in hand, we first corrected the observed STIS spectra of WASP-39 for interstellar dust extinction of E(B − V) = 0.079 (ref. 57) using a standard RV = 3.1 interstellar reddening curve58 and then interpolated all spectra onto a 0.5-Å-pixel−1 grid. The NUV spectrum of HD 203244 was scaled to the reddening-corrected WASP-39 observations in the overlap region between 2,900 and 3,000 Å and the XUV + FUV spectrum of the quiet Sun59 was scaled to the blue end of the combined SED. The flux scaling between two spectral components is defined as ((Fref − α × Fproxy)/σref)2 in the overlap region, in which ‘proxy’ is the spectrum being scaled, ‘ref’ is the spectrum to which we are scaling and α is the scale factor applied to the proxy spectrum. α is varied until the above quantity is minimized (α = 2.04 × 10⁻¹⁶ and 7.58 × 10⁻³ for the FUV and NUV components, respectively). The final combined spectrum was convolved with a 2-Å full width at half maximum Gaussian kernel and wavelengths longer than 7,000 Å were removed to avoid the near-infrared fringing in the STIS G750L mode. We show the stellar spectrum at the surface of the star used for our photochemical models in Extended Data Fig. 2.
We compared our estimated SED for WASP-39 against archival GALEX observations from Shkolnik60, who found the NUV (1,771–2,831 Å) flux density to be 168.89 μJy, or an average NUV spectral flux of Fλ = 9.8 × 10⁻¹⁶ erg cm−2 s−1 Å−1 at 2,271 Å. Correcting this value by the average extinction correction in the GALEX NUV bandpass, a factor of 1.79, and comparing it with the average flux of our estimated SED over the same spectral range (1.66 × 10⁻¹⁵ erg cm−2 s−1 Å−1), we find the agreement between the GALEX measurement of WASP-39 and our stellar proxy to be better than 6%.
Simulated transmission spectra from gCMCRT
To post-process the 1D photochemical model output and produce transmission spectra, we use the 3D Monte Carlo radiative-transfer code gCMCRT40.
For processing 1D columns, gCMCRT uses 3D spherical geometry but with a constant vertical profile across the globe in latitude and longitude. In this way, spectra from 1D outputs can be computed. We process the morning and evening terminator vertical 1D chemical profiles of each photochemical model separately, taking the average result of the two transmission spectra to produce the final spectra that are compared with the observational data.
In the transmission spectra model, we use opacities generated from the following line lists: H2O (ref. 61), OH (ref. 62), CO (ref. 63), CO2 (ref. 64), CH4 (ref. 65), CH3 (ref. 66), HCN (ref. 67), C2H2 (ref. 68), C2H4 (ref. 69), C2H6 (ref. 70), C4H2 (ref. 70), C2 (ref. 71), CN (ref. 72), CH (ref. 73), SO2 (ref. 41), SH (ref. 48), SO (ref. 74), H2S (ref. 75), NO (ref. 76), N2O (ref. 76), NO2 (ref. 76), HCl (ref. 70), Na (ref. 77), K (ref. 77).
Description of photochemical models
We use the following 1D thermo-photochemical models to produce the steady-state chemical abundance profiles for the terminators of WASP-39b. All models assume cloud-free conditions and adopt the same temperature profiles, stellar UV flux, eddy diffusion coefficient profile (Extended Data Fig. 2) and zero-flux (closed) boundary conditions. A zenith angle of 83° (an effective zenith angle that matches the terminator-region-mean actinic flux for near-unity optical depth) is assumed for the terminator photochemical modelling.
VULCAN
The 1D kinetics model VULCAN treats thermochemical78 and photochemical6 reactions. VULCAN solves the Eulerian continuity equations, including chemical sources/sinks, diffusion and advection transport, and condensation. We applied the C-H-N-O-S network (https://github.com/exoclime/VULCAN/blob/master/thermo/SNCHO_photo_network.txt) for reduced atmospheres containing 89 neutral C-bearing, H-bearing, O-bearing, N-bearing and S-bearing species and a total of 1,028 thermochemical reactions (that is, 514 forward–backward pairs) and 60 photolysis reactions. The sulfur allotropes are simplified into a system of S, S2, S3, S4 and S8. The sulfur kinetics data are drawn from the NIST and KIDA databases, as well as modelling5,79 and ab initio calculations published in the literature (for example, ref. 80). For simplicity and cleaner model comparison, the temperature-dependent UV cross-sections6 are not used in this work. The pathfinding algorithm described in ref. 81 is used to identify the important chemical pathways. We note that the paths presented in this study are mainly based on VULCAN output (see Extended Data Table 1). Although detailed reactions might differ between different photochemical models, the main paths remain robust.
Extended Data Table 1.
Important reactions for SO2 production
List of selected reactions relevant for SO2 production in the VULCAN model of WASP-39b.
KINETICS
The KINETICS 1D thermo-photochemical transport model42 uses the Caltech/JPL KINETICS model82,83 to solve the coupled 1D continuity equations describing the chemical production, loss and vertical transport of atmospheric constituents of WASP-39 b. The model contains 150 neutral C-bearing, H-bearing, O-bearing, N-bearing, S-bearing and Cl-bearing species that interact with each other through a total of 2,350 reactions (that is, 1,175 forward–reverse reaction pairs). These reactions have all been fully reversed through the thermodynamic principle of microscopic reversibility84, such that the model would reproduce thermochemical equilibrium in the absence of transport and external energy sources, given sufficient integration time. The chemical reaction list involving C-bearing, H-bearing, O-bearing and N-bearing species is taken directly from ref. 22. Included for the first time here are 41 sulfur and chlorine species: S, S(1D), S2, S3, S4, S8, SH, H2S, HS2, H2S2, CS, CS2, HCS, H2CS, CH3S, CH3SH, SO, SO2, SO3, S2O, HOSO2, H2SO4 (gas and condensed), OCS, NS, NCS, HNCS, Cl, Cl2, HCl, ClO, HOCl, ClCO, ClCO3, ClS, ClS2, Cl2S, ClSH, OSCl, ClSO2 and SO2Cl2. The thermodynamic data of several chlorine-bearing and sulfur-bearing species are not available in the previous literature and we performed ab initio calculations for these species. We first carried out electronic-structure calculations at the CBS-QB3 level of theory using Gaussian 09 (ref. 85) to determine geometric conformations, energies and vibrational frequencies of the target molecules. Then the thermodynamic properties of these molecules were calculated by Arkane (ref. 86), a package included in the open-source software RMG v3.1.0 (refs. 87,88), with atomic-energy corrections, bond corrections and spin–orbit corrections, based on the CBS-QB3 level of theory as the model chemistry. The reaction rate coefficients and photolysis cross-sections for these S and Cl species are derived from Venus studies89–94, interstellar medium studies95, Io photochemical models96,97, Jupiter cometary-impact models98,99, the combustion-chemistry literature100–103, terrestrial stratospheric compilations104,105 and numerous individual laboratory or computational kinetics studies (such as refs. 106–110).
ARGO
The 1D thermochemical and photochemical kinetics code ARGO originally111,112 used the Stand2019 network for neutral hydrogen, carbon, nitrogen and oxygen chemistry. ARGO solves the coupled 1D continuity equation including thermochemical-photochemical reactions and vertical transport. The Stand2019 network was expanded by Rimmer et al. 113 by updating several reactions, incorporating the sulfur network developed by ref. 15, and supplementing it with reactions from refs. 93,114, to produce the Stand2020 network. The Stand2020 network includes 2,901 reversible reactions and 537 irreversible reactions, involving 480 species composed of H, C, N, O, S, Cl and other elements.
ATMO
The C-H-N-O chemical kinetics scheme from ref. 115 is implemented by ref. 116 in the standard 1D atmosphere model ATMO, which solves for the chemical disequilibrium steady state. As of the time of writing of this article, the sulfur kinetic scheme of ATMO, derived from applied combustion models, is still at the development and validation stage. Hence, for WASP-39b, we performed ATMO with the C-H-N-O-S thermochemical network from VULCAN (ref. 6) along with the photochemical scheme from ref. 117 (an update of the native photochemical scheme from ref. 115), with another 71 photolysis reactions of H2S, S2, S2O, SO, SO2, CH3SH, SH, H2SO and COS.
Sensitivity tests
We examine the sensitivity of our chemical outcomes to essential atmospheric properties using VULCAN. For models with various metallicity and C/O ratios, we explore the sensitivity to temperature and vertical mixing by systematically varying the temperature–pressure and eddy diffusion coefficient profiles. Specifically, the temperature throughout the atmosphere is shifted by 50 K and the eddy diffusion coefficients are multiplied/divided by 10. These variations span a range comparable with the temperature differences among radiative transfer models47 and the uncertainties in parameterizing vertical mixing with eddy diffusion coefficients118,119. On our choice of internal heat, we have further conducted tests with different internal temperatures and found that the compositions above 1 bar are not sensitive to internal temperature, because the quench levels of the main species are at higher levels given the adopted eddy diffusion coefficient. We have also verified that the temperature above the top boundary of the GCM (about 5 × 10⁻⁵ bar; Extended Data Fig. 2) does not affect the composition below.
Sensitivity to C/O is summarized in Extended Data Fig. 5, in which the nominal model has a C/O ratio of 0.55, as in the main text. The averaged abundance of both SO2 and H2O in the pressure region relevant for transmission spectrum observations show similar dependencies on C/O, decreasing by a few factors as the C/O increased from sub-solar (0.25) to super-solar (0.75) values. The averaged abundance of SO2 is not very sensitive to temperature and vertical mixing either, except for C/O = 0.75, for which the SO2 concentration is at roughly the ppm level, similar to what is found in Fig. 4.
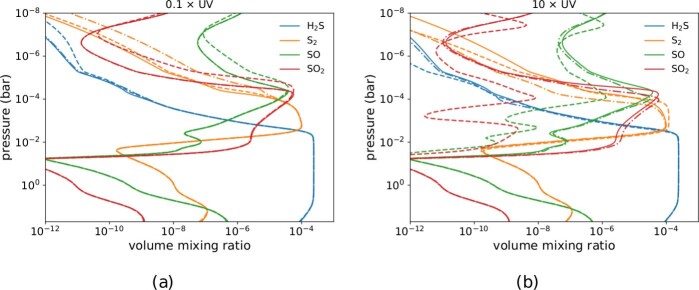
Finally, we performed sensitivity tests to the UV irradiation—the ultimate energy source of photochemistry. We first tested the sensitivity to the assumed stellar spectra by performing the same models with the solar spectrum (close to WASP-39) and found negligible differences in the photochemical results. Because the UV spectrum shortward of 295 nm is constructed from stellar proxies rather than directly measured, we then focused on varying the stellar flux in the FUV (1–230 nm) and NUV (230–295 nm) separately. Extended Data Fig. 8 shows that the resulting sulfur species abundances are almost identical when the UV flux is reduced by a factor of 10, broadly consistent with what Zahnle et al.5 suggested that the photochemical destruction of H2S only becomes photon-limited when the stellar UV flux is reduced by about two orders of magnitude (for a directly imaged gas giant). On the other hand, although SO and SO2 are not sensitive to increased NUV, they are substantially depleted with increased FUV. This is because the photodissociation of SO and SO2 mainly operates in the FUV and the enhanced FUV can destroy SO and SO2, even with the same amount of available OH radicals.
Extended Data Fig. 8. The main sulfur species abundances with reduced and enhanced UV irradiation.
VMR profiles of the main sulfur species in the VULCAN morning-terminator model with 0.1× (a) and 10× (b) UV. Our nominal model is shown by solid lines for comparison, whereas the model with varying FUV (1–230 nm) is shown by the dashed lines and that with varying NUV (230–295 nm) is shown by dashed-dotted lines.
Spectral effects of assuming a vertically uniform SO2 distribution
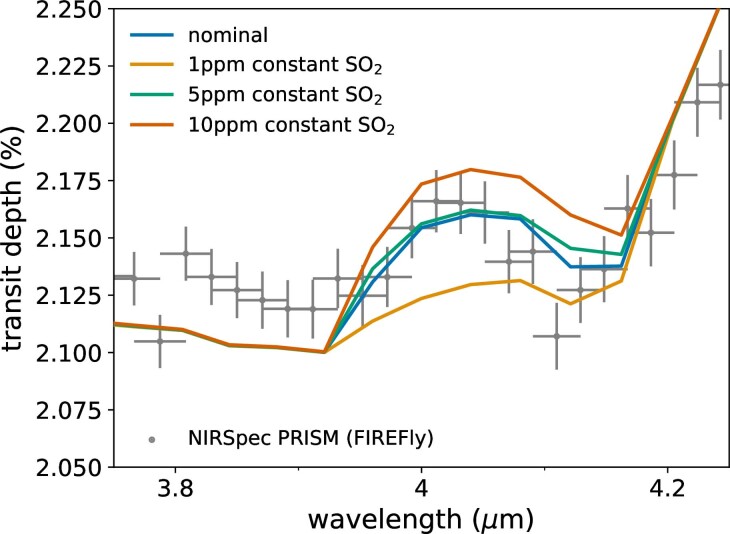
Minor species commonly have VMR varying with altitude in the observable region of the atmosphere, especially those produced or destroyed by photochemistry. Extended Data Fig. 9 demonstrates that assuming a vertically constant VMR of SO2 can lead to underestimating its abundances by about an order of magnitude. This is verified by comparing the column-integrated number density from the pressure level relevant for transmission spectroscopy. For example, the terminator-averaged column-integrated number density of SO2 above 10 mbar by VULCAN is about 1.4 × 10¹⁹ molecules cm−2, which is equal to a vertically uniform SO2 with a concentration around 4 ppm. Hence modelling frameworks that assume vertically uniform composition should be treated with caution and would benefit from comparisons with photochemical models, especially for photochemically active species that can exhibit large vertical gradients.
Extended Data Fig. 9. The effects of assuming a vertically uniform distribution of SO2.
Terminator-averaged theoretical transmission spectra generated from abundance distribution computed by the photochemical model VULCAN compared with assuming constant 1, 5 and 10 ppm of SO2. As before, the NIRSpec PRISM observation is shown with 1σ error bars.
Opacities of sulfur species
The opacities of sulfur species illustrated in Extended Data Fig. 7 are compiled from UV cross-sections and infrared line lists. The room-temperature UV cross-sections are taken from the Leiden Observatory database120 (http://home.strw.leidenuniv.nl/~ewine/photo). The infrared opacities include SO2 (ref. 121), H2S (refs. 122,48), CS (ref. 123) and a newly computed high-temperature line list for SO (ref. 74). The opacity from OCS (ref. 124) is only available up to room temperature at present, hence its coverage is probably incomplete in our region of interest.
Alternative SO2 production pathways
S2 formation can compete with SO2 production, as we will explore in detail in the next section. On WASP-39b, reactions involving S2 are found to be important in oxidizing S at high pressures at which less OH is available. S and SH would first react to form S2 by SH + S → H + S2 before getting oxidized through S2 + OH → SO + SH. The scheme is similar to that in equation (1) except SH and S2 play the role of the catalyst to oxidize S into SO, whereas SO can also self-react to form SO2 in this regime (references of important reactions are listed in Extended Data Table 1).
Implications of observing sulfur photochemistry
The temperature of WASP-39b resides within the sweet spot of producing SO2 (ref. 16). Previous photochemical modelling works suggested that, at lower temperatures, sulfur allotropes would be favoured over SO2, whereas SH can prevail at higher temperatures5,6. Here we briefly explain the general temperature trends of sulfur photochemical products.
After S is liberated from H2S, sulfur can follow either the oxidization or the chain polymerization paths, as illustrated in Fig. 2. The competing of the two paths is essentially controlled by the abundance of the oxidizing radical OH relative to atomic H. We can estimate the OH to H ratio by assuming that OH is in quasi-equilibrium with H2O, that is, , in which and are the forward and backward rate constants of H2O + H → OH + H2, respectively. Then, , because most of the O is in H2O. Extended Data Fig. 10a shows that the [OH]/[H] ratio strongly depends on temperature. When the temperature drops below about 750 K, the scarcity of OH makes S preferably react with SH to form S2. SO and SO2 could only be produced at higher altitudes, at which more OH is available from water photolysis (for example, refs. 5,6).
We further perform photochemical calculations using VULCAN with a grid of temperature profiles across planetary equilibrium temperatures 600–2,000 K, adopted from the 1D radiative–convective equilibrium models applied in ref. 39, in which an internal temperature of 100 K with perfect heat redistribution and gravity g = 1,000 cm s−2 are assumed. Apart from the thermal profiles, we keep the rest of the planetary parameters the same as the WASP-39b model in this work, including stellar UV irradiation. Extended Data Fig. 10b reveals the observation of sulfur photochemistry on other irradiated exoplanets, summarizing the averaged abundances of the key sulfur molecules produced by photochemistry as a function of equilibrium temperature. For 10× solar metallicity, the sweet-spot temperature for producing observable SO2 is 1,000 K ≲ Teq ≲ 1,600 K. For Teq ≲ 1,000 K, SO2 production below the 0.01-mbar level ceased and Sx (sulfur allotropes; mainly S2 and S8 here) is more favoured. For Teq ≳ 1,600 K, SH becomes the predominant sulfur-bearing molecular (apart from atomic S) around mbar levels. Although observing SH is challenging in the infrared, it can potentially be identified in the near-UV (300–400 nm)125.
Online content
Any methods, additional references, Nature Portfolio reporting summaries, source data, extended data, supplementary information, acknowledgements, peer review information; details of author contributions and competing interests; and statements of data and code availability are available at 10.1038/s41586-023-05902-2.
Supplementary information
Acknowledgements
This work is based on observations made with the NASA/ESA/CSA JWST. The working groups are associated with programme JWST-ERS-01366. The initial manuscript was improved by the constructive comments from L. Mancini, J. Mendonça, A. Saba and X. Tan. S.-M.T. is supported by the European Research Council advanced grant EXOCONDENSE (no. 740963; principal investigator: R. T. Pierrehumbert). E.K.H.L. is supported by the SNSF Ambizione Fellowship grant (no. 193448). X.Z. is supported by NASA Exoplanet Research grant 80NSSC22K0236. O.V. acknowledges funding from the ANR project ‘EXACT’ (ANR-21-CE49-0008-01), from the Centre National d’Études Spatiales (CNES) and from the CNRS/INSU Programme National de Planétologie (PNP). L.D. acknowledges support from the European Union H2020-MSCA-ITN-2109 under grant no. 860470 (CHAMELEON) and the KU Leuven IDN/19/028 grant Escher. This work benefited from the 2022 Exoplanet Summer Program at the Other Worlds Laboratory (OWL) at the University of California, Santa Cruz, a programme financed by the Heising-Simons Foundation. T.D. is an LSSTC Catalyst Fellow. J.K. is an Imperial College Research Fellow. B.V.R. is a 51 Pegasi b Fellow. L.W. is an NHFP Sagan Fellow. A.D.F. is an NSF Graduate Research Fellow.
Extended data figures and tables
Author contributions
All authors played a notable role in the JWST Transiting Exoplanet Community Early Release Science Program, including the original proposal, preparatory work, tool development, coordinating meetings and so on. Some specific contributions are listed as follows. S.-M.T., P.G., D.P., X.Z., E.K.H.L. and V.P. designed the project and drafted the article. E.K.H.L. and L.C. performed 3D GCMs. S.-M.T., J.M., E.H., O.V., S.J., R.H., J.Y., K.M., R.B., C.J.B. and A.L. developed and/or performed photochemical models. S.-M.T., J.M., E.H., O.V., S.J., R.H., K.O. and P.T. contributed substantially to model comparisons and chemical analysis. K.L.C. and S.-M.T. compiled the sulfur opacities and E.K.H.L. computed the synthetic spectra. Z.R., D.K.S., J.K., E.S., and A.L.C. reduced and analysed the NIRSpec PRISM data. L.A., H.R.W., M.K.A., S.B., D.G., J.I., T.M.-E. and N.L.W. reduced and analysed the NIRSpec G395H data, with further contributions from J.B. and T.D. B.V.R., J.J.F., S.E.M., S.R., Y.M., K.L.C. and L.D. provided substantial feedback, with E.H. coordinating comments from all other authors, to improve the manuscript.
Peer review
Peer review information
Nature thanks Panayotis Lavvas and the other, anonymous, reviewer(s) for their contribution to the peer review of this work. Peer reviewer reports are available.
Data availability
The data used in this paper are associated with JWST ERS Program 1366 and are available from the Mikulski Archive for Space Telescopes (https://mast.stsci.edu), which is operated by the Association of Universities for Research in Astronomy, Inc., under NASA contract NAS 5-03127 for JWST. The chemical networks and abundance output of the photochemical models (ARGO, ATMO, KINETICS and VULCAN) presented in this study are available at 10.5281/zenodo.7542781.
Code availability
The codes VULCAN and gCMCRT used in this work to simulate composition and produce synthetic spectra are publicly available: VULCAN6,78 (https://github.com/exoclime/VULCAN); gCMCRT40 (https://github.com/ELeeAstro/gCMCRT).
Competing interests
The authors declare no competing interests.
Footnotes
Publisher’s note Springer Nature remains neutral with regard to jurisdictional claims in published maps and institutional affiliations.
Extended data
is available for this paper at 10.1038/s41586-023-05902-2.
Supplementary information
The online version contains supplementary material available at 10.1038/s41586-023-05902-2.
References
- 1.Yung, Y. L. & DeMore, W. B. Photochemistry of Planetary Atmospheres (Oxford Univ. Press, 1999).
- 2.Stevenson KB, et al. Transiting exoplanet studies and community targets for JWST’s Early Release Science Program. Publ. Astron. Soc. Pac. 2016;128:094401–094411. doi: 10.1088/1538-3873/128/967/094401. [DOI] [Google Scholar]
- 3.Bean JL, et al. The Transiting Exoplanet Community Early Release Science Program for JWST. Publ. Astron. Soc. Pac. 2018;130:114402–114421. doi: 10.1088/1538-3873/aadbf3. [DOI] [Google Scholar]
- 4.Faedi F, et al. WASP-39b: a highly inflated Saturn-mass planet orbiting a late G-type star. Astron. Astrophys. 2011;531:A40. doi: 10.1051/0004-6361/201116671. [DOI] [Google Scholar]
- 5.Zahnle K, Marley MS, Morley CV, Moses JI. Photolytic hazes in the atmosphere of 51 ERI b. Astrophys. J. 2016;824:137. doi: 10.3847/0004-637X/824/2/137. [DOI] [Google Scholar]
- 6.Tsai S-M, et al. A comparative study of atmospheric chemistry with VULCAN. Astrophys. J. 2021;923:264. doi: 10.3847/1538-4357/ac29bc. [DOI] [Google Scholar]
- 7.JWST Transiting Exoplanet Community Early Release Science Team. Identification of carbon dioxide in an exoplanet atmosphere. Nature. 2023;614:649–652. doi: 10.1038/s41586-022-05269-w. [DOI] [PMC free article] [PubMed] [Google Scholar]
- 8.Rustamkulov Z, et al. Early Release Science of the exoplanet WASP-39b with JWST NIRSpec PRISM. Nature. 2023;614:659–663. doi: 10.1038/s41586-022-05677-y. [DOI] [PMC free article] [PubMed] [Google Scholar]
- 9.Alderson L, et al. Early Release Science of the exoplanet WASP-39b with JWST NIRSpec G395H. Nature. 2023;614:664–669. doi: 10.1038/s41586-022-05591-3. [DOI] [PMC free article] [PubMed] [Google Scholar]
- 10.Seinfeld, J. H. & Pandis, S. N. Atmospheric Chemistry and Physics: From Air Pollution to Climate Change (Wiley, 2016).
- 11.Atreya S, et al. A comparison of the atmospheres of Jupiter and Saturn: deep atmospheric composition, cloud structure, vertical mixing, and origin. Planet. Space Sci. 1999;47:1243–1262. doi: 10.1016/S0032-0633(99)00047-1. [DOI] [PubMed] [Google Scholar]
- 12.Visscher C, Lodders K, Fegley B., Jr Atmospheric chemistry in giant planets, brown dwarfs, and low-mass dwarf stars. II. Sulfur and phosphorus. Astrophys. J. 2006;648:1181–1195. doi: 10.1086/506245. [DOI] [Google Scholar]
- 13.Zahnle K, Marley MS, Freedman RS, Lodders K, Fortney JJ. Atmospheric sulfur photochemistry on hot Jupiters. Astrophys. J. 2009;701:L20–L24. doi: 10.1088/0004-637X/701/1/L20. [DOI] [Google Scholar]
- 14.Wang D, Miguel Y, Lunine J. Modeling synthetic spectra for transiting extrasolar giant planets: detectability of H2S and PH3 with the James Webb Space Telescope. Astrophys. J. 2017;850:199. doi: 10.3847/1538-4357/aa978e. [DOI] [Google Scholar]
- 15.Hobbs R, Rimmer PB, Shorttle O, Madhusudhan N. Sulfur chemistry in the atmospheres of warm and hot Jupiters. Mon. Not. R. Astron. Soc. 2021;506:3186–3204. doi: 10.1093/mnras/stab1839. [DOI] [Google Scholar]
- 16.Polman, J., Waters, L. B. F. M., Min, M., Miguel, Y. & Khorshid, N. H2S and SO2 detectability in hot Jupiters: sulfur species as indicator of metallicity and C/O ratio. Astron. Astrophys. 670, A161 (2023).
- 17.Lee EKH, et al. Simulating gas giant exoplanet atmospheres with Exo-FMS: comparing semigrey, picket fence, and correlated-k radiative-transfer schemes. Mon. Not. R. Astron. Soc. 2021;506:2695–2711. doi: 10.1093/mnras/stab1851. [DOI] [Google Scholar]
- 18.Lodders, K. Solar elemental abundances. Oxford Research Encyclopedia of Planetary Science (2020).
- 19.Wakeford HR, et al. The complete transmission spectrum of WASP-39b with a precise water constraint. Astron. J. 2018;155:29. doi: 10.3847/1538-3881/aa9e4e. [DOI] [Google Scholar]
- 20.Lodders K, Fegley B. Atmospheric chemistry in giant planets, brown dwarfs, and low-mass dwarf stars. I. Carbon, nitrogen, and oxygen. Icarus. 2002;155:393–424. doi: 10.1006/icar.2001.6740. [DOI] [Google Scholar]
- 21.Madhusudhan N, Seager S. High metallicity and non-equilibrium chemistry in the dayside atmosphere of hot-Neptune GJ 436b. Astrophys. J. 2011;729:41. doi: 10.1088/0004-637X/729/1/41. [DOI] [Google Scholar]
- 22.Moses JI, et al. Compositional diversity in the atmospheres of hot Neptunes, with application to GJ 436b. Astrophys. J. 2013;777:34. doi: 10.1088/0004-637X/777/1/34. [DOI] [PMC free article] [PubMed] [Google Scholar]
- 23.Charbonneau D, Brown TM, Noyes RW, Gilliland RL. Detection of an extrasolar planet atmosphere. Astrophys. J. 2002;568:377–384. doi: 10.1086/338770. [DOI] [Google Scholar]
- 24.Liang M-C, Parkinson CD, Lee AY-T, Yung YL, Seager S. Source of atomic hydrogen in the atmosphere of HD 209458b. Astrophys. J. 2003;596:L247–L250. doi: 10.1086/379314. [DOI] [Google Scholar]
- 25.Moses JI. Chemical kinetics on extrasolar planets. Philos. Trans. R. Soc. Lond. Ser. A. 2014;372:20130073. doi: 10.1098/rsta.2013.0073. [DOI] [PMC free article] [PubMed] [Google Scholar]
- 26.Venot O, et al. VUV-absorption cross section of carbon dioxide from 150 to 800 K and applications to warm exoplanetary atmospheres. Astron. Astrophys. 2018;609:A34. doi: 10.1051/0004-6361/201731295. [DOI] [Google Scholar]
- 27.Fortney, J. et al. The need for laboratory measurements and ab initio studies to aid understanding of exoplanetary atmospheres. Preprint at https://arxiv.org/abs/1905.07064 (2019).
- 28.Tsai S-M, et al. Inferring shallow surfaces on sub-Neptune exoplanets with JWST. Astrophys. J. Lett. 2021;922:L27. doi: 10.3847/2041-8213/ac399a. [DOI] [Google Scholar]
- 29.Moses JI, Tremblin P, Venot O, Miguel Y. Chemical variation with altitude and longitude on exo-Neptunes: predictions for ariel phase-curve observations. Exp. Astron. 2022;53:279–322. doi: 10.1007/s10686-021-09749-1. [DOI] [Google Scholar]
- 30.Baeyens R, Konings T, Venot O, Carone L, Decin L. Grid of pseudo-2D chemistry models for tidally locked exoplanets - II. The role of photochemistry. Mon. Not. R. Astron. Soc. 2022;512:4877–4892. doi: 10.1093/mnras/stac809. [DOI] [Google Scholar]
- 31.Atreya SK, et al. Deep atmosphere composition, structure, origin, and exploration, with particular focus on critical in situ science at the icy giants. Space Sci. Rev. 2020;216:18. doi: 10.1007/s11214-020-0640-8. [DOI] [Google Scholar]
- 32.Semenov D, et al. Chemistry in disks. XI. Sulfur-bearing species as tracers of protoplanetary disk physics and chemistry: the DM Tau case. Astron. Astrophys. 2018;617:A28. doi: 10.1051/0004-6361/201832980. [DOI] [Google Scholar]
- 33.Kama M, et al. Abundant refractory sulfur in protoplanetary disks. Astrophys. J. 2019;885:114. doi: 10.3847/1538-4357/ab45f8. [DOI] [Google Scholar]
- 34.Öberg KI, Wordsworth R. Jupiter’s composition suggests its core assembled exterior to the N2 snowline. Astron. J. 2019;158:194. doi: 10.3847/1538-3881/ab46a8. [DOI] [Google Scholar]
- 35.Turrini D, et al. Tracing the formation history of giant planets in protoplanetary disks with carbon, oxygen, nitrogen, and sulfur. Astrophys. J. 2021;909:40. doi: 10.3847/1538-4357/abd6e5. [DOI] [Google Scholar]
- 36.Pacetti E, et al. Chemical diversity in protoplanetary disks and its impact on the formation history of giant planets. Astrophys. J. 2022;937:36. doi: 10.3847/1538-4357/ac8b11. [DOI] [Google Scholar]
- 37.Nikolov N, et al. VLT FORS2 comparative transmission spectroscopy: detection of Na in the atmosphere of WASP-39b from the ground. Astrophys. J. 2016;832:191. doi: 10.3847/0004-637X/832/2/191. [DOI] [Google Scholar]
- 38.Stock JW, Kitzmann D, Patzer ABC. FastChem 2: an improved computer program to determine the gas-phase chemical equilibrium composition for arbitrary element distributions. Mon. Not. R. Astron. Soc. 2022;517:4070–4080. doi: 10.1093/mnras/stac2623. [DOI] [Google Scholar]
- 39.Ohno, K. & Fortney, J. J. Nitrogen as a tracer of giant planet formation. I.: a universal deep adiabatic profile and semi-analytical predictions of disequilibrium ammonia abundances in warm exoplanetary atmospheres. Preprint at https://arxiv.org/abs/2211.16876 (2022).
- 40.Lee EKH, et al. 3D radiative transfer for exoplanet atmospheres. gCMCRT: a GPU-accelerated MCRT code. Astrophys. J. 2022;929:180. doi: 10.3847/1538-4357/ac61d6. [DOI] [Google Scholar]
- 41.Underwood DS, et al. ExoMol molecular line lists - XIV. The rotation–vibration spectrum of hot SO2. Mon. Not. R. Astron. Soc. 2016;459:3890–3899. doi: 10.1093/mnras/stw849. [DOI] [Google Scholar]
- 42.Moses JI, et al. Disequilibrium carbon, oxygen, and nitrogen chemistry in the atmospheres of HD 189733b and HD 209458b. Astrophys. J. 2011;737:15. doi: 10.1088/0004-637X/737/1/15. [DOI] [Google Scholar]
- 43.Gao P, et al. Aerosol composition of hot giant exoplanets dominated by silicates and hydrocarbon hazes. Nat. Astron. 2020;4:951–956. doi: 10.1038/s41550-020-1114-3. [DOI] [Google Scholar]
- 44.Yu X, et al. Haze evolution in temperate exoplanet atmospheres through surface energy measurements. Nat. Astron. 2021;5:822–831. doi: 10.1038/s41550-021-01375-3. [DOI] [Google Scholar]
- 45.Thorngren D, Gao P, Fortney JJ. The intrinsic temperature and radiative–convective boundary depth in the atmospheres of hot Jupiters. Astrophys. J. Lett. 2019;884:L6. doi: 10.3847/2041-8213/ab43d0. [DOI] [Google Scholar]
- 46.Wardenier JP, Parmentier V, Lee EKH. All along the line of sight: a closer look at opening angles and absorption regions in the atmospheres of transiting exoplanets. Mon. Not. R. Astron. Soc. 2022;510:620–629. doi: 10.1093/mnras/stab3432. [DOI] [Google Scholar]
- 47.Malik M, et al. Self-luminous and irradiated exoplanetary atmospheres explored with HELIOS. Astron. J. 2019;157:170. doi: 10.3847/1538-3881/ab1084. [DOI] [Google Scholar]
- 48.Gorman MN, Yurchenko SN, Tennyson J. ExoMol molecular line lists XXXVI: X 2Π – X 2Π and A 2Σ+ – X 2Π transitions of SH. Mon. Not. R. Astron. Soc. 2019;490:1652–1665. doi: 10.1093/mnras/stz2517. [DOI] [Google Scholar]
- 49.Lavvas P, Arfaux A. Impact of photochemical hazes and gases on exoplanet atmospheric thermal structure. Mon. Not. R. Astron. Soc. 2021;502:5643–5657. doi: 10.1093/mnras/stab456. [DOI] [Google Scholar]
- 50.Guillot T. On the radiative equilibrium of irradiated planetary atmospheres. Astron. Astrophys. 2010;520:A27–A39. doi: 10.1051/0004-6361/200913396. [DOI] [Google Scholar]
- 51.Mancini L, et al. The GAPS programme with HARPS-N at TNG. XVI. Measurement of the Rossiter–McLaughlin effect of transiting planetary systems HAT-P-3, HAT-P-12, HAT-P-22, WASP-39, and WASP-60. Astron. Astrophys. 2018;613:A41. doi: 10.1051/0004-6361/201732234. [DOI] [Google Scholar]
- 52.Boro Saikia S, et al. Chromospheric activity catalogue of 4454 cool stars. Questioning the active branch of stellar activity cycles. Astron. Astrophys. 2018;616:A108. doi: 10.1051/0004-6361/201629518. [DOI] [Google Scholar]
- 53.Casagrande L, et al. New constraints on the chemical evolution of the solar neighbourhood and Galactic disc(s). Improved astrophysical parameters for the Geneva-Copenhagen Survey. Astron. Astrophys. 2011;530:A138. doi: 10.1051/0004-6361/201016276. [DOI] [Google Scholar]
- 54.Ayres TR. StarCAT: a catalog of space telescope imaging spectrograph ultraviolet echelle spectra of stars. Astrophys. J. Suppl. 2010;187:149–171. doi: 10.1088/0067-0049/187/1/149. [DOI] [Google Scholar]
- 55.Mamajek EE, Hillenbrand LA. Improved age estimation for solar-type dwarfs using activity-rotation diagnostics. Astrophys. J. 2008;687:1264–1293. doi: 10.1086/591785. [DOI] [Google Scholar]
- 56.Fossati L, et al. Suppressed far-UV stellar activity and low planetary mass loss in the WASP-18 system. Astron. J. 2018;155:113. doi: 10.3847/1538-3881/aaa891. [DOI] [Google Scholar]
- 57.Schlegel DJ, Finkbeiner DP, Davis M. Maps of dust infrared emission for use in estimation of reddening and cosmic microwave background radiation foregrounds. Astrophys. J. 1998;500:525–553. doi: 10.1086/305772. [DOI] [Google Scholar]
- 58.Cardelli JA, Clayton GC, Mathis JS. The relationship between infrared, optical, and ultraviolet extinction. Astrophys. J. 1989;345:245. doi: 10.1086/167900. [DOI] [Google Scholar]
- 59.Woods TN, et al. Solar Irradiance Reference Spectra (SIRS) for the 2008 Whole Heliosphere Interval (WHI) Geophys. Res. Lett. 2009;36:L01101. doi: 10.1029/2008GL036373. [DOI] [Google Scholar]
- 60.Shkolnik EL. An ultraviolet investigation of activity on exoplanet host stars. Astrophys. J. 2013;766:9. doi: 10.1088/0004-637X/766/1/9. [DOI] [Google Scholar]
- 61.Polyansky OL, et al. ExoMol molecular line lists XXX: a complete high-accuracy line list for water. Mon. Not. R. Astron. Soc. 2018;480:2597–2608. doi: 10.1093/mnras/sty1877. [DOI] [Google Scholar]
- 62.Hargreaves, R. J., Gordon, I. E., Kochanov, R. V. & Rothman, L. S. HITEMP: extensive molecular line lists for high-temperature exoplanet atmospheres. In EPSC-DPS Joint Meeting 2019 Vol. 13, EPSC-DPS2019-919-1 (2019).
- 63.Li G, et al. Rovibrational line lists for nine isotopologues of the CO molecule in the X 1Σ+ ground electronic state. Astrophys. J. Suppl. Ser. 2015;216:15. doi: 10.1088/0067-0049/216/1/15. [DOI] [Google Scholar]
- 64.Yurchenko SN, Mellor TM, Freedman RS, Tennyson J. ExoMol line lists – XXXIX. Ro-vibrational molecular line list for CO2. Mon. Not. R. Astron. Soc. 2020;496:5282–5291. doi: 10.1093/mnras/staa1874. [DOI] [Google Scholar]
- 65.Hargreaves RJ, et al. An accurate, extensive, and practical line list of methane for the HITEMP database. Astrophys. J. Suppl. 2020;247:55. doi: 10.3847/1538-4365/ab7a1a. [DOI] [Google Scholar]
- 66.Adam AY, Yachmenev A, Yurchenko SN, Jensen P. Variationally computed IR line list for the methyl radical CH3. J. Phys. Chem. A. 2019;123:4755–4763. doi: 10.1021/acs.jpca.9b02919. [DOI] [PubMed] [Google Scholar]
- 67.Barber RJ, et al. ExoMol line lists – III. An improved hot rotation-vibration line list for HCN and HNC. Mon. Not. R. Astron. Soc. 2014;437:1828–1835. doi: 10.1093/mnras/stt2011. [DOI] [Google Scholar]
- 68.Chubb KL, Tennyson J, Yurchenko SN. ExoMol molecular line lists – XXXVII. Spectra of acetylene. Mon. Not. R. Astron. Soc. 2020;493:1531–1545. doi: 10.1093/mnras/staa229. [DOI] [Google Scholar]
- 69.Mant BP, Yachmenev A, Tennyson J, Yurchenko SN. ExoMol molecular line lists – XXVII. Spectra of C2H4. Mon. Not. R. Astron. Soc. 2018;478:3220–3232. doi: 10.1093/mnras/sty1239. [DOI] [Google Scholar]
- 70.Gordon IE, et al. The HITRAN2020 molecular spectroscopic database. J. Quant. Spectrosc. Radiat. Transf. 2022;277:107949. doi: 10.1016/j.jqsrt.2021.107949. [DOI] [PMC free article] [PubMed] [Google Scholar]
- 71.Yurchenko SN, Szabó I, Pyatenko E, Tennyson J. ExoMol line lists XXXI: spectroscopy of lowest eights electronic states of C2. Mon. Not. R. Astron. Soc. 2018;480:3397–3411. doi: 10.1093/mnras/sty2050. [DOI] [Google Scholar]
- 72.Syme A-M, McKemmish LK. Full spectroscopic model and trihybrid experimental-perturbative-variational line list for CN. Mon. Not. R. Astron. Soc. 2021;505:4383–4395. doi: 10.1093/mnras/stab1551. [DOI] [PMC free article] [PubMed] [Google Scholar]
- 73.Masseron T, et al. CH in stellar atmospheres: an extensive linelist. Astron. Astrophys. 2014;571:A47. doi: 10.1051/0004-6361/201423956. [DOI] [Google Scholar]
- 74.Brady RP, Yurchenko SN, Kim GS, Somogyi W, Tennyson J. An ab initio study of the rovibronic spectrum of sulphur monoxide (SO): diabatic vs. adiabatic representation. Phys. Chem. Chem. Phys. 2022;24:24076–24088. doi: 10.1039/D2CP03051A. [DOI] [PMC free article] [PubMed] [Google Scholar]
- 75.Azzam AAA, Tennyson J, Yurchenko SN, Naumenko OV. ExoMol molecular line lists – XVI. The rotation-vibration spectrum of hot H2S. Mon. Not. R. Astron. Soc. 2016;460:4063–4074. doi: 10.1093/mnras/stw1133. [DOI] [Google Scholar]
- 76.Hargreaves RJ, et al. Spectroscopic line parameters of NO, NO2, and N2O for the HITEMP database. J. Quant. Spectrosc. Radiat. Transf. 2019;232:35–53. doi: 10.1016/j.jqsrt.2019.04.040. [DOI] [Google Scholar]
- 77.Kurucz, R. L. & Bell, B. Atomic line data. Kurucz CD-ROM no. 23 (Smithsonian Astrophysical Observatory, 1995).
- 78.Tsai S-M, et al. VULCAN: an open-source, validated chemical kinetics Python code for exoplanetary atmospheres. Astrophys. J. Suppl. Ser. 2017;228:20. doi: 10.3847/1538-4365/228/2/20. [DOI] [Google Scholar]
- 79.Moses JI. Sl9 impact chemistry: long-term photochemical evolution. Int. Astron. Union Colloq. 1996;156:243–268. doi: 10.1017/S0252921100115532. [DOI] [Google Scholar]
- 80.Du S, Francisco JS, Shepler BC, Peterson KA. Determination of the rate constant for sulfur recombination by quasiclassical trajectory calculations. J. Chem. Phys. 2008;128:204306. doi: 10.1063/1.2919569. [DOI] [PubMed] [Google Scholar]
- 81.Tsai S-M, et al. Toward consistent modeling of atmospheric chemistry and dynamics in exoplanets: validation and generalization of the chemical relaxation method. Astrophys. J. 2018;862:31. doi: 10.3847/1538-4357/aac834. [DOI] [Google Scholar]
- 82.Allen M, Yung YL, Waters JW. Vertical transport and photochemistry in the terrestrial mesosphere and lower thermosphere (50–120 km) J. Geophys. Res. 1981;86:3617–3627. doi: 10.1029/JA086iA05p03617. [DOI] [Google Scholar]
- 83.Yung YL, Allen M, Pinto JP. Photochemistry of the atmosphere of Titan: comparison between model and observations. Astrophys. J. Suppl. Ser. 1984;55:465–506. doi: 10.1086/190963. [DOI] [PubMed] [Google Scholar]
- 84.Visscher C, Moses JI. Quenching of carbon monoxide and methane in the atmospheres of cool brown dwarfs and hot Jupiters. Astrophys. J. 2011;738:72. doi: 10.1088/0004-637X/738/1/72. [DOI] [Google Scholar]
- 85.Frisch, M. J. et al. Gaussian 09, revision E.01 (Gaussian Inc., 2009).
- 86.Allen JW, Goldsmith CF, Green WH, West RH. Automatic estimation of pressure-dependent rate coefficients. Phys. Chem. Chem. Phys. 2012;14:1131–1155. doi: 10.1039/C1CP22765C. [DOI] [PubMed] [Google Scholar]
- 87.Gao CW, Allen JW, Green WH, West RH. Reaction Mechanism Generator: automatic construction of chemical kinetic mechanisms. Comput. Phys. Commun. 2016;203:212–225. doi: 10.1016/j.cpc.2016.02.013. [DOI] [Google Scholar]
- 88.Liu M, et al. Reaction Mechanism Generator v3.0: advances in automatic mechanism generation. J. Chem. Inf. Model. 2021;61:2686–2696. doi: 10.1021/acs.jcim.0c01480. [DOI] [PubMed] [Google Scholar]
- 89.Yung YL, Demore WB. Photochemistry of the stratosphere of Venus: implications for atmospheric evolution. Icarus. 1982;51:199–247. doi: 10.1016/0019-1035(82)90080-X. [DOI] [Google Scholar]
- 90.Mills, F. P. I. Observations and Photochemical Modeling of the Venus Middle Atmosphere. II. Thermal Infrared Spectroscopy of Europa and Callisto (California Inst. Technol., 1998).
- 91.Mills FP, Allen M. A review of selected issues concerning the chemistry in Venus’ middle atmosphere. Planet. Space Sci. 2007;55:1729–1740. doi: 10.1016/j.pss.2007.01.012. [DOI] [Google Scholar]
- 92.Krasnopolsky VA. Chemical kinetic model for the lower atmosphere of Venus. Icarus. 2007;191:25–37. doi: 10.1016/j.icarus.2007.04.028. [DOI] [Google Scholar]
- 93.Zhang X, Liang MC, Mills FP, Belyaev DA, Yung YL. Sulfur chemistry in the middle atmosphere of Venus. Icarus. 2012;217:714–739. doi: 10.1016/j.icarus.2011.06.016. [DOI] [Google Scholar]
- 94.Bierson CJ, Zhang X. Chemical cycling in the Venusian atmosphere: a full photochemical model from the surface to 110 km. J. Geophys. Res. 2020;125:e06159. doi: 10.1029/2019JE006159. [DOI] [Google Scholar]
- 95.Vidal THG, et al. On the reservoir of sulphur in dark clouds: chemistry and elemental abundance reconciled. Mon. Not. R. Astron. Soc. 2017;469:435–447. doi: 10.1093/mnras/stx828. [DOI] [Google Scholar]
- 96.Moses JI, Zolotov MY, Fegley B., Jr Alkali and chlorine photochemistry in a volcanically driven atmosphere on Io. Icarus. 2002;156:107–135. doi: 10.1006/icar.2001.6759. [DOI] [Google Scholar]
- 97.Moses JI, Zolotov MY, Fegley B., Jr Photochemistry of a volcanically driven atmosphere on Io: sulfur and oxygen species from a Pele-type eruption. Icarus. 2002;156:76–106. doi: 10.1006/icar.2001.6758. [DOI] [Google Scholar]
- 98.Moses JI, Allen M, Gladstone GR. Nitrogen and oxygen photochemistry following SL9. Geophys. Res. Lett. 1995;22:1601–1604. doi: 10.1029/95GL01199. [DOI] [Google Scholar]
- 99.Moses JI, Allen M, Gladstone GR. Post-SL9 sulfur photochemistry on Jupiter. Geophys. Res. Lett. 1995;22:1597–1600. doi: 10.1029/95GL01200. [DOI] [Google Scholar]
- 100.Sendt K, Jazbec M, Haynes BS. Chemical kinetic modeling of the H/S system: H2S thermolysis and H2 sulfidation. Proc. Combust. Inst. 2002;29:2439–2446. doi: 10.1016/S1540-7489(02)80297-8. [DOI] [Google Scholar]
- 101.Zhou C, Sendt K, Haynes BS. Experimental and kinetic modelling study of H2S oxidation. Proc. Combust. Inst. 2013;34:625–632. doi: 10.1016/j.proci.2012.05.083. [DOI] [PMC free article] [PubMed] [Google Scholar]
- 102.Zeng Z, Altarawneh M, Oluwoye I, Glarborg P, Dlugogorski BZ. Inhibition and promotion of pyrolysis by hydrogen sulfide (H2S) and sulfanyl radical (SH) J. Phys. Chem. A. 2016;120:8941–8948. doi: 10.1021/acs.jpca.6b09357. [DOI] [PubMed] [Google Scholar]
- 103.Alzueta MU, Pernía R, Abián M, Millera A, Bilbao R. CH3SH conversion in a tubular flow reactor. Experiments and kinetic modelling. Combust. Flame. 2019;203:23–30. doi: 10.1016/j.combustflame.2019.01.017. [DOI] [Google Scholar]
- 104.Sander, S. P. et al. Chemical kinetics and photochemical data for use in atmospheric studies. JPL publication no. 10-6 (2011).
- 105.Burkholder, J. B. et al. Chemical kinetics and photochemical data for use in atmospheric studies. Evaluation number 19. JPL publication 19-5 (2020).
- 106.Jourdain JL, Le Bras G, Combourieu J. Kinetic study of some elementary reactions of sulfur compounds including reactions of S and SO with OH radicals. Int. J. Chem. Kinetics. 1979;11:569–577. doi: 10.1002/kin.550110603. [DOI] [Google Scholar]
- 107.Shiina H, Miyoshi A, Matsui H. Investigation on the insertion channel in the S(3P) + H2 reaction. J. Phys. Chem. A. 1998;102:556–3559. doi: 10.1021/jp980650d. [DOI] [Google Scholar]
- 108.Peng J, Hu X, Marshall P. Experimental and ab initio investigations of the kinetics of the reaction of H atoms with H2S. J. Phys. Chem. A. 1999;103:5307–5311. doi: 10.1021/jp984242l. [DOI] [Google Scholar]
- 109.Du S, Francisco JS, Shepler BC, Peterson KA. Determination of the rate constant for sulfur recombination by quasiclassical trajectory calculations. J. Chem. Phys. 2008;128:204306. doi: 10.1063/1.2919569. [DOI] [PubMed] [Google Scholar]
- 110.Woon DE, Maffucci DM, Herbst E. Theoretical kinetic studies of Venus chemistry. Formation and destruction of SCl, SCl2, and HSCl. Icarus. 2021;354:114051. doi: 10.1016/j.icarus.2020.114051. [DOI] [Google Scholar]
- 111.Rimmer PB, Helling C. A chemical kinetics network for lightning and life in planetary atmospheres. Astrophys. J. Suppl. Ser. 2016;224:9. doi: 10.3847/0067-0049/224/1/9. [DOI] [Google Scholar]
- 112.Rimmer PB, Rugheimer S. Hydrogen cyanide in nitrogen-rich atmospheres of rocky exoplanets. Icarus. 2019;329:124–131. doi: 10.1016/j.icarus.2019.02.020. [DOI] [Google Scholar]
- 113.Rimmer PB, et al. Hydroxide salts in the clouds of Venus: their effect on the sulfur cycle and cloud droplet pH. Planet. Sci. J. 2021;2:133. doi: 10.3847/PSJ/ac0156. [DOI] [Google Scholar]
- 114.Krasnopolsky VA. Chemical kinetic model for the lower atmosphere of Venus. Icarus. 2007;191:25–37. doi: 10.1016/j.icarus.2007.04.028. [DOI] [Google Scholar]
- 115.Venot O, et al. A chemical model for the atmosphere of hot Jupiters. Astron. Astrophys. 2012;546:A43. doi: 10.1051/0004-6361/201219310. [DOI] [Google Scholar]
- 116.Drummond B, et al. The effects of consistent chemical kinetics calculations on the pressure-temperature profiles and emission spectra of hot Jupiters. Astron. Astrophys. 2016;594:A69. doi: 10.1051/0004-6361/201628799. [DOI] [Google Scholar]
- 117.Venot O, et al. New chemical scheme for giant planet thermochemistry. Update of the methanol chemistry and new reduced chemical scheme. Astron. Astrophys. 2020;634:A78. doi: 10.1051/0004-6361/201936697. [DOI] [Google Scholar]
- 118.Parmentier V, Fortney JJ, Showman AP, Morley C, Marley MS. Transitions in the cloud composition of hot Jupiters. Astrophys. J. 2016;828:22. doi: 10.3847/0004-637X/828/1/22. [DOI] [Google Scholar]
- 119.Komacek TD, Showman AP, Parmentier V. Vertical tracer mixing in hot Jupiter atmospheres. Astrophys. J. 2019;881:152. doi: 10.3847/1538-4357/ab338b. [DOI] [Google Scholar]
- 120.Heays AN, Bosman AD, van Dishoeck EF. Photodissociation and photoionisation of atoms and molecules of astrophysical interest. Astron. Astrophys. 2017;602:A105. doi: 10.1051/0004-6361/201628742. [DOI] [Google Scholar]
- 121.Underwood DS, et al. ExoMol line lists XIV: a line list for hot SO2. Mon. Not. R. Astron. Soc. 2016;459:3890–3899. doi: 10.1093/mnras/stw849. [DOI] [Google Scholar]
- 122.Azzam AAA, Yurchenko SN, Tennyson J, Naumenko OV. ExoMol line lists XVI: a hot line list for H2S. Mon. Not. R. Astron. Soc. 2016;460:4063–4074. doi: 10.1093/mnras/stw1133. [DOI] [Google Scholar]
- 123.Paulose G, Barton EJ, Yurchenko SN, Tennyson J. ExoMol molecular linelists – XII. Line lists for eight isotopologues of CS. Mon. Not. R. Astron. Soc. 2015;454:1931–1939. doi: 10.1093/mnras/stv1543. [DOI] [Google Scholar]
- 124.Gordon IE, et al. The HITRAN2020 molecular spectroscopic database. J. Quant. Spectrosc. Radiat. Transf. 2021;277:107949. doi: 10.1016/j.jqsrt.2021.107949. [DOI] [PMC free article] [PubMed] [Google Scholar]
- 125.Evans TM, et al. An optical transmission spectrum for the ultra-hot Jupiter WASP-121b measured with the Hubble Space Telescope. Astron. J. 2018;156:283. doi: 10.3847/1538-3881/aaebff. [DOI] [Google Scholar]
Associated Data
This section collects any data citations, data availability statements, or supplementary materials included in this article.
Supplementary Materials
Data Availability Statement
The data used in this paper are associated with JWST ERS Program 1366 and are available from the Mikulski Archive for Space Telescopes (https://mast.stsci.edu), which is operated by the Association of Universities for Research in Astronomy, Inc., under NASA contract NAS 5-03127 for JWST. The chemical networks and abundance output of the photochemical models (ARGO, ATMO, KINETICS and VULCAN) presented in this study are available at 10.5281/zenodo.7542781.
The codes VULCAN and gCMCRT used in this work to simulate composition and produce synthetic spectra are publicly available: VULCAN6,78 (https://github.com/exoclime/VULCAN); gCMCRT40 (https://github.com/ELeeAstro/gCMCRT).


