

Abstract
Objective:
Although the association between adiposity and gastrointestinal (GI) diseases has been explored, the causal effects of adiposity on GI diseases are largely unknown.
Methods:
Mendelian randomization was conducted using single-nucleotide polymorphisms associated with BMI and waist circumference (WC) as instrumental variables, and the causal associations of BMI or WC with GI conditions were estimated among >400,000 UK Biobank participants, >170,000 Finnish-descent participants, and numerous consortia participants of predominantly European ancestry.
Results:
Genetically predicted BMI was robustly associated with increased risk of nonalcoholic fatty liver disease (NAFLD), cholecystitis, cholelithiasis, and primary biliary cholangitis. For the diseases, the odds ratio per 1-SD increase in genetically predicted BMI (4.77 kg/m2) ranged from 1.22 (95% CI: 1.12–1.34; p < 0.0001) for NAFLD to 1.65 (95% CI: 1.31–2.06; p < 0.0001) for cholecystitis. Genetically predicted WC was robustly associated with increased risk of NAFLD, alcoholic liver disease, cholecystitis, cholelithiasis, colon cancer, and gastric cancer. Alcoholic liver disease was consistently associated with WC even after adjusting for alcohol consumption in a multivariable Mendelian randomization analysis. The odds ratio per 1-SD increase in genetically predicted WC (12.52 cm) for such associations ranged from 1.41 (95% CI: 1.17–1.70; p = 0.0015) for gastric cancer to 1.74 (95% CI: 1.21–1.78; p < 0.0001) for cholelithiasis.
Conclusions:
High genetically predicted adiposity was causally associated with an increased risk of GI abnormalities, particularly of hepatobiliary organs (liver, biliary tract, and gallbladder) that are functionally related to fat metabolism.
Graphical Abstract

INTRODUCTION
Global anthropometric measurements have rapidly changed in recent decades from predominantly normal-weight or underweight status to overweight or obesity status [1]. These immense changes in global adiposity status over a relatively short period have likely been driven by changes in the global diet to more processed, affordable, and high-sugar foods, alongside the sedentary lifestyle associated with the automation of many workloads and commuting modes [2]. With the steep increase in the number of people with obesity worldwide, especially in low- and middle-income countries, it has become increasingly important to identify the potential impact of fat mass quantity and its distribution on human health. Thus far, the relationship between adiposity and cardiovascular diseases has been actively investigated [3], whereas the relationship between adiposity and gastrointestinal (GI) outcomes has been relatively unvisited. Despite the abdomen being a predominant place where fats are concentrated, the adjacent GI organs that are likely subject to the paracrine effect of visceral fat-originated cytokines have, paradoxically, been overlooked.
Although numerous cross-sectional and cohort studies have explored the relationship between adiposity and GI outcomes [4], they are observational and they provide evidence of association but not causation [5]. Causation could be inferred from randomized controlled trial (RCT) designs, but interventions inducing obesity are neither practical nor ethical, limiting the elucidation of causal inference. With limited evidence from observational and interventional studies, the human genetics approach, Mendelian randomization (MR), offers an opportunity to reliably inspect the potential causal effect between increased adiposity and multiple GI phenotypes [6]. The MR approach is based on the concept of the naturally occurring random allocation of alleles during meiosis and it uses genetic variants associated with risk factors as instrumental variables. This process is conceptually analogous to the random allocation of participants in an RCT [6, 7]. MR can overcome biases such as reverse causation and confounding, to which observational studies are particularly susceptible [8]. Employing this well-established genetic study design [6, 9], we conducted an MR analysis to examine the causal relationship between adiposity and the risk of 19 GI disorders.
METHODS
Study design
This study was designed to scrutinize the causal effect of adiposity on the risk of multiple GI outcomes (Figure 1). We used an MR approach in which genetic variants associated with a risk factor (adiposity) were used as instrumental variables to infer causality of the risk factor on the outcome of interest (Supporting Information Tables S1 and S2). We used two-sample MR and summary statistics from relevant genome-wide association studies (GWAS) of exposures and outcomes. We purposefully avoided using dependent and overlapping samples for exposure and outcome data sets to prevent inflation of genetic association statistics. When performing MR, bias in causal estimates can occur because of population stratification [10]. This bias could be avoided by restricting the MR analysis to ethnically homogenous samples. Therefore, we used European-specific GWAS for obesity indices and GI outcomes to minimize population stratification bias [10].
FIGURE 1.
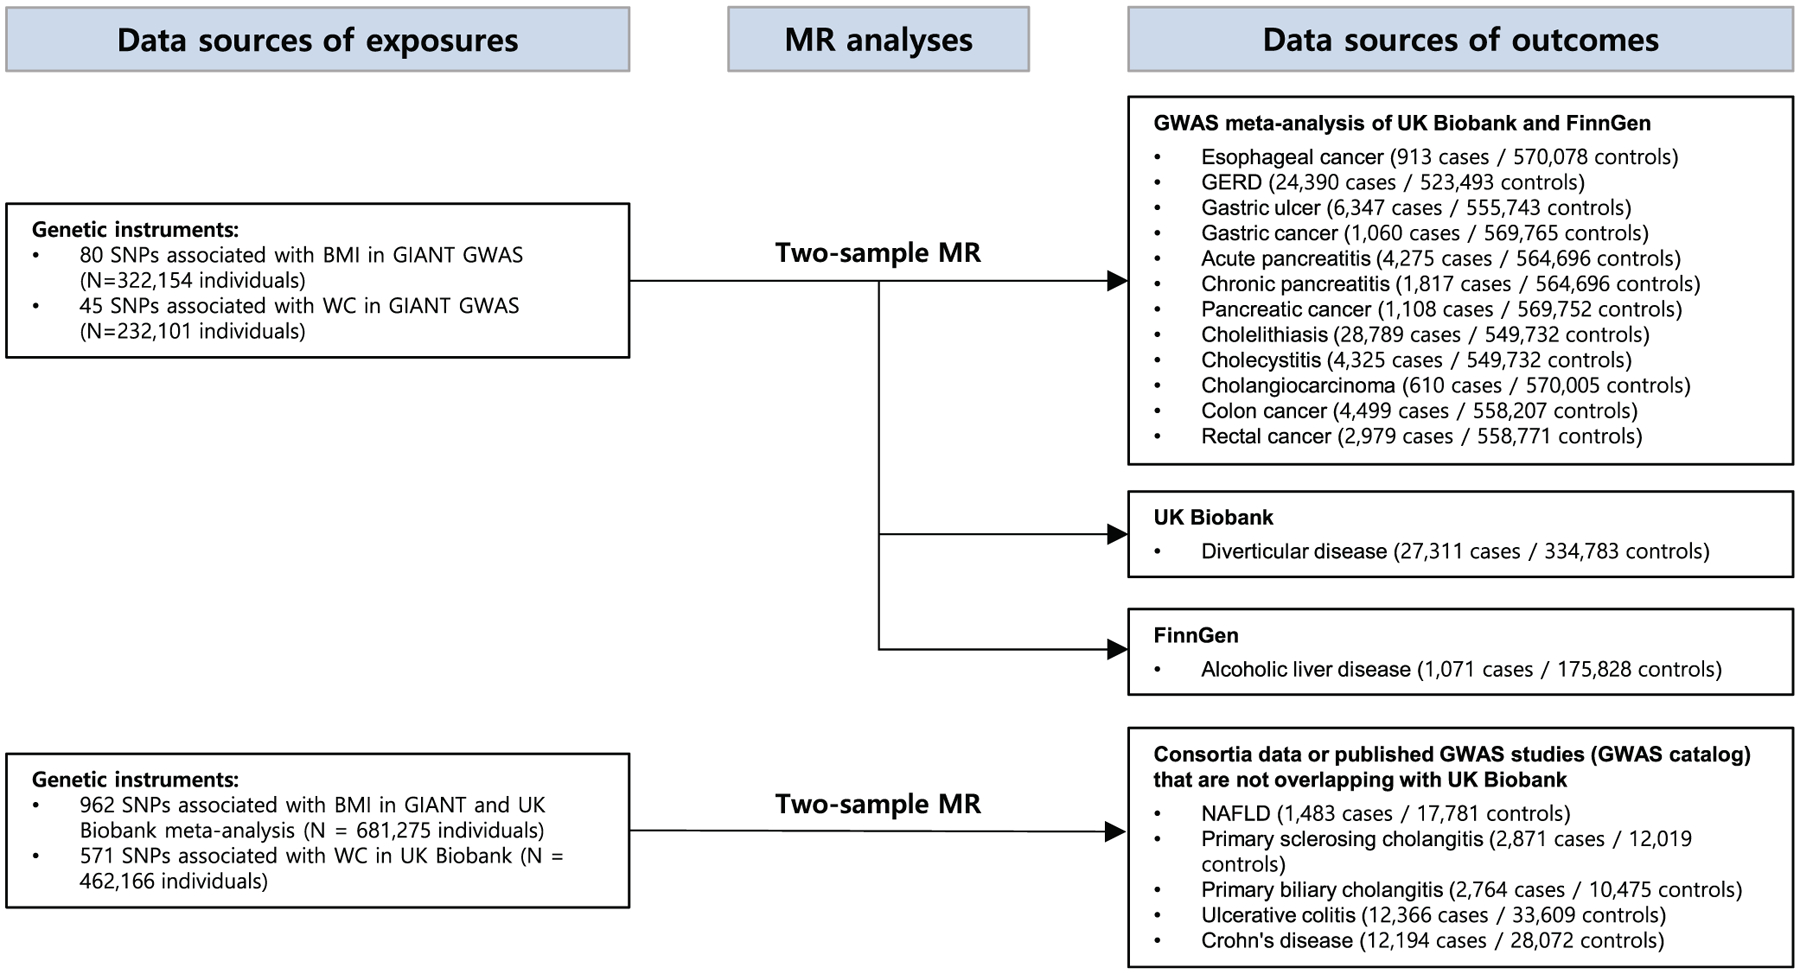
Study flow diagram and data sources used in this study. We used nonoverlapping multiple data sets and their combinations for exposures and outcomes to avoid sample overlapping when conducting MR analysis. GERD, gastroesophageal reflux disease; GIANT, Genetic Investigation of Anthropometric Traits consortium; GWAS, genome-wide association study; MR, Mendelian randomization; NAFLD, nonalcoholic fatty liver disease; SNP, single-nucleotide polymorphism; WC, waist circumference
Data for exposure
We leveraged data of single-nucleotide polymorphisms (SNPs) that are associated with the adiposity at genome-wide significance levels (p < 5 × 10⁻⁸) discovered by GWAS from two large cohorts: Genetic Investigation of Anthropometric Traits (GIANT) consortium and UK Biobank (details in online Supporting Information Methods). Two major adiposity measuring indices, body mass index (BMI) and waist circumference (WC), were used to account for the varying effects of fat distribution on clinical GI outcomes (Supporting Information Table S3). BMI has traditionally been used to measure body size, whereas WC has been assessed, more specifically, to indicate abdominal or central obesity [11]. We investigated these two measures simultaneously following the consensus statement from the International Atherosclerosis Society and the International Chair on Cardiometabolic Risk Working Group on Visceral Obesity, arguing for the necessity of using both BMI and WC [11]. We did not utilize other measures that indicate fat distributions, such as visceral adipose tissue volume, arm fat ratio, leg fat ratio, and trunk fat ratio, considering that the summary statistics were derived from mixed ancestry populations or studies including UK Biobank participants [12, 13]. The summary data from the GIANT consortium and UK Biobank used in this study were adjusted for age, sex, and major genetic principal components (Supporting Information Table S4). We selected independent SNPs using linkage disequilibrium clumping with an r2 threshold of 0.01 and clumping window within 10,000 kilobases (kb) using the 1000 Genomes Project reference panel (European population).
Data for outcome
We investigated 19 GI diseases that have been analyzed in GWAS and thus have relevant information of genetic variants associated with the diseases. Diseases of GWAS with a low number of cases (<500) were excluded from our analysis (Barrett’s esophagus, diverticulum of esophagus, hepatocellular carcinoma, other liver cancers, and small intestinal cancers) because they are at high risk of false inference because of limited statistical power. Chronic liver diseases (CLD) and cirrhosis were excluded because most hepatobiliary conditions could eventually progress to CLD in the end stage. Therefore, disease-specific inferences could not be drawn for CLD and cirrhosis. The 19 GI outcomes, adjusted variables, and data sources are provided in Supporting Information Tables S4 and S5. The genetic variants associated with the 19 GI outcomes were identified from the following: (1) data from UK Biobank, a large prospective cohort study with more than 500,000 people aged 40 to 69 years recruited between 2006 and 2010; (2) R4 release of the FinnGen consortium data, including up to 170,000 participants of Finnish descent; and (3) GWAS catalog data provided by the National Human Genome Research Institute and the European Bioinformatics Institute of the European Molecular Biology Laboratory (details in online Supporting Information Methods). For available outcomes, we meta-analyzed nonoverlapping cohorts using METAL to increase the statistical power [14]. We adhered to the case definition/diagnosis done by the UK Biobank and FinnGen consortia for most of the outcomes; however, for those requiring complicated and thorough evaluations for diagnosis (i.e., nonalcoholic fatty liver disease [NAFLD], primary sclerosing cholangitis [PSC], primary biliary cholangitis [PBC]), we used disease-specific consortium data to minimize misclassification bias as summarized in Supporting Information Table S5. For instance, NAFLD cases were diagnosed with liver biopsy and/or ultrasonographically detected bright liver, associated with metabolic syndrome [15].
Statistical analysis
We used multiple genetic variants as instrument variables rather than an allele score in order to explore key assumptions, identify pleiotropy, and conduct sensitivity and multivariable MR analyses more efficiently [9]. We used four MR methods (inverse variance weighted [IVW; random-effects model], weighted median, MR-Egger, and MR-PRESSO) to test the consistency of the results across varying assumptions of heterogeneity and pleiotropy effects. The IVW method assumes that all genetic variants are valid, but this method is prone to bias when a large portion of SNPs is subject to horizontal pleiotropy [16]. The weighted median method assumes that most genetic variants are valid. This method is suitable if the proportion of horizontal pleiotropic variants is <50% [17]. When most genetic variants have horizontal pleiotropy (>50%), the MR-Egger method performs well to test causal estimations, despite being lower in statistical power than other methods [18]. The MR-PRESSO method was used to test whether horizontal pleiotropic outliers cause bias in the IVW test and exclude outlier SNPs from analysis to draw a more balanced and reliable causal estimation [19].
We performed multivariable MR analyses adjusting for well-established risk factors of GI problems, including alcohol consumption and smoking [20, 21]. We used the IVW method to overcome potential confounding and estimate the causal effect of multiple exposure variables independently on outcomes [22]. For certain relationships in which the risk for reverse causation would be high because of a lack of previous evidence ensuring the direction of effect (i.e., PBC/PSC and ulcerative colitis [UC]/Crohn disease [CD]), we performed a bidirectional MR analysis to clarify the direction of effect. We also performed a leave-one-out analysis to identify whether a single genetic variant strongly drove the effect of the association.
In forest plots, we presented the best causal estimations for each GI outcome considering both pleiotropy and heterogeneity effect [23]. A detailed flow diagram for selecting the best causal estimation is described in Supporting Information Figure S1. We assessed heterogeneity using the Cochran Q test and I2 and visualized them using scatterplots [24]. Unbalanced pleiotropy was inspected using Egger regression intercept, and horizontal pleiotropy was investigated using a global test of MR-PRESSO [24]. The statistical power of MR was calculated using the previously established method proposed by Brion et al. [25] Statistical power >80% was deemed acceptable to assess the effect of adiposity on GI diseases [26]. We applied Bonferroni correction (p < 0.0026, based on α = 0.05/19 GI outcomes) to stringently correct for multiple testing. Associations with a p value between 0.0026 and 0.05 were deemed suggestively causal inference regardless of sensitivity analyses. Associations were considered “robust” only when they reached the Bonferroni-corrected threshold (p < 0.0026, α = 0.05/19), and three out of four MR methods (IVW, weighted median, MR-Egger, and MR-PRESSO) showed consistent results. All statistical analyses were carried out using R version 4.0.4 (R Foundation) and R package (“TwoSampleMR” and “MendelianRandomization”) for the MR analysis [27, 28]. We used the TwoSampleMR package to yield causal estimates from four MR models (IVW, weighted median, MR-Egger, and MR-PRESSO) and employed the MendelianRandomization package to conduct multivariable MR. Further details are provided in online Supporting Information Methods.
RESULTS
Main findings
The data sources of the outcomes (i.e., GIANT, UK Biobank, and multiple consortia) are provided in Supporting Information Table S5. The 80 BMI-associated SNPs explained 1.61% of the variance in BMI (corresponding to an F statistic of 66) when only GIANT GWAS data were used. In contrast, the 962 BMI-associated SNPs explained 7.85% of the variance in BMI (F statistic of 60.3) when GIANT and UK Biobank GWAS data were meta-analyzed (for the analysis of GI outcomes from consortia composed of those not overlapping with GIANT and UK Biobank participants). The 45 WC-associated SNPs from GIANT GWAS data explained 1.14% of the variance in WC (F statistic of 59.9) (Supporting Information Table S3). Statistical power for GI outcomes is provided in Supporting Information Tables S6 and S7.
After correction for multiple testing (Bonferroni-corrected threshold of p < 0.0026) and testing for consistencies across the four MR methods (IVW, weighted median, MR-Egger, and MR-PRESSO), genetically predicted BMI was robustly associated with increased risk of NAFLD, cholecystitis, cholelithiasis, and PBC. For the robust associations, the odds ratios (ORs) per 1-SD increase in BMI ranged from 1.22 (95% confidence interval [CI]: 1.12–1.34; p < 0.0001) for NAFLD to 1.65 (95% CI: 1.31–2.06; p < 0.0001) for cholecystitis (Figure 2). After correction for multiple testing and sensitivity analysis, genetically predicted WC was robustly associated with increased risk of NAFLD, alcoholic liver disease (ALD), cholecystitis, cholelithiasis, colon cancer, and gastric cancer. The ORs per 1-SD increase in WC for such robust associations ranged from 1.41 (95% CI: 1.17–1.70; p = 0.0015) for gastric cancer to 1.74 (95% CI: 1.21–1.78; p < 0.0001) for cholelithiasis (Figure 3).
FIGURE 2.

Associations of genetically predicted 1-SD increase in BMI (4.77 kg/m2) with 19 GI conditions. The robustness of the results was judged when the Bonferroni-corrected threshold was reached (p < 0.0026, α = 0.05/19) and three out of four MR methods (inverse variance weighted, weighted median, MR-Egger, and MR-PRESSO) showed consistent results. The forest plot presents the best causal estimate for each GI outcome. While numerous phenotypes were suggestively causative (p < 0.05), only four outcomes (cholecystitis, cholelithiasis, primary biliary cholangitis, and NAFLD) remained robust after multiple testing and sensitivity analyses across diverse MR methods. GERD, gastroesophageal reflux disease; GI, gastrointestinal; MR, Mendelian randomization; NAFLD, nonalcoholic fatty liver disease; OR, odds ratio
FIGURE 3.

Associations of genetically predicted 1-SD increase in waist circumference (12.52 cm) with 19 GI conditions. The robustness of the results was judged when the Bonferroni-corrected threshold was reached (p < 0.0026, α = 0.05/19) and three out of four MR methods (inverse variance weighted, weighted median, MR-Egger, and MR-PRESSO) showed consistent results. The forest plot presents the best causal estimate for each GI outcome. While numerous phenotypes were suggestively causative (p < 0.05), six outcomes (cholecystitis, cholelithiasis, NAFLD, alcoholic liver disease, colon cancer, and gastric cancer) remained robust after multiple testing and sensitivity analyses across diverse MR methods. GERD, gastroesophageal reflux disease; GI, gastrointestinal; MR, Mendelian randomization; NAFLD, nonalcoholic fatty liver disease; OR, odds ratio
MR analyses showed that genetically predicted BMI was suggestively associated (p < 0.05) with increased risk of cholangiocarcinoma, cholecystitis, cholelithiasis, chronic pancreatitis, PBC, ALD, NAFLD, diverticular disease, and CD and decreased risk of UC (Supporting Information Table S1). Genetically predicted WC was suggestively associated (p < 0.05) with increased risk of gastroesophageal reflux disease, cholelithiasis, cholecystitis, colon cancer, ALD, PBC, pancreatic cancer, NAFLD, gastric cancer, esophageal cancer, and diverticular disease and decreased risk of UC and PSC (Supporting Information Table S2).
Multivariable MR analysis
After adjustment for the effect of alcohol consumption and smoking in the multivariable MR analysis, the findings were similar to the uni-variable analysis with a few exceptions. BMI appeared to be significantly associated with acute pancreatitis after adjustment for alcohol consumption with an alcohol-adjusted OR of 1.27 (95% CI: 1.01–1.58). BMI was no longer significantly associated with cholangiocarcinoma and CD (Supporting Information Table S8). For WC, the ORs of gastroesophageal reflux disease, pancreatic cancer, gastric cancer, and UC were attenuated to the null after adjustment for alcohol consumption and smoking. WC was no longer associated with gastric ulcer and esophageal cancer after adjustment for alcohol consumption (Supporting Information Table S9). Because of the cumulative evidence regarding cholelithiasis as a risk factor for cholecystitis, we assessed the potential mediating effect of cholelithiasis on cholecystitis using multivariable MR. The cholelithiasis-adjusted ORs for cholecystitis were 1.23 (95% CI: 0.98–1.55) and 1.19 (95% CI: 0.87–1.63) for BMI and WC, respectively, indicating that the causal effect of adiposity on cholecystitis is likely to be mediated through gallstone formation (Supporting Information Table S10). Considering the lack of evidence ensuring the direction of effect among PBC/PSC and UC/CD, we performed a bidirectional MR analysis and identified that UC exerted a causal effect on PSC but not vice versa (Supporting Information Table S11). Scatterplots and funnel plots of 19 GI outcomes are provided in Supporting Information Figures S2–S5.
DISCUSSION
This study is the first, to our knowledge, to explore the causal effect of adiposity on the entire GI system using an MR approach in a large sample size. In total, we incorporated genetic data from more than 600,000 European individuals in our analyses. The holistic approach covering the broad range of GI disorders provides a bird’s-eye view on shared etiological pathways among different GI diseases and offers new insights into organs that are particularly susceptible to increased accumulation of body fat. We identified that increased adiposity was strongly associated with NAFLD, cholecystitis, and cholelithiasis in both BMI and WC measures, which raises concern for the fat vulnerability of hepatobiliary organs.
A causal relationship between adiposity and GI outcomes is extremely difficult to establish in clinical settings because an RCT is not likely to be possible for such an epidemiological relationship and because observational studies can enable us to infer only association, not causation. Searching for causation in the sea of association becomes more important as researchers, clinicians, and policy makers are increasingly aware that limited clinical implications can be drawn from the association; association encompasses causation, reverse causation, mediation, and residual confounding and therefore it may exaggerate the magnitude of effect while being limited in informing the direction of effect [29, 30]. Owing to bidirectional associations between obesity and GI outcomes, in which obesity could increase the risk of GI outcomes and vice versa, testing for causal connection is particularly valuable in clarifying the effect direction and in the development of interventions or preventive strategies [29]. The MR approach is a strong alternative in such topics because it enables the exploration of causal inferences for perplexing epidemiological relationships between obesity and digestive systems using human genetics [6].
From our findings that obesity predominantly elevates the risk of malfunction in the hepatobiliary organs primarily involved in fat metabolism, we hypothesize that disturbance in lipid metabolism may ground the pathogenetic mechanisms for the obesity-induced hepatobiliary diseases. A possible link between adiposity and liver risk could be the fat mass and obesity-associated (FTO) gene, given that our analysis identified variants associated with the FTO gene being consistently outstanding in scatterplots across diverse hepatobiliary outcomes (Supporting Information Tables S12 and S13). It is well established that variants within the FTO region influence body mass and composition phenotypes through functional regulation of IRX3 and IRX5 expression and many other metabolic pathway molecules [31]. Further evidence has shown that hepatic FTO is associated with lipid metabolism by reducing fatty acid oxidation and lipolysis and increasing de novo lipogenesis in the liver; therefore, the overexpressed hepatic FTO is correlated with increased hepatic fat accumulation [32, 33]. Excessive accumulation of nonesterified fatty acids and triglycerides in the liver could lead to cytotoxicity, so-called lipotoxicity, resulting in the development and progression of liver diseases [34].
Interestingly, our results showed that not only NAFLD but also ALD was robustly associated with WC, even after adjustment for alcohol consumption in multivariable MR (OR per 1-SD increase in WC: 1.68 [95% CI: 1.24–2.28], Supporting Information Table S9). Given that ALD’s pathogenesis also involves fat deposition in hepatocytes at an early stage [35], it is likely that the shared etiology of ALD and NAFLD with respect to adiposity lies in disrupted lipid metabolism that results in abnormal lipid accumulation in the liver. Our result is contextually in concordance with the study by Anstee et al. that highlighted shared genetic variants among ALD and NAFLD in the PNPLA3 gene region, for which a substitution in the 148th amino acid (I148M) appeared to promote the hepatic accumulation of triglycerides [36].
Obesity is associated with increased bile acid synthesis, which provokes supersaturation of bile acid in the gallbladder and subsequently gallstone formation (cholelithiasis) [37]. Cholecystitis, an inflammation of the gallbladder most often developed by a gallstone [37], was causally associated with increased adiposity along with cholelithiasis in our results (Figures 2 and 3). The result was in concordance with a previous phenome-wide association study that reported the causal effect of BMI on cholecystitis [38]. However, this previous study did not examine the potential mediating effect of cholelithiasis on the development of cholecystitis. To investigate the mediating effect, we conducted multivariable MR analyses and identified that cholecystitis no longer retained a causal relationship with both BMI and WC after adjustment for cholelithiasis (Supporting Information Table S10), implying that the causal effect of adiposity on cholecystitis is likely to be mediated through gallstone formation rather than the effect of adiposity per se. Because cholecystitis mediated by cholelithiasis indicated vertical pleiotropy but not horizontal pleiotropy, this mediating effect does not necessarily weaken the assumptions and reliability of our MR results [9].
Numerous studies have reported that 15% to 40% of patients with inflammatory bowel disease (IBD) have obesity, and an additional 20% to 40% have overweight [39, 40]. Although grouped together in IBD, CD and UC are known to have heterogeneous etiologies, disease mechanisms, and genetic backgrounds [41]. Similarly, obesity has been shown to be associated with a risk of CD, but not with UC, although results vary across studies [4, 42]. To date, findings on the association between adiposity and IBD have been derived from observational studies; therefore, the genuine causal relationship remains uncertain. To pinpoint the causal inference, we leveraged genetic instruments as well as a large sample size (>23,000 IBD cases) and confirmed that increases in BMI and WC were suggestively causally linked to an increased risk of CD and a reduced risk of UC (Figures 2 and 3). Although obesity may be protective against UC, the result should be interpreted with caution given that the estimations were not consistent across diverse MR methods and the relationship between WC and UC changed toward the null findings when adjusted for smoking in multivariable MR (Supporting Information Table S9).
PSC and PBC are chronic cholestatic liver diseases characterized by progressive biliary duct damage and fibrosis. Practical guidance for PBC from the American Association for the Study of Liver Diseases recommended avoiding obesity. However, the advice was given in general terms to patients with PBC, as obesity is generally unfavorable to those with any form of liver disease [43]. It was challenging to find data on enough people with PSC and PBC for an adequate sample size, and there was a lack of evidence regarding the association between obesity and PSC/PBC. To counter this lack of evidence, we used solid instrumental variables for exposure (Supporting Information Tables S14–S17) and large consortia data and meta-analyzed GWAS results of PSC/PBC to conduct the first MR analysis. Our findings suggest that obesity is a putative causal risk factor for PBC but not for PSC. Such diverging effects could be explained partially by IBD. Approximately two thirds of all patients with PSC have comorbid IBD, of whom more than 75% have UC [44]. Whether PSC or UC occurs first has long been controversial; our bidirectional MR results revealed that genetic variants associated with UC significantly increased the risk of PSC but not vice versa (Supporting Information Table S11). Given the inverse association of UC with increased adiposity (Figures 2 and 3), we hypothesize that the risk of UC nullifies the effect size of PSC, compromising the risk of PSC while marginally affecting PBC.
A recent consensus statement from the International Atherosclerosis Society and the International Chair on Cardiometabolic Risk Working Group of Visceral Obesity argued that WC was more closely correlated with the absolute quantity of visceral fat compared with other anthropometric indices [11]. We observed that a larger number of GI phenotypes were robust in association with WC (an indicator of abdominal or central obesity) than with BMI. In addition, the effect sizes of GI outcomes were, on average, larger with WC than BMI, and the difference was more prominent when the same clinical entity was being compared (Figures 2 and 3). Altogether, the pattern may emphasize the more significant influence of fat mass in the visceral cavity over fat distribution in other locations [11], which is sensible given the close or even adjacent spatial-anatomical relationship between the abdominal fat pad and organs in the abdomen cavity. One explanation for the greater impact of visceral fat on GI outcomes could be the paracrine action of adipose tissues. Adipose tissues continuously secrete proinflammatory molecules with a marked proportion to the local cell environment [45]. This could imply that GI organs are influenced by both endocrine and paracrine cytokines, differing from other distant organs that are only affected by endocrine secretions from adipocytes. Moreover, activated paracrine signals via adipokines have been shown to alter the tumor microenvironment in organs closely spaced with the fat pad, partially explaining the pathogenesis of GI cancers [45].
This study disclosed a nontrivial gap between observational and causal evidence for the association between obesity and GI outcomes. It may be inferred that a substantial portion of previous observational reports for significant associations may have resulted from reverse causation or confounders/mediators shared by adiposity and GI conditions. Causal evidence demonstrated in this study is expected to stimulate policy and public health efforts for tackling GI disease burdens attributed to increased adiposity. Further studies exploring biological plausibility and underlying mechanisms for the causal associations should follow to validate and extend our understanding of how obesity causes GI outcomes.
This study has several strengths. First, the study adopted a holistic approach covering the entire GI system and identified the putative shared mechanisms and patterns across GI organs influenced by adiposity. Second, the MR design mitigates the bias induced by reverse causality and environmental factors. MR analysis uses alleles that are randomly allocated during conception and thus is not likely to be subject to reverse causation and confounding [6]. Third, we used multiple MR models and multivariable analysis to avoid false-positive inferences and further adjust for potential confounders, ensuring careful interpretation of the results.
This study has several limitations. First, the statistical power was not sufficient (<80%) for a few outcomes. Given that insufficient statistical power has been a limitation of MR analysis [6, 7], we endeavored to maximize the power by using the data with the largest sample size to date and meta-analyzing available cohorts for each GI outcome. Moreover, among robust estimates in our analysis, only gastric cancer was low in power in association with BMI and WC, implying that the statistical power is less likely to alter our interpretations overall. Second, MR estimates reflect the effect of lifelong exposure [9]. Therefore, our results cannot inform the short-term effect of fat gain on GI outcomes. Lastly, we restricted study samples to individuals of European ancestry to minimize population stratification bias. This, in turn, prevents our findings from being generalized to other ancestries.
CONCLUSION
This comprehensive study identified that adiposity exerted a suggestive causal effect (p < 0.05) on the risk of more than half of the GI outcomes and a robust causal effect (Bonferroni threshold p < 0.0026 and consistent results across multiple MR methods) on nearly a quarter of the GI outcomes. Hepatobiliary organs (liver, biliary tract, and gallbladder) that are functionally related to fat metabolism were particularly susceptible to increased adiposity. Abdominal obesity as measured by WC might be more influential and relevant than BMI in association with a diverse span of GI disease risks, highlighting a possible pathophysiological role of visceral abdominal fat in the development of GI disorders and cancers.
Supplementary Material
Study Importance.
What is already known?
Increased body size has been associated with increased odds of colon cancer and numerous gastrointestinal (GI) diseases observationally, but whether adiposity exerts a causal effect on GI outcomes is unclear. It is also unclear which GI organs are particularly susceptible to increased fat accumulation.
What does this study add?
Adiposity exerted a suggestive causal effect on the risk of more than half of the 19 GI diseases and a robust causal effect on nearly a quarter of the 19 GI diseases.
Hepatobiliary organs (liver, biliary tract, and gallbladder) that are functionally related to fat metabolism are particularly susceptible to increased adiposity.
How might these results change the direction of research or the focus of clinical practice?
Testing for causal inference is particularly valuable in clarifying the effect direction and development of interventions or preventive strategies.
Abdominal obesity as measured by waist circumference might be more influential and relevant than BMI in association with a diverse range of GI disease risks, highlighting a possible pathophysiological role of visceral abdominal fat in the development of GI disorders and cancers.
FUNDING INFORMATION
This work was supported by a grant from the National Research Foundation of Korea funded by the Korean government (the Ministry of Science and ICT [MSIT]) (no. 2022R1A2C2009998). Ron Do is supported by the National Institute of General Medical Sciences of the National Institutes of Health (NIH) (R35-GM124836) and the National Heart, Lung, and Blood Institute of the NIH (R01-HL139865 and R01-HL155915).
Footnotes
CONFLICT OF INTEREST
The authors declared no conflict of interest.
SUPPORTING INFORMATION
Additional supporting information can be found online in the Supporting Information section at the end of this article.
REFERENCES
- 1.NCD Risk Factor Collaboration. Trends in adult body-mass index in 200 countries from 1975 to 2014: a pooled analysis of 1698 population-based measurement studies with 19.2 million participants. Lancet. 2016;387(10026):1377–1396. [DOI] [PMC free article] [PubMed] [Google Scholar]
- 2.Swinburn BA, Sacks G, Hall KD, et al. The global obesity pandemic: shaped by global drivers and local environments. Lancet. 2011; 378(9793):804–814. [DOI] [PubMed] [Google Scholar]
- 3.Kim MS, Kim WJ, Khera AV, et al. Association between adiposity and cardiovascular outcomes: an umbrella review and meta-analysis of observational and mendelian randomization studies. Eur Heart J. 2021;42(34):3388–3403. [DOI] [PMC free article] [PubMed] [Google Scholar]
- 4.Rahmani J, Kord-Varkaneh H, Hekmatdoost A, et al. Body mass index and risk of inflammatory bowel disease: a systematic review and dose-response meta-analysis of cohort studies of over a million participants. Obes Rev. 2019;20(9):1312–1320. [DOI] [PubMed] [Google Scholar]
- 5.Berry AJ. Observational studies identify associations, not causality. Anesth Analg. 2005;101(4):1238. doi: 10.1213/01.ANE.0000173754.86959.9D [DOI] [PubMed] [Google Scholar]
- 6.Pingault JB, O’Reilly PF, Schoeler T, Ploubidis GB, Rijsdijk F, Dudbridge F. Using genetic data to strengthen causal inference in observational research. Nat Rev Genet. 2018;19(9):566–580. [DOI] [PubMed] [Google Scholar]
- 7.Emdin CA, Khera AV, Kathiresan S. Mendelian randomization. JAMA. 2017;318(19):1925–1926. [DOI] [PubMed] [Google Scholar]
- 8.Smith GD, Ebrahim S. ‘Mendelian randomization’: can genetic epidemiology contribute to understanding environmental determinants of disease? Int J Epidemiol. 2003;32(1):1–22. [DOI] [PubMed] [Google Scholar]
- 9.Davies NM, Holmes MV, Davey SG. Reading mendelian randomisation studies: a guide, glossary, and checklist for clinicians. BMJ. 2018; 362:k601. doi: 10.1136/bmj.k601 [DOI] [PMC free article] [PubMed] [Google Scholar]
- 10.Burgess S, Davey Smith G, Davies NM, et al. Guidelines for performing mendelian randomization investigations. Wellcome Open Res. 2019;4:186. doi: 10.12688/wellcomeopenres.15555.2 [DOI] [PMC free article] [PubMed] [Google Scholar]
- 11.Ross R, Neeland IJ, Yamashita S, et al. Waist circumference as a vital sign in clinical practice: a consensus statement from the IAS and ICCR working group on visceral obesity. Nat Rev Endocrinol. 2020; 16(3):177–189. [DOI] [PMC free article] [PubMed] [Google Scholar]
- 12.Chu AY, Deng X, Fisher VA, et al. Multiethnic genome-wide meta-analysis of ectopic fat depots identifies loci associated with adipocyte development and differentiation. Nat Genet. 2017;49(1): 125–130. [DOI] [PMC free article] [PubMed] [Google Scholar]
- 13.Rask-Andersen M, Karlsson T, Ek WE, Johansson A. Genome-wide association study of body fat distribution identifies adiposity loci and sex-specific genetic effects. Nat Commun. 2019;10(1):339. doi: 10.1038/s41467-018-08000-4 [DOI] [PMC free article] [PubMed] [Google Scholar]
- 14.Evangelou E, Ioannidis JP. Meta-analysis methods for genome-wide association studies and beyond. Nat Rev Genet. 2013;14(6):379–389. [DOI] [PubMed] [Google Scholar]
- 15.Anstee QM, Darlay R, Cockell S, et al. Genome-wide association study of non-alcoholic fatty liver and steatohepatitis in a histologically characterised cohort. J Hepatol. 2020;73(3):505–515. [DOI] [PubMed] [Google Scholar]
- 16.Hartwig FP, Davey Smith G, Bowden J. Robust inference in summary data mendelian randomization via the zero modal pleiotropy assumption. Int J Epidemiol. 2017;46(6):1985–1998. [DOI] [PMC free article] [PubMed] [Google Scholar]
- 17.Bowden J, Davey Smith G, Haycock PC, Burgess S. Consistent estimation in mendelian randomization with some invalid instruments using a weighted median estimator. Genet Epidemiol. 2016;40(4): 304–314. [DOI] [PMC free article] [PubMed] [Google Scholar]
- 18.Bowden J, Davey Smith G, Burgess S. Mendelian randomization with invalid instruments: effect estimation and bias detection through egger regression. Int J Epidemiol. 2015;44(2):512–525. [DOI] [PMC free article] [PubMed] [Google Scholar]
- 19.Verbanck M, Chen CY, Neale B, Do R. Detection of widespread horizontal pleiotropy in causal relationships inferred from mendelian randomization between complex traits and diseases. Nat Genet. 2018; 50(5):693–698. [DOI] [PMC free article] [PubMed] [Google Scholar]
- 20.Yadav D, Whitcomb DC. The role of alcohol and smoking in pancreatitis. Nat Rev Gastroenterol Hepatol. 2010;7(3):131–145. [DOI] [PubMed] [Google Scholar]
- 21.Jayasekara H, MacInnis RJ, Room R, English DR. Long-term alcohol consumption and breast, upper aero-digestive tract and colorectal cancer risk: a systematic review and meta-analysis. Alcohol Alcohol. 2016;51(3):315–330. [DOI] [PubMed] [Google Scholar]
- 22.Burgess S, Thompson SG. Multivariable mendelian randomization: the use of pleiotropic genetic variants to estimate causal effects. Am J Epidemiol. 2015;181(4):251–260. [DOI] [PMC free article] [PubMed] [Google Scholar]
- 23.Nazarzadeh M, Pinho-Gomes AC, Bidel Z, et al. Plasma lipids and risk of aortic valve stenosis: a mendelian randomization study. Eur Heart J. 2020;41(40):3913–3920. [DOI] [PMC free article] [PubMed] [Google Scholar]
- 24.Burgess S, Bowden J, Fall T, Ingelsson E, Thompson SG. Sensitivity analyses for robust causal inference from mendelian randomization analyses with multiple genetic variants. Epidemiology. 2017;28(1): 30–42. [DOI] [PMC free article] [PubMed] [Google Scholar]
- 25.Brion MJ, Shakhbazov K, Visscher PM. Calculating statistical power in mendelian randomization studies. Int J Epidemiol. 2013;42(5): 1497–1501. [DOI] [PMC free article] [PubMed] [Google Scholar]
- 26.Burgess S Sample size and power calculations in mendelian randomization with a single instrumental variable and a binary outcome. Int J Epidemiol. 2014;43(3):922–929. [DOI] [PMC free article] [PubMed] [Google Scholar]
- 27.Hemani G, Zheng J, Elsworth B, et al. The MR-base platform supports systematic causal inference across the human phenome. Elife. 2018;7:e34408. doi: 10.7554/eLife.34408 [DOI] [PMC free article] [PubMed] [Google Scholar]
- 28.Yavorska OO, Burgess S. MendelianRandomization: an R package for performing mendelian randomization analyses using summarized data. Int J Epidemiol. 2017;46(6):1734–1739. [DOI] [PMC free article] [PubMed] [Google Scholar]
- 29.Whisman MA, Sbarra DA, Beach SRH. Intimate relationships and depression: searching for causation in the sea of association. Annu Rev Clin Psychol. 2021;17:233–258. [DOI] [PubMed] [Google Scholar]
- 30.Altman N, Krzywinski M. Association, correlation and causation. Nat Methods. 2015;12(10):899–900. [DOI] [PubMed] [Google Scholar]
- 31.Smemo S, Tena JJ, Kim KH, et al. Obesity-associated variants within FTO form long-range functional connections with IRX3. Nature. 2014;507(7492):371–375. [DOI] [PMC free article] [PubMed] [Google Scholar]
- 32.Mizuno TM. Fat mass and obesity associated (FTO) gene and hepatic glucose and lipid metabolism. Nutrients. 2018;10(11):1600. doi: 10.3390/nu10111600 [DOI] [PMC free article] [PubMed] [Google Scholar]
- 33.Kang H, Zhang Z, Yu L, Li Y, Liang M, Zhou L. FTO reduces mitochondria and promotes hepatic fat accumulation through RNA demethylation. J Cell Biochem. 2018;119(7):5676–5685. [DOI] [PubMed] [Google Scholar]
- 34.Camilleri M, Malhi H, Acosta A. Gastrointestinal complications of obesity. Gastroenterology. 2017;152(7):1656–1670. [DOI] [PMC free article] [PubMed] [Google Scholar]
- 35.Osna NA, Donohue TM Jr, Kharbanda KK. Alcoholic liver disease: pathogenesis and current management. Alcohol Res. 2017;38(2):147–161. [PMC free article] [PubMed] [Google Scholar]
- 36.Anstee QM, Seth D, Day CP. Genetic factors that affect risk of alcoholic and nonalcoholic fatty liver disease. Gastroenterology. 2016; 150(8):1728–1744 e1727. [DOI] [PubMed] [Google Scholar]
- 37.Lammert F, Gurusamy K, Ko CW, et al. Gallstones. Nat Rev Dis Primers. 2016;2(1):16024. doi: 10.1038/nrdp.2016.24 [DOI] [PubMed] [Google Scholar]
- 38.Hypponen E, Mulugeta A, Zhou A, Santhanakrishnan VK. A data-driven approach for studying the role of body mass in multiple diseases: a phenome-wide registry-based case-control study in the UK Biobank. Lancet Digit Health. 2019;1(3):e116–e126. [DOI] [PubMed] [Google Scholar]
- 39.Pringle PL, Stewart KO, Peloquin JM, et al. Body mass index, genetic susceptibility, and risk of complications among individuals with Crohn’s disease. Inflamm Bowel Dis. 2015;21(10):2304–2310. [DOI] [PMC free article] [PubMed] [Google Scholar]
- 40.Nic Suibhne T, Raftery TC, McMahon O, Walsh C, O’Morain C, O’Sullivan M. High prevalence of overweight and obesity in adults with Crohn’s disease: associations with disease and lifestyle factors. J Crohns Colitis. 2013;7(7):e241–e248. [DOI] [PubMed] [Google Scholar]
- 41.Sartor RB. Mechanisms of disease: pathogenesis of Crohn’s disease and ulcerative colitis. Nat Clin Pract Gastroenterol Hepatol. 2006;3(7): 390–407. [DOI] [PubMed] [Google Scholar]
- 42.Singh S, Dulai PS, Zarrinpar A, Ramamoorthy S, Sandborn WJ. Obesity in IBD: epidemiology, pathogenesis, disease course and treatment outcomes. Nat Rev Gastroenterol Hepatol. 2017;14(2):110–121. [DOI] [PMC free article] [PubMed] [Google Scholar]
- 43.Lindor KD, Bowlus CL, Boyer J, Levy C, Mayo M. Primary biliary cholangitis: 2018 practice guidance from the American Association for the Study of Liver Diseases. Hepatology. 2019;69(1):394–419. [DOI] [PubMed] [Google Scholar]
- 44.Karlsen TH, Folseraas T, Thorburn D, Vesterhus M. Primary sclerosing cholangitis - a comprehensive review. J Hepatol. 2017;67(6): 1298–1323. [DOI] [PubMed] [Google Scholar]
- 45.Park J, Euhus DM, Scherer PE. Paracrine and endocrine effects of adipose tissue on cancer development and progression. Endocr Rev. 2011;32(4):550–570. [DOI] [PMC free article] [PubMed] [Google Scholar]
Associated Data
This section collects any data citations, data availability statements, or supplementary materials included in this article.