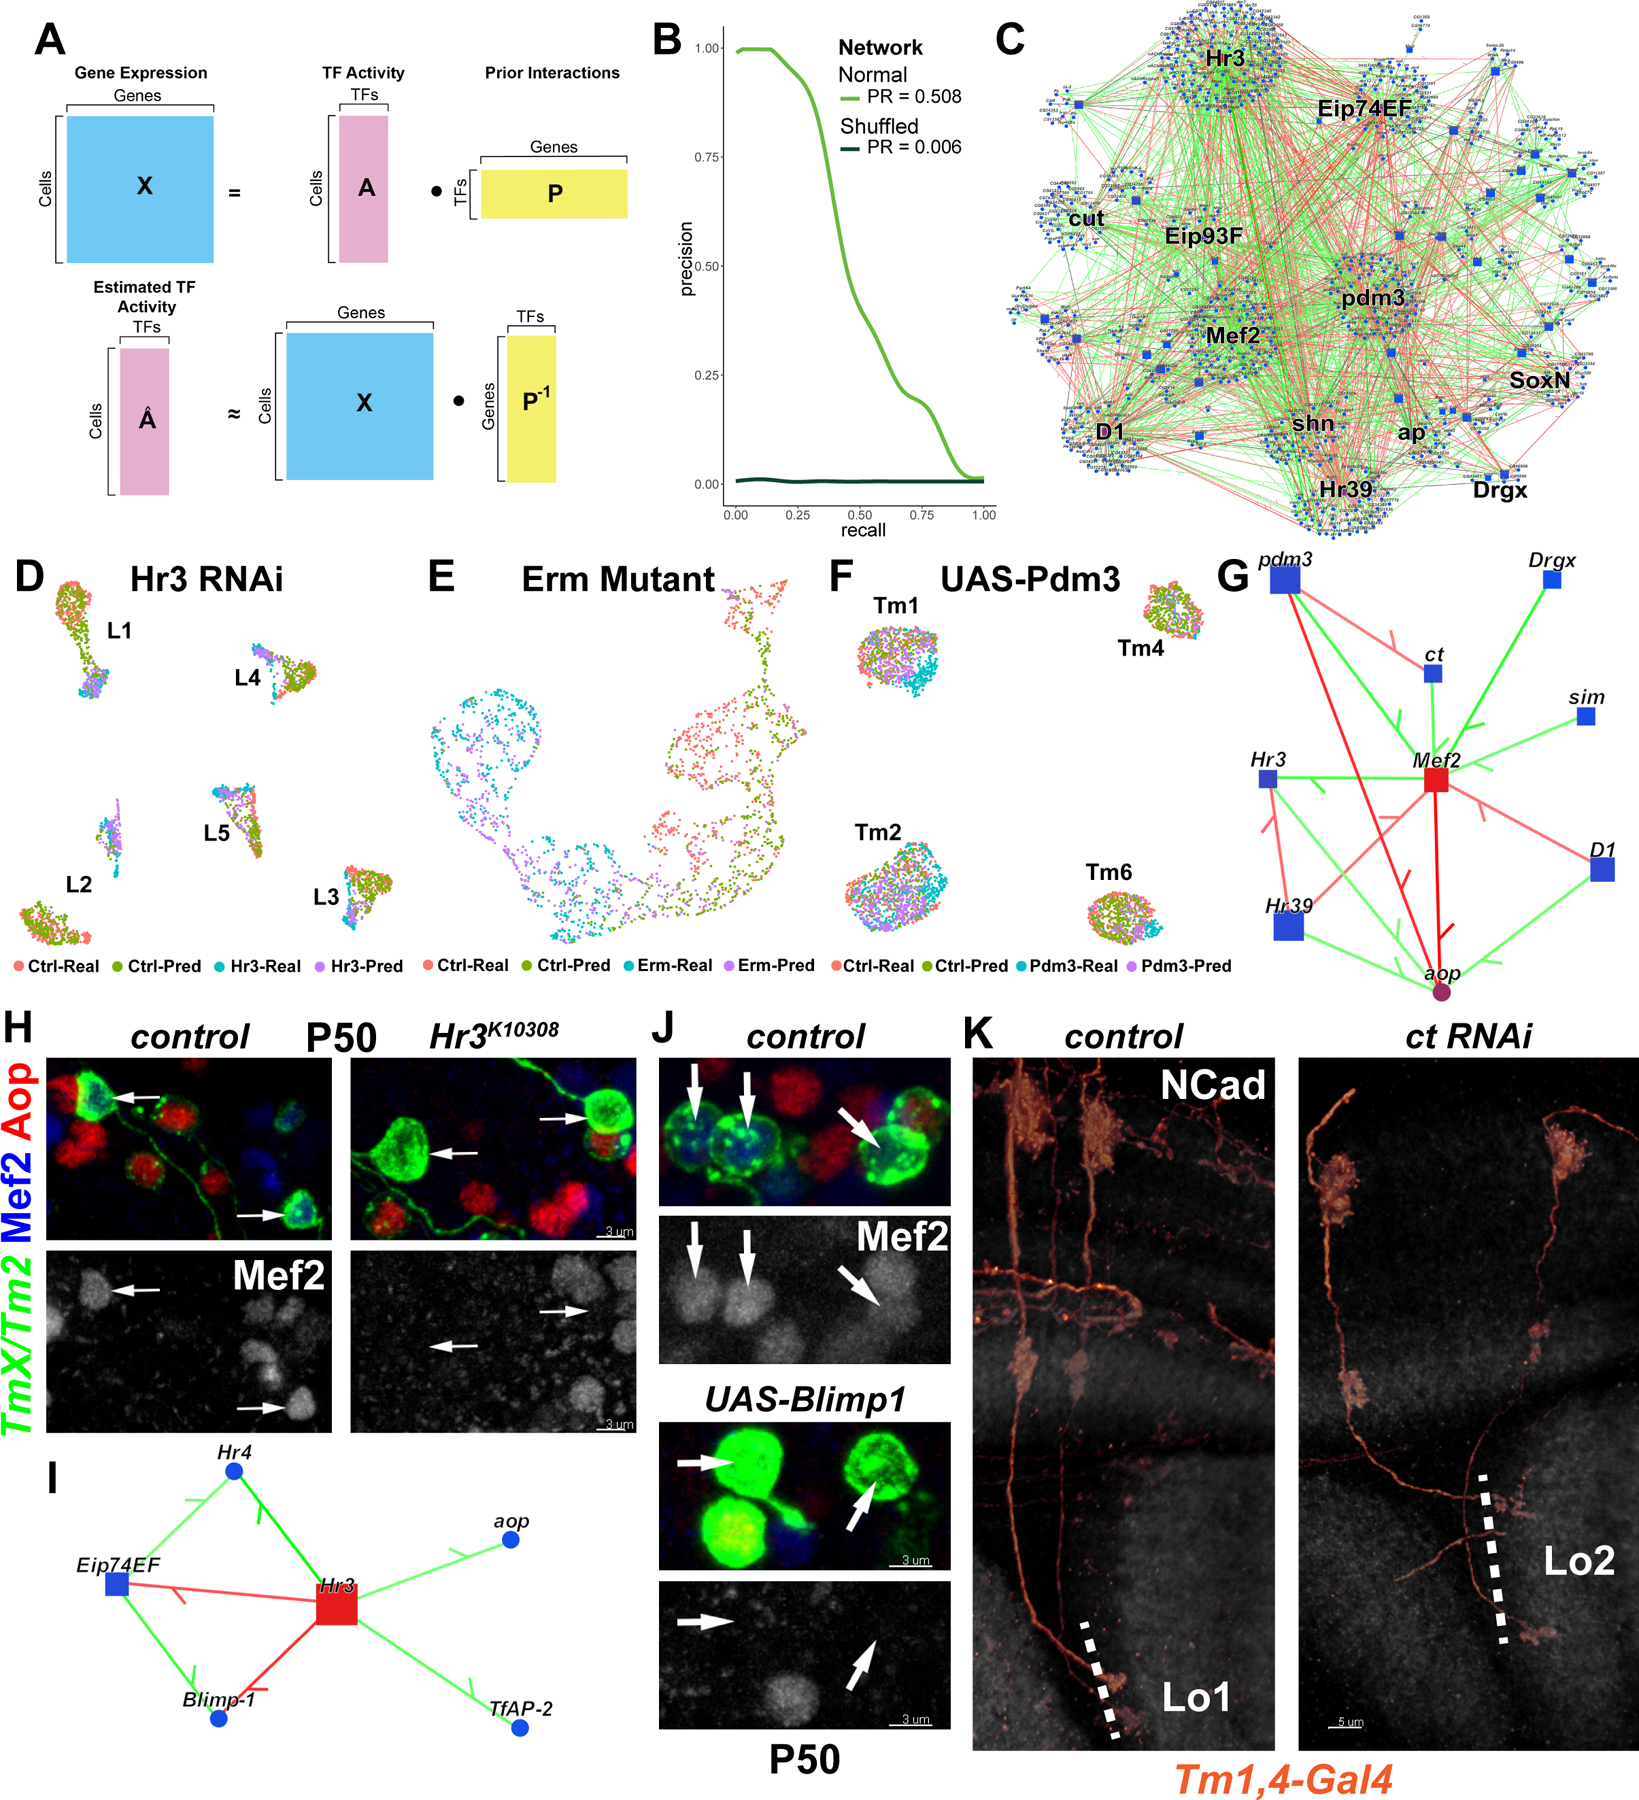
Figure 5: Computational inference of gene regulatory networks.

A, Gene expression in each cell is assumed to be a linear product of latent TF activities and the connectivity matrix (prior) between TFs and their targets (top). TFA is estimated as the dot product of the expression matrix and the pseudoinverse of the prior matrix (bottom). B, AUPR curves for the Tm network built using the MergedDA prior (see also Fig. S6A). C, Visualization of the network in (B), displaying all interactions with a minimum of 80% confidence (combined) and variance explained of 1%. Top 10 TFs that had the highest number of target genes in the network were highlighted, in addition to SoxN and Drgx. D-F, Single-cell transcriptomes of (D) L1–5 neurons at P48 expressing Hr3 RNAi (39), (E) simulated single L3 neurons (Fig. S8D) at P40 mutant for erm (21), (F) Tm1/2/4/6 neurons at P50 overexpressing pdm3 (Fig. 1). UMAPs were calculated using 30 PCs (D,F) or 3 PCs (E) on the integrated gene expression. (see also Fig. S8E–G). G, Network visualization displaying all TFs predicted to regulate Mef2 or aop with confidence >95%, and all inferred interactions between the displayed genes in the Tm network. Green: positive, red: negative correlation between mRNA levels of the gene pairs. H, FRT42D and Hr3K10308 MARCM clones labeled with TmX/Tm2-Gal4 and CD4-tdGFP in P50 medulla cortex (maximum projection), with anti-Mef2 (blue) and anti-Aop (red). Arrows: Aop− Tm neurons that should normally be Mef2+ (n=6 brains). I, Same as (G), displaying all TFs predicted to be regulated by Hr3 (confidence>95%). J, TmX/Tm2-Gal4 driving CD4-tdGFP (flip-out) and UAS-Blimp1 (n=5 brains). Max. projection same as (H). K, Tm1,4-Gal4 driving CD4-tdGFP (flip-out) and ct RNAi (n=40/6 neurons/brains). 3D reconstructions of GFP for the representative adult neurons in each condition with anti-NCad (white). Dashed lines mark the border of lobula neuropil. Scale bars: 3 μm (H-J) and 5 μm (K).
