Abstract
The stability of the solid electrolyte interphase (SEI) layer during the charging–discharging cycles is reasonably related to its microscopic elasticity. For the first time, it was theoretically revealed that each component of the elastic moduli takes a maximum at an optimal concentration of 1.0 vol % of fluoroethylene carbonate (FEC) for the SEI layer formed in the FEC-added NaPF6/PC-based electrolyte. The elastic constants indicated that the SEI layer formed at lower FEC concentrations is more resistant to tensile and shear deformations. The optimal hardness is sensitive in the lower FEC concentrations although it simply decreases as the FEC concentration increases. This is due to the formation of a denser SEI structure with small cavities in the lower concentrations. The results are excellently consistent with the experimental one, justifying the microscopic understanding of the FEC additive effect on the mechanical stability of the SEI layers designed through the Red Moon simulation.
1. Introduction
The design of the advanced electrolytes remains one of the fundamental challenges for next-generation Na-ion batteries (NIBs). An appropriate electrolyte selection is essential for good electrochemical performance, higher ionic conductivity, and the formation of a stable solid electrolyte interphase (SEI) layer on the surface of the anode. Indeed, the SEI is mainly created during the first charging cycle before use and is considered part of the manufacturing process.1,2 The stability of the SEI layer is directly related to the safety and lifetime of NIBs. Realistically, it should protect the electrolyte from further reductive decomposition during the subsequent charge–discharge cycles while allowing Na+ to exchange between the electrolyte and the anode.3−7
The stability of the SEI film is related to its resistance to mechanical failure during the charging–discharging cycles of the batteries. In fact, several studies have showed that the SEI layer is exposed to initial physical damage or instability due to volume change, stress, and pressure due to the intercalation-induced strain and gas production.8,9 Thus, the degradation of the SEI layer, such as dissolution/breakdown, and growth, can occur during the long charge–discharge cycles.10−14 Such degradation should be closely related to the elastic properties of the SEI film material in determining its capability to resist the degradative deformation and to return to its original structural form when the force of deformation is removed. In fact, elastic deformation of SEI is more preferred than permanent (irreversible) plastic deformation.7 Although the deformation of SEI is inevitable, fracture and delamination of SEI should be avoided, and, therefore, its hardness and adhesion to the electrode are the two key descriptors. Thus, understanding not only the chemical aspect of the SEI layer components but also its mechanical properties is crucial to have a stable SEI layer and then enhance the cyclability of the NIBs further.
So far, little attention has been paid to the mechanical properties of the SEI layer. Experimentally, atomic force microscopy (AFM) based on the nano-indentation technique was mainly used to explore the mechanical properties of in situ formed SEI layers.15−17 These studies demonstrated the inhomogeneity of the SEI film in morphology, structure, and mechanical properties. Also, it was found that Young’s modulus of the SEI film on the anode changes during the SEI formation.16 Shin et al. combined AFM measurements with X-ray photoelectron spectroscopy analysis to investigate the dependence of SEI elasticity on its structure and composition of compounds.17 These experimental results have revealed that the inner layer contains considerably more of the stiff species than the outer layer does. The measured Young’s moduli are mainly in the range of 0.2–4.5 GPa, while some values above 80 GPa are also observed. Such wide variation was elucidated by atomistic calculations, where significant differences in the SEI elastic properties were obtained among organic/polymeric and inorganic components of the SEI layer.17 The calculation results showed that the Young’s moduli range from 2.4 to 58.1 GPa in the order of the polymeric, organic, and amorphous inorganic components. The crystalline inorganic component (LiF) shows the highest value (135.3 GPa) among the SEI species.17 In addition, the elasticity of ordered and amorphous organic layers was studied using Monte Carlo (MC) and molecular dynamics (MD) simulation.18,19 The bulk modulus was calculated at 393 K and was estimated to be about 7 and 7.1 GPa, while the shear modulus was estimated to be about 1.7 and 2.7 GPa for ordered and amorphous Li2BDC layers, respectively.18 The bulk and shear modulus of the inorganic Li2CO3 were estimated about 27 and 8 GPa at room temperature.19
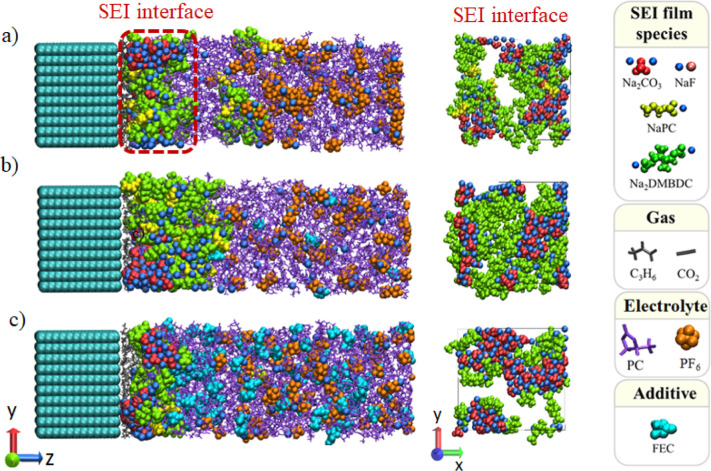
In this article, the mechanical stability of the SEI layer will be investigated. For that, the conventional electrolyte based on NaPF6 salt and fluoroethylene carbonate (FEC) additives in propylene carbonate (PC)-based electrolyte solution will be considered. In fact, previous experimental studies showed that the addition of FEC molecules significantly enhances the capacity and cyclability of NIBs, with an optimal performance that is sensitive at a low concentration.20,21 Theoretically, major advances were done to SEI layer modeling in order to elucidate the microscopic effect of the FEC additive.22−25 Using reactive force field–molecular dynamics (ReaxFF-MD) simulations and density functional theory calculations, Wang et al. investigated the initial process of SEI formation and showed that FEC decomposition generates lithium fluoride (LiF) and vinylene carbonate (VC), which could be regarded as important electrolyte additives to improve battery performance.22 Furthermore, Wu et al. performed a hybrid ab initio and reactive force field (HAIR) method to provides a critical information about the initial reduction mechanism of FEC-added electrolytes. HAIR simulations resulted in FEC molecules to be decomposed quickly to build LiF as the major component of the inner layer of the inorganic SEI, which has been demonstrated to protect the Li-metal anode.23 In our group, the microscopic effect of the FEC additive on SEI layer formation has been successfully studied using the Red Moon (RM) methodology,24,25 by analyzing the aggregation process of electrolyte reduction products.26−30Figure 1 shows the obtained SEI layers using RM simulations at 0.0, 1.0, and 10.0 vol % of the FEC additive. Various properties, such as porosity, dissolution, and aggregation of SEI layer products, which strongly influence the SEI layer stability, could be considered in the RM simulation.26−30 Consequently, both microscopic effects, positive and negative, were revealed at low and high concentrations of FEC, respectively. In addition to the role of FEC decomposition in forming a NaF-rich SEI film, it was certified that intact FECs play a significant role in suppressing the dissolution to form a compact and stable SEI film. However, the increase in FEC concentration suppressed the organic dimer formation by reducing the collision frequency between the monomer products during the SEI film formation processes.27 Nonetheless, compatible with the chemical aspect of the SEI layer, knowledge of the mechanical properties are also inevitable for obtaining a stable SEI. Thus, the present study will investigate, for the first time, the mechanical properties of SEI films depending on the FEC concentration by using theoretically prepared SEI layer structures themselves.
Figure 1.
Typical snapshots of SEI layers formed in NaPF6/PC electrolyte solutions at (a) 0.0, (b) 1.0, and (c) 10.0 vol % of FEC concentration.27
2. Models and Theoretical Treatments
We investigated the mechanical properties and the composition effect through the microscopic analysis of the SEI layers obtained computationally by RM simulations at five different FEC concentrations, that is, 0.0, 1.0, 3.0, 5.0, and 10.0 vol %.27 For that purpose, we extracted only the SEI film compounds from all the compounds included in the whole rectangular simulation cell, without the electrolyte compounds (no liquid portion in the “extracted” SEI structure). Thus, the investigated SEI film structures were composed of Na2CO3, NaPC, Na2DMBDC, and NaF products.27 For those structures, each extracted structure was electrically neutralized by removing the excess cations/anions located at the longest distance from the anode surface and subjected to geometry optimization under the NPT condition at 300 K.
MD simulations were performed by LAMMPS (large-scale atomic/molecular massively parallel simulator)31 using the generalized AMBER force field (GAFF).32 Uniaxial and shear deformations with a strain rate of 7.5 × 10⁻⁴ ps–1 were applied 2000 times under the NVT condition. The slab model was adopted using the shrink-wrapped boundary condition along the z-axis (Figure 1), where the position of the face was set so as to encompass the atoms in that dimension. The present simulations were performed under 300 K by using 20 different initial configurations of the SEI layer, and the standard errors were estimated with the two-sided 95% confidence interval.
We adopted the mechanical analysis based on the generalized Hooke’s law33
| 1 |
where σ and ε are the stress and the strain tensor, respectively, described as the second-order 3 by 3 tensors
 |
2 |
where σαβ and εμν are the components of σ and ε, respectively, denoting the elastic tensor C, a fourth-rank tensor Cαβμν, with α, β, μ, and ν representing the Cartesian coordinates x, y, and z. Because of the symmetricity of σ and ε, the Voigt notation is used to reduce their order and simplifies the notations. Then, by representing pairs of indices ij written as singlets, with xx = 1, yy = 2, zz = 3, yz = 4, zx = 5, and xy = 6, σ and ε can be written as vectors with six components, and C as a 6 by 6 matrix. Thus, the generalized Hooke’s law is simply written as
| 3 |
using also the implicit sum convention with j = 1 to 6 and ε4 = 2εyz, ε5 = 2εxz, and ε6 = 2εxy. The Voigt notations will be used throughout this study, assuming that σi is the stress matrix along the i-axis and εj is the deformation along the j-axis. For the computation of σi, we used the following expression from a previous theoretical study of the stress value that can be expressed as a function of strain energy stored by a system undergoing deformation via the strain εi34
| 4 |
where V is the volume of the simulation box and U is the potential energy of the whole SEI layer. The elastic constants Cij then were obtained using the derivative of eq 4 concerning εj
| 5 |
Taking into account the anisotropic characteristic of the SEI film structure, all elastic constants were calculated using the bulk (B) and shear (G) moduli according to the Voigt formula35
 |
6 |
 |
7 |
Then, the equivalent Young’s modulus (E) was derived from B and G according to the following relation36
| 8 |
3. Results and Discussion
To explore the SEI film stability depending on the FEC concentration, the atomic potential energies epot, eintra, and einter were evaluated.27 The total potential energy Epot includes the intramolecular interaction energy Eintra and the nonbonding intermolecular interaction energy Einter.32 The former consists of bond length, bond angle, and dihedral angle energies.30 Then
| 9 |
where N is the total number of atoms in the extracted part of the SEI film.
First, among various characteristic evaluation functions, taking the above atomic potential energies as the descriptors, Figure 2 shows the FEC concentration dependences of the atomic potential energies of the organic and inorganic components and the total SEI layer averaged over 20 samples, that is, epot (organic), epot (inorganic), and epot (SEI), respectively. So far, for the organic SEI film (NaPC and Na2DMBDC), Figure 2a shows that epot (organic) takes a minimum at 1.0 vol % concentration of the FEC additive, showing the highest energetic stability of the organic SEI portion at a lower FEC concentration. Then, by increasing the FEC concentration, epot (organic) increases, meaning the organic SEI layer becomes energetically unstable.27 However, Figure 2b shows an opposite tendency that epot (inorganic), that is, epot of the inorganic SEI components (NaF and Na2CO3), takes a maximum at 1.0–3.0 vol % of the FEC additive concentration, showing the lowest energetic stability around 1.0 vol % of the FEC concentration. Then, epot (inorganic) decreases as the FEC concentration increases, meaning that the inorganic SEI layer becomes more energetically stable. This should be due to the lowest production of NaF and Na2CO3 around 1.0 vol % concentration of the FEC additive, as was previously reported by Bouibes et al. (check Table 1 of ref (27)). Furthermore, Figure 2c shows that epot of the total SEI film also takes a maximum at 1 vol % of the FEC concentration. This is because the inorganic products on the whole SEI film contribute more significantly to the total energetic stability.
Figure 2.
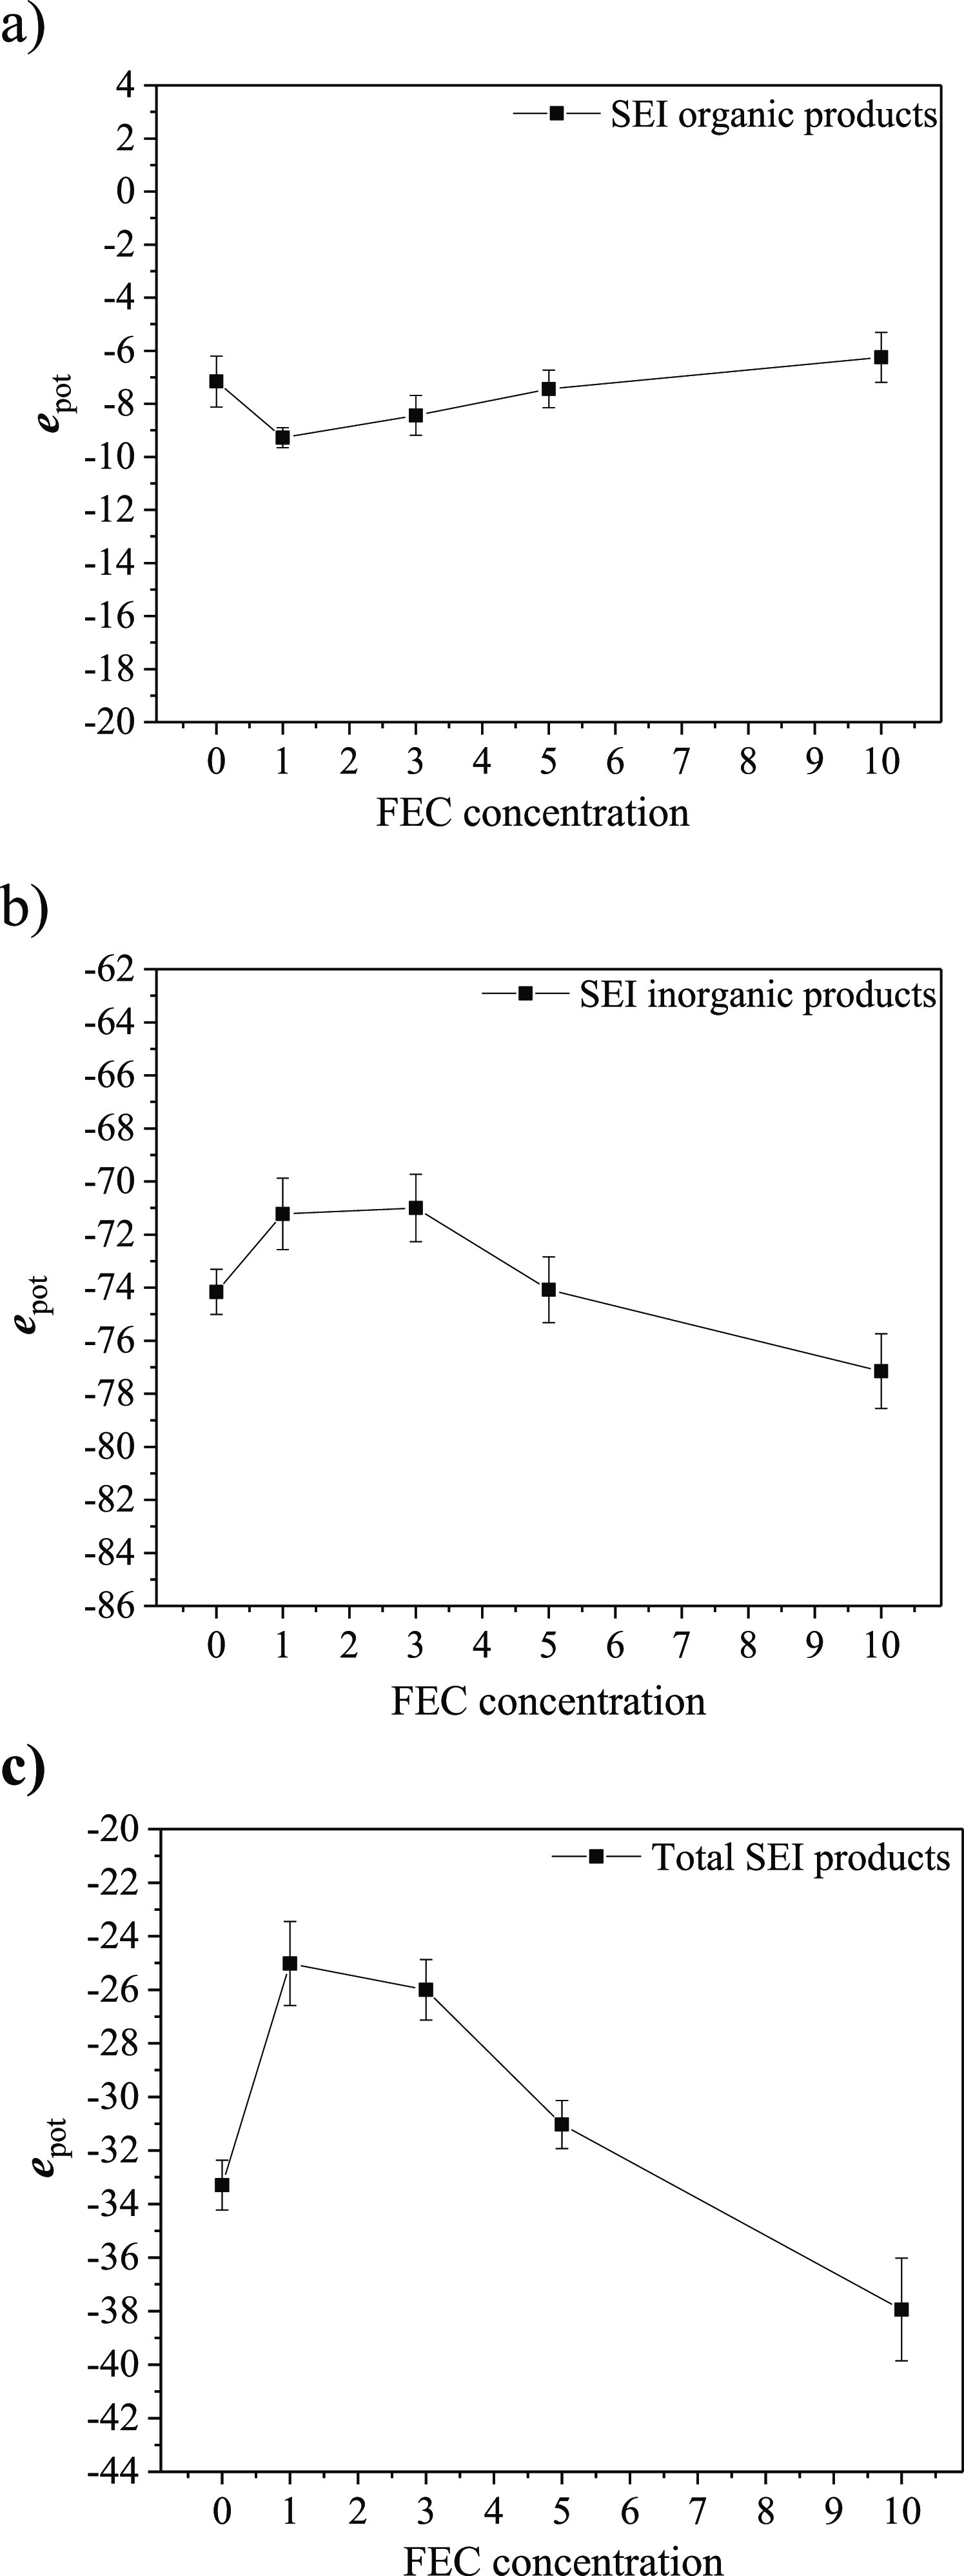
Averaged potential energies over 20 samples of the obtained SEI films at 0.0, 1.0, 3.0, 5.0, and 10.0 vol % of FEC concentration, (a) for organic products, (b) for inorganic products, and (c) for the whole SEI products, that is, epot (organic), epot (inorganic), and epot (SEI), respectively.
Table 1. Averaged Elastic Constants of the Obtained SEI Films at 0.0, 1.0, 3.0, 5.0, and 10.0 vol % of FEC Concentration: C11, C22, and C33 for Longitudinal Expansion; C23, C31, and C12 for Transversal Compression; and C44, C55, and C66 for Shear Deformation.
| FEC
concentration (vol %) |
|||||
|---|---|---|---|---|---|
| Cij (GPa) | 0.0 | 1.0 | 3.0 | 5.0 | 10.0 |
| C11 | 15.68 ± 1.07 | 23.00 ± 1.03 | 22.21 ± 0.98 | 19.69 ± 1.00 | 16.79 ± 0.92 |
| C22 | 15.14 ± 1.04 | 21.29 ± 0.99 | 20.34 ± 0.95 | 18.97 ± 0.99 | 15.73 ± 0.89 |
| C33 | 10.09 ± 1.01 | 16.96 ± 0.95 | 12.25 ± 0.97 | 12.88 ± 1.01 | 11.11 ± 0.90 |
| C23 | 5.80 ± 0.75 | 8.93 ± 0.73 | 8.03 ± 0.68 | 7.57 ± 0.67 | 6.89 ± 0.57 |
| C31 | 5.79 ± 0.77 | 9.18 ± 0.75 | 8.39 ± 0.66 | 7.74 ± 0.68 | 6.96 ± 0.57 |
| C12 | 8.85 ± 0.85 | 11.28 ± 0.79 | 10.47 ± 0.75 | 9.66 ± 0.77 | 9.25 ± 0.70 |
| C44 | 1.83 ± 0.10 | 2.23 ± 0.19 | 2.14 ± 0.09 | 2.13 ± 0.17 | 1.98 ± 0.11 |
| C55 | 1.81 ± 0.09 | 2.13 ± 0.16 | 2.07 ± 0.12 | 2.04 ± 0.14 | 2.00 ± 0.08 |
| C66 | 7.42 ± 0.78 | 8.96 ± 0.73 | 8.71 ± 0.68 | 8.21 ± 0.70 | 7.67 ± 0.65 |
On the other hand, the experimental studies reveal that the porous organic layer covers most of the SEI film surface.37−39 Also, the stability of the SEI film is related to the skillful formation of the organic layer, which allows the cation transport at the electrode–electrolyte interface.40,41 Accordingly, in the following, we will resolve this seeming inconsistency by several theoretical arguments on how the organic porous layers play on the stability of the entire SEI layer.
Second, we have explored the structural stability of the SEI film by analyzing its mechanical properties as another descriptor. The uniaxial strain (along the x-, y-, and z-axes) and the shear strain (in the yz-, zx-, and xy-planes) were applied with a strain rate of 7.5 × 10⁻⁴ ps–1 in the NVT ensemble, and the corresponding stresses were calculated. The stress S of the entire system of atoms is in general obtained by the following formula42
| 10 |
where N is the number of atoms, kB is the Boltzmann constant, T is the temperature, V is the volume, and ri and fi are the position and force vector acting on atom i, respectively.
Figure 3 shows the smoothed curves of the stress evolution concerning the strain of the obtained SEI films at 0.0, 1.0, 3.0, 5.0, and 10.0 vol % FEC concentrations. We can remark from Figure 3a–i that the stress inside the SEI film is maximal at 1.0 vol % of the FEC additive. Three domains can be, in general, observed in the stress–strain curves. First, the elastic domain appears where the stress increases linearly concerning the strain, that is, the elastic domain. Second, a small plastic domain appears where the stress remains almost constant when the strain increases. Third, the rupture occurs in the domain where the stress decreases when the strain increases. Interestingly, we can clearly remark that the elastic domains are larger in Figure 3g,h for the shear deformations in the xz- and yz-planes, compared to those in the other figures.
Figure 3.
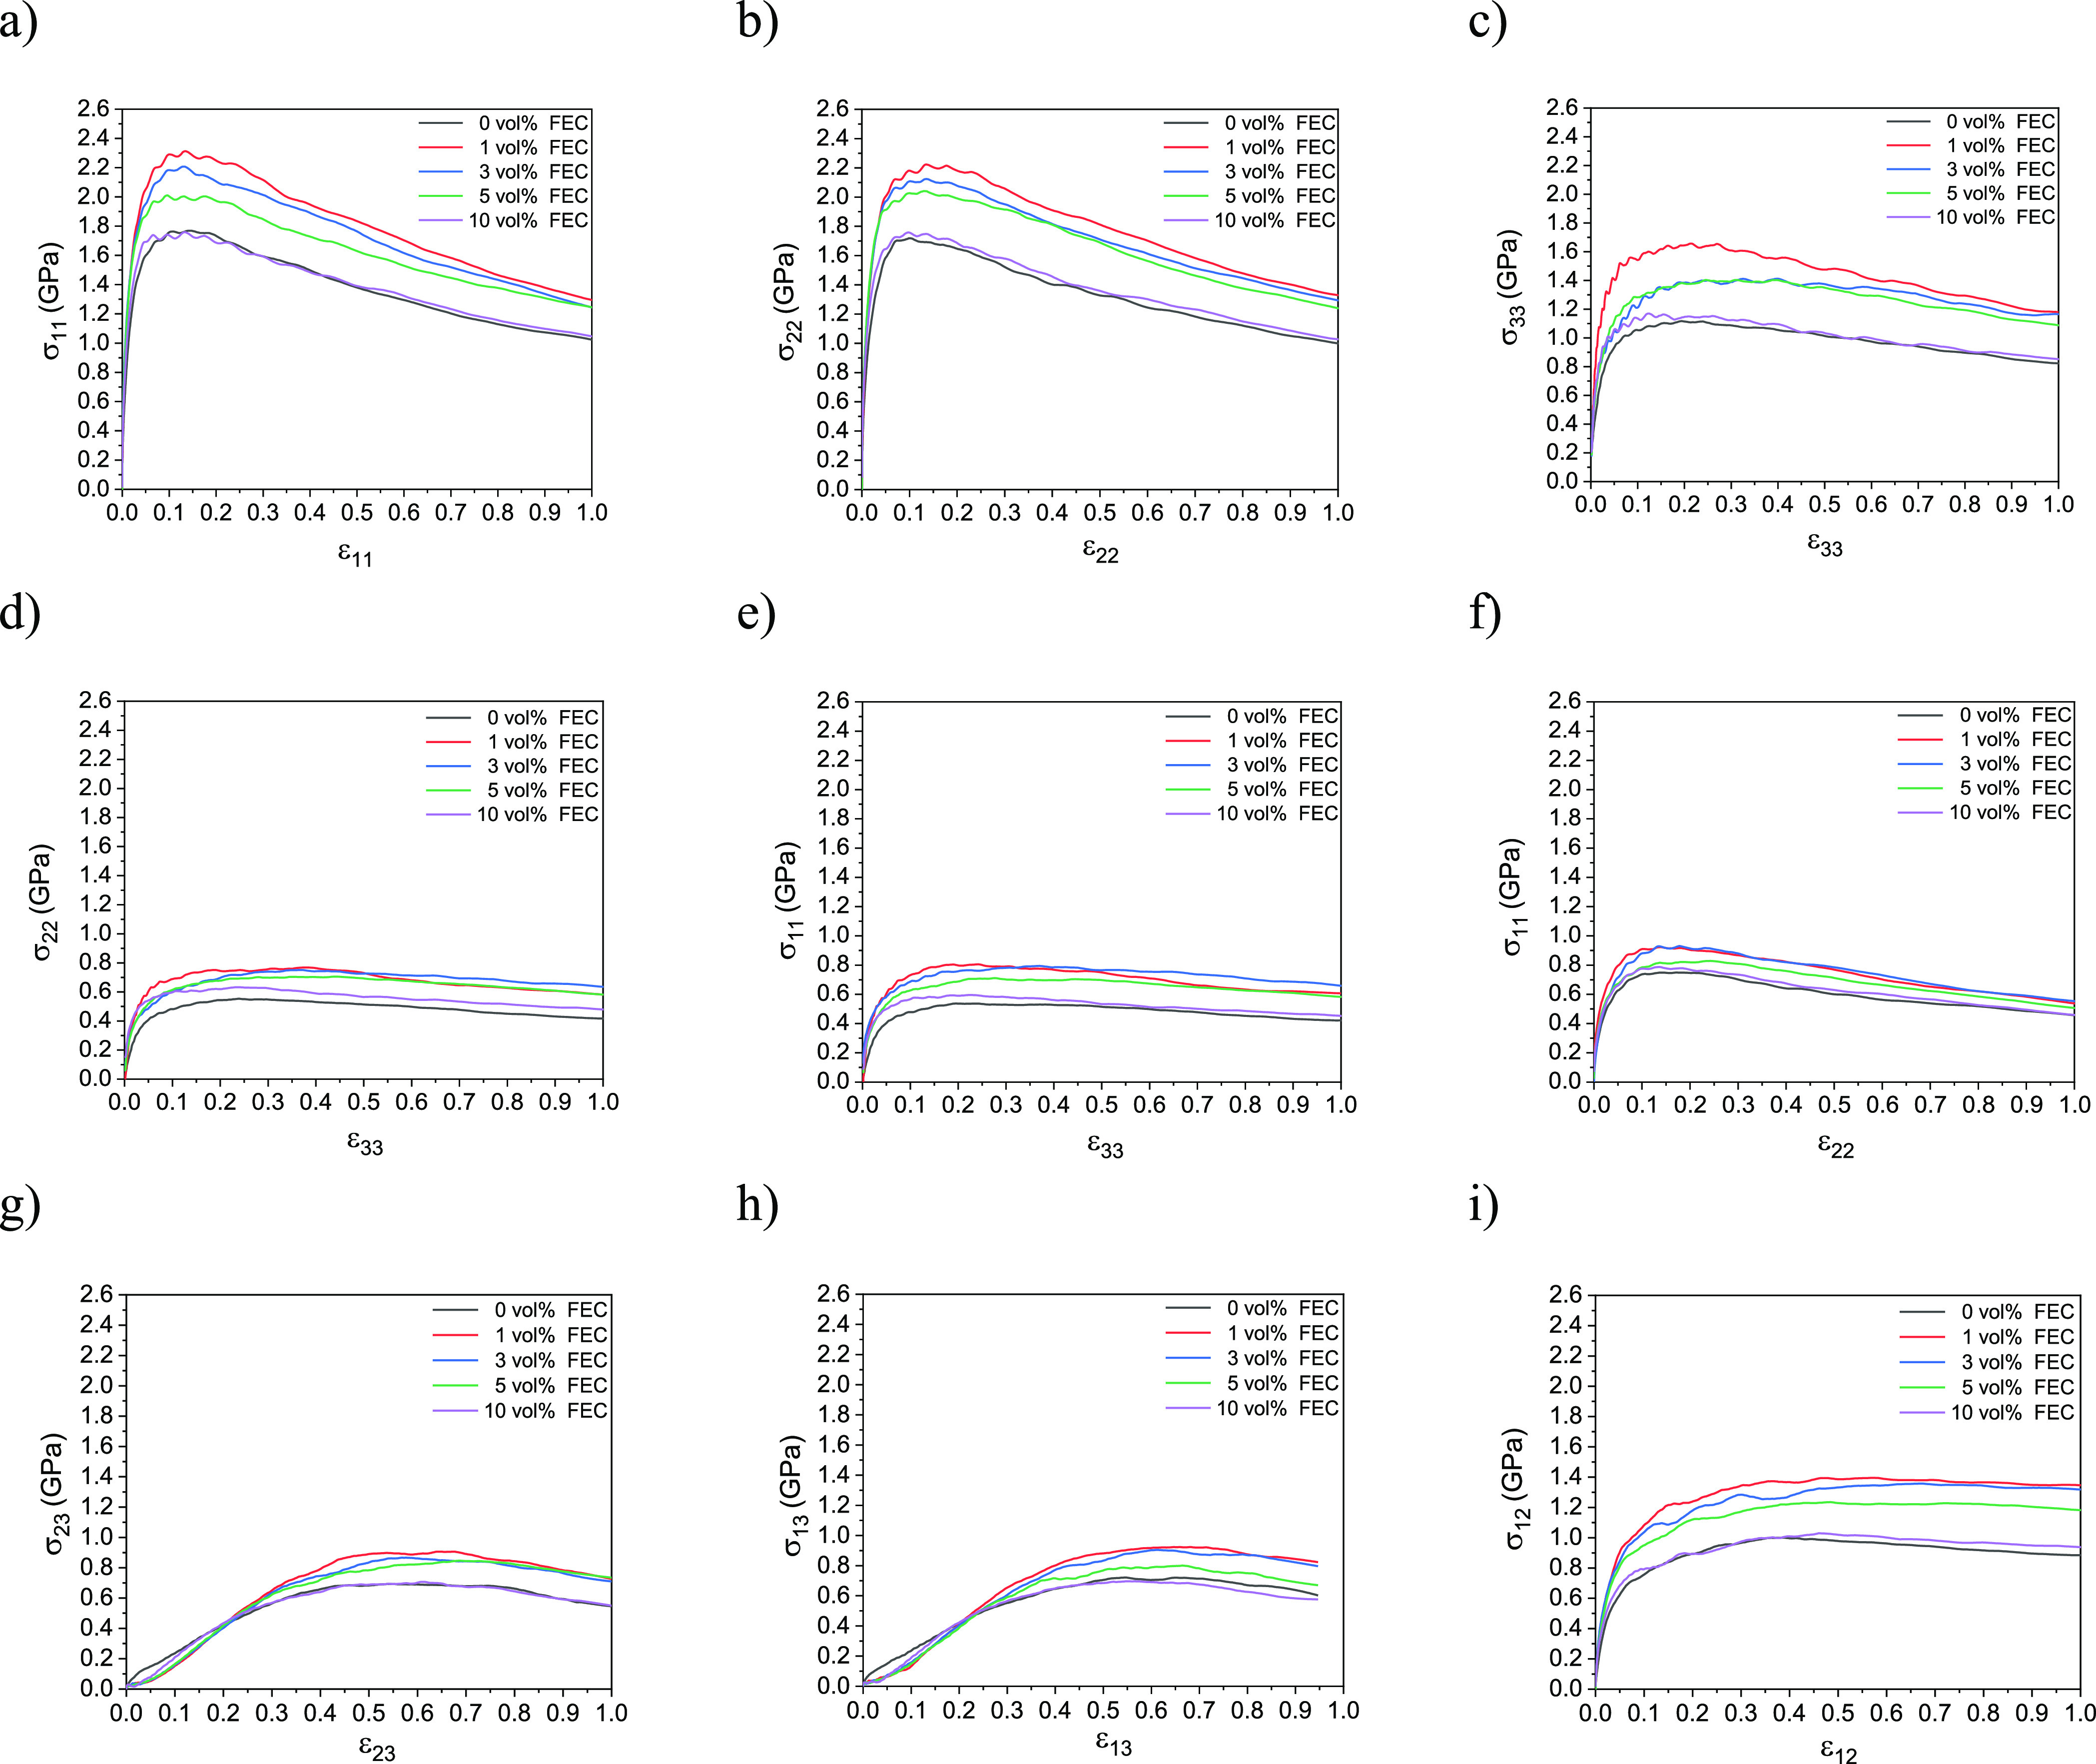
Stress–strain smoothed curves of the obtained SEI film structures at 0.0, 1.0, 3.0, 5.0, and 10.0 vol % of FEC concentrations. (a) C11, (b) C22, (c) C33, (d) C23, (e) C31, (f) C12, (g) C44, (h) C55, and (i) C66.
In the elastic domains, that is, the linear parts of the curves, we can evaluate 21 elastic constants Cij, that is, 21 elements of the elastic tensor C, from the gradients of the linear parts of the stress–strain curves. However, for those materials with the symmetry of orthogonal anisotropy, for example, the present model SEI film, only 9 independent elements of the elastic tensor, C11, C22, C33, C23, C31, C12, C44, C55, and C66, are retained since the remaining elements can be regarded as zero. Further, the present model SEI layer should show, in principle, the D2 symmetry along the z-axis direction; therefore, it holds that C11 = C22, C23 = C31, and C44 = C55. By considering the elastic domain up to 0.3 of strain in Figure 3g,h, while up to 0.1 of strain in the other figures, Table 1 summarizes the elastic constants averaged over 20 SEI films obtained at 0.0, 1.0, 3.0, 5.0, and 10.0 vol % FEC concentrations.
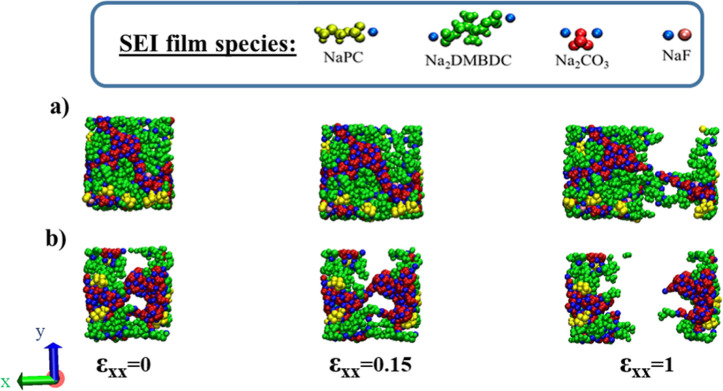
We notice that C11, C22, and C33 take the maxima at 1.0 vol % of the FEC concentration, while C11 and C22 are relatively larger than C33, meaning that the SEI film is more resistant to the longitudinal expansion along the x- and y-axes than along the z-axis. Figure 4a,b shows typical snapshots of the SEI films formed at 1.0 and 10.0 vol % FEC concentrations, respectively, under 0.0, 0.15, and 1.0 of the tensile strain along the x-axis. We can observe that rupture occurs starting at the cavity. Our previous studies demonstrated that each cavity inside the SEI film is the smallest at a low FEC concentration, while it increases as the FEC concentration increases.27,30,37−41 Such results could explain that the SEI film becomes less resistant to the tensile strain if it is formed at a higher FEC concentration.
Figure 4.
Typical snapshots of the SEI film structures formed at (a) 1.0 and (b) 10.0 vol % of FEC concentrations under the tensile deformation along the x-axis.
Similarly, C23, C31, and C12 take the maxima at 1.0 vol % of the FEC additive, meaning the highest resistance to the transversal compression, while C12 is slightly larger than C23 and C31, so that the SEI film is more resistant to the transversal compression in the xy-plane than in the yz- and zx-planes, respectively.
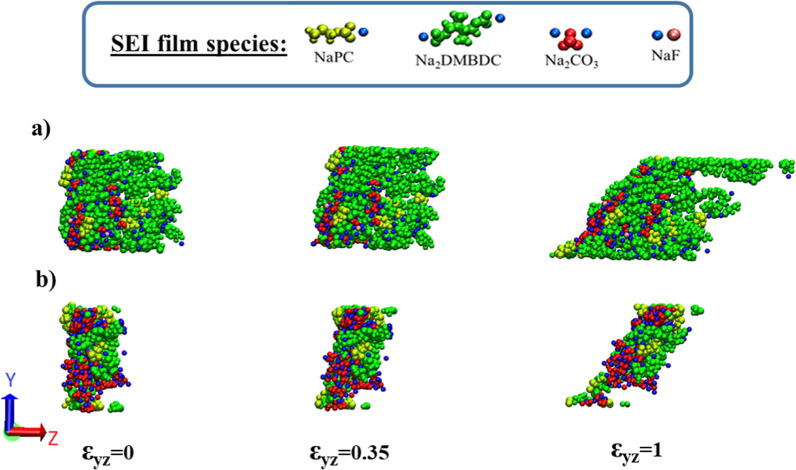
From Table 1, we can also find that C66 is larger than C44 and C55, meaning that the SEI structures are more resistant to the shear deformation in the xy-plane. Concerning the resistance against the shear deformation, C44, C55, and C66, each take a maximum at 1.0 vol % of FEC additive concentrations, showing the highest shear resistance at low FEC concentrations. Figure 5a,b each show three typical snapshots at 1.0 and 10.0 vol % FEC concentrations, respectively, under 0.0, 0.35, and 1.0 of the shear deformations in the yz-plane. It is intriguing that we can notice that the plastic domain in the shear deformation following yz- and zx-planes is larger than that in the other deformations, while the rupture occurs quickly in xy-plane shear and tensile deformations. This is due to the structural characteristic of the SEI layer that spreads to the x- and y-directions and is finite in thickness in the z-direction.
Figure 5.
Typical snapshots of the SEI film structures formed at (a) 1.0 and (b) 10.0 vol % of FEC concentrations under shear deformation in the yz-plane.
In Table 2, the calculated elastic quantities are summarized. We can understand that bulk (B) and shear (G) moduli take such values in the range of the same numerical order as that reported by the previous studies. In fact, according to the estimations that Bedrov et al. calculated for the main organic SEI compounds Li2DMBDC, the B moduli were about 7.1 and 7.0 GPa and the G moduli were about 2.7 and 1.7 GPa at their amorphous and ordered phases, respectively.18 On the other hand, they also reported that the B and G moduli of the inorganic compounds Li2CO3 were about 27 and 7 GPa, respectively.19 More importantly, as shown in Table 2, it was found, for the first time, that the present B and G moduli both take maximal values of 13.34 and 4.74 GPa, respectively, at an optimal value of 1.0 vol % FEC concentration.
Table 2. Averaged Bulk, Shear, and Young’s Moduli of the Obtained SEI Film Structures at 0.0, 1.0, 3.0, 5.0, and 10.0 vol % of FEC Concentrations.
| FEC
concentration (vol %) |
|||||
|---|---|---|---|---|---|
| Voigt moduli (GPa) | 0.0 | 1.0 | 3.0 | 5.0 | 10.0 |
| bulk modulus B | 9.09 ± 0.87 | 13.34 ± 0.73 | 12.07 ± 0.28 | 11.28 ± 0.78 | 9.98 ± 0.67 |
| shear modulus G | 3.58 ± 0.29 | 4.79 ± 0.31 | 4.44 ± 0.25 | 4.25 ± 0.29 | 3.70 ± 0.17 |
| Young’s modulus E | 9.49 ± 0.88 | 12.83 ± 0.94 | 11.88 ± 0.85 | 11.32 ± 0.83 | 9.88 ± 0.78 |
Young’s modulus (E), defined as the ratio of the tensile stress to the corresponding tensile strain, is often used to provide information about the measure of the stiffness of the solids. In Table 2, E moduli were additionally reported for the present SEI layers as functions of the FEC concentration, to also show maximal value of 11.79 GPa, meaning that the SEI film is the most stiff at 1.0 vol % FEC additive concentration. As the FEC concentration increases, E decreases to mean that the SEI structural stiffness decreases.
Finally, the hardness (H) was estimated using Vickers equation41
| 11 |
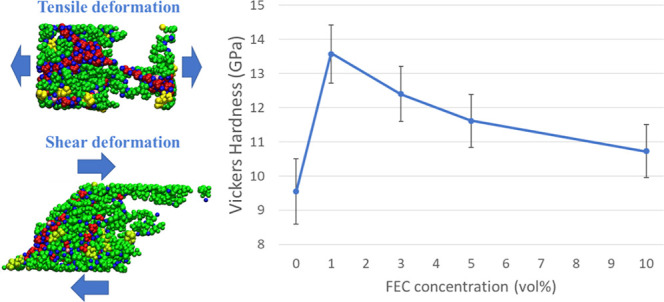
where k is the Pugh’s ratio,44 equal to G/B, and related to the ductile-brittle behavior of the SEI structure. It was reported that G/B is larger than 0.571 for generally brittle materials, whereas for the ductile ones, it is lower than 0.571.43Table 3 shows that the optimal H is sensitive to the lower FEC concentration, while H decreases as the FEC concentration increases. This is considered due to the fact that the cavity size inside SEI decreases at lower concentrations, leading to a denser structure of SEI layers. In other words, as the FEC concentration increases, the cavity size increases due to the decrease in the production of dimer products. Consequently, these above results are in excellent agreement with experimental ones20,30 and support rationally microscopic understanding of the mechanical stability of SEI structures depending on the FEC additive concentration.
Table 3. Averaged Vickers Hardness of the Obtained SEI Film Structures at 0.0, 1.0, 3.0, 5.0, and 10.0 vol % of FEC Concentrations.
| FEC
concentration (vol %) |
|||||
|---|---|---|---|---|---|
| 0.0 | 1.0 | 3.0 | 5.0 | 10.0 | |
| hardnessH (GPa) | 9.55 ± 0.95 | 13.57 ± 0.85 | 12.40 ± 0.81 | 11.61 ± 0.78 | 10.73 ± 0.77 |
Hence, the present study has shown that the mechanical stability of the SEI layer, determined by its topological properties such as the porosity and the thickness, is critical in the “stability” of the SEI layer, leading to enhancement of the capacity and cyclability of NIBs. In addition, we could understand that the energetic stability is not directly related to the “stability” of the SEI layer. This could be explained by the fact that each SEI layer is realized as one of the “free-energetically” stable structures produced from the SEI component assembly whose component ratio is decided independently by each FEC-added NaPF6/PC-based electrolyte. Then, the comparison of the energetic stability among them as a function of the FEC concentration could be said to be insignificant. We can say that this resembles the situation that the silica glass exists stably enough even though it is energetically more unstable than crystal silica. We could, therefore, resolve the seeming inconsistency regarding the energetic stability and conclude that the mechanical stability is unambiguously essential to the “stability” of NIBs.
4. Conclusions
In this study, we theoretically explored the mechanical stability of the SEI layers formed in 1.1 mol/L NaPF6/PC with five different concentrations of the FEC additive. Such various effects as the porosity, dissolution, and aggregation of organic and inorganic SEI products, which strongly influence the SEI layer stability, were able to be systematically considered. For the first time, it was demonstrated that, once each component value of the elastic moduli increases from that of the FEC-free SEI layer, it decreases by increasing the FEC concentration, meaning to take a maximum for the SEI layer at a concentration of 1.0 vol % of FEC. This observation shows that the SEI layer formed at relatively lower FEC concentrations is more resistant to tensile and shear deformations. Accordingly, the optimization of elastic moduli and hardness should be possible, even though sensitive due to the lower FEC concentrations. These results are in excellent agreement with the experimental ones, showing that adding a small amount of FEC molecules significantly enhances the capacity and cyclability of NIBs.20 This is considered due to the fact that the cavity size inside SEI decreases in the lower FEC concentrations, leading to a denser structure of SEI layers. These results reasonably support a microscopic understanding of SEI structures depending on the FEC additive concentration by their mechanical stability analysis executable by the RM simulation, even though the energetic stability seems to show inconsistent behavior. Finally, we believe that the present study contributes to establishing the theoretical predictability of designing a high-performance electrolyte for next-generation NIBs.
Acknowledgments
This work was supported in part by a Grant-in-Aid for Science Research from the Ministry of Education, Culture, Sport, Science and Technology (MEXT) in Japan and also by the MEXT programs “Elements Strategy Initiative for Catalysts and Batteries (ESICB)” (Grant Number JPMXP0112101003) and “Program for Promoting Researches on the Supercomputer Fugaku” (Fugaku battery & Fuel Cell Project) (grant number JPMXP1020200301) and additionally by a “Fugaku Small-Scale Project” (General Research Project: “Computational Chemical Study for Designing Polymer Materials toward Bond Formation and Cleavage Control”) (hp200325) from the Research Organization for Information Science and Technology (RIST). The calculations were partially performed using several computing systems at the Information Technology Center at Nagoya University and also at the Research Center for Computational Science at the Institute for Molecular Science, Okazaki, Japan.
The authors declare no competing financial interest.
References
- Arora P.; White R. E.; Doyle M. Capacity fade mechanisms and side reactions in lithium-ion batteries. J. Electrochem. Soc. 1998, 145, 3647. 10.1149/1.1838857. [DOI] [Google Scholar]
- Röder F.; Braatz R. D.; Krewer U. Multi-scale simulation of heterogeneous surface film growth mechanisms in lithium-ion batteries. J. Electrochem. Soc. 2017, 164, E3335 10.1149/2.0241711jes. [DOI] [Google Scholar]
- Xu K. Nonaqueous liquid electrolytes for lithium-based rechargeable batteries. Chem. Rev. 2004, 104, 4303–4418. 10.1021/cr030203g. [DOI] [PubMed] [Google Scholar]
- Xu K. Electrolytes and interphases in Li-ion batteries and beyond. Chem. Rev. 2014, 114, 11503–11618. 10.1021/cr500003w. [DOI] [PubMed] [Google Scholar]
- An S. J.; Li J.; Daniel C.; Mohanty D.; Nagpure S.; Wood D. L. III The state of understanding of the lithium-ion-battery graphite solid electrolyte interphase (SEI) and its relationship to formation cycling. Carbon 2016, 105, 52–76. 10.1016/j.carbon.2016.04.008. [DOI] [Google Scholar]
- Peled E.; Menkin S. SEI past, present and future. J. Electrochem. Soc. 2017, 164, A1703. 10.1149/2.1441707jes. [DOI] [Google Scholar]
- Wang A.; Kadam S.; Li H.; Shi S.; Qi Y. Review on modeling of the anode solid electrolyte interphase (SEI) for lithium-ion batteries. npj Comput. Mater. 2018, 4, 15. 10.1038/s41524-018-0064-0. [DOI] [Google Scholar]
- Zhang H. L.; Li F.; Liu C.; Tan J.; Cheng H. M. New insight into the solid electrolyte interphase with use of a focused ion beam. J. Phys. Chem. B 2005, 109, 22205–22211. 10.1021/jp053311a. [DOI] [PubMed] [Google Scholar]
- Deshpande R.; Verbrugge M.; Cheng Y.-T.; Wang J.; Liu P. Battery cycle life prediction with coupled chemical degradation and fatigue mechanics. J. Electrochem. Soc. 2012, 159, A1730–A1738. 10.1149/2.049210jes. [DOI] [Google Scholar]
- Zaban A.; Aurbach D. Impedance spectroscopy of lithium and nickel electrodes in propylene carbonate solutions of different lithium salts A comparative study. J. Power Sources 1995, 54, 289–295. 10.1016/0378-7753(94)02086-i. [DOI] [Google Scholar]
- Peled E.; Golodnitsky D.; Ardel G. Advanced model for solid electrolyte interphase electrodes in liquid and polymer electrolytes. J. Electrochem. Soc. 1997, 144, L208–L210. 10.1149/1.1837858. [DOI] [Google Scholar]
- Besenhard J. O.; Winter M.; Yang J.; Biberacher W. Filming mechanism of lithium-carbon anodes in organic and inorganic electrolytes. J. Power Sources 1995, 54, 228–231. 10.1016/0378-7753(94)02073-c. [DOI] [Google Scholar]
- Verma P.; Maire P.; Novák P. A review of the features and analyses of the solid electrolyte interphase in Li-ion batteries. Electrochim. Acta 2010, 55, 6332–6341. 10.1016/j.electacta.2010.05.072. [DOI] [Google Scholar]
- Dedryvere R.; Laruelle S.; Grugeon S.; Gireaud L.; Tarascon J. M.; Gonbeau D. XPS identification of the organic and inorganic components of the electrode/electrolyte interface formed on a metallic cathode. J. Electrochem. Soc. 2005, 152, A689–A696. 10.1149/1.1861994. [DOI] [Google Scholar]
- Xu W.; Vegunta S. S. S.; Flake J. C. Surface-modified silicon nanowire anodes for lithium-ion batteries. J. Power Sources 2011, 196, 8583–8589. 10.1016/j.jpowsour.2011.05.059. [DOI] [Google Scholar]
- Zhang J.; Wang R.; Yang X.; Lu W.; Wu X.; Wang X.; Li H.; Chen L. Direct observation of inhomogeneous solid electrolyte interphase on MnO anode with atomic force microscopy and spectroscopy. Nano Lett. 2012, 12, 2153–2157. 10.1021/nl300570d. [DOI] [PubMed] [Google Scholar]
- Shin H.; Park J.; Han S.; Sastry A. M.; Lu W. Component-/structure-dependent elasticity of solid electrolyte interphase layer in Li-ion batteries: Experimental and computational studies. J. Power Sources 2015, 277, 169–179. 10.1016/j.jpowsour.2014.11.120. [DOI] [Google Scholar]
- Bedrov D.; Borodin O.; Hooper J. B. Li+ transport and mechanical properties of model solid electrolyte interphases (SEI): insight from atomistic molecular dynamics simulations. J. Phys. Chem. C 2017, 121, 16098–16109. 10.1021/acs.jpcc.7b04247. [DOI] [Google Scholar]
- Ebrahiminia M.; Hooper J. B.; Bedrov D. Structural, mechanical, and dynamical properties of amorphous Li2CO3 from molecular dynamics simulations. Crystals 2018, 8, 473. 10.3390/cryst8120473. [DOI] [Google Scholar]
- Dahbi M.; Nakano T.; Yabuuchi N.; Fujimura S.; Chihara K.; Kubota K.; Son J. Y.; Cui Y. T.; Oji H.; Komaba S. Effect of Hexafluorophosphate and Fluoroethylene Carbonate on Electrochemical Performance and the Surface Layer of Hard Carbon for Sodium-Ion Batteries. ChemElectroChem 2016, 3, 1856–1867. 10.1002/celc.201600365. [DOI] [Google Scholar]
- Zhao X.; Zhuang Q. C.; Xu S. D.; Xu Y. X.; Shi Y. L.; Zhang X. X. A new insight into the content effect of fluoroethylene carbonate as a film forming additive for lithium-ion batteries. Int. J. Electrochem. Sci. 2015, 10, 2515–2534. [Google Scholar]
- Wang Y.; Liu Y.; Tu Y.; Wang Q. Reductive decomposition of solvents and additives toward solid-electrolyte interphase formation in lithium-ion battery. J. Phys. Chem. C 2020, 124, 9099–9108. 10.1021/acs.jpcc.9b10535. [DOI] [Google Scholar]
- Wu Y.; Sun Q.; Liu Y.; Yu P.; Ma B.; Yang H.; Xie M.; Cheng T. Reduction Mechanism of Solid Electrolyte Interphase Formation on Lithium Metal Anode: Fluorine-Rich Electrolyte. J. Electrochem. Soc. 2022, 169, 010503. 10.1149/1945-7111/ac44bc. [DOI] [Google Scholar]
- Nagaoka M.; Suzuki Y.; Okamoto T.; Takenaka N. A hybrid MC/MD reaction method with rare event-driving mechanism: Atomistic realization of 2-chlorobutane racemization process in DMF solution. Chem. Phys. Lett. 2013, 583, 80–86. 10.1016/j.cplett.2013.08.017. [DOI] [Google Scholar]
- Nagaoka M.; Takayanagi M.; Takenaka N.; Suzuki Y.; Matsumoto K.; Koga N.; Karakkadparambil Sankaran S. K.; Uppula P.; Kitamura Y.. Molecular Technology; Yamamoto H., Kato T., Eds.; Wiley-VCH Verlag GmbH & Co. KGaA: Weinheim, Germany, 2019; Vol. 3, p 201. [Google Scholar]
- Takenaka N.; Sakai H.; Suzuki Y.; Uppula P.; Nagaoka M. A computational chemical insight into microscopic additive effect on solid electrolyte interphase film formation in sodium-ion batteries: suppression of unstable film growth by intact fluoroethylene carbonate. J. Phys. Chem. C 20152015, 119, 18046–18055. 10.1021/acs.jpcc.5b04206. [DOI] [Google Scholar]
- Bouibes A.; Takenaka N.; Fujie T.; Kubota K.; Komaba S.; Nagaoka M. Concentration effect of fluoroethylene carbonate on the formation of solid electrolyte interphase layer in sodium-ion batteries. ACS Appl. Mater. Interfaces 2018, 10, 28525–28532. 10.1021/acsami.8b07530. [DOI] [PubMed] [Google Scholar]
- Takenaka N.; Bouibes A.; Yamada Y.; Nagaoka M.; Yamada A. Frontiers in theoretical analysis of solid electrolyte interphase formation mechanism. Adv. Mater. 2021, 33, 2100574. 10.1002/adma.202100574. [DOI] [PubMed] [Google Scholar]
- Purushotham U.; Takenaka N.; Nagaoka M. Additive effect of fluoroethylene and difluoroethylene carbonates for the solid electrolyte interphase film formation in sodium-ion batteries: a quantum chemical study. RSC Adv. 2016, 6, 65232–65242. 10.1039/c6ra09560g. [DOI] [Google Scholar]
- Bouibes A.; Takenaka N.; Kubota K.; Komaba S.; Nagaoka M. Development of advanced electrolytes in Na-ion batteries: application of the Red Moon method for molecular structure design of the SEI layer. RSC Adv. 2022, 12, 971–984. 10.1039/d1ra07333h. [DOI] [PMC free article] [PubMed] [Google Scholar]
- Plimpton S. J. Fast parallel algorithms for short-range molecular dynamics. Comput. Phys. 1995, 117, 1–19. 10.1006/jcph.1995.1039. [DOI] [Google Scholar]
- Wang J. M.; Wolf R. M.; Caldwell J. W.; Kollman P. A.; Case D. A. Development and testing of a general amber force field. J. Comput. Chem. 2004, 25, 1157–1174. 10.1002/jcc.20035. [DOI] [PubMed] [Google Scholar]
- Hooke R.Lectures De Potentia Restitutiva, Or of Spring. Explaining the Power of Springing Bodies, 6th ed.: Royal Society: London, 1678. [Google Scholar]
- Landau L. D.; Lifshitz E. M.. Theory of Elasticity, Course of Theoretical Physics; Pergamon Press: London, 1959; Vol. 7. [Google Scholar]
- Simmons G., Wang H.. Single Crystal Elastic Constants and Calculated Aggregate Properties: a Handbook, 2nd ed.; The M.I.T. Press: Cambridge, Massachusetts, and London, 1971. [Google Scholar]
- Gray D. E., American Institute of Physics Handbook, 3rd ed.; McGraw-Hill: New York, 1972. [Google Scholar]
- Edström K.; Herstedt M.; Abraham D. P. A New Look at the Solid Electrolyte Interphase on Graphite Anodes in Li-Ion Batteries. J. Power Sources 2006, 153, 380–384. 10.1016/j.jpowsour.2005.05.062. [DOI] [Google Scholar]
- Peled E.; Menkin S. Review-SEI: Past, Present and Future. J. Electrochem. Soc. 2017, 164, A1703–A1719. 10.1149/2.1441707jes. [DOI] [Google Scholar]
- Agubra V. A.; Fergus J. W. The Formation and Stability of the Solid Electrolyte Interface on the Graphite Anode. J. Power Sources 2014, 268, 153–162. 10.1016/j.jpowsour.2014.06.024. [DOI] [Google Scholar]
- Takahashi K.; Srinivasan V. Examination of Graphite Particle Cracking as a Failure Mode in Lithium-Ion Batteries: a Model Experimental Study. J. Electrochem. Soc. 2015, 162, A635–A645. 10.1149/2.0281504jes. [DOI] [Google Scholar]
- Laresgoiti I.; Käbitz S.; Ecker M.; Sauer D. U. Modeling Mechanical Degradation in Lithium Ion Batteries during Cycling: Solid Electrolyte Interphase Fracture. J. Power Sources 2015, 300, 112–122. 10.1016/j.jpowsour.2015.09.033. [DOI] [Google Scholar]
- Hummer G.; Gro/nbech-Jensen N.; Neumann M. Pressure calculation in polar and charged systems using Ewald summation: Results for the extended simple point charge model of water. J. Chem. Phys. 1998, 109, 2791–2797. 10.1063/1.476834. [DOI] [Google Scholar]
- Chen X. Q.; Niu H.; Li D.; Li Y. Modeling hardness of polycrystalline materials and bulk metallic glasses. Intermetallics 2011, 19, 1275–1281. 10.1016/j.intermet.2011.03.026. [DOI] [Google Scholar]
- Pugh S. F. XCII Relations between the elastic moduli and the plastic properties of polycrystalline pure metals. Philos. Mag. 1954, 45, 823–843. 10.1080/14786440808520496. [DOI] [Google Scholar]


